
Strategic Advances in Efficient Chitin Extraction from Black Soldier Fly Puparia: Uncovering the Potential for Direct Chitosan Production

 ,
,
Abstract
1. Introduction
2. Materials and Methods
2.1. Insect Material and Chemicals
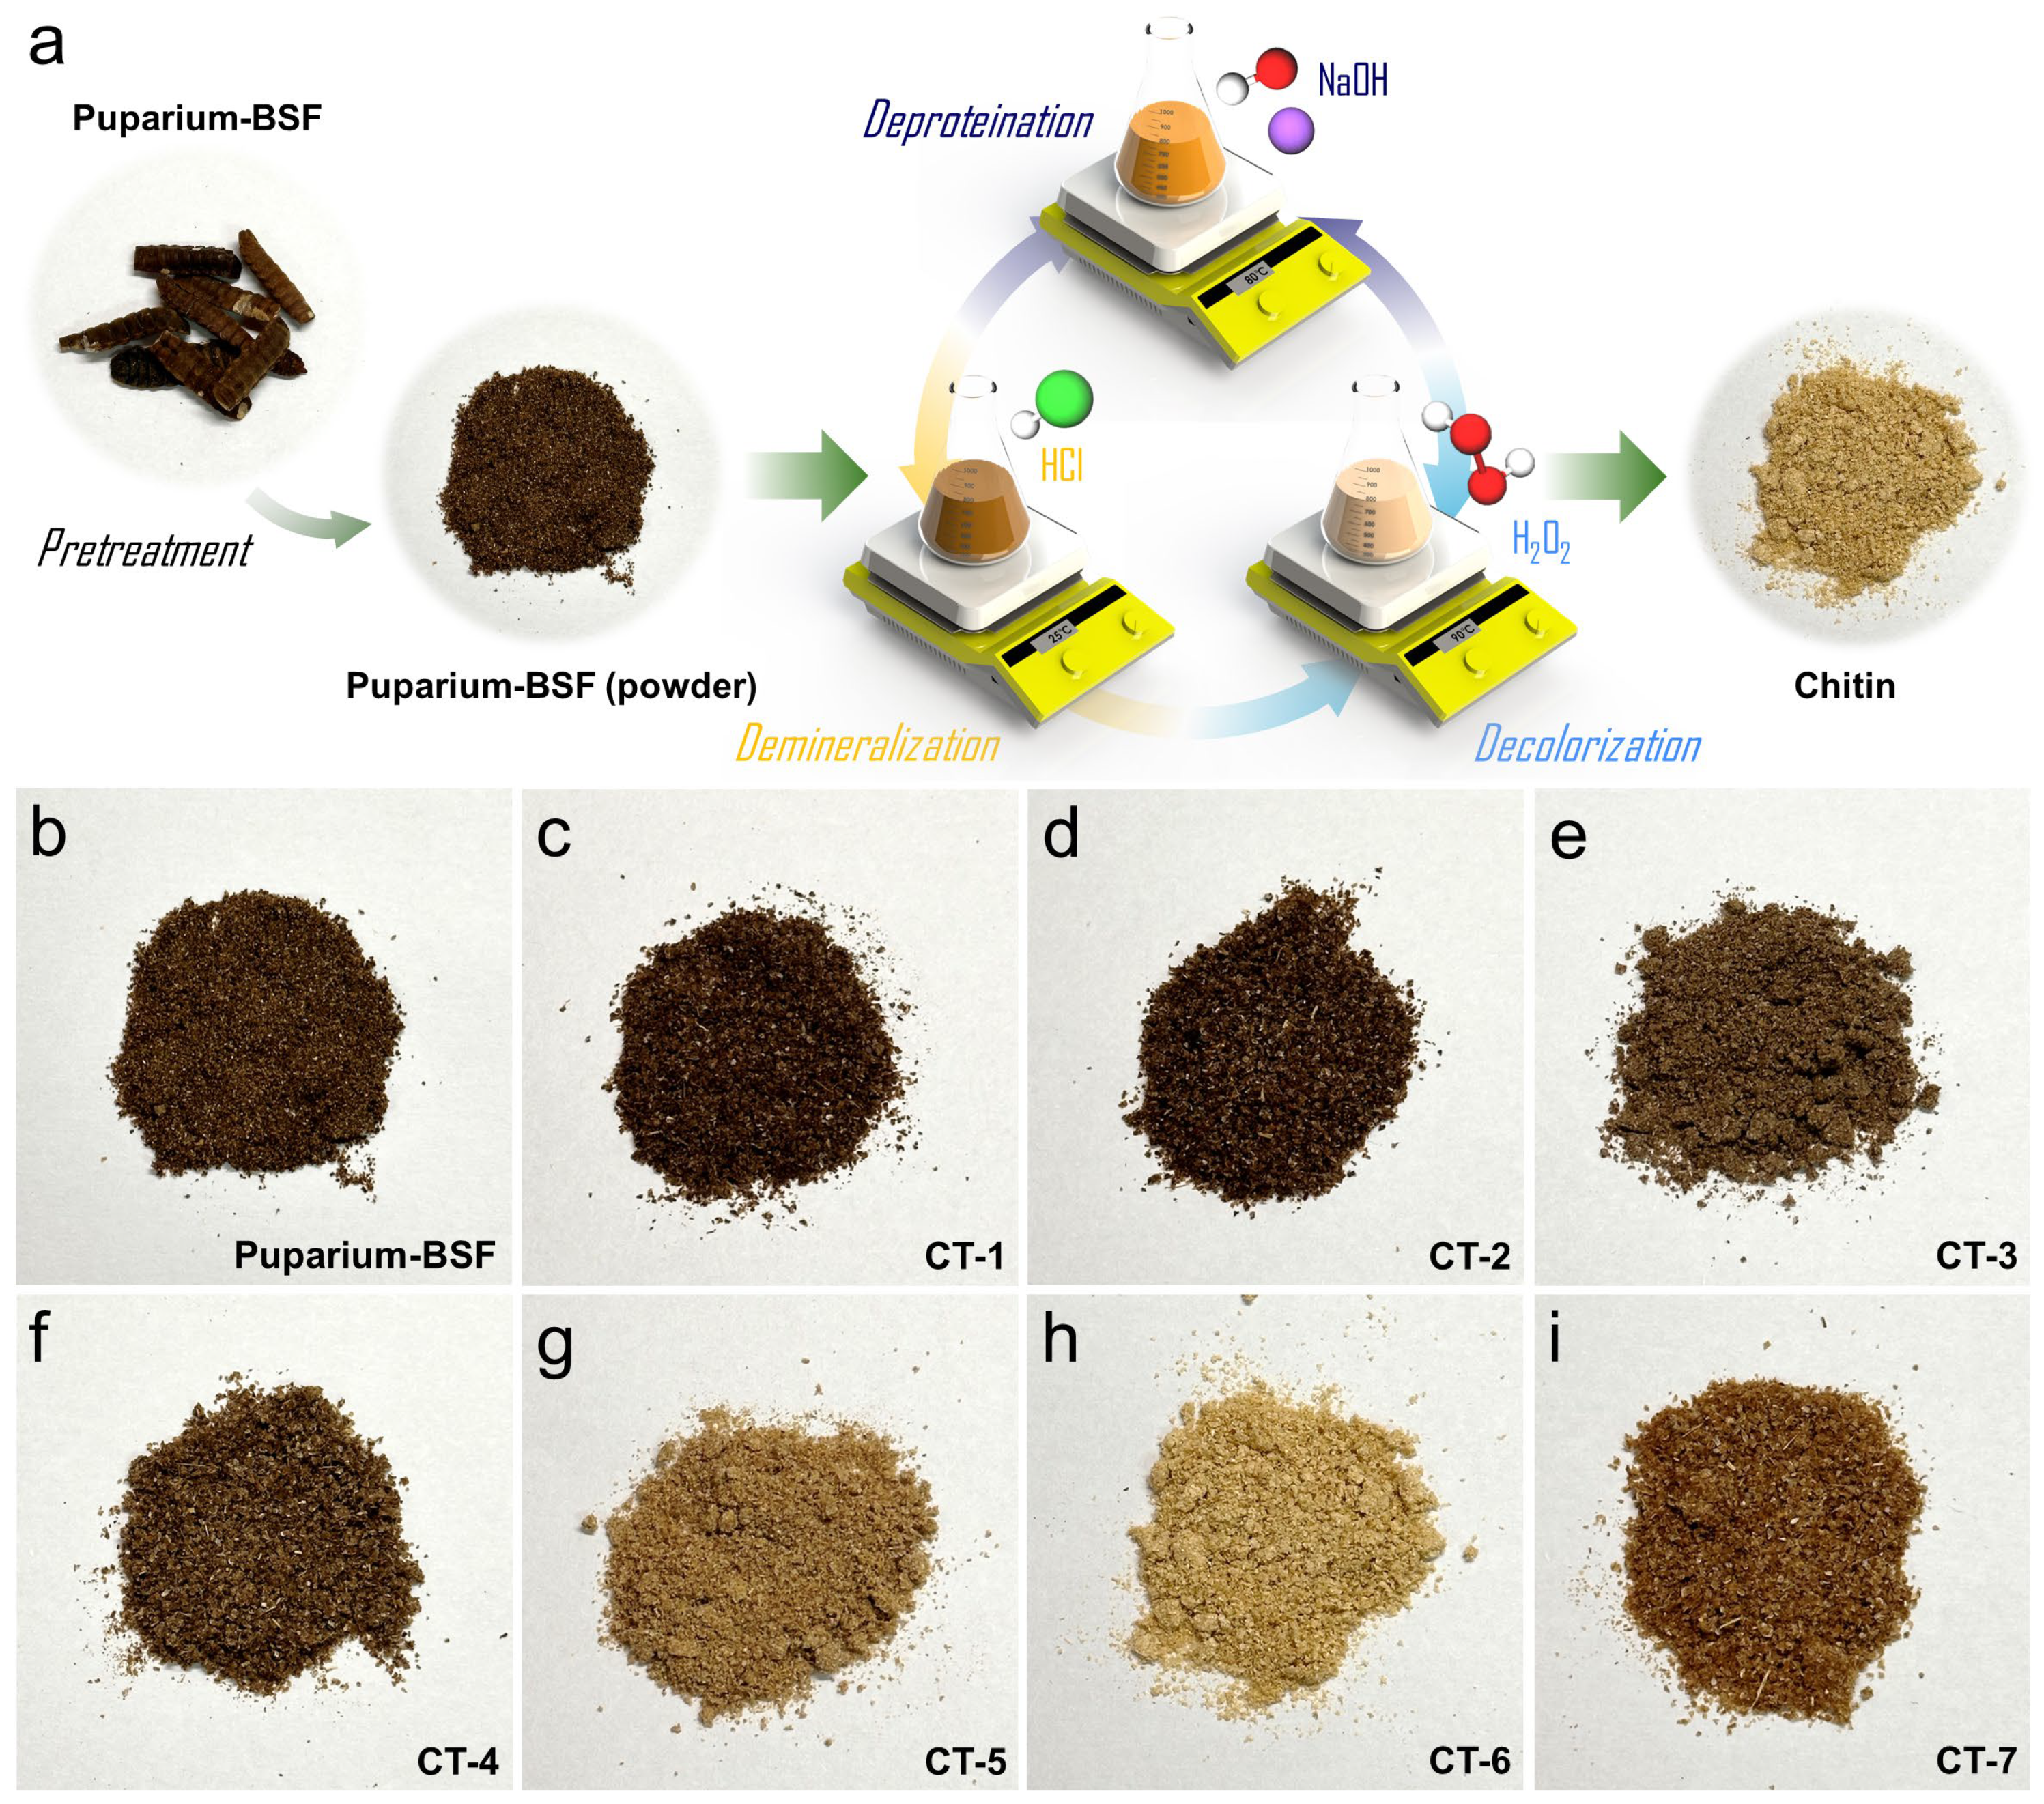
2.2. Chitin Extraction from BSF Puparium
2.3. Material Characterization
3. Results
3.1. Physicochemical Analysis of Chitin
3.1.1. Proximate Composition
3.1.2. Solubility, Intrinsic Viscosity, and Viscosity-Average Molecular Weight
3.2. Characterization
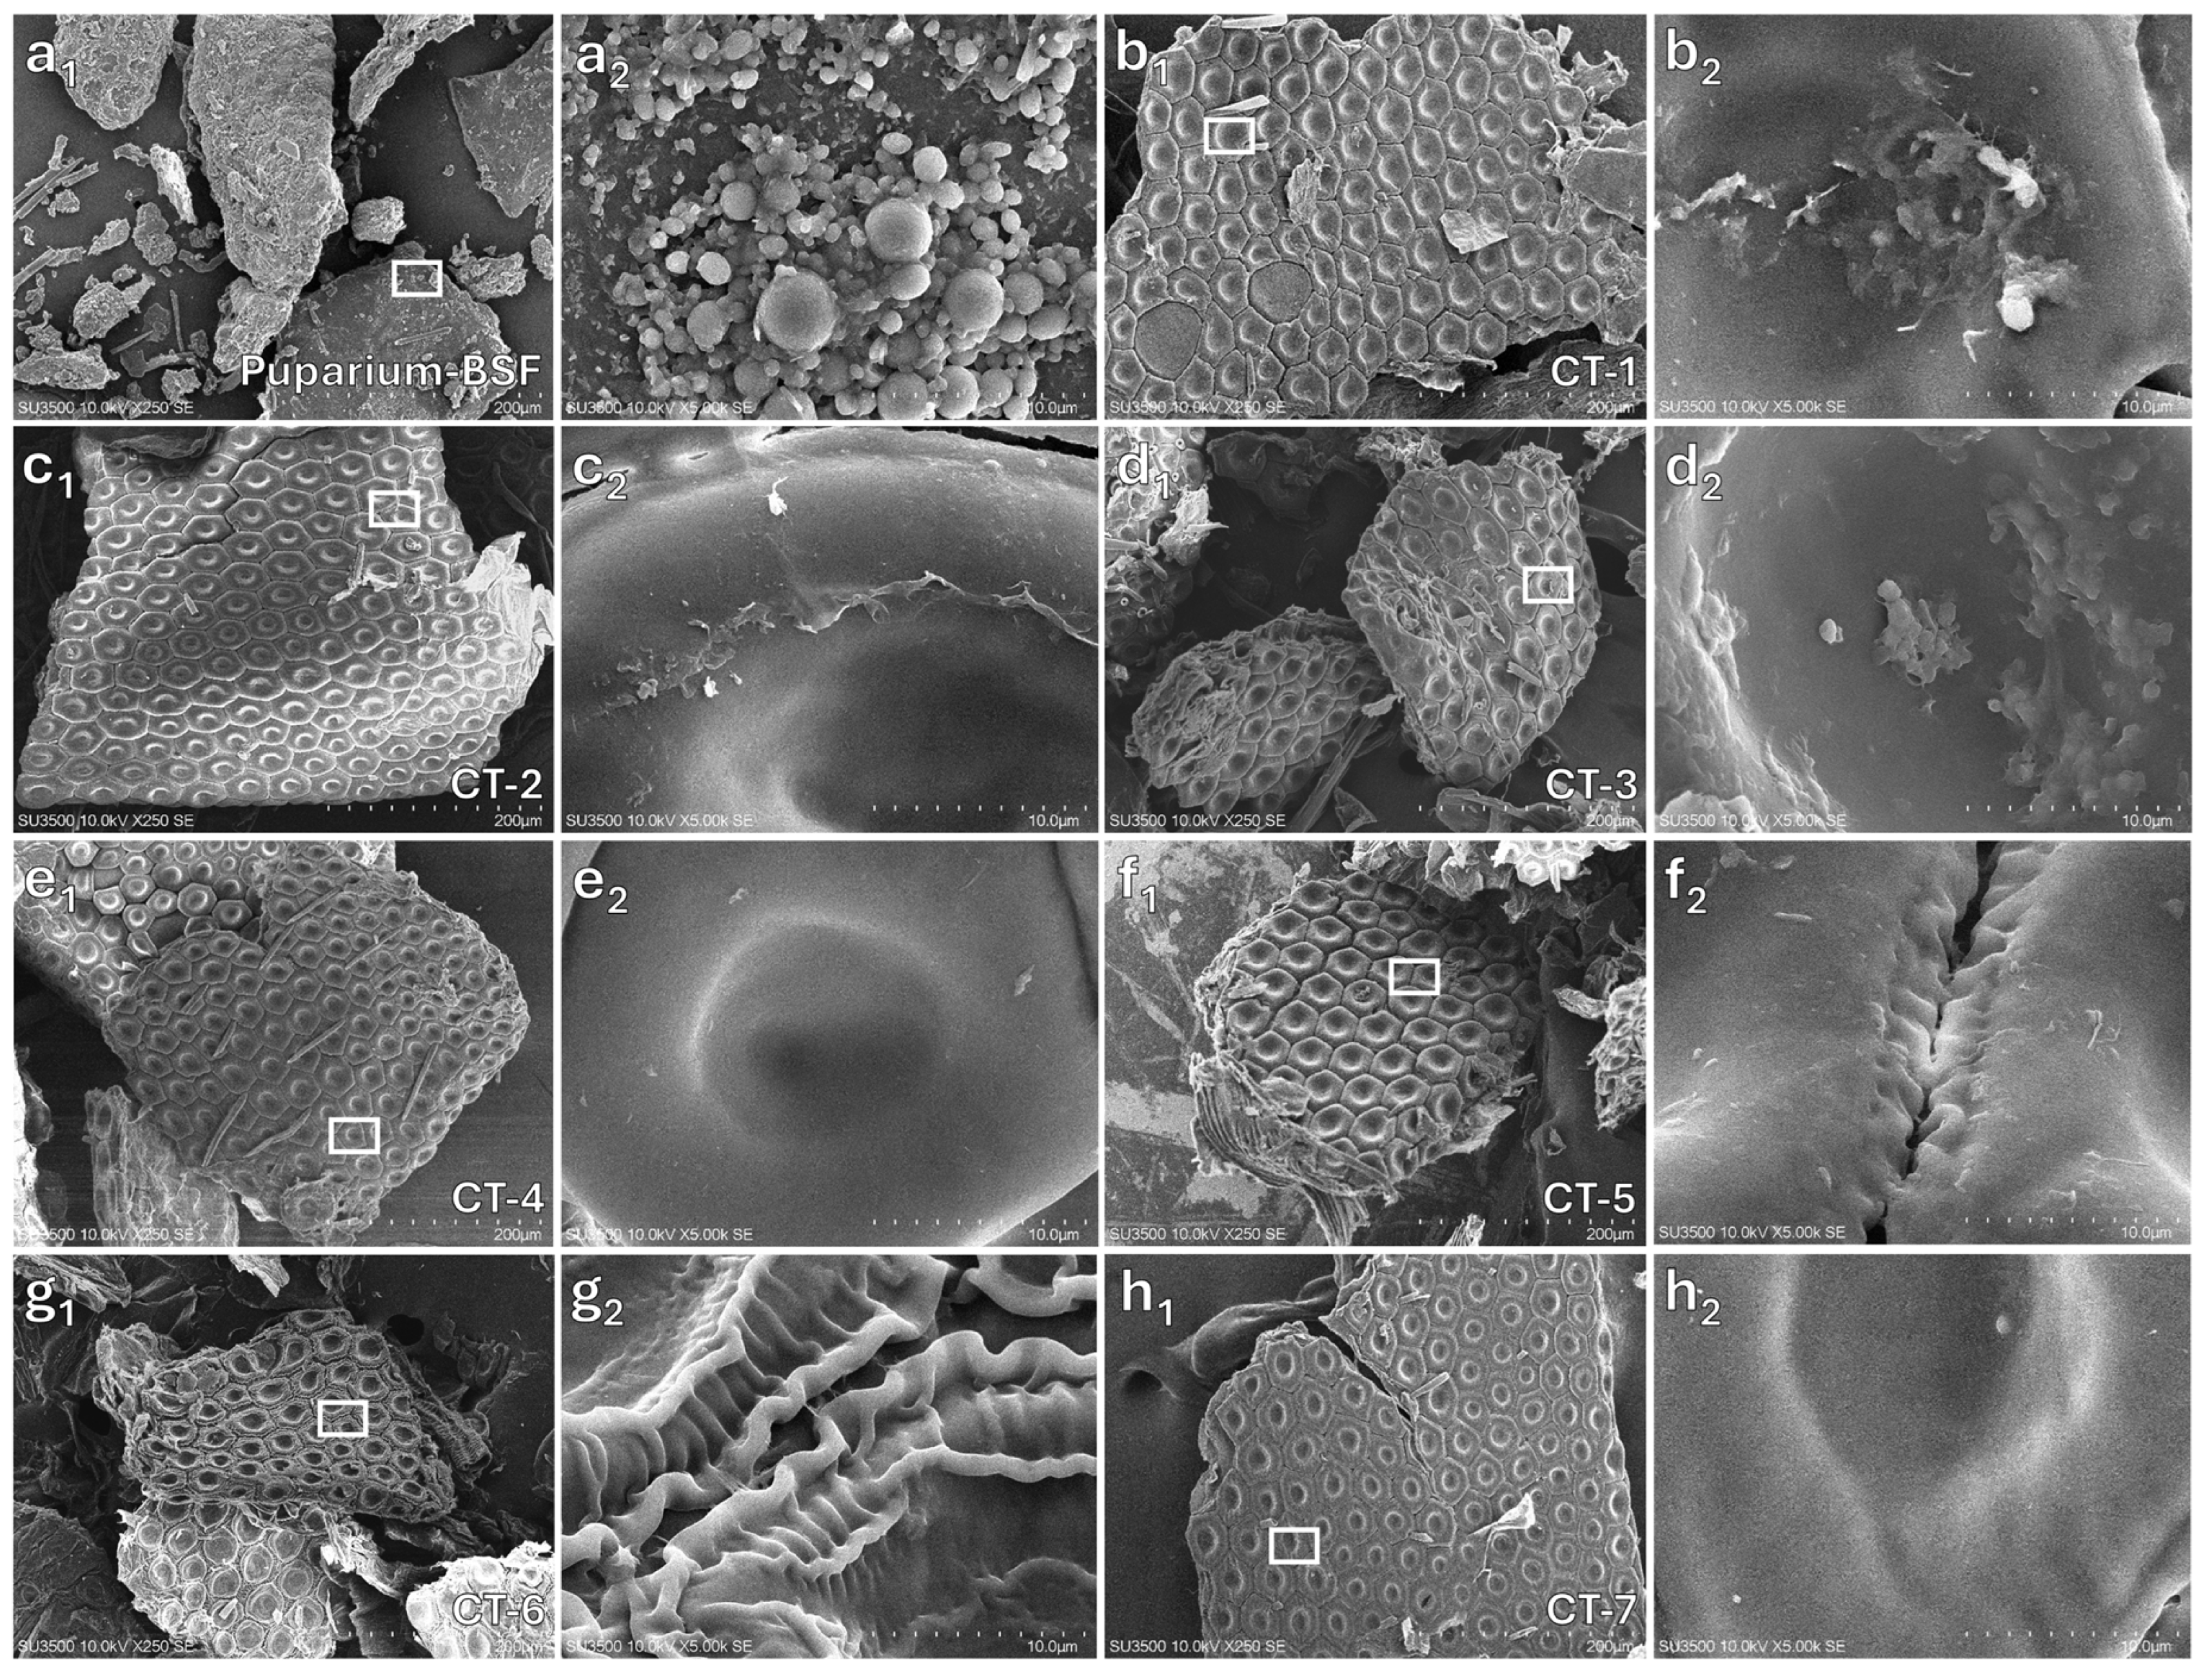
3.2.1. Surface Morphology
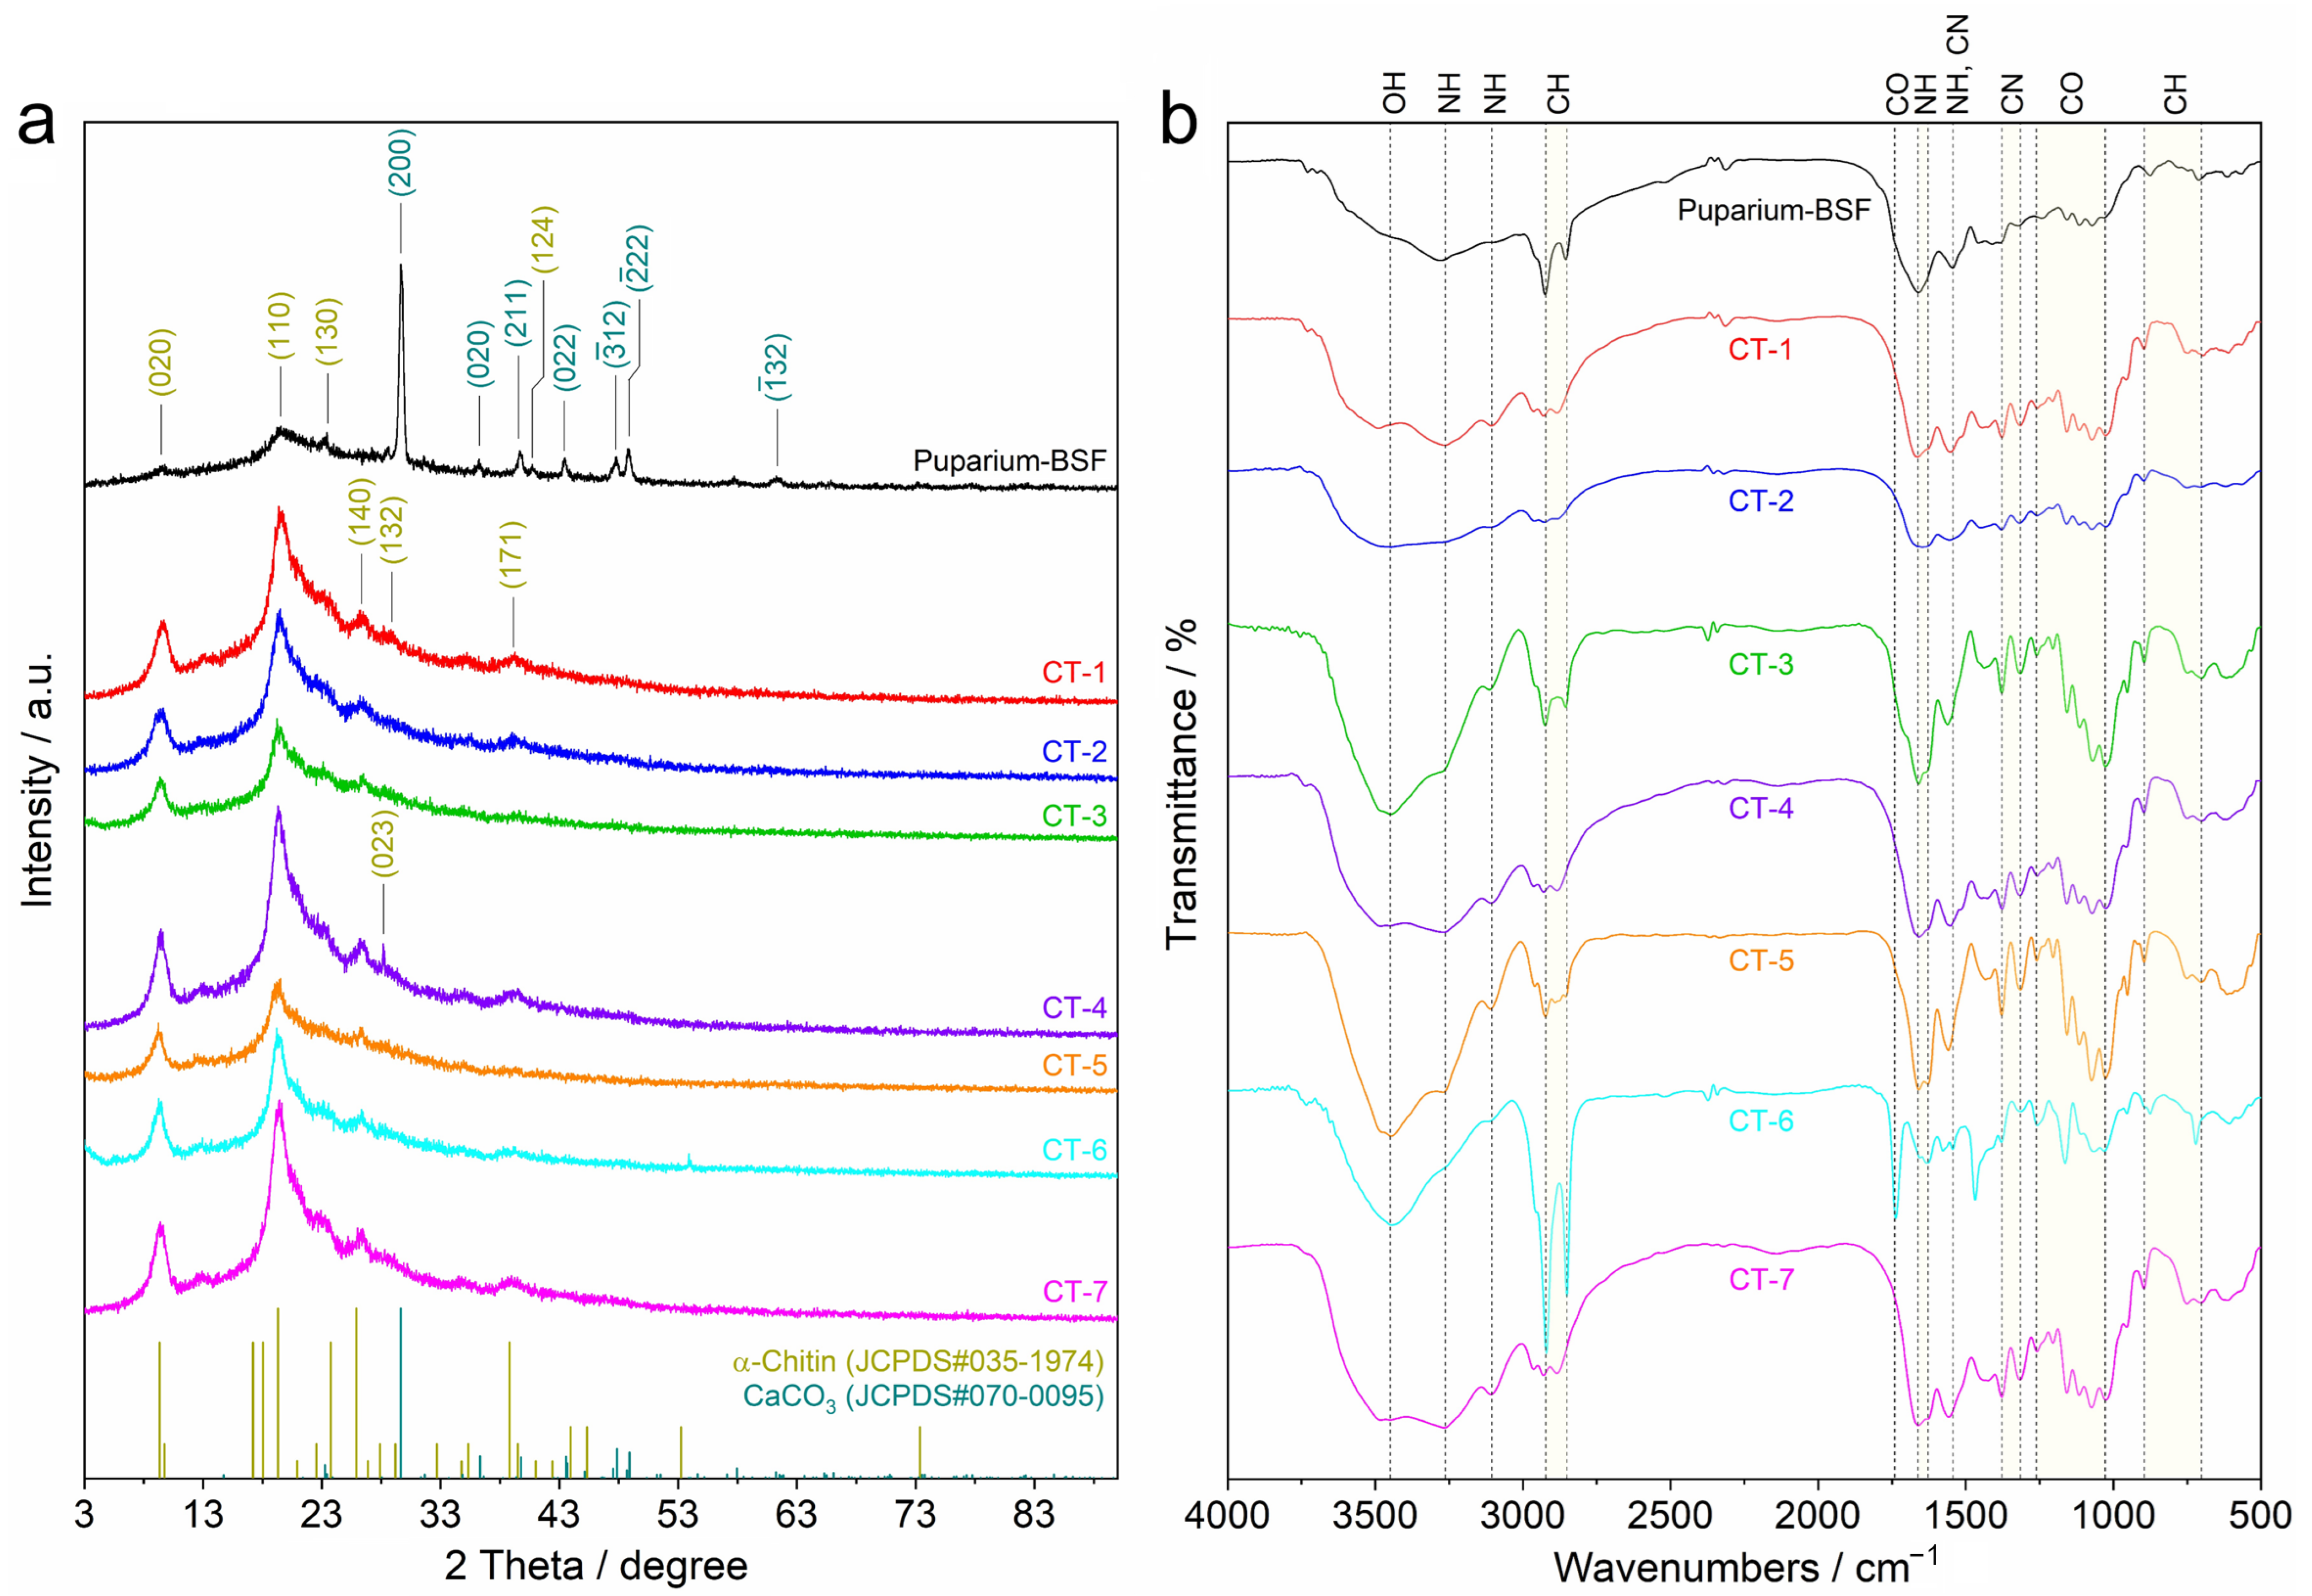
3.2.2. Crystalline Structure
3.2.3. Chemical Functional Group
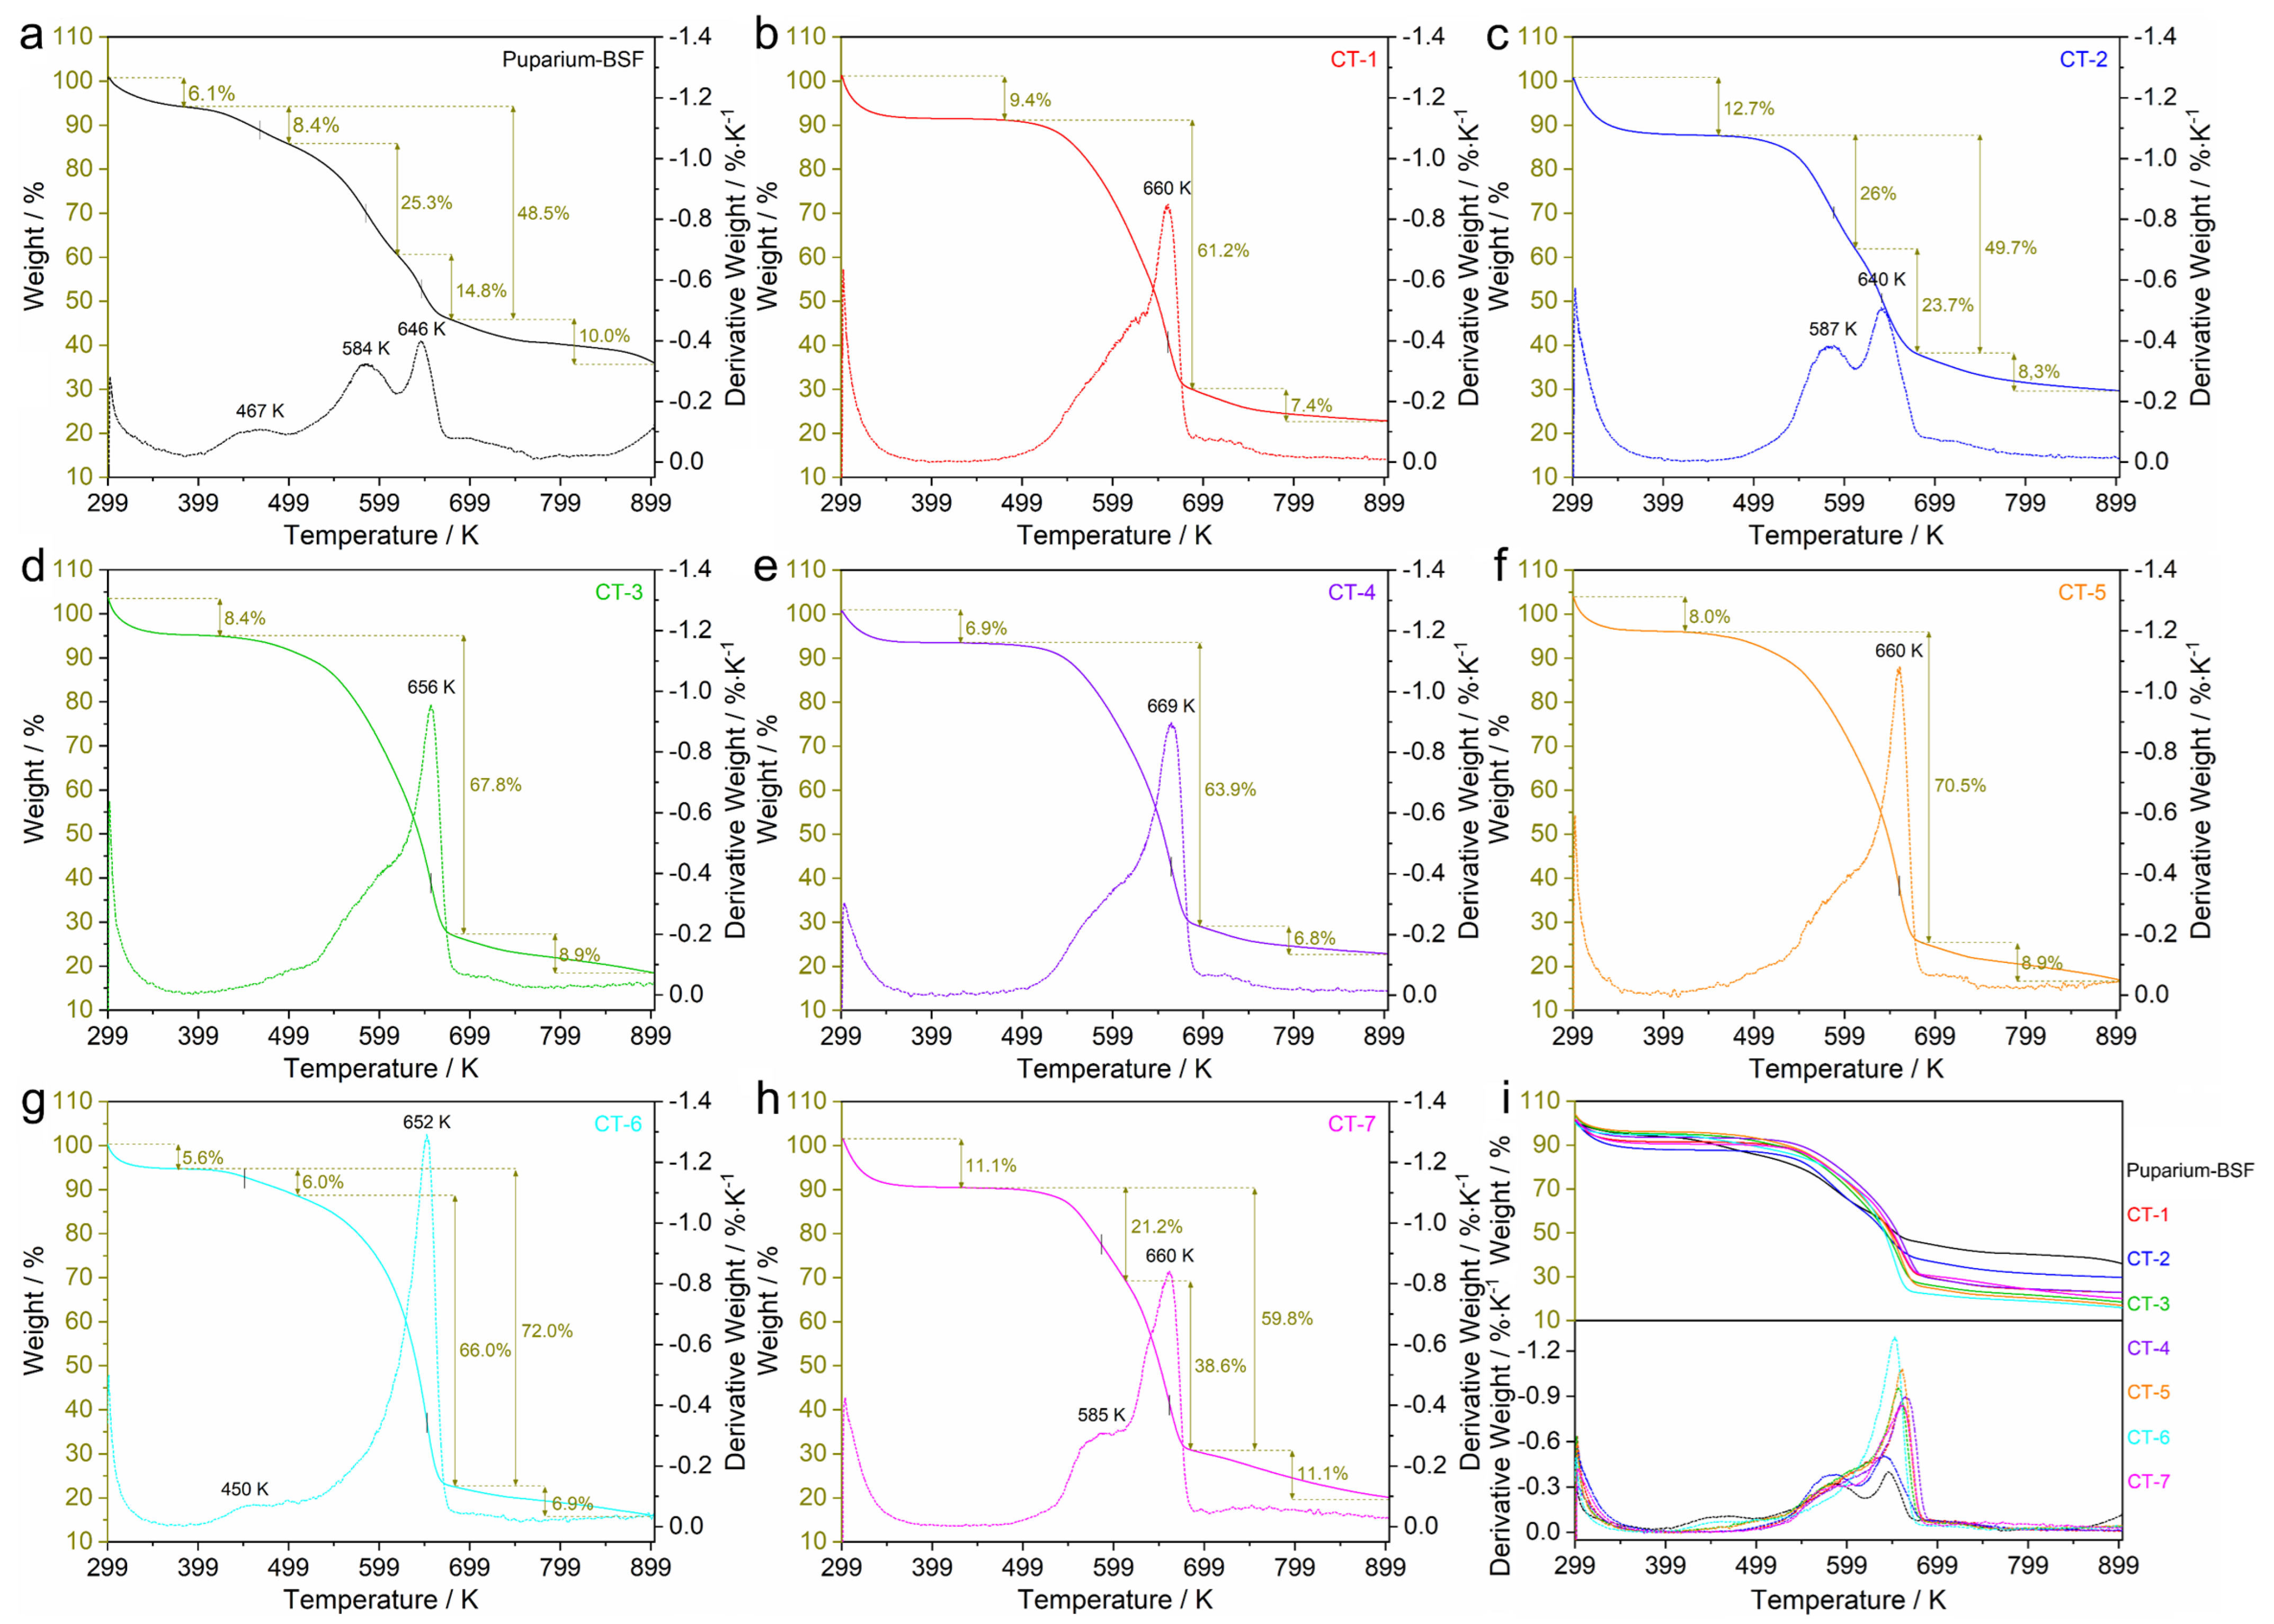
3.2.4. Thermal Behavior
4. Conclusions
Supplementary Materials
Author Contributions
Funding
Institutional Review Board Statement
Data Availability Statement
Acknowledgments
Conflicts of Interest
References
- Dziedzic, I.; Dydek, K.; Voronkina, A.; Kovalchuk, V.; Jesionowski, T.; Ehrlich, H. The Chitinous Skeleton of Ianthella Basta Marine Demosponge as a Renewable Scaffold-Based Carrier of Antiseptics. Polysaccharides 2024, 5, 540–551. [Google Scholar] [CrossRef]
- Kipkoech, C. Beyond Proteins—Edible Insects as a Source of Dietary Fiber. Polysaccharides 2023, 4, 116–128. [Google Scholar] [CrossRef]
- Campalani, C.; Bertuol, I.; Bersani, C.; Calmanti, R.; Filonenko, S.; Rodriguez-Padron, D.; Selva, M.; Perosa, A. Green Extraction of Chitin from Hard Spider Crab Shells. Carbohydr. Polym. 2024, 345, 122565. [Google Scholar] [CrossRef] [PubMed]
- Shakil, M.S.; Mahmud, K.M.; Sayem, M.; Niloy, M.S.; Halder, S.K.; Hossen, M.S.; Uddin, M.F.; Hasan, M.A. Using Chitosan or Chitosan Derivatives in Cancer Therapy. Polysaccharides 2021, 2, 795–816. [Google Scholar] [CrossRef]
- Pakizeh, M.; Moradi, A.; Ghassemi, T. Chemical Extraction and Modification of Chitin and Chitosan from Shrimp Shells. Eur. Polym. J. 2021, 159, 110709. [Google Scholar] [CrossRef]
- Arata Badano, J.; Vanden Braber, N.; Rossi, Y.; Díaz Vergara, L.; Bohl, L.; Porporatto, C.; Falcone, R.D.; Montenegro, M. Physicochemical, in Vitro Antioxidant and Cytotoxic Properties of Water-Soluble Chitosan-Lactose Derivatives. Carbohydr. Polym. 2019, 224, 115158. [Google Scholar] [CrossRef]
- Divya, K.; Jisha, M.S. Chitosan Nanoparticles Preparation and Applications. Environ. Chem. Lett. 2018, 16, 101–112. [Google Scholar] [CrossRef]
- El-Naggar, N.E.A.; Eltarahony, M.; Hafez, E.E.; Bashir, S.I. Green Fabrication of Chitosan Nanoparticles Using Lavendula Angustifolia, Optimization, Characterization and In-vitro Antibiofilm Activity. Sci. Rep. 2023, 13, 11127. [Google Scholar] [CrossRef]
- Yanat, M.; Schroën, K. Preparation Methods and Applications of Chitosan Nanoparticles; with an Outlook toward Reinforcement of Biodegradable Packaging. React. Funct. Polym. 2021, 161, 104849. [Google Scholar] [CrossRef]
- Elouali, S.; Hamdan, Y.A.; Benali, S.; Lhomme, P.; Gosselin, M.; Raquez, J.-M.; Rhazi, M. Extraction of Chitin and Chitosan from Hermetia illucens Breeding Waste: A Greener Approach for Industrial Application. Int. J. Biol. Macromol. 2025, 285, 138302. [Google Scholar]
- Guarnieri, A.; Triunfo, M.; Scieuzo, C.; Ianniciello, D.; Tafi, E.; Hahn, T.; Zibek, S.; Salvia, R.; De Bonis, A.; Falabella, P. Antimicrobial Properties of Chitosan from Different Developmental Stages of the Bioconverter Insect Hermetia illucens. Sci. Rep. 2022, 12, 8084. [Google Scholar] [CrossRef] [PubMed]
- Bhavsar, P.S.; Dalla Fontana, G.; Zoccola, M. Sustainable Superheated Water Hydrolysis of Black Soldier Fly Exuviae for Chitin Extraction and Use of the Obtained Chitosan in the Textile Field. ACS Omega 2021, 6, 8884–8893. [Google Scholar] [CrossRef] [PubMed]
- Triunfo, M.; Tafi, E.; Guarnieri, A.; Salvia, R.; Scieuzo, C.; Hahn, T.; Zibek, S.; Gagliardini, A.; Panariello, L.; Coltelli, M.B.; et al. Characterization of Chitin and Chitosan Derived from Hermetia illucens, a Further Step in a Circular Economy Process. Sci. Rep. 2022, 12, 6613. [Google Scholar] [CrossRef]
- Soetemans, L.; Uyttebroek, M.; Bastiaens, L. Characteristics of Chitin Extracted from Black Soldier Fly in Different Life Stages. Int. J. Biol. Macromol. 2020, 165, 3206–3214. [Google Scholar] [CrossRef]
- Witono, J.R.B. Sisi Ilmiah Maggot—Larva Black Soldier Fly (BSF; Hermetia illucens); Deepublish Digital: Yogyakarta, Indonesia, 2023; ISBN 978-623-02-6492-4. [Google Scholar]
- Xiong, A.; Ruan, L.; Ye, K.; Huang, Z.; Yu, C. Extraction of Chitin from Black Soldier Fly (Hermetia illucens) and Its Puparium by Using Biological Treatment. Life 2023, 13, 1424. [Google Scholar] [CrossRef]
- Mei, Z.; Kuzhir, P.; Godeau, G. Update on Chitin and Chitosan from Insects: Sources, Production, Characterization, and Biomedical Applications. Biomimetics 2024, 9, 297. [Google Scholar] [CrossRef]
- ur Rehman, K.; Hollah, C.; Wiesotzki, K.; Heinz, V.; Aganovic, K.; ur Rehman, R.; Petrusan, J.I.; Zheng, L.; Zhang, J.; Sohail, S.; et al. Insect-Derived Chitin and Chitosan: A Still Unexploited Resource for the Edible Insect Sector. Sustainability 2023, 15, 4864. [Google Scholar] [CrossRef]
- Yuan, B.Q.; Yu, T.H.; Chen, S.C.; Zhang, Z.Q.; Guo, Z.K.; Huang, G.X.; Xiao, J.H.; Huang, D.W. Physical and Chemical Characterization of Chitin and Chitosan Extracted under Different Treatments from Black Soldier Fly. Int. J. Biol. Macromol. 2024, 279, 135228. [Google Scholar] [CrossRef]
- Tan, Y.N.; Chin, Y.L.; Chen, W.N. Comparison of Sustainable Lipid and Protein Removal Methods for the Isolation of Insect Chitin from Black Soldier Fly Exoskeleton. ACS Food Sci. Technol. 2021, 1, 698–706. [Google Scholar] [CrossRef]
- Elkadaoui, S.; Azzi, M.; Desbrieres, J.; Zim, J.; El Hachimi, Y.; Tolaimate, A. Valorization of Hermetia illucens Breeding Rejects by Chitins and Chitosans Production. Influence of Processes and Life Cycle on Their Physicochemical Characteristics. Int. J. Biol. Macromol. 2024, 266, 131314. [Google Scholar] [CrossRef]
- ISO 638-1:2022; Paper, Board, Pulps and Cellulosic Nanomaterials—Determination of Dry Matter Content by Oven-Drying Method—Part 1: Materials in Solid Form. International Organization for Standardization (ISO): Geneva, Switzerland, 2022.
- ISO 1762:2019; Paper, Board, Pulps and Cellulose Nanomaterials: Determination of Residue (Ash Content) on Ignition at 525 °C. International Organization for Standardization (ISO): Geneva, Switzerland, 2019.
- AOAC 2003.05; Crude Fat in Feeds, Cereal Grains, and Forages. Association of Official Analytical Chemists (AOAC): Rockville, MD, USA, 2006.
- ISO 1871:2009; Food and Feed Products—General Guidelines for the Determination of Nitrogen by the Kjeldahl Method. International Organization for Standardization (ISO): Geneva, Switzerland, 2009.
- Janssen, R.H.; Vincken, J.P.; Van Den Broek, L.A.M.; Fogliano, V.; Lakemond, C.M.M. Nitrogen-to-Protein Conversion Factors for Three Edible Insects: Tenebrio Molitor, Alphitobius diaperinus, and Hermetia illucens. J. Agric. Food Chem. 2017, 65, 2275–2278. [Google Scholar] [CrossRef] [PubMed]
- Espinosa-Solís, A.; Velázquez-Segura, A.; Lara-Rodríguez, C.; Martínez, L.M.; Chuck-Hernández, C.; Rodríguez-Sifuentes, L. Optimizing Chitin Extraction and Chitosan Production from House Cricket Flour. Processes 2024, 12, 464. [Google Scholar] [CrossRef]
- Al-Shamery, N.; Gong, X.; Dosche, C.; Gupta, A.; Tan, M.W.M.; Phua, J.W.; Lee, P.S. Sustainable Organic Electrodes Using Black Soldier Fly-Derived Melanin for Zinc-Ion Hybrid Capacitors. Commun. Mater. 2024, 5, 156. [Google Scholar] [CrossRef]
- Aranday-García, R.; Saimoto, H.; Shirai, K.; Ifuku, S. Chitin Biological Extraction from Shrimp Wastes and Its Fibrillation for Elastic Nanofiber Sheets Preparation. Carbohydr. Polym. 2019, 213, 112–120. [Google Scholar] [CrossRef]
- Wang, J.; Zhuang, S. Chitosan-Based Materials: Preparation, Modification and Application. J. Clean. Prod. 2022, 355, 131825. [Google Scholar] [CrossRef]
- Smith, R.A.W.; Garrett, B.; Naqvi, K.R.; Fülöp, A.; Godfrey, S.P.; Marsh, J.M.; Chechik, V. Mechanistic Insights into the Bleaching of Melanin by Alkaline Hydrogen Peroxide. Free Radic. Biol. Med. 2017, 108, 110–117. [Google Scholar] [CrossRef]
- Chang, K.L.B.; Tai, M.C.; Cheng, F.H. Kinetics and Products of the Degradation of Chitosan by Hydrogen Peroxide. J. Agric. Food Chem. 2001, 49, 4845–4851. [Google Scholar] [CrossRef]
- Hao, G.; Hu, Y.; Shi, L.; Chen, J.; Cui, A.; Weng, W.; Osako, K. Physicochemical Characteristics of Chitosan from Swimming Crab (Portunus trituberculatus) Shells Prepared by Subcritical Water Pretreatment. Sci. Rep. 2021, 11, 1646. [Google Scholar] [CrossRef]
- Lin, Y.; Liang, S.; Lai, W.; Lee, J.; Wang, Y.; Liu, Y.; Wang, S.; Lee, M. Sustainable Extraction of Chitin from Spent Pupal Shell of Black Soldier Fly. Processes 2021, 9, 976. [Google Scholar] [CrossRef]
- Rasweefali, M.K.; Sabu, S.; Muhammed Azad, K.S.; Raseel Rahman, M.K.; Sunooj, K.V.; Sasidharan, A.; Anoop, K.K. Influence of Deproteinization and Demineralization Process Sequences on the Physicochemical and Structural Characteristics of Chitin Isolated from Deep-Sea Mud Shrimp (Solenocera hextii). Adv. Biomark. Sci. Technol. 2022, 4, 12–27. [Google Scholar] [CrossRef]
- Psarianos, M.; Ojha, S.; Schneider, R.; Schlüter, O.K. Chitin Isolation and Chitosan Production from House Crickets (Acheta domesticus) by Environmentally Friendly Methods. Molecules 2022, 27, 5005. [Google Scholar] [CrossRef] [PubMed]
- Younes, I.; Rinaudo, M. Chitin and Chitosan Preparation from Marine Sources. Structure, Properties and Applications. Mar. Drugs 2015, 13, 1133–1174. [Google Scholar] [CrossRef] [PubMed]
- Luo, Q.; Wang, Y.; Han, Q.; Ji, L.; Zhang, H.; Fei, Z.; Wang, Y. Comparison of the Physicochemical, Rheological, and Morphologic Properties of Chitosan from Four Insects. Carbohydr. Polym. 2019, 209, 266–275. [Google Scholar] [CrossRef]
- Hahn, T.; Tafi, E.; Paul, A.; Salvia, R.; Falabella, P.; Zibek, S. Current State of Chitin Purification and Chitosan Production from Insects. J. Chem. Technol. Biotechnol. 2020, 95, 2775–2795. [Google Scholar] [CrossRef]
- Boamah, P.O.; Onumah, J.; Agolisi, M.H.; Idan, F. Application of Low Molecular Weight Chitosan in Animal Nutrition, Husbandry, and Health: A Review. Carbohydr. Polym. Technol. Appl. 2023, 6, 100329. [Google Scholar] [CrossRef]
- Boamah, P.O.; Onumah, J.; Aduguba, W.O.; Santo, K.G. Application of Depolymerized Chitosan in Crop Production: A Review. Int. J. Biol. Macromol. 2023, 235, 123858. [Google Scholar]
- Román-Doval, R.; Torres-Arellanes, S.P.; Tenorio-Barajas, A.Y.; Gómez-Sánchez, A.; Valencia-Lazcano, A.A. Chitosan: Properties and Its Application in Agriculture in Context of Molecular Weight. Polymers 2023, 15, 2867. [Google Scholar] [CrossRef]
- Rebora, M.; Salerno, G.; Piersanti, S.; Saitta, V.; Morelli Venturi, D.; Li, C.; Gorb, S. The Armoured Cuticle of the Black Soldier Fly Hermetia illucens. Sci. Rep. 2023, 13, 22101. [Google Scholar] [CrossRef]
- Pedrazzani, C.; Righi, L.; Vescovi, F.; Maistrello, L.; Caligiani, A. Black Soldier Fly as a New Chitin Source: Extraction, Purification and Molecular/Structural Characterization. LWT 2024, 191, 115618. [Google Scholar] [CrossRef]
- Nguyen, H.T.T.; Tran, T.N.; Ha, A.C.; Huynh, P.D. Impact of Deacetylation Degree on Properties of Chitosan for Formation of Electrosprayed Nanoparticles. J. Nanotechnol. 2022, 2022, 2288892. [Google Scholar] [CrossRef]
- Poerio, A.; Petit, C.; Jehl, J.P.; Arab-Tehrany, E.; Mano, J.F.; Cleymand, F. Extraction and Physicochemical Characterization of Chitin from Cicada Orni Sloughs of the South-Eastern French Mediterranean Basin. Molecules 2020, 25, 2543. [Google Scholar] [CrossRef] [PubMed]
- Wang, H.; ur Rehman, K.; Feng, W.; Yang, D.; ur Rehman, R.; Cai, M.; Zhang, J.; Yu, Z.; Zheng, L. Physicochemical Structure of Chitin in the Developing Stages of Black Soldier Fly. Int. J. Biol. Macromol. 2020, 149, 901–907. [Google Scholar] [CrossRef] [PubMed]
- Aranaz, I.; Mengibar, M.; Harris, R.; Panos, I.; Miralles, B.; Acosta, N.; Galed, G.; Heras, A. Functional Characterization of Chitin and Chitosan. Curr. Chem. Biol. 2012, 3, 203–230. [Google Scholar] [CrossRef]
- Triunfo, M.; Tafi, E.; Guarnieri, A.; Scieuzo, C.; Hahn, T.; Zibek, S.; Salvia, R.; Falabella, P. Insect Chitin-Based Nanomaterials for Innovative Cosmetics and Cosmeceuticals. Cosmetics 2021, 8, 40. [Google Scholar] [CrossRef]
- Jantzen da Silva Lucas, A.; Quadro Oreste, E.; Leão Gouveia Costa, H.; Martín López, H.; Dias Medeiros Saad, C.; Prentice, C. Extraction, Physicochemical Characterization, and Morphological Properties of Chitin and Chitosan from Cuticles of Edible Insects. Food Chem. 2021, 343, 128550. [Google Scholar] [CrossRef]
- Quiñones-cerna, C.; Carlos, J.; Hurtado-butr, F.; Centeno-calder, L.; Mejia-ruedell, R.; Eulalio, L.-Q.; Julieta, G.-R.; Ugarte-Lopez, W. Efficient Chitin Extraction from Shrimp Exoskeletons through Single-Step Fermentation by Pseudomonas Aeruginosa QF50 and Serratia Sp. QCS23. Processes 2024, 12, 1184. [Google Scholar] [CrossRef]
- Salah, L.S.; Ouslimani, N.; Danlée, Y.; Beltrán, F.R.; Huynen, I.; Ulagares de la Orden, M. Investigation of Mechanical Recycling Effect on Electromagnetic Properties of Polylactic Acid (PLA)—Nanoclay Nanocomposites: Towards a Valorization of Recycled PLA Nanocomposites. Compos. Part C Open Access 2023, 10, 100339. [Google Scholar] [CrossRef]
- Grifoll, V.; Bravo, P.; Pérez, M.N.; Pérez-Clavijo, M.; García-Castrillo, M.; Larrañaga, A.; Lizundia, E. Environmental Sustainability and Physicochemical Property Screening of Chitin and Chitin-Glucan from 22 Fungal Species. ACS Sustain. Chem. Eng. 2024, 12, 7869–7881. [Google Scholar] [CrossRef]
- Nieto, J.M.; Peniche-Covas, C.; Padron, G. Characterization of Chitosan by Pyrolysis-Mass Spectrometry, Thermal Analysis and Differential Scanning Calorimetry. Thermochim. Acta 1991, 176, 63–68. [Google Scholar] [CrossRef]
- Acosta-Ferreira, S.; Castillo, O.S.; Madera-Santana, J.T.; Mendoza-García, D.A.; Núñez-Colín, C.A.; Grijalva-Verdugo, C.; Villa-Lerma, A.G.; Morales-Vargas, A.T.; Rodríguez-Núñez, J.R. Production and Physicochemical Characterization of Chitosan for the Harvesting of Wild Microalgae Consortia. Biotechnol. Rep. 2020, 28, e00554. [Google Scholar] [CrossRef]
- Hassainia, A.; Satha, H.; Boufi, S. Chitin from Agaricus Bisporus: Extraction and Characterization. Int. J. Biol. Macromol. 2018, 117, 1334–1342. [Google Scholar] [CrossRef] [PubMed]
- Nurfikari, A.; de Boer, W. Chitin Determination in Residual Streams Derived From Insect Production by LC-ECD and LC-MS/MS Methods. Front. Sustain. Food Syst. 2021, 5, 795694. [Google Scholar] [CrossRef]
- Hahn, T.; Tafi, E.; von Seggern, N.; Falabella, P.; Salvia, R.; Thomä, J.; Febel, E.; Fijalkowska, M.; Schmitt, E.; Stegbauer, L.; et al. Purification of Chitin from Pupal Exuviae of the Black Soldier Fly. Waste and Biomass Valorization 2022, 13, 1993–2008. [Google Scholar] [CrossRef]
- Purkayastha, D.; Sarkar, S. Physicochemical Structure Analysis of Chitin Extracted from Pupa Exuviae and Dead Imago of Wild Black Soldier Fly (Hermetia illucens). J. Polym. Environ. 2020, 28, 445–457. [Google Scholar] [CrossRef]
- Ndiritu, A.; Kinyuru, J.; Onyango, A.; Kipkoech, C. Functional and Microstructural Characteristics of Chitin Extracted from Field Cricket, House Cricket, and Black Soldier Fly Cocoons. J. Food Meas. Charact. 2023, 17, 5903–5912. [Google Scholar] [CrossRef]

| Variant | Treatment Sequence | Demineralization | Deproteination | Decolorization |
|---|---|---|---|---|
| CT-1 | DP → DM | 1.0 mol·L−1 of HCl at Tamb for 1 h. | 1.0 mol·L−1 of NaOH at 353 K for 1 h. | - |
| CT-2 | DM → DP | - | ||
| CT-3 | DP → DM → DC | 5% H2O2 at 363 K for 1 h. | ||
| CT-4 | DM → DP → DC | |||
| CT-5 | DP → DC → DM | |||
| CT-6 | (DP + DC) → DM | 5% H2O2 and 1.0 mol·L−1 of NaOH at 353 K for 1 h. | ||
| CT-7 | DM → (DP + DC) | |||
| Variant | Proximate Analysis (%-dw) | DDM (%) | DDP (%) | DD (%) | |||
|---|---|---|---|---|---|---|---|
| Ash | Lipid | Protein | Chitin | ||||
| Puparium-BSF | 19.33 ± 0.15 | 17.19 ± 0.52 | 38.85 ± 0.31 | 24.62 | - | - | - |
| CT-1 | 1.61 ± 0.02 | 3.84 ± 0.55 | 4.24 ± 0.05 | 90.31 | 91.68 ± 0.15 | 89.09 ± 0.03 | 10.17 |
| CT-2 | 3.18 ± 0.26 | 6.64 ± 0.00 | 7.43 ± 0.11 | 82.75 | 83.56 ± 1.22 | 80.86 ± 0.43 | 25.20 |
| CT-3 | 1.16 ± 0.08 | 2.33 ± 0.14 | 3.95 ± 0.09 | 92.60 | 94.23 ± 0.37 | 89.82 ± 0.16 | 40.13 |
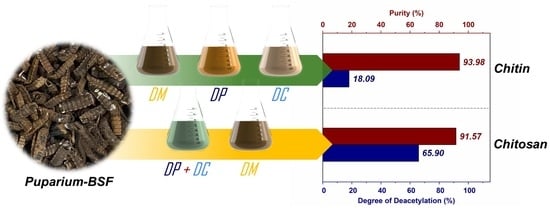
| CT-4 | 1.01 ± 0.09 | 1.99 ± 0.18 | 3.01 ± 0.15 | 93.98 | 94.77 ± 0.41 | 92.24 ± 0.31 | 18.09 |
| CT-5 | 2.43 ± 0.15 | 3.28 ± 1.11 | 3.78 ± 0.09 | 90.50 | 87.42 ± 0.86 | 90.25 ± 0.16 | 46.18 |
| CT-6 | 3.27 ± 0.19 | 1.89 ± 1.02 | 3.28 ± 0.08 | 91.57 | 83.09 ± 1.10 | 91.57 ± 0.15 | 65.90 |
| CT-7 | 2.22 ± 0.06 | 2.63 ± 0.53 | 5.56 ± 0.09 | 89.59 | 88.50 ± 0.42 | 85.71 ± 0.14 | 22.17 |
Disclaimer/Publisher’s Note: The statements, opinions and data contained in all publications are solely those of the individual author(s) and contributor(s) and not of MDPI and/or the editor(s). MDPI and/or the editor(s) disclaim responsibility for any injury to people or property resulting from any ideas, methods, instructions or products referred to in the content. |
© 2025 by the authors. Licensee MDPI, Basel, Switzerland. This article is an open access article distributed under the terms and conditions of the Creative Commons Attribution (CC BY) license (https://creativecommons.org/licenses/by/4.0/).
Share and Cite
Witono, J.R.B.; Tan, D.; Deandra, P.P.; Miryanti, Y.I.P.A.; Wanta, K.C.; Santoso, H.; Bulin, C.D.Q.M.; Astuti, D.A. Strategic Advances in Efficient Chitin Extraction from Black Soldier Fly Puparia: Uncovering the Potential for Direct Chitosan Production. Polysaccharides 2025, 6, 26. https://doi.org/10.3390/polysaccharides6020026
Witono JRB, Tan D, Deandra PP, Miryanti YIPA, Wanta KC, Santoso H, Bulin CDQM, Astuti DA. Strategic Advances in Efficient Chitin Extraction from Black Soldier Fly Puparia: Uncovering the Potential for Direct Chitosan Production. Polysaccharides. 2025; 6(2):26. https://doi.org/10.3390/polysaccharides6020026
Chicago/Turabian StyleWitono, Judy Retti Bhawaningrum, Daniel Tan, Putu Padmareka Deandra, Yuventia Ismu Pancasilawati Arry Miryanti, Kevin Cleary Wanta, Herry Santoso, Christiani Dewi Qeken Mariano Bulin, and Dewi Apri Astuti. 2025. "Strategic Advances in Efficient Chitin Extraction from Black Soldier Fly Puparia: Uncovering the Potential for Direct Chitosan Production" Polysaccharides 6, no. 2: 26. https://doi.org/10.3390/polysaccharides6020026
APA StyleWitono, J. R. B., Tan, D., Deandra, P. P., Miryanti, Y. I. P. A., Wanta, K. C., Santoso, H., Bulin, C. D. Q. M., & Astuti, D. A. (2025). Strategic Advances in Efficient Chitin Extraction from Black Soldier Fly Puparia: Uncovering the Potential for Direct Chitosan Production. Polysaccharides, 6(2), 26. https://doi.org/10.3390/polysaccharides6020026