
Trends and Subgroup Comparisons of Obesity and Severe Obesity Prevalence Among Mississippi Adults, 2011–2021
 ,
,
Abstract
1. Introduction
2. Materials and Methods
2.1. Data Source
2.2. Variables of Interest
2.3. Statistical Analysis
3. Results
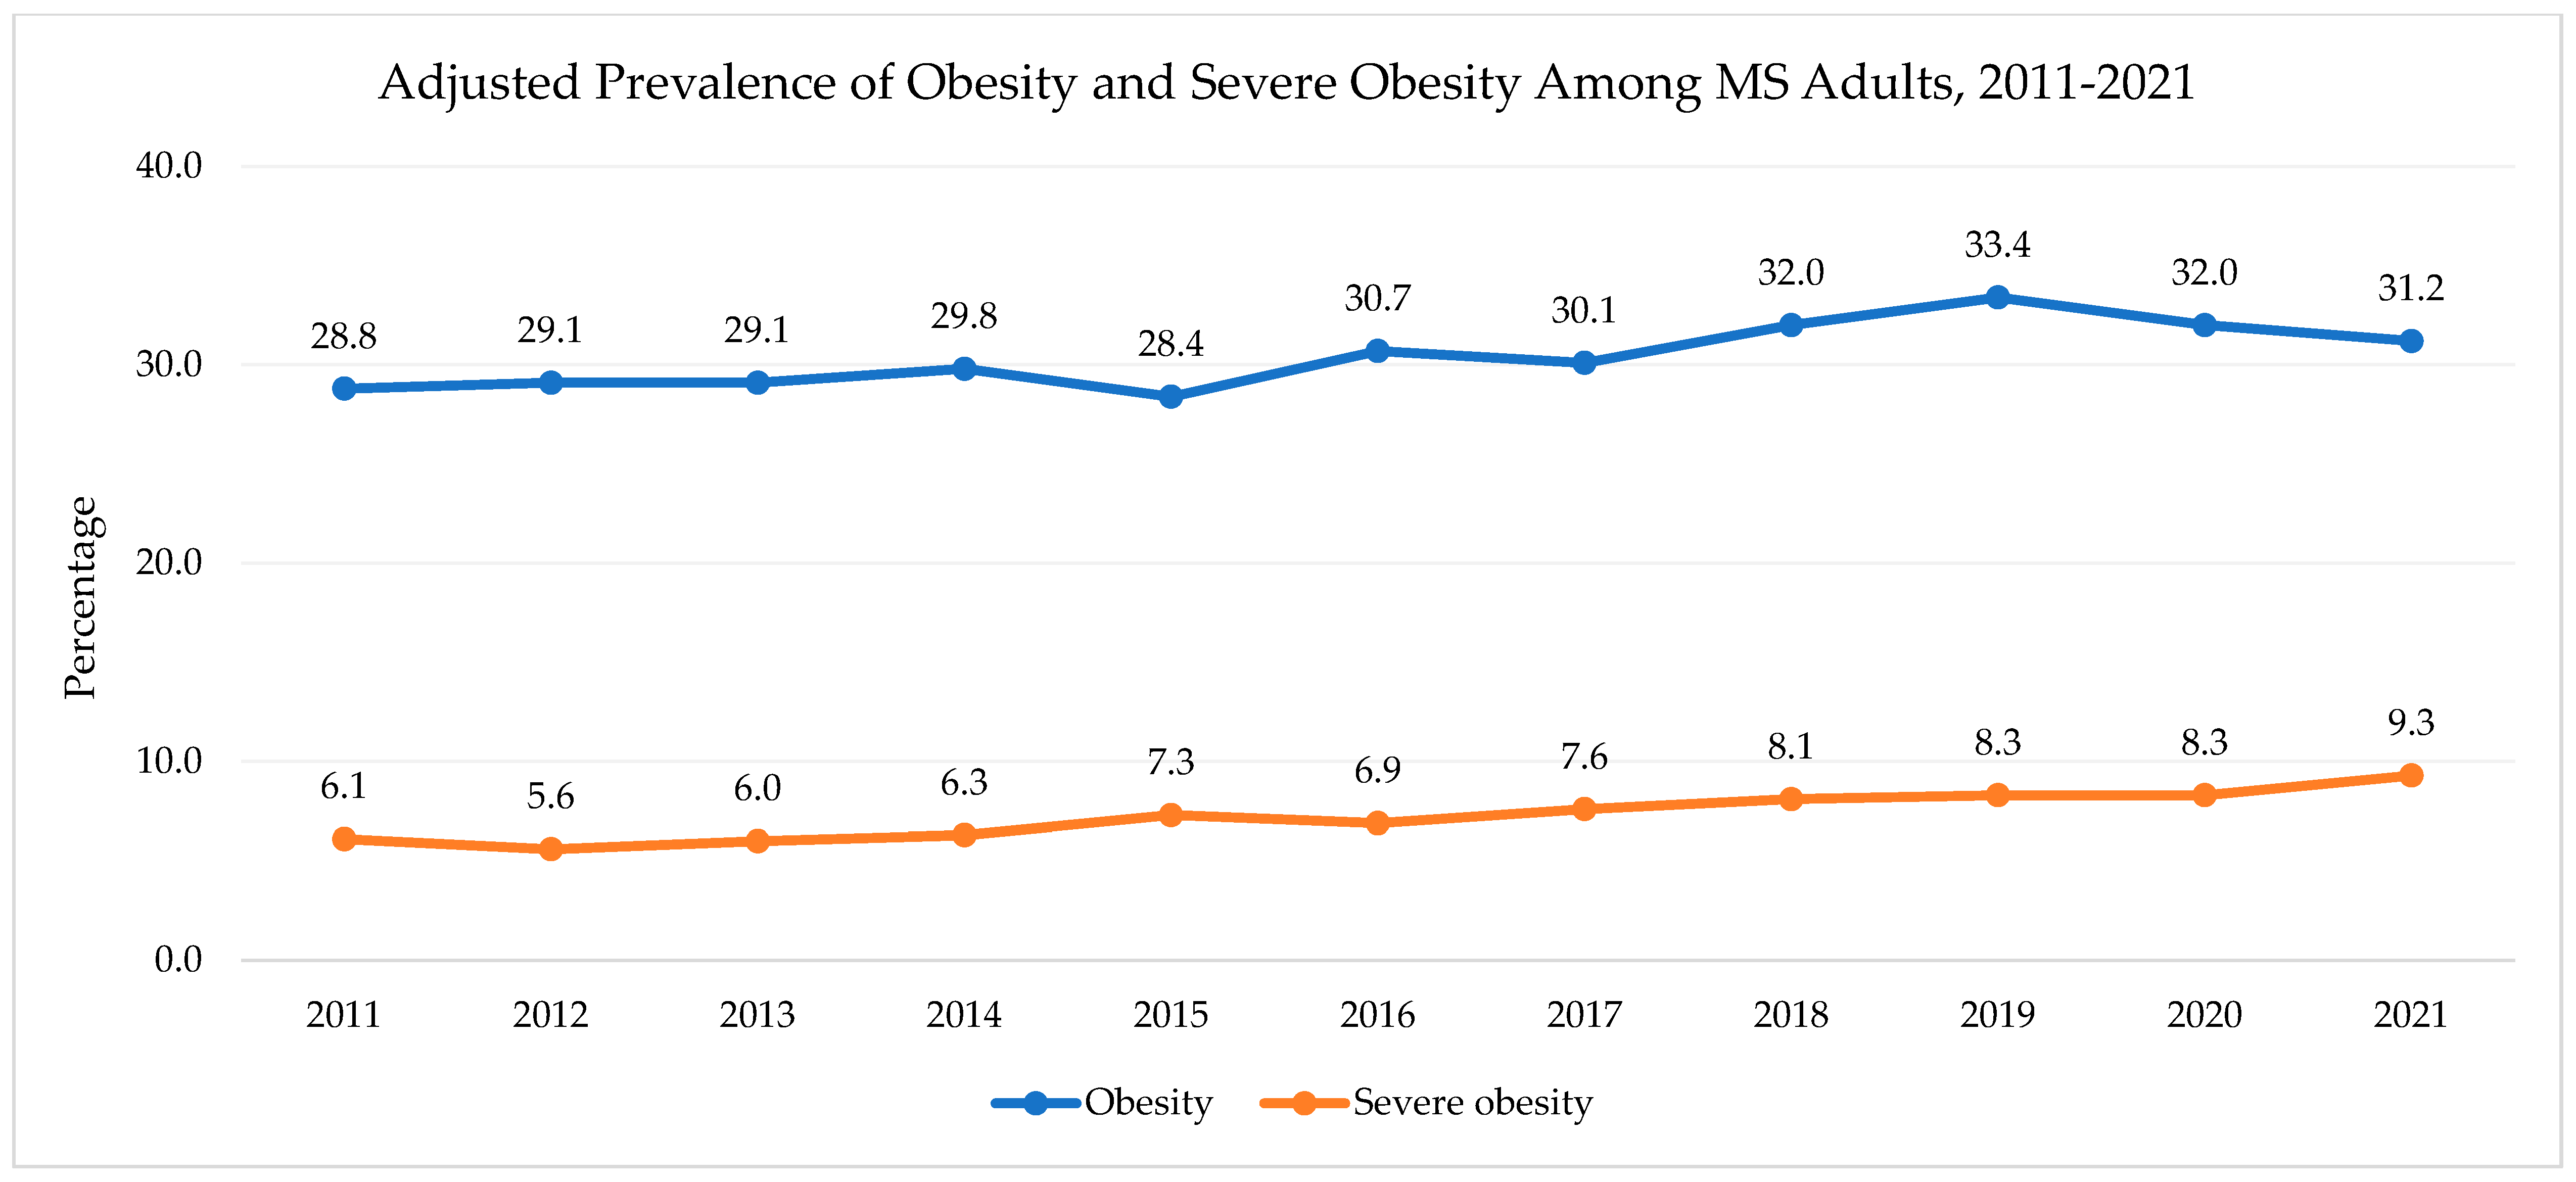
3.1. Overall Findings
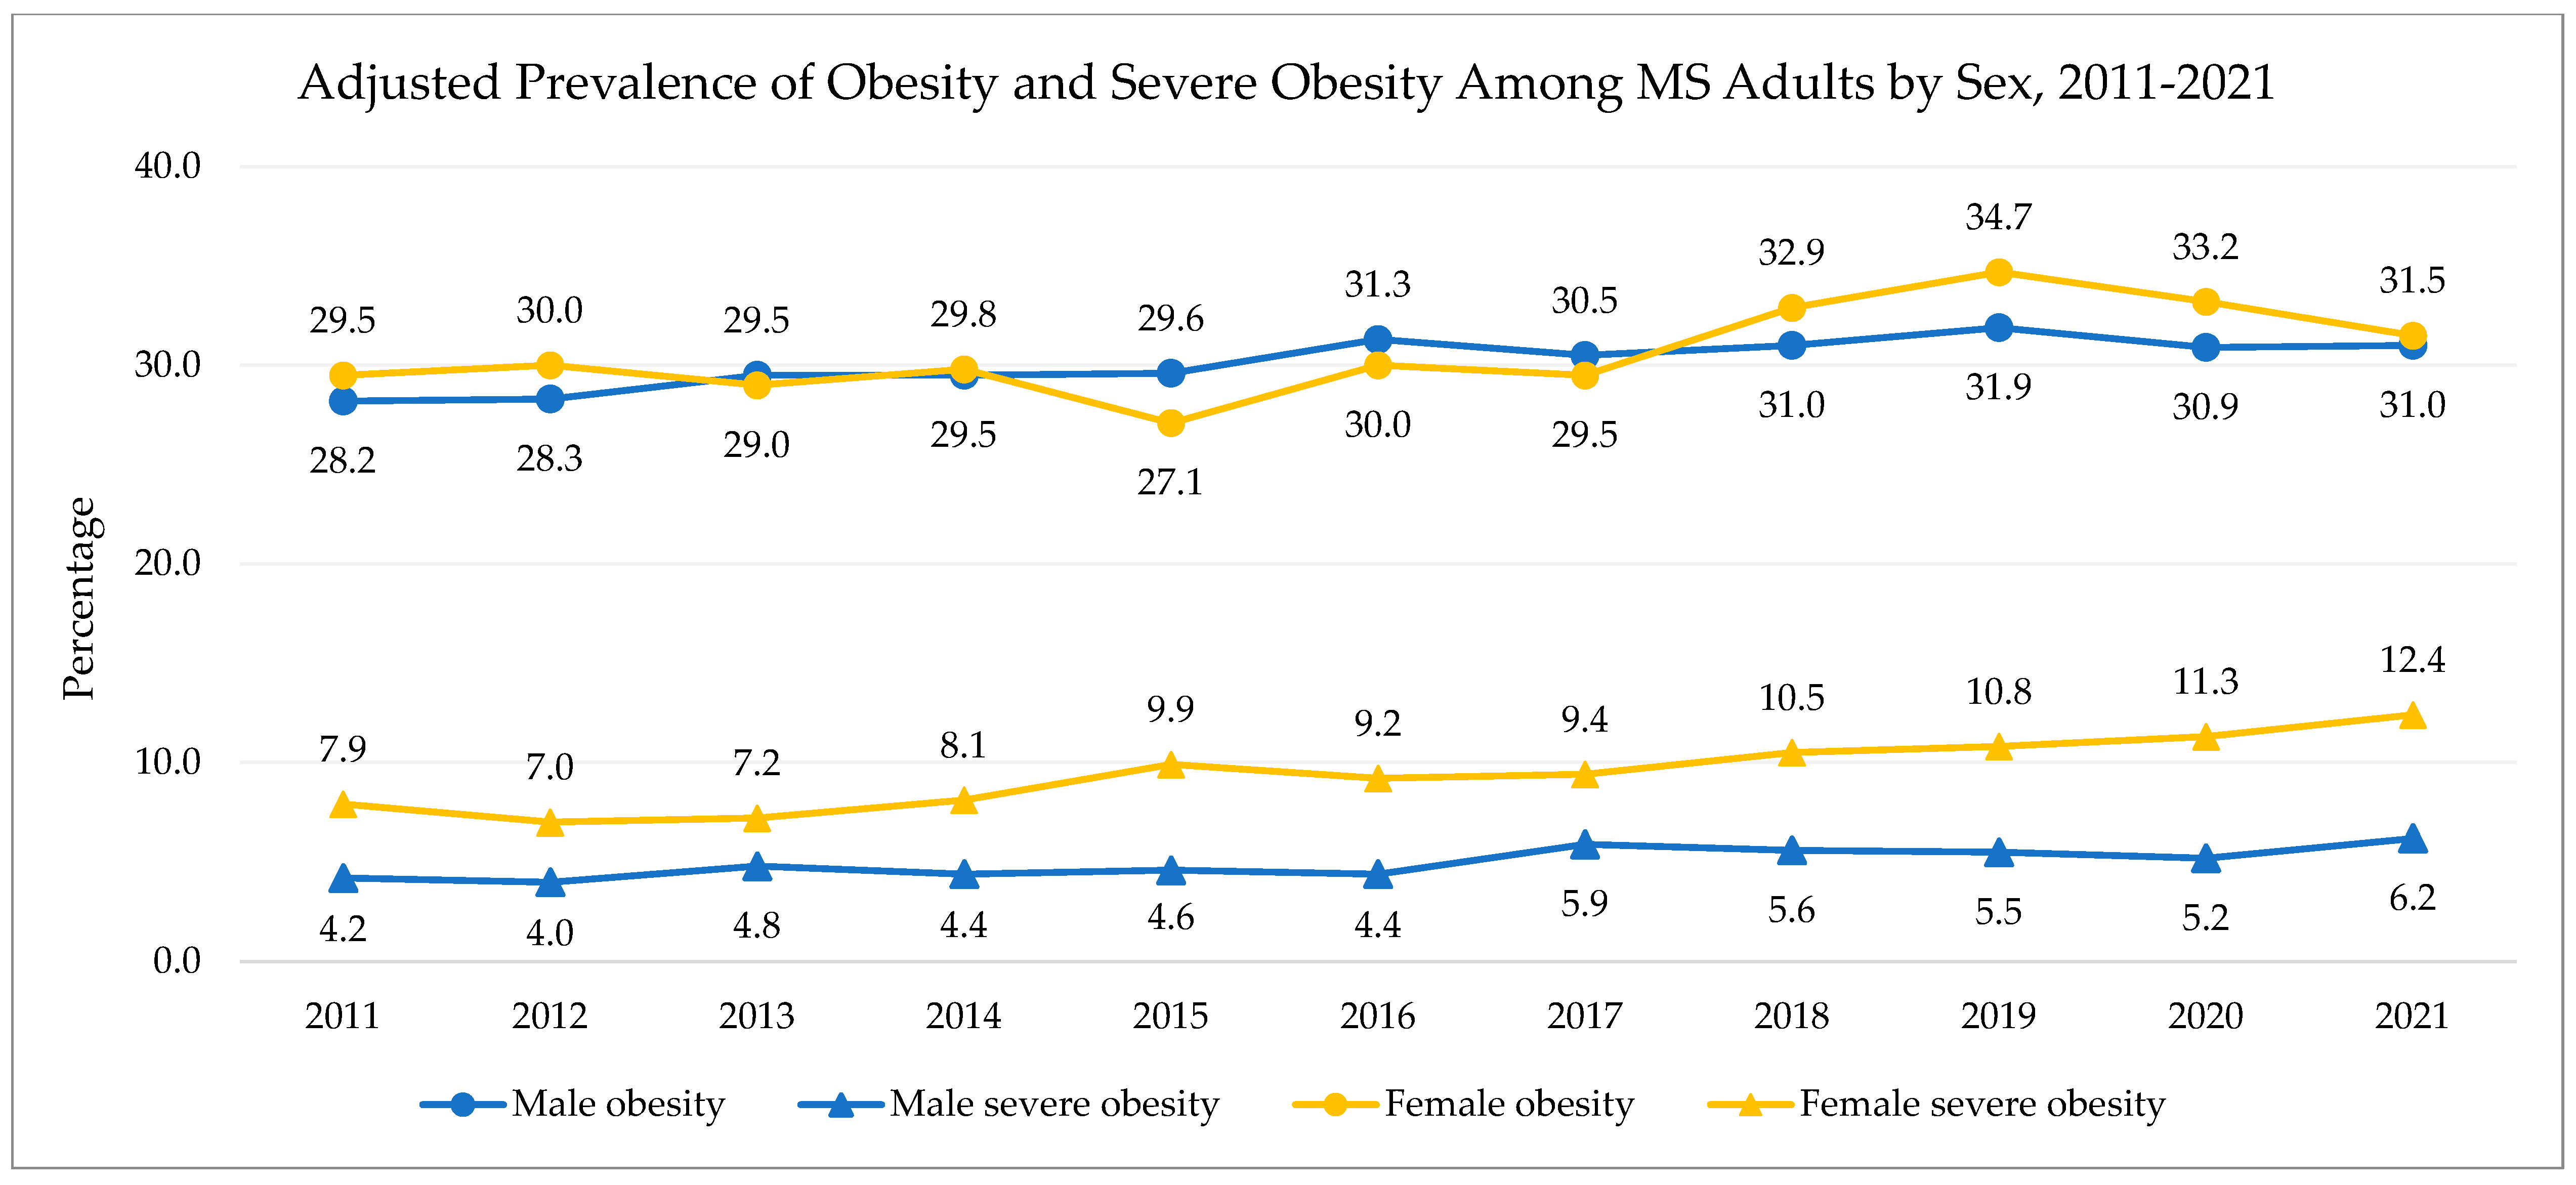
3.2. Sex
3.3. Race/Ethnicity
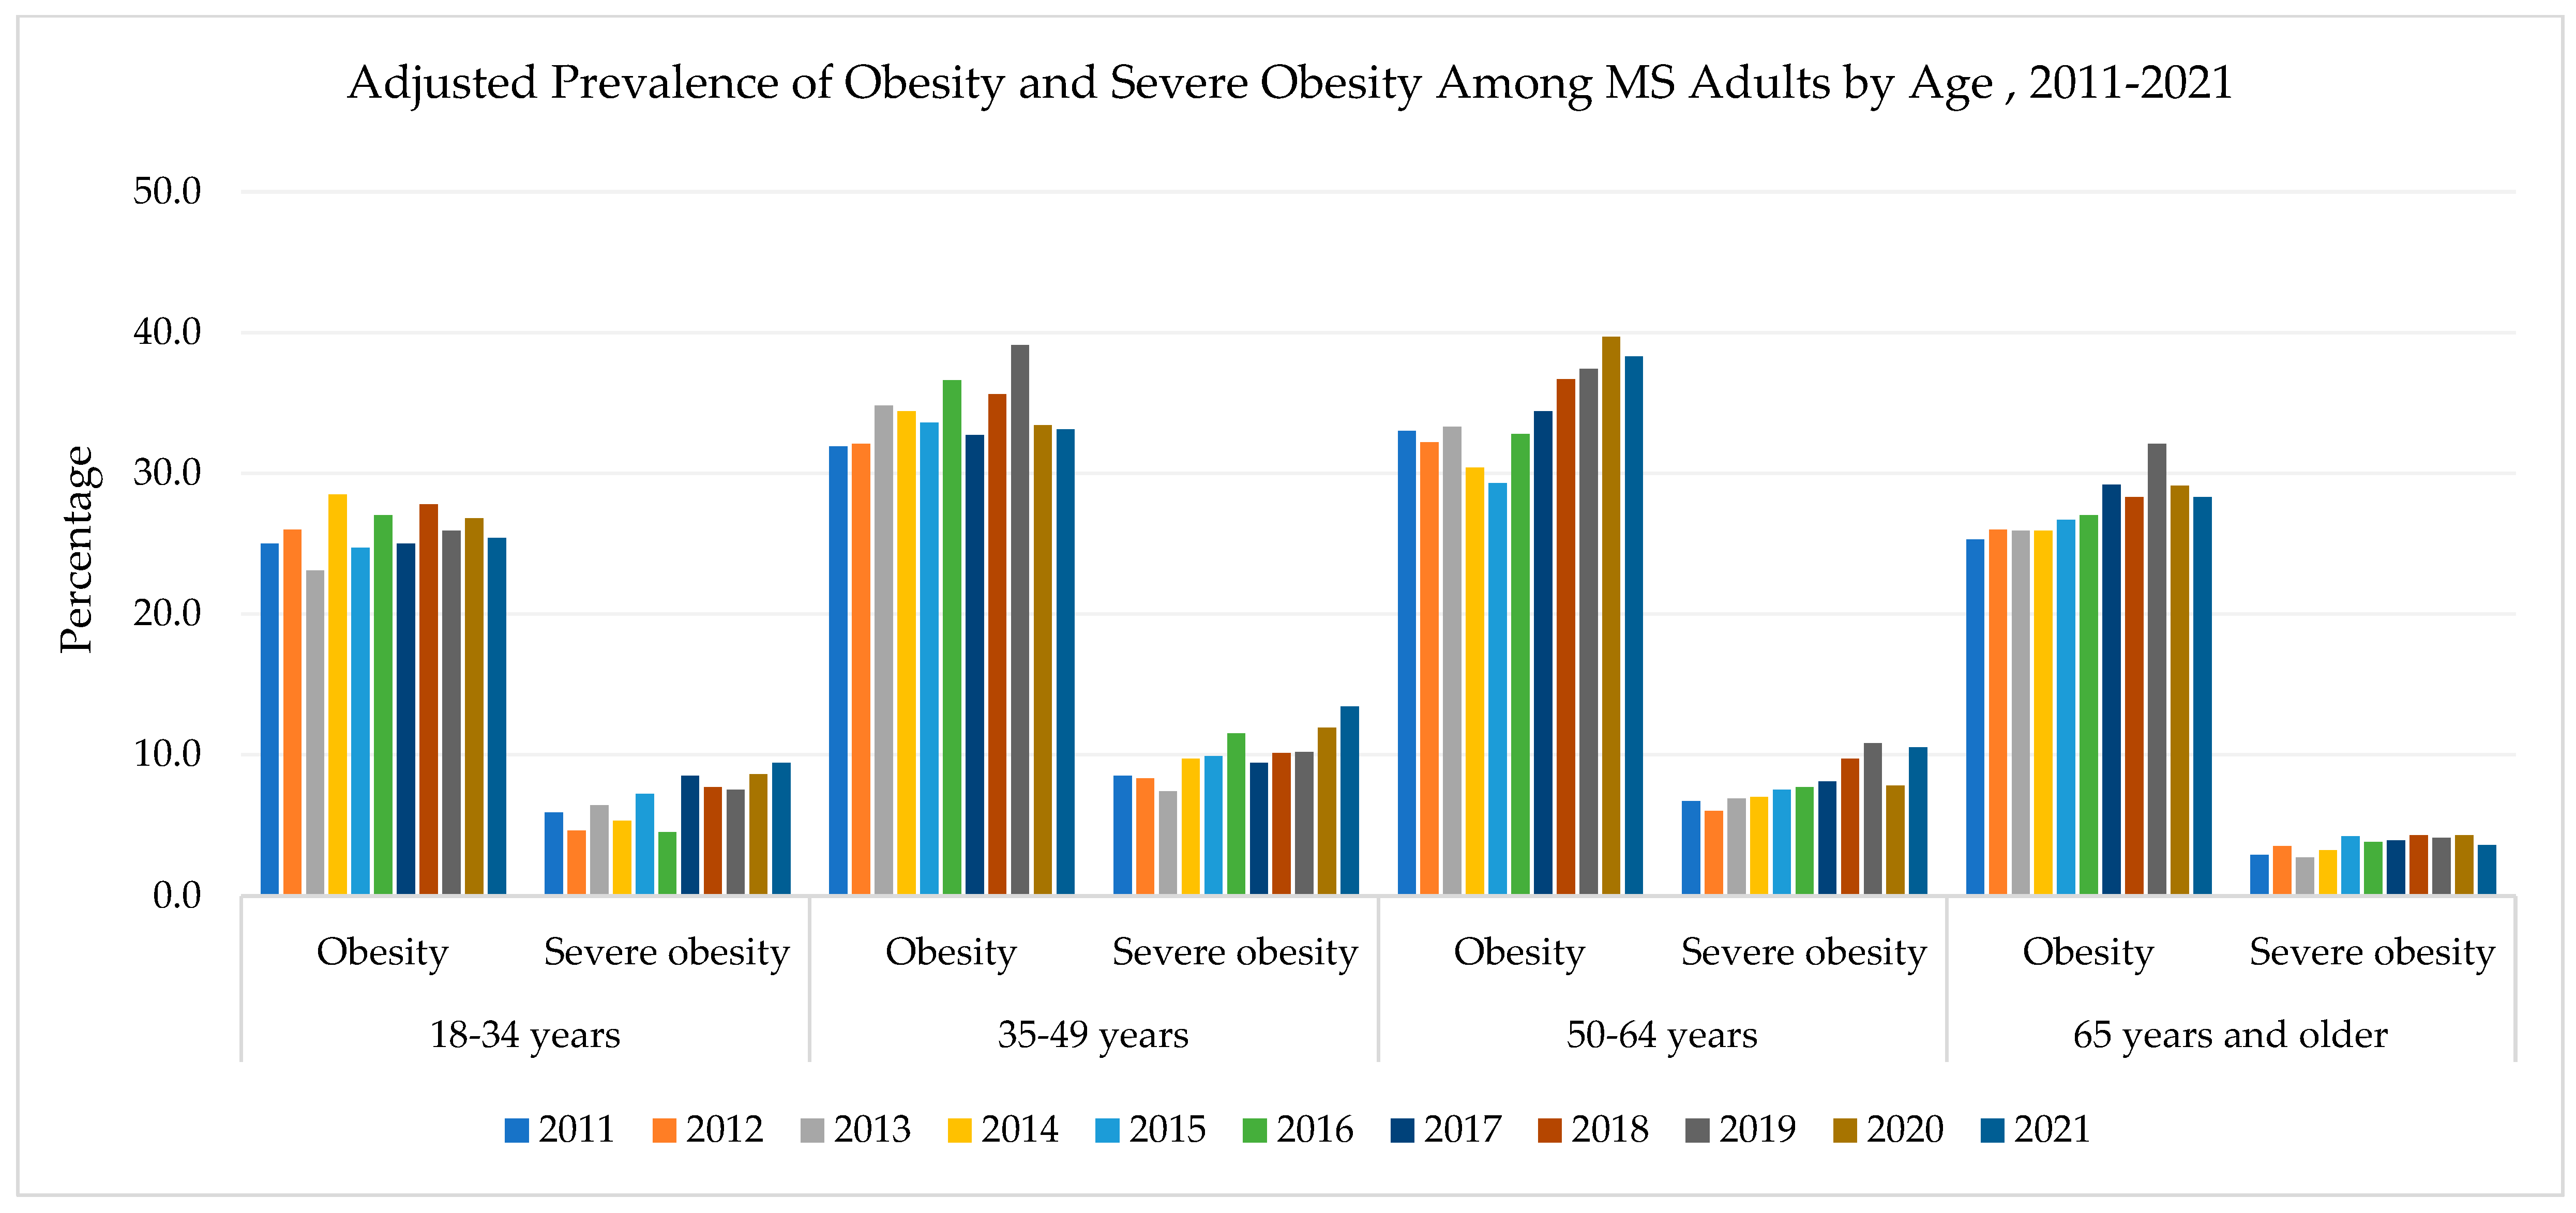
3.4. Age
3.5. Race/Ethnicity and Sex
4. Discussion
5. Conclusions
Author Contributions
Funding
Institutional Review Board Statement
Informed Consent Statement
Data Availability Statement
Acknowledgments
Conflicts of Interest
References
- Williams, E.P.; Mesidor, M.; Winters, K.; Dubbert, P.M.; Wyatt, S.B. Overweight and Obesity: Prevalence, Consequences, and Causes of a Growing Public Health Problem. Curr. Obes. Rep. 2015, 4, 363–370. [Google Scholar] [CrossRef] [PubMed]
- World Health Organization. Obesity and Overweight. Available online: https://www.who.int/news-room/fact-sheets/detail/obesity-and-overweight (accessed on 3 November 2022).
- Fryar, C.D.; Carroll, M.D.; Afful, J. Prevalence of Overweight, Obesity, and Severe Obesity Among Adults Aged 20 and Over: United States, 1960–1962 Through 2017–2018. NCHS Health E-Stats, 2021. Available online: https://www.cdc.gov/nchs/data/hestat/obesity-adult-17-18/obesity-adult.htm (accessed on 3 November 2022).
- America’s Health Rankings. Obesity in Mississippi. United Health Foundation. Available online: https://www.americashealthrankings.org/explore/annual/measure/Obesity (accessed on 4 November 2022).
- Zhao, L.; Park, S.; Ward, Z.J.; Cradock, A.L.; Gortmaker, S.L.; Blanck, H.M. State-specific prevalence of severe obesity among adults in the US using bias correction of self-reported body mass index. Prev. Chronic Dis. 2023, 20, E61. [Google Scholar] [CrossRef]
- Petersen, R.; Pan, L.; Blanck, H.M. Racial and Ethnic Disparities in Adult Obesity in the United States: CDC’s Tracking to Inform State and Local Action. Prev. Chronic Dis. 2019, 16, E46. (In English) [Google Scholar] [CrossRef] [PubMed]
- Pratt, C.A.; Loria, C.M.; Arteaga, S.S.; Nicastro, H.L.; Lopez-Class, M.; de Jesus, J.M.; Srinivas, P.; Maric-Bilkan, C.; Longacre, L.S.; Boyington, J.E.; et al. A Systematic Review of Obesity Disparities Research. Am. J. Prev. Med. 2017, 53, 113–122. (In English) [Google Scholar] [CrossRef] [PubMed]
- Krueger, P.M.; Reither, E.N. Mind the gap: Race/ethnic and socioeconomic disparities in obesity. Curr. Diab. Rep. 2015, 15, 95. (In English) [Google Scholar] [CrossRef]
- Cooper, A.J.; Gupta, S.R.; Moustafa, A.F.; Chao, A.M. Sex/Gender Differences in Obesity Prevalence, Comorbidities, and Treatment. Curr. Obes. Rep. 2021, 10, 458–466. (In English) [Google Scholar] [CrossRef]
- Stierman, B.; Afful, J.; Carroll, M.D.; Chen, T.C.; Davy, O.; Fink, S.; Fryar, C.D.; Gu, Q.; Hales, C.M.; Hughes, J.P.; et al. National Health and Nutrition Examination Survey 2017–March 2020 Prepandemic Data Files Development of Files and Prevalence Estimates for Selected Health Outcomes. Natl. Health Stat. Rep. 2021, 158, 10–15620. [Google Scholar] [CrossRef]
- Flegal, K.M.; Kit, B.K.; Orpana, H.; Graubard, B.I. Association of all-cause mortality with overweight and obesity using standard body mass index categories: A systematic review and meta-analysis. JAMA 2013, 309, 71–82. (In English) [Google Scholar] [CrossRef]
- Hatzenbuehler, M.L.; Keyes, K.M.; Hasin, D.S. Associations Between Perceived Weight Discrimination and the Prevalence of Psychiatric Disorders in the General Population. Obesity 2009, 17, 2033–2039. [Google Scholar] [CrossRef]
- Puhl, R.; Suh, Y. Stigma and eating and weight disorders. Curr. Psychiatry Rep. 2015, 17, 552. (In English) [Google Scholar] [CrossRef]
- Milaneschi, Y.; Simmons, W.K.; van Rossum, E.F.C.; Penninx, B.W. Depression and obesity: Evidence of shared biological mechanisms. Mol. Psychiatry 2019, 24, 18–33. (In English) [Google Scholar] [CrossRef] [PubMed]
- Meurling, I.J.; Shea, D.O.; Garvey, J.F. Obesity and sleep: A growing concern. Curr. Opin. Pulm. Med. 2019, 25, 602–608. (In English) [Google Scholar] [CrossRef] [PubMed]
- Apovian, C.M. Obesity: Definition, comorbidities, causes, and burden. Am. J. Manag. Care 2016, 22, s176–s185. (In English) [Google Scholar]
- Kim, T.J.; von dem Knesebeck, O. Income and obesity: What is the direction of the relationship? A systematic review and meta-analysis. BMJ Open 2018, 8, e019862. [Google Scholar] [CrossRef] [PubMed]
- Newton, S.; Braithwaite, D.; Akinyemiju, T.F. Socio-economic status over the life course and obesity: Systematic review and meta-analysis. PLoS ONE 2017, 12, e0177151. (In English) [Google Scholar] [CrossRef]
- United States Census Bureau. Quick Facts Mississippi. Available online: https://www.census.gov/quickfacts/MS (accessed on 11 November 2022).
- U.S. Department of Health and Human Services. Overview of the State-Mississippi-2021. Available online: https://mchb.tvisdata.hrsa.gov/Narratives/Overview/9a62acf8-1ab6-4e9a-b92f-9037110117e7 (accessed on 11 November 2022).
- Creamer, J.; Shrider, E.A.; Burns, K.; Chen, F. Poverty in the United States: 2021; United States Census Bureau: Suitland, MD, USA, 2022. Available online: https://www.census.gov/library/publications/2022/demo/p60-277.html#:~:text=Highlights-,Official%20Poverty%20Measure,37.9%20million%20people%20in%20poverty (accessed on 11 November 2022).
- Semega, J.; Kollar, M. Income in the United States: 2021; United States Census Bureau: Suitland, MD, USA, 2022. Available online: https://www.census.gov/library/publications/2022/demo/p60-276.html (accessed on 11 November 2022).
- United States Census Bureau. Census Bureau Releases New Educational Attainment Data; United States Census Bureau: Suitland, MD, USA, 2022. Available online: https://www.census.gov/newsroom/press-releases/2022/educational-attainment.html#:~:text=10.9%25%20in%202011.-,Sex,women%20and%2046.9%25%20were%20men (accessed on 11 November 2022).
- America’s Health Rankings. Food Insecurity in Mississippi; United Health Foundation: Eden Prairie, MN, USA, n.d. Available online: https://www.americashealthrankings.org/explore/annual/measure/food_insecurity_household/state/MS (accessed on 11 November 2022).
- America’s Health Rankings. Uninsured in Mississippi; United Health Foundation: Eden Prairie, MN, USA, n.d. Available online: https://www.americashealthrankings.org/explore/annual/measure/HealthInsurance/state/MS (accessed on 11 November 2022).
- Centers for Disease Control and Prevention. Behavioral Risk Factor Surveillance System; Centers for Disease Control and Prevention: Atlanta, GA, USA, 2025. Available online: https://www.cdc.gov/brfss/index.html (accessed on 6 January 2023).
- Centers for Disease Control and Prevention. Behavioral Risk Factor Surveillance System Overview: BRFSS 2021; Centers for Disease Control and Prevention: Atlanta, GA, USA, 2022. Available online: https://www.cdc.gov/brfss/annual_data/2021/pdf/Overview_2021-508.pdf (accessed on 6 January 2024).
- Centers for Disease Control and Prevention. Complex Sampling Weights and Preparing 2021 BRFSS Module Data for Analysis; Center for Disease Control and Prevention: Atlanta, GA, USA, 2022. Available online: https://www.cdc.gov/brfss/annual_data/2021/pdf/Complex-Sampling-Weights-and-Preparing-Module-Data-for-Analysis-2021-508.pdf (accessed on 6 January 2024).
- Mendy, V.L.; Vargas, R.; Cannon-Smith, G.; Payton, M. Overweight, Obesity, and Extreme Obesity Among Mississippi Adults, 2001–2010 and 2011–2015. Prev. Chronic. Dis. 2017, 14, E49. [Google Scholar] [CrossRef]
- Centers for Disease Control and Prevention. Adult BMI Categories; Centers for Disease Control and Prevention: Atlanta, GA, USA, 2024. Available online: https://www.cdc.gov/bmi/adult-calculator/bmi-categories.html?CDC_AAref_Val=https://www.cdc.gov/obesity/basics/adult-defining.html#cdc_generic_section_1-bmi-categories-for-adults (accessed on 6 January 2024).
- Centers for Disease Control and Prevention. Behavioral Risk Factor Surveillance System Comparability of Data BRFSS 2021; Center for Disease Control and Prevention: Atlanta, GA, USA, 2022. Available online: https://www.cdc.gov/brfss/annual_data/2021/pdf/Compare_2021-508.pdf (accessed on 6 January 2023).
- Meadows, A.; Bombak, A.E. Yes, We Can (No, You Can’t): Weight Stigma, Exercise Self-Efficacy, and Active Fat Identity Development. Fat Stud. 2019, 8, 135–153. [Google Scholar] [CrossRef]
- Thiel, A.; John, J.M.; Carl, J.; Thedinga, H.K. Weight Stigma Experiences and Physical (In)activity: A Biographical Analysis. Obes. Facts 2020, 13, 386–402. (In English) [Google Scholar] [CrossRef]
- Vartanian, L.R.; Shaprow, J.G. Effects of Weight Stigma on Exercise Motivation and Behavior:A Preliminary Investigation among College-aged Females. J. Health Psychol. 2008, 13, 131–138. [Google Scholar] [CrossRef]
- Dixon, J.B.; Dixon, M.E.; O’Brien, P.E. Depression in Association with Severe Obesity: Changes with Weight Loss. Arch. Intern. Med. 2003, 163, 2058–2065. [Google Scholar] [CrossRef]
- Faulconbridge, L.F.; Bechtel, C.F. Depression and Disordered Eating in the Obese Person. Curr. Obes. Rep. 2014, 3, 127–136. [Google Scholar] [CrossRef]
- Sockalingam, S.; Tehrani, H.; Taube-Schiff, M.; Van Exan, J.; Santiago, V.; Hawa, R. The relationship between eating psychopathology and obstructive sleep apnea in bariatric surgery candidates: A retrospective study. Int. J. Eat. Disord. 2017, 50, 801–807. [Google Scholar] [CrossRef] [PubMed]
- Gesta, S.; Blüher, M.; Yamamoto, Y.; Norris, A.W.; Berndt, J.; Kralisch, S.; Boucher, J.; Lewis, C.; Kahn, C.R. Evidence for a role of developmental genes in the origin of obesity and body fat distribution. Proc. Natl. Acad. Sci. USA 2006, 103, 6676–6681. [Google Scholar] [CrossRef] [PubMed]
- Lustig, R.H.; Collier, D.; Kassotis, C.; Roepke, T.A.; Kim, M.J.; Blanc, E.; Barouki, R.; Bansal, A.; Cave, M.C.; Chatterjee, S.; et al. Obesity I: Overview and molecular and biochemical mechanisms. Biochem. Pharmacol. 2022, 199, 115012. [Google Scholar] [CrossRef] [PubMed]
- Baez, A.S.; Ortiz-Whittingham, L.R.; Tarfa, H.; Baah, F.O.; Thompson, K.; Baumer, Y.; Powell-Wiley, T.M. Social determinants of health, health disparities, and adiposity. Prog. Cardiovasc. Dis. 2023, 78, 17–26. [Google Scholar] [CrossRef]
- Lee, A.; Cardel, M.; Donahoo, W.T. Social and Environmental Factors Influencing Obesity; Endotext: South Dartmouth, MA, USA, 2019. [Google Scholar]
- Folwell, E.J. The War on Poverty in Mississippi From Massive Resistance to New Conservatism. University Press of Mississippi; University Press of Mississippi: Jackson, MS, USA, 2020. [Google Scholar]
- Hossfeld, L.H.; Mendez, G.R. Looking For Food: Food Access, Food Insecurity, and the Food Environment in Rural Mississippi. Fam. Community Health 2018, 41, S7–S14. Available online: https://journals.lww.com/familyandcommunityhealth/fulltext/2018/04001/looking_for_food__food_access,_food_insecurity,.3.aspx (accessed on 29 April 2025). [CrossRef]
- Jack, L. Thinking Aloud About Poverty and Health in Rural Mississippi. Prev. Chronic Dis. 2007, 4, A71. [Google Scholar]
- Mendy, V.L.; Vargas, R.; Cannon-Smith, G.; Payton, M.; Enkhmaa, B.; Zhang, L. Food Insecurity and Cardiovascular Disease Risk Factors among Mississippi Adults. Int. J. Environ. Res. Public Health 2018, 15, 2016. Available online: https://www.mdpi.com/1660-4601/15/9/2016 (accessed on 29 April 2025). [CrossRef]
- Sommers, B.D.; Gawande, A.A.; Baicker, K. Health Insurance Coverage and Health—What the Recent Evidence Tells Us. N. Engl. J. Med. 2017, 377, 586–593. [Google Scholar] [CrossRef]
- Department of Finance and Administration. Mississippi State and School Employees’ Life and Health Insurance Plan. Department of Finance and Administration. Available online: https://www.dfa.ms.gov/sites/default/files/Insurance%20Home/2023%20New%20Information/September%202023%20Newsletter%20Final-1.pdf (accessed on 6 June 2025).
- Pennsylvania Department of Agriculture. Pennsylvania Fresh Food Financing Initiative. Available online: https://thefoodtrust.org/what-we-do/hffi/pa/ (accessed on 26 June 2025).
- The Mississippi Healthy Students Act, Mississippi Legislature Senate Bill 2369. 2007. Available online: https://mdek12.org/sites/default/files/documents/OHS/Home/Resources/HealthyStudentsAct/senatebill2369.pdf (accessed on 26 June 2025).
- Mississippi Department of Health. Mississippi’s State Employee Wellness Program (SEWP); Mississippi Department of Health: Jackson, MS, USA, n.d. Available online: https://msdh.ms.gov/msdhsite/index.cfm/43,0,277,html (accessed on 30 June 2025).
- An Act to Establish a Community Health Worker Certification Program in the State Department of Health. Mississippi Legislature House Bill 1401. 2025. Available online: https://billstatus.ls.state.ms.us/documents/2025/html/HB/1400-1499/HB1401PS.htm (accessed on 30 June 2025).
- Jawara, D.; Krebsbach, C.M.; Venkatesh, M.; Murtha, J.A.; Hanlon, B.M.; Lauer, K.V.; Stalter, L.N.; Funk, L.M. U.S. weight trends: A longitudinal analysis of an NIH-partnered dataset. Int. J. Obes. 2025, 49, 315–321. [Google Scholar] [CrossRef]


| Respondents were excluded from analysis if they were… |
| Pregnant at the time of the survey |
| Not non-Hispanic White or non-Hispanic Black |
| Missing data for any of the following: |
| Height or weight |
| Sex |
| Race/Ethnicity |
| Age |
| Education Level |
| Household Income |
| Characteristics | Weighted % (95% CI) |
|---|---|
| Age group, years | |
| 18–34 | 31.1 (30.5–31.7) |
| 35–49 | 23.8 (23.3–24.2) |
| 50–64 | 25.2 (24.8–25.6) |
| ≥65 | 20.0 (19.7–20.3) |
| Race | |
| White | 59.0 (58.4–59.5) |
| Black | 35.5 (35.0–36.1) |
| Sex | |
| Male | 47.8 (47.3–48.3) |
| Female | 52.2 (51.7–52.7) |
| Annual household income, USD | |
| <15,000 | 14.0 (13.6–14.4) |
| 15,000–24,999 | 19.3 (18.9–19.7) |
| 25,000–34,999 | 10.8 (10.4–11.1) |
| 35,000–49,999 | 11.4 (11.1–11.7) |
| 50,000–74,999 | 11.2 (10.9–11.5) |
| ≥75,000 | 16.5 (16.1–16.9) |
| Refused/Don’t know/Missing | 16.8 (16.4–17.2) |
| Education level | |
| <High school graduate | 18.0 (17.6–18.5) |
| High school graduate or equivalent | 30.4 (29.9–30.8) |
| Attended college or technical school | 33.0 (32.5–33.5) |
| Graduated from college or technical school | 18.6 (18.2–18.9) |
| Weight Status | Adjusted Prevalence, % | Trends Determined by Joinpoint Analysis | |||||||||||
|---|---|---|---|---|---|---|---|---|---|---|---|---|---|
| 2011 | 2012 | 2013 | 2014 | 2015 | 2016 | 2017 | 2018 | 2019 | 2020 | 2021 | APC e (95% CI) | p-Value | |
| Sample size, n | 8148 | 7112 | 6741 | 3823 | 5506 | 4602 | 4402 | 5227 | 4517 | 5809 | 3893 | ||
| Overall b | |||||||||||||
| Obesity | 28.8 | 29.1 | 29.1 | 29.8 | 28.4 | 30.7 | 30.1 | 32.0 | 33.4 | 32.0 | 31.2 | 1.3 (0.7–2.0) | 0.0013 |
| Severe Obesity | 6.1 | 5.6 | 6.0 | 6.3 | 7.3 | 6.9 | 7.6 | 8.1 | 8.3 | 8.3 | 9.3 | 4.8 (3.8–5.9) | <0.0001 |
| Sex c | |||||||||||||
| Male | |||||||||||||
| Obesity | 28.2 | 28.3 | 29.5 | 29.5 | 29.6 | 31.3 | 30.5 | 31.0 | 31.9 | 30.9 | 31.0 | 0.8 (−0.1–1.8) | 0.0710 |
| Severe Obesity | 4.2 | 4.0 | 4.8 | 4.4 | 4.6 | 4.4 | 5.9 | 5.6 | 5.5 | 5.2 | 6.2 | 3.6 (1.9–5.4) | 0.0011 |
| Female | |||||||||||||
| Obesity | 29.5 | 30.0 | 29.0 | 29.8 | 27.1 | 30.0 | 29.5 | 32.9 | 34.7 | 33.2 | 31.5 | 1.4 (0.35–2.55) | 0.0154 |
| Severe Obesity | 7.9 | 7.0 | 7.2 | 8.1 | 9.9 | 9.2 | 9.4 | 10.5 | 10.8 | 11.3 | 12.4 | 5.4 (3.9–6.9) | <0.0001 |
| Race d | |||||||||||||
| Black | |||||||||||||
| Obesity | 34.0 | 35.4 | 33.8 | 33.5 | 31.9 | 35.9 | 34.5 | 35.7 | 35.3 | 36.3 | 35.2 | 0.6 (−0.1–1.2) | 0.1030 |
| Severe Obesity | 9.4 | 7.7 | 8.9 | 9.3 | 11.9 | 10.5 | 11.1 | 10.5 | 11.3 | 12.6 | 13.1 | 4.1 (2.2 to 6.1) | 0.0009 |
| White | |||||||||||||
| Obesity | 25.8 | 25.5 | 26.4 | 27.7 | 26.4 | 27.5 | 27.4 | 29.8 | 32.1 | 29.6 | 28.7 | 1.8 (0.9–2.7) | 0.0012 |
| Severe Obesity | 4.1 | 4.3 | 4.3 | 4.6 | 4.6 | 4.8 | 5.6 | 6.7 | 6.4 | 5.8 | 7.1 | 5.5 (3.8–7.3) | <0.0001 |
| Weight Status | Adjusted Prevalence, % b | Trends Determined by Joinpoint Analysis | |||||||||||
|---|---|---|---|---|---|---|---|---|---|---|---|---|---|
| 2011 | 2012 | 2013 | 2014 | 2015 | 2016 | 2017 | 2018 | 2019 | 2020 | 2021 | APC c (95% CI) | p-Value | |
| Sample size, n | 8148 | 7112 | 6741 | 3823 | 5506 | 4602 | 4402 | 5227 | 4517 | 5809 | 3893 | ||
| Age Group | |||||||||||||
| 18–34 | |||||||||||||
| Obesity | 25.0 | 26.0 | 23.1 | 28.5 | 24.7 | 27.0 | 25.0 | 27.8 | 25.9 | 26.8 | 25.4 | 0.6 (−0.6–1.7) | 0.3172 |
| Severe Obesity | 5.9 | 4.6 | 6.4 | 5.3 | 7.2 | 4.5 | 8.5 | 7.7 | 7.5 | 8.6 | 9.4 | 5.5 (2.1–9.0) | 0.0051 |
| 35–49 | |||||||||||||
| Obesity | 31.9 | 32.1 | 34.8 | 34.4 | 33.6 | 36.6 | 32.7 | 35.6 | 39.1 | 33.4 | 33.1 | 0.9 (−0.4–2.1) | 0.1576 |
| Severe Obesity | 8.5 | 8.3 | 7.4 | 9.7 | 9.9 | 11.5 | 9.4 | 10.1 | 10.2 | 11.9 | 13.4 | 4.3 (2.2–6.4) | 0.0011 |
| 50–64 | |||||||||||||
| Obesity | 33.0 | 32.2 | 33.3 | 30.4 | 29.3 | −1.8 (−5.2–1.7) | 0.2568 | ||||||
| Obesity | 32.8 | 34.4 | 36.7 | 37.4 | 39.7 | 38.3 | 4.7 (2.7–6.8) | 0.0011 | |||||
| Severe Obesity | 6.7 | 6.0 | 6.9 | 7.0 | 7.5 | 7.7 | 8.1 | 9.7 | 10.8 | 7.8 | 10.5 | 4.9 (2.5–7.4) | 0.0011 |
| 65 and older | |||||||||||||
| Obesity | 25.3 | 26.0 | 25.9 | 25.9 | 26.7 | 27.0 | 29.2 | 28.3 | 32.1 | 29.1 | 28.3 | 1.8 (0.9–2.8) | 0.0018 |
| Severe Obesity | 2.9 | 3.5 | 2.7 | 3.2 | 4.2 | 3.8 | 3.9 | 4.3 | 4.1 | 4.3 | 3.6 | 3.4 (0.7–6.2) | 0.0193 |
| Weight Status | Adjusted Prevalence, % b | Trends Determined by Joinpoint Analysis | |||||||||||
|---|---|---|---|---|---|---|---|---|---|---|---|---|---|
| 2011 | 2012 | 2013 | 2014 | 2015 | 2016 | 2017 | 2018 | 2019 | 2020 | 2021 | APC c (95% CI) | p-Value | |
| Sample size, n | 8148 | 7112 | 6741 | 3823 | 5506 | 4602 | 4402 | 5227 | 4517 | 5809 | 3893 | ||
| Sex and Race | |||||||||||||
| White male | |||||||||||||
| Obesity | 28.5 | 26.1 | 28.5 | 30.4 | 29.5 | 29.6 | 28.6 | 31.5 | 33.5 | 31.4 | 29.8 | 1.4 (0.4–2.5) | 0.0120 |
| Severe Obesity | 3.0 | 4.1 | 4.6 | 4.2 | 3.7 | 4.3 | 5.1 | 5.3 | 5.3 | 4.7 | 5.6 | 4.6 (2.0–7.3) | 0.0032 |
| White female | |||||||||||||
| Obesity | 27.6 | 32.7 | 31.2 | 28.5 | 29.5 | 34.2 | 33.6 | 30.6 | 28.6 | 30.0 | 32.7 | 0.3 (−1.3–1.9) | 0.6601 |
| Severe Obesity | 6.7 | 4.2 | 5.3 | 4.9 | 6.3 | 4.5 | 7.1 | 5.9 | 5.4 | 5.8 | 6.9 | 1.4 (−2.3–5.2) | 0.4314 |
| Black male | |||||||||||||
| Obesity | 23.6 | 25.2 | 24.7 | 24.8 | 23.0 | 25.7 | 25.7 | 28.2 | 30.3 | 27.3 | 27.4 | 1.9 (0.7–3.1) | 0.0050 |
| Severe Obesity | 5.4 | 4.7 | 4.2 | 4.9 | 5.4 | 5.3 | 6.0 | 8.0 | 7.1 | 6.5 | 8.3 | 5.5 (2.6–8.4) | 0.0017 |
| Black female | |||||||||||||
| Obesity | 39.0 | 37.7 | 36.0 | 37.9 | 33.7 | 37.5 | 35.3 | 39.9 | 41.0 | 41.8 | 37.7 | 0.8 (−0.4–2.0) | 0.1600 |
| Severe Obesity | 12.1 | 10.9 | 12.1 | 13.4 | 16.8 | 15.6 | 14.1 | 14.3 | 16.2 | 18.2 | 17.7 | 4.5 (2.4–6.6) | 0.0008 |
Disclaimer/Publisher’s Note: The statements, opinions and data contained in all publications are solely those of the individual author(s) and contributor(s) and not of MDPI and/or the editor(s). MDPI and/or the editor(s) disclaim responsibility for any injury to people or property resulting from any ideas, methods, instructions or products referred to in the content. |
© 2025 by the authors. Licensee MDPI, Basel, Switzerland. This article is an open access article distributed under the terms and conditions of the Creative Commons Attribution (CC BY) license (https://creativecommons.org/licenses/by/4.0/).
Share and Cite
McLeod, S.; Gordy, X.Z.; Bagwell, J.; Ferrell, C.; Kolbo, J.; Zhang, L. Trends and Subgroup Comparisons of Obesity and Severe Obesity Prevalence Among Mississippi Adults, 2011–2021. Obesities 2025, 5, 52. https://doi.org/10.3390/obesities5030052
McLeod S, Gordy XZ, Bagwell J, Ferrell C, Kolbo J, Zhang L. Trends and Subgroup Comparisons of Obesity and Severe Obesity Prevalence Among Mississippi Adults, 2011–2021. Obesities. 2025; 5(3):52. https://doi.org/10.3390/obesities5030052
Chicago/Turabian StyleMcLeod, Stephanie, Xiaoshan Z. Gordy, Jana Bagwell, Christina Ferrell, Jerome Kolbo, and Lei Zhang. 2025. "Trends and Subgroup Comparisons of Obesity and Severe Obesity Prevalence Among Mississippi Adults, 2011–2021" Obesities 5, no. 3: 52. https://doi.org/10.3390/obesities5030052
APA StyleMcLeod, S., Gordy, X. Z., Bagwell, J., Ferrell, C., Kolbo, J., & Zhang, L. (2025). Trends and Subgroup Comparisons of Obesity and Severe Obesity Prevalence Among Mississippi Adults, 2011–2021. Obesities, 5(3), 52. https://doi.org/10.3390/obesities5030052