Article

Association Between Coffee Consumption and Visceral Obesity: A Cross-Sectional Study

Center for Preventive Medicine, NTT Medical Center Tokyo, 5-9-22 Higashi-Gotanda, Shinagawa-ku, Tokyo 141-8625, Japan
*
Author to whom correspondence should be addressed.
Obesities 2025, 5(1), 16; https://doi.org/10.3390/obesities5010016
Submission received: 17 January 2025 / Revised: 4 February 2025 / Accepted: 14 March 2025 / Published: 15 March 2025

Abstract

:
Objective: To investigate the association between coffee consumption and visceral obesity (VO). Methods: We conducted a retrospective, cross-sectional, observational study using data from 45,630 participants who underwent a general health check-up program at a medical center in Japan between 2015 and 2018. After excluding participants with missing data or duplicated visits, 19,253 subjects were included in the final analysis. Visceral fat area (VFA) was measured using computed tomography (CT), and data on metabolic disorders, history of lifestyle-related diseases, coffee consumption, and other lifestyle factors were collected via a self-administered questionnaire. Results: The mean ± SD VFA was 74.0 ± 49.7 cm2, and the mean ± SD age was 53.3 ± 9.8 years. The prevalence of VO (VFA ≥ 100 cm2) was 25.5%. The mean coffee consumption was 1.7 ± 1.3 cups per day. In multivariate logistic regression analysis, coffee consumption was significantly inversely associated with VO. Compared to non-coffee drinkers, the odds ratios (ORs) for VO were as follows: 1 or 2 cups/day (OR: 0.75, 95% confidence interval [CI]: 0.68–0.83), 3 or 4 cups/day (OR: 0.67, 95% CI: 0.59–0.75), and ≥5 cups/day (OR: 0.65, 95% CI: 0.53–0.80). In multiple linear regression analysis, coffee consumption was significantly associated with lower VFA (Model 3: β = −1.86, SE = 0.230, p < 0.05). Conclusions: Coffee consumption was significantly associated with lower VO.

1. Introduction

Obesity (body mass index [BMI] ≥ 30 kg/m2) causes multiple problems worldwide. The population with obesity has more than doubled between 1990 and 2022 [1]. In 2016, 11% of males and 15% of females suffered from obesity [1]. Obesity results from excessive fat accumulation due to an energy imbalance, with visceral fat contributing to insulin resistance, chronic inflammation, and an increased risk of metabolic syndrome (Mets) [2]. Mets includes visceral obesity (VO), hypertension, hyperglycemia, and lipid disorders, and is closely associated with the development of arteriosclerotic diseases [3]. VO can cause hypertension, lipid disorders, and diabetes because it is associated with the excretion of tumor necrosis factor-α (TNF-α) and plasminogen activator inhibitor-1 (PAI-1), as well as increases in free fatty acid levels. These factors cause changes in vascular endothelial cells and insulin resistance [4]. VO is one of the root causes of lifestyle-related and arteriosclerotic diseases. Lifestyle changes are necessary in the treatment of obesity [5], and changes in dietary habits will likely decrease obesity along with VO.
Coffee contains more than 1000 compounds, including caffeine and chlorogenic acid (CGA) [6], which are metabolized into small phenolic acids, such as caffeic acid and ferulic acid, which exhibit vasodilatory effects and contribute to vascular function improvement, inflammation suppression, and lipid metabolism regulation [7,8]. Furthermore, these metabolites have been shown to mitigate metabolic damage caused by high-fat diets and suppress fat accumulation. [8,9]. Recently, meta-analyses have reported that coffee consumption prevented lifestyle-related diseases, high blood pressure, diabetes, and Mets [10,11,12,13]. Another report showed that coffee consumption contributed to a decreased waist circumference (WC) [14]. To the best of our knowledge, only one study using computed tomography (CT) has reported a significant association between higher coffee intake and lower odds of visceral obesity (VO) (odds ratio [OR]: 0.746, 95% confidence interval [CI]: 0.588–0.947) [15]. However, large-scale studies on this topic remain limited, highlighting the need for further research.
This large-scale, cross-sectional, retrospective study aimed to determine whether coffee consumption was associated with VO.

2. Materials and Methods

2.1. Study Population

Participants were recruited during a general health check-up program at the Center of Preventive Medicine at NTT Medical Center Tokyo, Tokyo, Japan from 1 April 2015, to 31 March 2018. Participants were mainly in good health and lived around the Tokyo metropolitan area. A total of 45,630 participants were included in the study. Of these, 12,644 were excluded due to missing data, and 13,733 were excluded due to duplicated visits during the study period. To maintain data consistency and avoid overrepresentation, only the last visit for each participant was retained, resulting in a final study population of 19,253 subjects (Figure 1).

2.2. Anthropometry

Participants were weighed to the nearest 0.1 kg while barefoot and wearing light indoor clothing; height was measured to the nearest 0.1 cm using a stadiometer (Tanita Corp., Tokyo, Japan). BMI was reported as kg/m2. Systolic blood pressure (SBP; mmHg) and diastolic blood pressure (DBP; mmHg) were measured using an automated sphygmomanometer with subjects in a seated position. After 1 night of (12 h) fasting, serum samples were taken, and immediately after, analyzed using the general automated biochemical analyzer (Hitachi Corp., Hitachi, Japan) to determine high-density lipoprotein-cholesterol (HDL-C; mg/dL), triglycerides (TG; mg/dL), fasting blood glucose (mg/dL), and glycosylated hemoglobin (%) levels. The visceral fat area (VFA) was measured using CT, and fat scanning software was used for quantitative analysis (N2 System Co., Ltd., Hitachi, Japan).
A self-administered questionnaire was completed to gather data on arteriosclerotic disease (cardiovascular disease or cerebrovascular disease), lifestyle-related diseases (diabetes, high blood pressure, and metabolic lipid disorders), other illnesses, and lifestyle-related factors (coffee consumption, green tea consumption, alcohol consumption, smoking status, exercise frequency per week, frequency of eating breakfast, frequency of snacking between meals, and sleeping hours). The answers provided in the completed questionnaires were confirmed via interviews with well-trained nurses. To assess their daily consumption of coffee, we used a similar structure to the self-administered questionnaire that was validated for an adult population in Japan [16]. The Spearman correlation coefficient was 0.74 for coffee. Subjects reported the number of cups of coffee per day. A cup of coffee and a cup of green tea were each defined as 150 mL. Alcohol consumption was calculated by g/week.
We divided coffee consumption into 4 categories: none, 1 or 2 cups/day, 3 or 4 cups/day, and ≥5 cups/day [17]. Data regarding the subjects’ lifestyles were collected based on Breslow’s health habits and stratified as follows [18]: alcohol consumption [19,20] (non-drinker, <40 g/week; light drinker, ≥40 g and <140 g/week; moderate drinker, ≥140 g and <280 g/week; and heavy drinker, ≥280 g/week), smoking status [21] (nonsmoker, 0; light smoker, 1–9 cigarettes per day [CPD]; moderate smoker, 10–19 CPD; and heavy smoker, ≥20 CPD), exercise frequency per week (none; seldom, <1 time/week; sometimes, 1 time a week; and frequently, ≥2 times/week), sleeping hours (≥7 h, yes/no), eating breakfast every morning (yes/no), and snacking between meals ≥ 2 times/week (yes/no).
A metabolic disorder was defined according to the National Cholesterol Education Program Adult Treatment Panel III criteria [22]. Lipid-related disorders were defined as TG level ≥ 150 mg/dL, HDL-C level < 40 mg/dL (males) and <50 mg/dL (females), or the use of oral medications for lipid disorders. High blood pressure was defined as SBP ≥ 130 mmHg, DBP ≥ 85 mmHg, or the use of an antihypertensive drug. A metabolic glucose disorder was defined as a fasting blood glucose level ≥ 110 mg/dL or the use of an antidiabetic drug. VO was defined as VFA ≥ 100 cm2 [23].

2.3. Statistical Analysis

To evaluate the effect of coffee on VO, both categorical and continuous variables of coffee consumption were analyzed. Binary logistic regression analysis was performed with the presence of VO (VFA ≥ 100 cm2) as the dependent variable. Additionally, multiple linear regression analysis was performed, treating both VFA and coffee consumption as continuous variables. Independent variables were assessed using age, sex, lifestyle-related factors (green tea consumption, alcohol consumption, smoking status, exercise frequency per week, frequency of eating breakfast, frequency of snacking between meals, and sleeping hours), the presence of a metabolic disorder, and the presence of arteriosclerotic disease (cardiovascular disease or cerebrovascular disease), which were thought to be associated with VO [18,23]. Among these, age and green tea consumption were treated as continuous variables, whereas all other lifestyle factors, the presence of metabolic disorders, and history of arteriosclerotic diseases were treated as categorical or binary variables. The following three models were used in the analysis to perform sensitivity analysis as well: Model 1 included age and sex; Model 2 included age, sex, and lifestyle-related factors (green tea consumption, alcohol consumption, smoking status, exercise frequency per week, frequency of eating breakfast, frequency of snacking between meals, and sleeping hours); and Model 3 included age, sex, the lifestyle-related factors included in Model 2, the presence of a metabolic disorder, and the presence of arteriosclerotic disease (cardiovascular disease or cerebrovascular disease).
Values are reported as means ± standard deviation (SD) for continuous variables or prevalence rate (%) for categorical variables. A t-test was used for the analysis of continuous variables, while chi-squared tests were used for categorical variables. The stratified categorical variables were analyzed using the Cochran–Armitage test. Results were considered significant at p < 0.05 (two-tailed). All statistical analyses were conducted using EZR (Saitama Medical Center, Jichi Medical University, Saitama, Japan), which is a graphical user interface for R (The R Foundation for Statistical Computing, Vienna, Austria). More precisely, it is a modified version of R commander designed to add statistical functions frequently used in biostatistics [24].

2.4. Ethical Considerations

In Japan, the Occupational Health and Safety Law requires employers to provide annual health check-ups to ensure the health of their employees. To comply with this law, the Center for Preventive Medicine has contracted with NTT to provide periodic medical examinations to their employees. The details of health check-up packages include a comprehensive periodic medical examination and many more services than required by law, such as gastrofiberscope and CT scans. The data used in this study were collected from data created by the Center for Preventive Medicine as part of this general health check-up program. We did not specifically aim to collect new data for this study, so we extracted participants’ past clinical data from the institution’s database. We officially informed all participants that their clinical data obtained by the program might be retrospectively analyzed and published anonymously. It was announced on the website and in-hospital bulletin board of the NTT Medical Center Tokyo that participants could withdraw from the study at any time without negative consequences. Because this was a retrospective study, obtaining informed consent was difficult; therefore, the need for informed consent was waived by the review board. The study protocol was approved by the institutional ethics committee at the Center for Preventive Medicine (No. 18-119), and the protocol complied with the ethical guidelines of the 2000 Helsinki Declaration.

3. Results

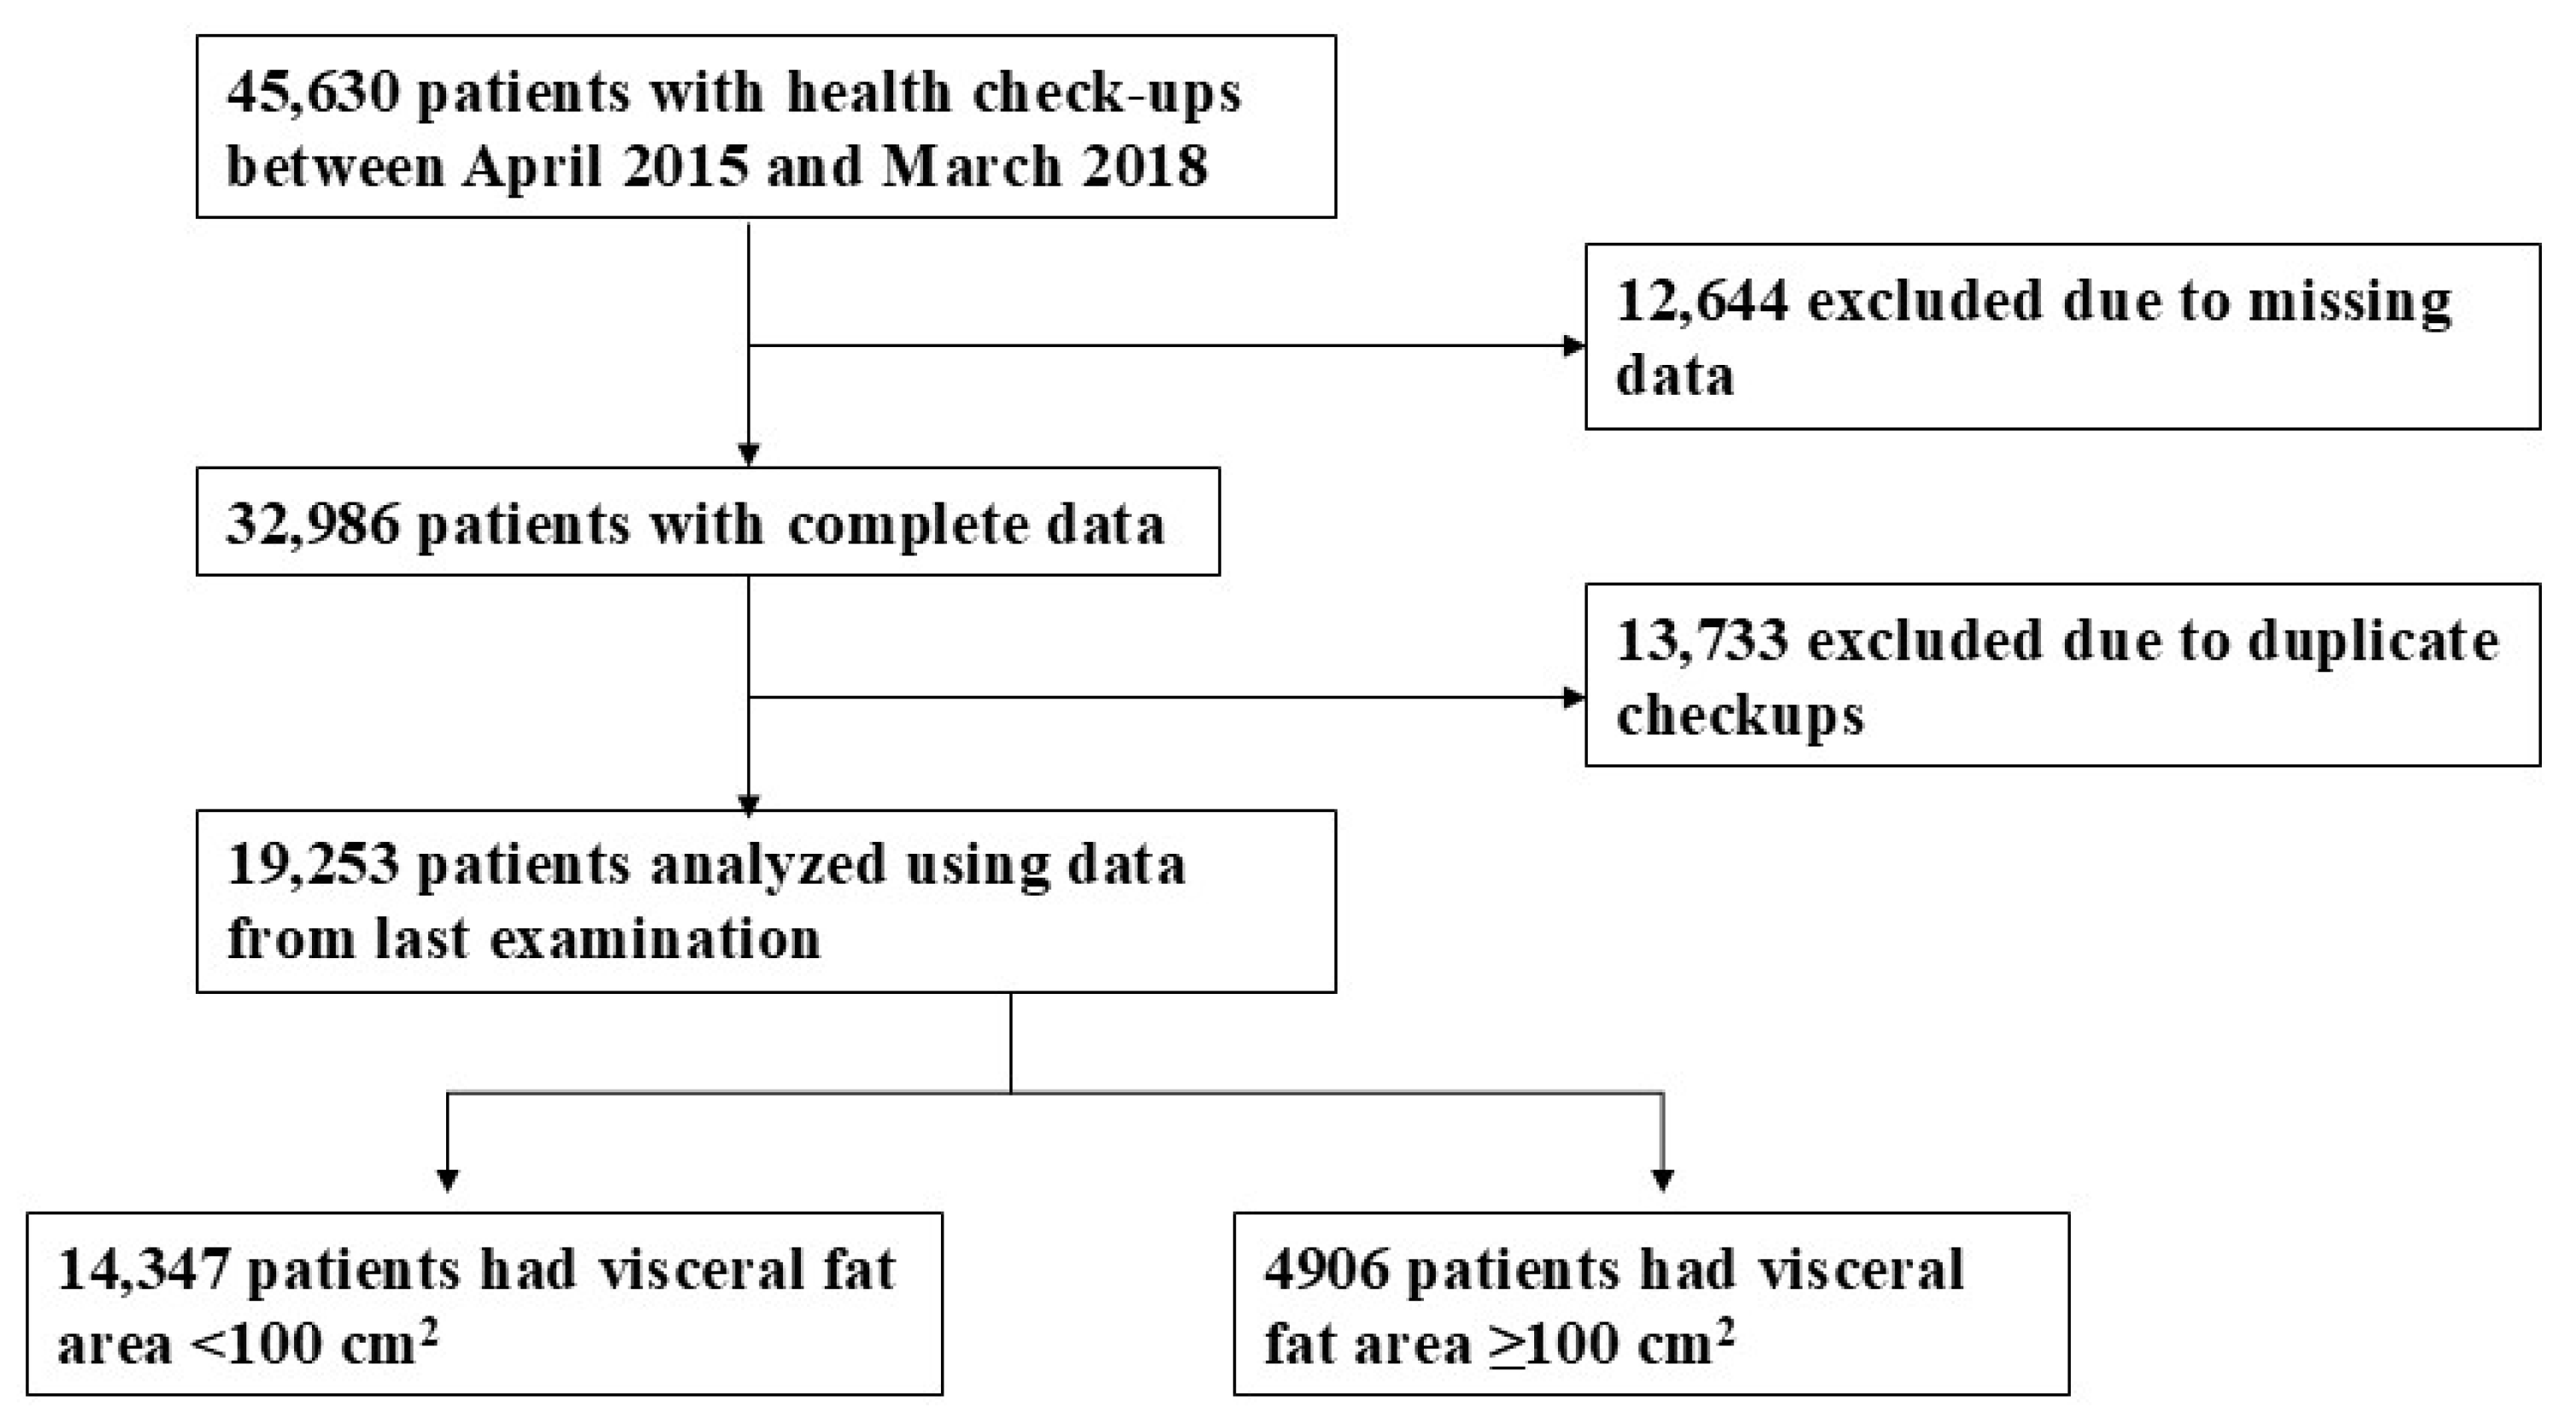
3.1. Study Participant Selection

Figure 1 illustrates the selection process of study participants, showing the exclusion of individuals due to missing data and duplicated visits, leading to a final sample size of 19,253 subjects.

3.2. Demographic Variables

Table 1 shows demographic variables in adult male and female subjects. A total of 19,253 subjects were included, with a mean VFA of 74.0 ± 49.7 cm2 and a mean age of 53.3 ± 9.8 years. The study sample comprised 15,120 males and 4133 females. The mean BMI was 23.5 ± 3.5 kg/m2.
Almost half of the subjects (9530; 49.5%) had high blood pressure, 6042 (31.4%) had metabolic lipid disorder (dyslipidemia), and 3709 (19.3%) had a metabolic glucose disorder. Three hundred and twelve (1.6%) subjects had a history of cardiovascular disease, and 292 (1.5%) had a history of cerebrovascular disease. Mean daily coffee consumption was 1.7 ± 1.3 cups/day with 15.7%, 59.6%, 20.3%, and 4.3% of participants consuming no coffee, 1 or 2 cups/day, 3 or 4 cups/day, and ≥5 cups/day, respectively.

3.3. Correlation of Coffee Consumption to Visceral Obesity

Table 2 shows the differences between subjects with and without VO. Participants with VO were significantly older and significantly more likely to be male (p < 0.05 for both). Patients with VO were significantly more likely to have high blood pressure, metabolic lipid disorder, a metabolic glucose disorder, or arteriosclerotic disease, to skip breakfast, and to consume green tea (p < 0.05 for all). VO significantly decreased as coffee consumption and exercise habits increased (p < 0.05 for both by the Cochran–Armitage test). In contrast, VO significantly increased as alcohol consumption and smoking increased (p < 0.05 for both, by the Cochran–Armitage test). There were no significant differences between VO among subjects who did or did not sleep ≥7 h daily or snack between meals.

3.4. Multivariate Regression Analysis Models

Table 3 presents the results of a multivariate regression analysis examining the association between VO and other factors. Coffee consumption was significantly inversely associated with VO in all models in a quantity-dependent fashion: 1 or 2 cups/day: OR 0.71, 95% CI: 0.64–0.78 in Model 1, OR 0.72, 95% CI: 0.65–0.79 in Model 2, and OR 0.75, 95% CI: 0.68–0.83 in Model 3 (p < 0.05 for all models); 3 or 4 cups/day: OR 0.61, 95% CI: 0.55–0.68 in Model 1, OR 0.62, 95% CI: 0.55–0.69 in Model 2, and OR 0.67, 95% CI: 0.59–0.75 in Model 3 (p < 0.05 for all models); ≥5 cups/day: OR 0.58, 95% CI: 0.48–0.70 in Model 1, OR 0.57, 95% CI: 0.47–0.68 in Model 2, and OR 0.65, 95% CI: 0.53–0.80 in Model 3 (p < 0.05 for all models). When analyzed as a continuous variable, higher coffee consumption was significantly inversely associated with VO (OR per 1 cup increase: 0.89, 95% CI: 0.87–0.92 in Model 1, OR 0.89, 95% CI: 0.87–0.92 in Model 2, and OR 0.91, 95% CI: 0.89–0.94 in Model 3; p < 0.05 for all models).

3.5. Multiple Linear Regression Analysis

Table 4 shows the multiple linear regression results for coffee consumption and VFA. Coffee intake was inversely associated with VFA across all models (Model 1: β = −2.70, SE = 0.25, p < 0.05; Model 2: β = −2.76, SE = 0.26, p < 0.05; Model 3: β = −1.86, SE = 0.23, p < 0.05).

4. Discussion

Our study suggests that coffee consumption is an independent predictor of VO and that increases in coffee consumption are associated with decreases in VO.
Some studies have shown an association between coffee consumption and the prevention of lifestyle-related diseases. A systematic meta-analysis of 18 studies (n = 457,922) revealed that coffee consumption inhibits type 2 diabetes mellitus (DM), with 1 cup of coffee daily decreasing the risk for onset of type 2 DM by 7.0% [11]. Another meta-analysis of 7 cohort studies (n = 205,349) showed that each cup of coffee consumed on a daily basis decreases the risk for hypertension by 1% [10]. A meta-analysis of 14 studies (n = 885) found a positive dose–response relationship between coffee intake and total and LDL-C levels [25]. However, in the same report, studies using filtered coffee showed minimal effects on serum cholesterol levels, and unfiltered coffee led to a significantly larger increase in serum cholesterol levels compared to filtered coffee [25]. The association between coffee intake and increased LDL-C levels is thought to be due to diterpenes in coffee oils, which are largely removed by filter paper [26]. On the other hand, some previous studies revealed decreased TG levels with coffee drinking [13,27,28,29], and that the consumption of filtered coffee had a beneficial effect on HDL-C levels [30]. Potential causes for the impact of coffee on lifestyle-related diseases include the promotion of insulin production by caffeine [31], improvement in insulin resistance by caffeine and CGA [32,33], the inhibition of sodium-glucose cotransporter by CGA in the small intestine [34], the inhibition of glucose release from the liver by inhibition of glucose-6-phosphatase [35], and the antioxidative effect and improvement of vascular endothelial function [36].
Mets is a complicated lifestyle-related disease. A meta-analysis of 13 studies suggested the presence of an inhibitory association between coffee consumption and Mets [12]. Another study reported that plasma adiponectin, which is negatively associated with VFA [37], has a positive correlation with coffee consumption [38,39,40]. These prior studies indicate that coffee consumption may directly affect systems involved in diabetes, hypertension, and metabolic lipid disorder, all of which are linked to VO.
However, comparisons between our study and previous studies are difficult because there are few previous studies regarding the association of waist circumference/VFA and coffee consumption [13,14,41,42], and no systematic review has been performed.
The connection between coffee consumption and VO may be due to several physiological mechanisms. The antagonist activity of adenosine receptors induced by caffeine is considered to cause increased lipolysis activity, heat production, and norepinephrine emission [43,44], as well as increased energy consumption at rest [45]. However, another study reported that decaffeinated coffee consumption helped maintain body weight [31]. Therefore, substances other than caffeine could be associated with the maintenance of body weight. CGA, a coffee polyphenol, could also help maintain body weight. CGA is associated with the inhibition of lipid levels of the liver and other organs in mice fed a high-fat diet, and it was reported that fat production was inhibited by decreased activity of acetyl-CoA carboxylase caused by CGA, which, in turn, boosts energy metabolism [46]. Moreover, another study suggested that CGA inhibits glucose transporters in the small intestine brush border membrane [34] and inhibits the absorption of carbohydrates via its inhibition of alpha glucosidase activity [47].
Considering the previously mentioned study findings, we think that the (1) increased energy consumption by caffeine and CGA, (2) inhibition of carbohydrate absorption by CGA, and (3) inhibition of fat synthesis by CGA may combine to explain how coffee consumption may contribute to lower VO.
Some limitations of the present study should be recognized. First, our study was a cross-sectional study affected by selection bias. More than 70% of participants were healthy office workers aged 40–60 years, and few females participated. As a result, our study did not accurately represent the entire Japanese population. Collaborative research with other facilities with a sufficient number of women and elderly subjects is needed. Second, as this is a cross-sectional and retrospective study, it is possible that subjects’ current diets may have been affected by illness or other confounding factors that were not measured. In addition, the retrospective nature of our study cannot show cause-and-effect outcomes, and reverse causality cannot be ruled out as a contributor to these associations. Further prospective studies are needed to investigate the relationship between coffee consumption and the risk of VO. Third, while we defined a cup of coffee as 150 mL, we did not collect detailed information on coffee type (e.g., caffeinated or decaffeinated, with or without sugar or milk). These variations may have influenced our findings. Fourth, although green tea consumption was included in our analysis, we lacked detailed dietary intake data, including total caloric intake, which could have affected VO. Finally, these results cannot be generalized to other populations.

5. Conclusions

As far as we know, no other large-scale study has reported the relationship between coffee consumption and VO. Our study suggests that coffee consumption has an independent and significant association with multiple factors associated with VO, which is one of the root causes of Mets and lifestyle-related diseases.

Author Contributions

Conceptualization, Y.H. and T.G.; methodology, Y.H. and T.G.; formal analysis, Y.H.; validation, Y.H.; investigation, Y.H., N.S., H.T., and T.G.; resources, Y.H., N.S., H.T., and T.G.; data curation, Y.H., N.S., H.T., and T.G.; writing—original draft preparation, Y.H.; writing—review and editing, Y.H., N.S., H.T., and T.G.; visualization, Y.H.; supervision, T.G.; project administration, T.G.; funding acquisition, Y.H. All authors have read and agreed to the published version of the manuscript.

Funding

The study was supported by a research grant from the Association for Fordays Self-Reliance Support in Japan (Grant Number: AM224BHA01).

Institutional Review Board Statement

The study protocol was approved by the Institutional Review Board of the Center for Preventive Medicine, NTT Medical Center Tokyo (No. 18-119) and complied with the ethical guidelines of the 2000 Helsinki Declaration.

Informed Consent Statement

Informed consent was waived due to the observational nature of this cross-sectional study and the use of anonymized data.

Data Availability Statement

The data presented in this study are available upon request from the corresponding author. The data are not publicly available due to ethical issues.

Acknowledgments

The authors wish to thank all participants who underwent the voluntary health check-up, as well as the data collection staff at the Center for Preventive Medicine, NTT Medical Center Tokyo.

Conflicts of Interest

The authors declare no conflicts of interest.

References

  1. WHO. Obesity and Overweight. Available online: https://www.who.int/news-room/fact-sheets/detail/obesity-and-overweight (accessed on 6 January 2025).
  2. Milhem, F.; Komarnytsky, S. Progression to Obesity: Variations in Patterns of Metabolic Fluxes, Fat Accumulation, and Gastrointestinal Responses. Metabolites 2023, 13, 1016. [Google Scholar] [CrossRef] [PubMed]
  3. Eckel, R.H.; Grundy, S.M.; Zimmet, P.Z. The metabolic syndrome. Lancet 2005, 365, 1415–1428. [Google Scholar] [CrossRef] [PubMed]
  4. Matsuzawa, Y.; Funahashi, T.; Kihara, S.; Shimomura, I. Adiponectin and Metabolic Syndrome. Arterioscler. Thromb. Vasc. Biol. 2004, 24, 29–33. [Google Scholar] [CrossRef] [PubMed]
  5. Khan, L.K.; Sobush, K.; Keener, D.; Goodman, K.; Lowry, A.; Kakietek, J.; Zaro, S.; Centers for Disease Control and Prevention. Recommended community strategies and measurements to prevent obesity in the United States. MMWR Recomm. Rep. 2009, 58, 1–26. [Google Scholar]
  6. Nieber, K. The Impact of Coffee on Health. Planta Med. 2017, 83, 1256–1263. [Google Scholar] [CrossRef]
  7. Mills, C.E.; Flury, A.; Marmet, C.; Poquet, L.; Rimoldi, S.F.; Sartori, C.; Rexhaj, E.; Brenner, R.; Allemann, Y.; Zimmermann, D.; et al. Mediation of coffee-induced improvements in human vascular function by chlorogenic acids and its metabolites: Two randomized, controlled, crossover intervention trials. Clin. Nutr. 2017, 36, 1520–1529. [Google Scholar] [CrossRef]
  8. Skates, E.; Overall, J.; DeZego, K.; Wilson, M.; Esposito, D.; Lila, M.A.; Komarnytsky, S. Berries containing anthocyanins with enhanced methylation profiles are more effective at ameliorating high fat diet-induced metabolic damage. Food Chem. Toxicol. 2018, 111, 445–453. [Google Scholar] [CrossRef]
  9. Jackson, K.M.P.; Rathinasabapathy, T.; Esposito, D.; Komarnytsky, S. Structural constraints and importance of caffeic acid moiety for anti-hyperglycemic effects of caffeoylquinic acids from chicory. Mol. Nutr. Food Res. 2017, 61, 1601118. [Google Scholar] [CrossRef]
  10. Grosso, G.; Micek, A.; Godos, J.; Pajak, A.; Sciacca, S.; Bes-Rastrollo, M.; Galvano, F.; Martinez-Gonzalez, M.A. Long-term coffee consumption is associated with decreased incidence of new-onset hypertension: A dose–response meta-analysis. Nutrients 2017, 9, 890. [Google Scholar] [CrossRef]
  11. Huxley, R.; Lee, C.M.Y.; Barzi, F.; Timmermeister, L.; Czernichow, S.; Perkovic, V.; Grobbee, D.E.; Batty, D.; Woodward, M. Coffee, decaffeinated coffee, and tea consumption in relation to incident type 2 diabetes mellitus: A systematic review with meta-analysis. Arch. Intern. Med. 2009, 169, 2053–2063. [Google Scholar] [CrossRef]
  12. Shang, F.; Li, X.; Jiang, X. Coffee consumption and risk of the metabolic syndrome: A meta-analysis. Diabetes Metab. 2016, 42, 80–87. [Google Scholar] [CrossRef]
  13. Hino, A.; Adachi, H.; Enomoto, M.; Furuki, K.; Shigetoh, Y.; Ohtsuka, M.; Kumagae, S.-I.; Hirai, Y.; Jalaldin, A.; Satoh, A.; et al. Habitual coffee but not green tea consumption is inversely associated with metabolic syndrome. An epidemiological study in a general Japanese population. Diabetes Res. Clin. Pract. 2007, 76, 383–389. [Google Scholar] [CrossRef] [PubMed]
  14. Zhang, Y.; Lee, E.T.; Cowan, L.D.; Fabsitz, R.R.; Howard, B.V. Coffee consumption and the incidence of type 2 diabetes in men and women with normal glucose tolerance: The Strong Heart Study. Nutr. Metab. Cardiovasc. Dis. 2011, 21, 418–423. [Google Scholar] [CrossRef]
  15. Koyama, T.; Maekawa, M.; Ozaki, E.; Kuriyama, N.; Uehara, R. Daily Consumption of Coffee and Eating Bread at Breakfast Time Is Associated with Lower Visceral Adipose Tissue and with Lower Prevalence of Both Visceral Obesity and Metabolic Syndrome in Japanese Populations: A Cross-Sectional Study. Nutrients 2020, 12, 3090. [Google Scholar] [CrossRef]
  16. Lee, K.Y.; Uchida, K.; Shirota, T.; Kono, S. Validity of a self-administered food frequency questionnaire against 7-day dietary records in four seasons. J. Nutr. Sci. Vitaminol. 2002, 48, 467–476. [Google Scholar] [CrossRef] [PubMed]
  17. Yamaji, T.; Mizoue, T.Y.T.; Tabata, S.; Ogawa, S.T.S.; Yamaguchi, K.; Shimizu, E.; Mineshita, M.; Kono, S. Coffee consumption and glucose tolerance status in middle-aged Japanese men. Diabetologia 2004, 47, 2145–2151. [Google Scholar] [CrossRef] [PubMed]
  18. Belloc, N.B.; Breslow, L. Relationship of physical health status and health practices. Prev. Med. 1972, 1, 409–421. [Google Scholar] [CrossRef]
  19. Suzuki, A.; Angulo, P.; St Sauver, J.; Muto, A.; Okada, T.; Lindor, K. Light to moderate alcohol consumption is associated with lower frequency of hypertransaminasemia. Am. J. Gastroenterol. 2007, 102, 1912–1919. [Google Scholar] [CrossRef]
  20. Gunji, T.; Matsuhashi, N.; Sato, H.; Fujibayashi, K.; Okumura, M.; Sasabe, N.; Urabe, A. Light and moderate alcohol consumption significantly reduces the prevalence of fatty liver in the Japanese male population. Am. J. Gastroenterol. 2009, 104, 2189–2195. [Google Scholar] [CrossRef]
  21. Pierce, J.P.; Messer, K.; White, M.M.; Cowling, D.W.; Thomas, D.P. Prevalence of heavy smoking in California and the United States, 1965–2007. JAMA 2011, 305, 1106–1112. [Google Scholar] [CrossRef]
  22. Expert Panel on Detection, Evaluation, and Treatment of High Blood Cholesterol in Adults. Executive Summary of the Third Report of the National Cholesterol Education Program (NCEP) Expert Panel on Detection, Evaluation, and Treatment of High Blood Cholesterol in Adults (Adult Treatment Panel III). JAMA J. Am. Med. Assoc. 2001, 285, 2486–2497. [Google Scholar] [CrossRef] [PubMed]
  23. Hiuge-Shimizu, A.; Kishida, K.; Funahashi, T.; Ishizaka, Y.; Oka, R.; Okada, M.; Suzuki, S.; Takaya, N.; Nakagawa, T.; Fukui, T.; et al. Absolute value of visceral fat area measured on computed tomography scans and obesity-related cardiovascular risk factors in large-scale Japanese general population (the VACATION-J study). Ann. Med. 2012, 44, 82–92. [Google Scholar] [CrossRef] [PubMed]
  24. Kanda, Y. Investigation of the freely available easy-to-use software “EZR” for medical statistics. Bone Marrow Transplant. 2013, 48, 452–458. [Google Scholar] [CrossRef] [PubMed]
  25. Jee, S.H.; He, J.; Appel, L.J.; Whelton, P.K.; Suh, I.I.; Klag, M.J. Coffee Consumption and Serum Lipids: A Meta-Analysis of Randomized Controlled Clinical Trials. Am. J. Epidemiol. 2001, 153, 353–362. [Google Scholar] [CrossRef]
  26. Bae, J.-H.; Park, J.-H.; Im, S.-S.; Song, D.-K. Coffee and health. Integr. Med. Res. 2014, 3, 189–191. [Google Scholar] [CrossRef]
  27. Matsuura, H.; Mure, K.; Nishio, N.; Kitano, N.; Nagai, N.; Takeshita, T. Relationship between coffee consumption and prevalence of metabolic syndrome among Japanese civil servants. J. Epidemiol. 2012, 22, 160–166. [Google Scholar] [CrossRef]
  28. Takami, H.; Nakamoto, M.; Uemura, H.; Katsuura, S.; Yamaguchi, M.; Hiyoshi, M.; Sawachika, F.; Juta, T.; Arisawa, K. Inverse Correlation Between Coffee Consumption and Prevalence of Metabolic Syndrome: Baseline Survey of the Japan Multi-Institutional Collaborative Cohort (J-MICC) Study in Tokushima, Japan. J. Epidemiol. 2013, 23, 12–20. [Google Scholar] [CrossRef]
  29. Lancaster, T.; Muir, J.; Silagy, C. The effects of coffee on serum lipids and blood pressure in a UK population. J. R. Soc. Med. 1994, 87, 506–507. [Google Scholar] [CrossRef]
  30. Kempf, K.; Herder, C.; Erlund, I.; Kolb, H.; Martin, S.; Carstensen, M.; Koenig, W.; Sundvall, J.; Bidel, S.; Kuha, S.; et al. Effects of coffee consumption on subclinical inflammation and other risk factors for type 2 diabetes: A clinical trial. Am. J. Clin. Nutr. 2010, 91, 950–957. [Google Scholar] [CrossRef]
  31. Greenberg, J.A.; Axen, K.V.; Schnoll, R.; Boozer, C.N. Coffee, tea and diabetes: The role of weight loss and caffeine. Int. J. Obes. 2005, 29, 1121–1129. [Google Scholar] [CrossRef]
  32. Higdon, J.V.; Frei, B. Coffee and Health: A Review of Recent Human Research. Crit. Rev. Food Sci. Nutr. 2006, 46, 101–123. [Google Scholar] [CrossRef] [PubMed]
  33. Rodriguez de Sotillo, D.V.; Hadley, M. Chlorogenic acid modifies plasma and liver concentrations of: Cholesterol, triacylglycerol, and minerals in (fa/fa) Zucker rats. J. Nutr. Biochem. 2002, 13, 717–726. [Google Scholar] [CrossRef] [PubMed]
  34. Baspinar, B.; Eskici, G.; Ozcelik, A.O. How coffee affects metabolic syndrome and its components. Food Funct. 2017, 8, 2089–2101. [Google Scholar] [CrossRef]
  35. Arion, W.J.; Canfield, W.K.; Ramos, F.C.; Schindler, P.W.; Burger, H.J.; Hemmerle, H.; Schubert, G.; Below, P.; Herling, A.W. Chlorogenic acid and hydroxynitrobenzaldehyde: New inhibitors of hepatic glucose 6-phosphatase. Arch. Biochem. Biophys. 1997, 339, 315–322. [Google Scholar] [CrossRef] [PubMed]
  36. Zhao, Y.; Wang, J.; Ballevre, O.; Luo, H.; Zhang, W. Antihypertensive effects and mechanisms of chlorogenic acids. Hypertens. Res. 2012, 35, 370–374. [Google Scholar] [CrossRef]
  37. Matsuzawa, Y. Therapy Insight: Adipocytokines in metabolic syndrome and related cardiovascular disease. Nat. Clin. Pract. Cardiovasc. Med. 2006, 3, 35–42. [Google Scholar] [CrossRef]
  38. Yamashita, K.; Yatsuya, H.; Muramatsu, T.; Toyoshima, H.; Murohara, T.; Tamakoshi, K. Association of coffee consumption with serum adiponectin, leptin, inflammation and metabolic markers in Japanese workers: A cross-sectional study. Nutr. Diabetes 2012, 2, e33–e36. [Google Scholar] [CrossRef]
  39. Williams, C.J.; Fargnoli, J.L.; Hwang, J.J.; van Dam, R.M.; Blackburn, G.L.; Hu, F.B.; Mantzoros, C.S. Coffee consumption is associated with higher plasma adiponectin concentrations in women with or without type 2 diabetes: A prospective cohort study. Diabetes Care 2008, 31, 504–507. [Google Scholar] [CrossRef]
  40. Imatoh, T.; Tanihara, S.; Miyazaki, M.; Momose, Y.; Uryu, Y.; Une, H. Coffee consumption but not green tea consumption is associated with adiponectin levels in Japanese males. Eur. J. Nutr. 2011, 50, 279–284. [Google Scholar] [CrossRef]
  41. Mure, K.; Maeda, S.; Mukoubayashi, C.; Mugitani, K.; Iwane, M.; Kinoshita, F.; Mohara, O.; Takeshita, T. Habitual coffee consumption inversely associated with metabolic syndrome-related biomarkers involving adiponectin. Nutrition 2013, 29, 982–987. [Google Scholar] [CrossRef]
  42. Grosso, G.; Stepaniak, U.; Micek, A.; Topor-Mądry, R.; Pikhart, H.; Szafraniec, K.; Pająk, A. Association of daily coffee and tea consumption and metabolic syndrome: Results from the Polish arm of the HAPIEE study. Eur. J. Nutr. 2015, 54, 1129–1137. [Google Scholar] [CrossRef] [PubMed]
  43. Van Soeren, M.H.; Graham, T.E. Effect of caffeine on metabolism, exercise endurance, and catecholamine responses after withdrawal. J. Appl. Physiol. 1998, 85, 1493–1501. [Google Scholar] [CrossRef] [PubMed]
  44. Fisone, G.; Borgkvist, A.; Usiello, A. Caffeine as a psychomotor stimulant: Mechanism of action. Cell Mol. Life Sci. 2004, 61, 857–872. [Google Scholar] [CrossRef]
  45. Astrup, A.; Toubro, S.; Cannon, S.; Hein, P.; Breum, L.; Madsen, J. Caffeine: A double-blind, placebo-controlled study of its thermogenic, metabolic, and cardiovascular effects in healthy volunteers. Am. J. Clin. Nutr. 1990, 51, 759–767. [Google Scholar] [CrossRef] [PubMed]
  46. Murase, T.; Misawa, K.; Minegishi, Y.; Aoki, M.; Ominami, H.; Suzuki, Y.; Shibuya, Y.; Hase, T. Coffee polyphenols suppress diet-induced body fat accumulation by downregulating SREBP-1c and related molecules in C57BL/6J mice. Am. J. Physiol. Metab. 2011, 300, E122–E133. [Google Scholar] [CrossRef]
  47. Oboh, G.; Agunloye, O.M.; Adefegha, S.A.; Akinyemi, A.J.; Ademiluyi, A.O. Caffeic and chlorogenic acids inhibit key enzymes linked to type 2 diabetes (in vitro): A comparative study. J. Basic. Clin. Physiol. Pharmacol. 2015, 26, 165–170. [Google Scholar] [CrossRef]
Figure 1. Study flowchart.
Obesities 05 00016 g001
Table 1. Clinical characteristics and daily coffee consumption.
Variable
n19,253
Age (years), mean (SD)53.3 (9.8)
Sex (male), n (%)15,120 (78.5)
Body mass index (kg/m2), mean (SD)23.5 (3.5)
Waist circumference (cm), mean (SD)84.6 (9.4)
Visceral fat area (cm2), mean (SD)74.0 (49.7)
Atherosclerotic complications
 Cardiovascular disease (yes), n (%)312 (1.6)
 Cerebrovascular disease (yes), n (%)292 (1.5)
Hypertension-related factors
 Systolic blood pressure (mmHg), mean (SD)126.8 (19.0)
 Diastolic blood pressure (mmHg), mean (SD)78.2 (12.9)
 Antihypertensive drug use (yes), n (%)3510 (18.2)
 High blood pressure (yes), n (%)9530 (49.5)
Lipid-related items
 High-density lipoprotein cholesterol (mg/dL), mean (SD)59.0 (15.4)
 Low-density lipoprotein cholesterol (mg/dL), mean (SD)116.6 (29.0)
 Triglycerides (mg/dL), mean (SD)114.1 (81.3)
 Antidyslipidemic drug use (yes), n (%)1992 (10.3)
 Metabolic lipid disorder (yes), n (%)6042 (31.4)
Diabetes-related items
 Fasting plasma glucose (mg/dL), mean (SD)102.7 (20.2)
 HbA1c, mean (SD)5.7 (0.7)
 Antidiabetic drug use (yes), n (%)1026 (5.3)
 Metabolic glucose disorder (yes), n (%)3709 (19.3)
Lifestyle characteristics
  Daily coffee consumption (cups/day), mean (SD)1.7 (1.3)
 None, n (%)3018 (15.7)
 1 or 2 cups/day, n (%)11,483 (59.6)
 3 or 4 cups/day, n (%)3917 (20.3)
 ≥5 cups/day, n (%)835 (4.3)
  Daily green tea consumption (cups/day), mean (SD)1.4 (1.5)
  Alcohol consumption
 Nondrinker, n (%)8747 (45.4)
 Light drinker, n (%)4159 (21.6)
 Moderate drinker, n (%)3447 (17.9)
 Heavy drinker, n (%)2900 (15.1)
  Exercise frequency per week
 None, n (%)8533 (44.3)
 Seldom, n (%)2996 (15.6)
 Sometimes, n (%)1746 (9.1)
 Frequently, n (%)5978 (31.0)
  Smoking status
 Nonsmoker, n (%)14,932 (77.6)
 Light smoker, n (%)427 (2.2)
 Moderate smoker, n (%)1904 (9.9)
 Heavy smoker, n (%)1990 (10.3)
  Sleeping hours (≥7 h), n (%) 6493 (33.7)
  Breakfast every morning (yes), n (%)15,984 (83.0)
  Snack between meals (no), n (%)75 (0.4)
SD, standard deviation.
Table 2. Comparison of clinical characteristics and lifestyle habits according to visceral obesity.
VariableVisceral Fat Area
<100 cm2 ≥100 cm2p Value
n14,3474906
Age (years), mean (SD)52.4 (9.8)55.9 (9.2)<0.05
Sex (male), n (%)10,558 (73.6) 4562 (93.0) <0.05
Body mass index (kg/m2), mean (SD)22.4 (2.7)26.75 (3.4)<0.05
Waist circumference (cm), mean (SD)81.4 (7.4)94.1 (8.1)<0.05
Atherosclerotic complications
 Cardiovascular disease (yes), n (%)173 (1.2) 139 (2.8) <0.05
 Cerebrovascular disease (yes), n (%)189 (1.3) 103 (2.1) <0.05
Hypertension-related factors
Systolic blood pressure (mmHg), mean (SD)124.1 (18.6)134.5 (18.0)<0.05
Diastolic blood pressure (mmHg), mean (SD)76.4 (12.7)83.5 (12.2)<0.05
 Antihypertensive drug use (yes), n (%)1737 (12.1) 1773 (36.1) <0.05
 High blood pressure (yes), n (%) 5910 (41.2) 3620 (73.8) <0.05
Lipid-related items
 High-density lipoprotein cholesterol (mg/dL), mean (SD)61.8 (15.5)50.9 (11.7)<0.05
 Low-density lipoprotein cholesterol (mg/dL), mean (SD)114.8 (28.6)121.8 (29.6)<0.05
 Triglycerides (mg/dL), mean (SD)99.1 (66.2)157.8 (102.9)<0.05
 Antidyslipidemic drug use (yes), n (%)1093 (7.6) 899 (18.3) <0.05
 Metabolic lipid disorder (yes), n (%)3276 (22.8) 2766 (56.4) <0.05
Diabetes-related items
Fasting plasma glucose (mg/dL), mean (SD)99.5 (16.4)112.1 (26.3)<0.05
 HbA1c, mean (SD)5.6 (0.5)6.0 (0.9)<0.05
 Antidiabetic drug use (yes), n (%)454 (3.2) 572 (11.7) <0.05
 Metabolic glucose disorder (yes), n (%)1843 (12.8) 1866 (38.0) <0.05
Lifestyle characteristics
  Daily coffee consumption (cups/day), mean (SD)1.8 (1.3)1.6 (1.3)<0.05
 None, n (%)2071 (14.4) 947 (19.3) <0.05*
 1 or 2 cups/day, n (%)8630 (60.2) 2853 (58.2)
 3 or 4 cups/day, n (%)3005 (20.9) 912 (18.6)
 ≥5 cups/day, n (%)641 (4.5) 194 (4.0)
  Daily green tea consumption (cups/day), mean (SD)1.4 (1.5)1.5 (1.5)<0.05
  Alcohol consumption
 Nondrinker, n (%)6816 (47.5) 1931 (39.4) <0.05*
 Light drinker, n (%)3161 (22.0) 998 (20.3)
 Moderate drinker, n (%)2471 (17.2) 976 (19.9)
 Heavy drinker, n (%)1899 (13.2) 1001 (20.4)
  Exercise frequency per week
 None, n (%)6102 (42.5) 2431 (49.6) <0.05*
 Seldom, n (%)2230 (15.5) 766 (15.6)
 Sometimes, n (%)1352 (9.4) 394 (8.0)
 Frequently, n (%)4663 (32.5) 1315 (26.8)
  Smoking status
 Nonsmoker, n (%)11,345 (79.1) 3587 (73.1) <0.05*
 Light smoker, n (%)329 (2.3) 98 (2.0)
 Moderate smoker, n (%)1364 (9.5) 540 (11.0)
 Heavy smoker, n (%)1309 (9.1) 681 (13.9)
  Sleeping hours ( ≥ 7 h), n (%) 4782 (33.3) 1711 (34.9) 0.05
  Breakfast every morning (yes), n (%)11,982 (83.5) 4002 (81.6) <0.05
  Snack between meals (no), n (%)55 (0.4) 20 (0.4) 0.79
* Significant difference on the Cochran–Armitage test.
Table 3. Results of logistic regression analysis correlation between coffee consumption and visceral obesity (VFA ≥100 cm2).
Model 1 Model 2 Model 3
OR (95% CI)p ValueOR (95% CI)p ValueOR (95% CI)p Value
Daily coffee consumption
1 or 2 cups/day0.71 (0.64–0.78)<0.050.72 (0.65–0.79)<0.050.75 (0.68–0.83)<0.05
3 or 4 cups/day0.61 (0.55–0.68)<0.050.62 (0.55–0.69)<0.050.67 (0.59–0.75)<0.05
≥5 cups/day0.58 (0.48–0.70)<0.050.57 (0.47–0.68)<0.050.65 (0.53–0.80)<0.05
Continuous variable0.89 (0.87–0.92)<0.050.89 (0.87–0.92)<0.050.91 (0.89–0.94)<0.05
Model 1 was adjusted for age and sex. Model 2 was adjusted for lifestyle-related factors (green tea consumption, alcohol consumption, smoking behavior, exercise frequency per week, frequency of eating breakfast, frequency of snacking between meals, and sleeping hours) + Model 1. Model 3 was adjusted for presence of a metabolic disorder (high blood pressure, metabolic lipid disorder, and metabolic glucose disorder) and presence of arteriosclerotic disease (cardiovascular disease, cerebrovascular disease) + Model 2. VFA, visceral fat area; OR, Odds ratio; CI, confidence interval.
Table 4. Results of multiple linear regression results for coffee consumption and VFA.
β Coefficient (SE)p Value
Model 1−2.70 (0.25)<0.05
Model 2−2.76 (0.26)<0.05
Model 3−1.86 (0.23)<0.05
Model 1 was adjusted for age and sex. Model 2 was adjusted for lifestyle-related factors (green tea consumption, alcohol consumption, smoking behavior, exercise frequency per week, frequency of eating breakfast, frequency of snacking between meals, and sleeping hours) + Model 1. Model 3 was adjusted for presence of a metabolic disorder (high blood pressure, metabolic lipid disorder, and metabolic glucose disorder) and presence of arteriosclerotic disease (cardiovascular disease or cerebrovascular disease) + Model 2. VFA, visceral fat area; SE, standard error.
Disclaimer/Publisher’s Note: The statements, opinions and data contained in all publications are solely those of the individual author(s) and contributor(s) and not of MDPI and/or the editor(s). MDPI and/or the editor(s) disclaim responsibility for any injury to people or property resulting from any ideas, methods, instructions or products referred to in the content.

