Article

Gut Microbiota Profiles of Children with Obesity or Metabolic Syndrome: Body Mass Index Is a Lead Actor

by
Grace N. Gathungu
1,*,
Daniel N. Frank
2,
Anupama Chawla
1,
Charles E. Robertson
2,
Joseph F. LaComb
1,
Katherine Markarian
1,
Brianna M. Burghard
1 and
Robert Woroniecki
1
1
Department of Pediatrics, Stony Brook University Hospital, Stony Brook, NY 11794, USA
2
Department of Medicine, University of Colorado Anschutz Medical Campus, Aurora, CO 80045, USA
*
Author to whom correspondence should be addressed.
Obesities 2023, 3(3), 253-264; https://doi.org/10.3390/obesities3030021
Submission received: 16 July 2023 / Revised: 27 August 2023 / Accepted: 7 September 2023 / Published: 14 September 2023

Abstract

:
The worldwide prevalence of obesity and associated metabolic syndrome (MetS) has increased threefold over the last five decades. Among children, this trend is alarming due to the premature onset of MetS. The data regarding how the structure and composition of gastrointestinal (GIT) microbiota either promote or attenuate obesity and MetS are limited. Objectives: We carried out this study to investigate the relationship between microbial profiles and diagnosis of MetS among children with obesity. Fifty subjects with a diagnosis of obesity or Mets were enrolled. We collected clinical information, demographic data, dietary records, and stool specimens. Overall, there was no significant difference in the diversity of GIT microbiota between the two subgroups of children with obesity or MetS. We also found no differences in the diversity of GIT microbiota between the sexes and blood pressure categories. However, we observed a significant difference between the structure, composition, and diversity of the gut microbiome when the subjects were stratified using a BMI cut-off of 30. Subjects with a BMI ≥ 30 had a lower abundance of Bacteroidetes and a greater abundance of Actinobacteria and Firmicutes compared to those with a BMI value of less than 30. This gut microbiota signature is more like the GIT microbiome profile of adults with obesity and may represent accelerated changes among children. Additional studies are needed to investigate the role of obesity in the maturation of gut microbiota in children with morbid obesity.

1. Introduction

Obesity is a major cause of morbidity in the United States of America [1]. Although it can be prevented through lifestyle modification, the rate of obesity has increased threefold compared to its prevalence in 1975 [2]. In 2016, it was estimated that 2.1 billion people in the world were categorized as overweight or obese [3]. Furthermore, it is estimated that rates of obesity will continue to rise to peak levels within 25 to 50 years in the United States and the United Kingdom (UK) [4]. Obesity is a major risk factor for several comorbidities including hypertension, heart disease, cancer, and metabolic syndrome (MetS). MetS refers to central obesity coupled with a constellation of high blood pressure, insulin resistance, increased triglycerides, and a low level of high-density lipoprotein cholesterol (HDL-cholesterol) [5]. In parallel with rising rates of obesity among adults, the prevalence of childhood obesity has risen to alarming levels globally and is now categorized as a chronic disease [6]. There is an urgent need to modify future trends because of the concurrent increase of comorbid conditions among children. The most recent estimates indicate that 6–39% of children with obesity meet the criteria for MetS [7,8].
Recently, the gut microbiome has emerged as a potential confounder of obesity and the associated metabolic disorders. Several studies proposed that there is an interplay between microbial species residing in the human gastrointestinal tract (GIT), including bacteria, fungi, viruses, archaea, and protozoa, and the maintenance of systemic homeostasis in the human body [9,10]. The gut microbiome is established in infancy and continues to evolve. However, its composition is affected by genetic, epigenetic, and environmental factors [11]. The diversity and composition of microbiomes in the GIT may have a significant influence on gut health. In a healthy adult, more than a hundred bacterial species within eight different phyla colonize the GIT. Most of the bacteria belong to the phyla Firmicutes, Actinobacteria, and Bacteroidetes. The most abundant class of bacteria in the human gut is Clostridia, whereas the most abundant species is Bifidobacterium longum [12]. The genes of these bacteria are thought to play a major role in digestion and metabolism. Any negative change in the composition and diversity of the gut microbiome can lead to dysbiosis, and this is linked to health consequences such as obesity and MetS, although the underlying mechanisms are still unknown [13,14].
The composition of the gut microbiome varies among individuals based on lifestyle, culture, exercise routine, diet, and body mass index (BMI) [15]. Some studies have shown that a diet with low fiber and high-fat content may lead to increased Firmicutes and reduced Bacteroidetes in the GIT. Individuals who are overweight or obese have lower bacterial diversity, which may be associated with abnormalities in glucose homeostasis. This may result in increased adiposity, low-grade inflammation, and dyslipidemia [16]. Research studies, including experimental mouse models and observational human studies, report a reduction in the richness of microbial species and an imbalance in the Firmicutes to Bacteroidetes ratio in subjects who are overweight or obese. However, data regarding the signatures of microbiome profiles of persons with obesity and the corresponding association with dietary interventions are inconsistent [17,18]. Researchers have proposed that genomic functions or metagenomes and metabolic profiles of the gut microbiome interact with the host gut–brain axis. These complex interactions between signaling molecules of the nervous system, immune system, endocrine system, and digestive system are termed the microbiota–gut–brain axis [2]. Dietary interventions based on the administration of prebiotics and probiotics have been found to improve overall metabolic health and may treat obesity [18,19].
The aim of our study was to compare the intestinal microbiome among a group of pediatric subjects with a diagnosis of obesity, with or without metabolic syndrome. Fifty subjects within the age range of 10–18 years were recruited for the study, including the collection of clinical and biochemical data. We obtained fecal samples and diet logs spanning one week. Here, we report the findings of microbial profiles of children with obesity and/or metabolic syndrome and their similarity to adult GIT microbiota signatures [20].

2. Methods

2.1. Ethics Statement

This clinical trial was approved by the ethics committee of the Stony Brook University Office of Research Compliance (No. 677872). Pediatric patients (age ≥ 7 years) with a diagnosis of obesity or metabolic syndrome were identified. Written consent was obtained from the guardians of all the participants in a consecutive fashion. Participants who were 18 years old were of the age to provide their own written consent. The enrollment period was from October 2014 to October 2016.

2.2. Inclusion Criteria

Eligible subjects were 10–18 years old and were established patients at the Stony Brook University Divisions of Pediatric Gastroenterology, Nephrology, Endocrinology, or the Weight Management Program. Obesity was defined as weight greater than 95 percentile for age. Metabolic syndrome was defined as weight greater than 95 percentile for age and factors, including elevated systolic blood pressure, elevated triglycerides, impaired fasting glucose, or hyperinsuliniemia [21].

2.3. Exclusion Criteria

Subjects were ineligible if they had type I diabetes, declined to consent, inflammatory bowel disease, or celiac disease. Subjects were ineligible if they had been treated with antibiotics within 2 weeks from the time of the clinic visit or had acute diarrhea. Subjects were subsequently eligible if they presented for a follow-up visit once the diarrhea resolved and if they had not consumed antibiotics within 2 weeks.

2.4. Dietary Intake and Data Analysis

Subjects were required to complete a dietary intake log for 7 days. They were given instructions on how to complete the log. The dietician analyzed the dietary information using Nutritionist Pro Software (Axxya Systems, Redmond, WA, USA, 2016). Comprehensive nutrition analysis was subsequently performed using the Client Diet Record Nutrient Analysis tool.

2.5. Microbiome Analysis

Subjects were instructed to collect a fecal sample and store it at a cool temperature. The sample was delivered within 24 h and stored at −80 °C until processing. Collection vials were prefilled with 2 mL of RNAlater (Life Technologies, Carlsbad, CA, USA). DNA was extracted from fecal samples using the QIAamp Powerfecal DNA isolation kit (Qiagen INC, Hilden, Germany). Bacterial profiles were determined via broad-range PCR amplification and sequence analysis of 16S rRNA genes following our previously described methods [22,23,24]. In brief, amplicons were generated using barcoded primers targeting the V3V4 variable region of the 16S rRNA gene: primers 338F (5′ ACTCCTACGGGAGGCAGCAG) and 806R (5′ GGACTACHVGGGTWTCTAAT). PCR products were normalized using a SequalPrepTM kit (Invitrogen, Carlsbad, CA, USA), pooled, lyophilized, purified, and concentrated using a DNA Clean and Concentrator Kit (Zymo, Irvine, CA, USA). The pooled amplicons were quantified using Qubit Fluorometer 2.0 (Invitrogen, Carlsbad, CA, USA). The pool was diluted to 4 nM and denatured with 0.2 N NaOH at room temperature. The denatured DNA was diluted to 15 pM and spiked with 25% of the Illumina PhiX control DNA prior to loading the sequencer. Illumina paired-end sequencing was performed on the MiSeq using a 600-cycle version 3 reagent kit.
Paired-end reads were aligned to the human reference genome hg19 using bowtie2, and the matching sequences were discarded [25,26]. Demultiplexed paired reads were assembled using phrap [27], and pairs that did not assemble were discarded. The assembled sequences were trimmed over a moving window of 5 nucleotides until the average quality was met or exceeded 20. Trimmed sequences with more than one ambiguity or shorter than 350 nt were discarded. Potential chimeras identified with Uchime (usearch6.0.203_i86linux32) [28] using the Schloss [29] Silva reference sequences were removed from subsequent analyses. The assembled sequences were aligned and classified with SINA (1.3.0-r23838) [30] using the 418,497 bacterial sequences in Silva 115NR99 [31] as a reference configured to yield the Silva taxonomy. The taxonomic annotations were based on the default lowest common ancestor parameters used by Silva. Closed-reference operational taxonomic units (OTU) were produced by binning sequences with identical taxonomic assignments. This process generated a median of 142,764 sequences/sample (IQR: 122,708-184,270) and all goods coverage scores were ≥99.8%. The software package Explicet (v2.10.5) [32] was used to calculate the alpha diversity indices at a rarefaction point of 50,000 sequences.

2.6. Statistical Analysis

The software packages R v4.1.0 [33] and Explicet v2.10.5 [32] were used to analyze and visualize the data. For microbiome analysis, differences in overall composition (i.e., beta diversity) were assessed via permutational ANOVA (PERMANOVA [34,35]) using the Morisita–Horn dissimilarity index (Bray–Curtis and Jaccard indices were evaluated in the initial analyses, but generated lower R2 values than Morisita–Horn). PERMANOVA p-values were inferred via 10 [6] label permutations and FDR-corrected for multiple comparisons [36] when multiple pairwise tests were performed. The alpha diversity indices (i.e., Sobs, Shannon H, Shannon H/Hmax) were assessed using linear regression modeling; p-values were FDR adjusted when multiple pairwise tests were performed. Individual taxa differing between patient groups were identified using the ANOVA-like differential expression (ALDEx2) R package [37,38]. The distribution of taxa in each sequence library was estimated using 1000 Dirichlet Monte Carlo re-samplings of the sequence count data. To account for the compositional nature of the microbiome sequence data, the datasets were then subjected to a center log-ratio transformation with all features used as the denominator.

3. Results

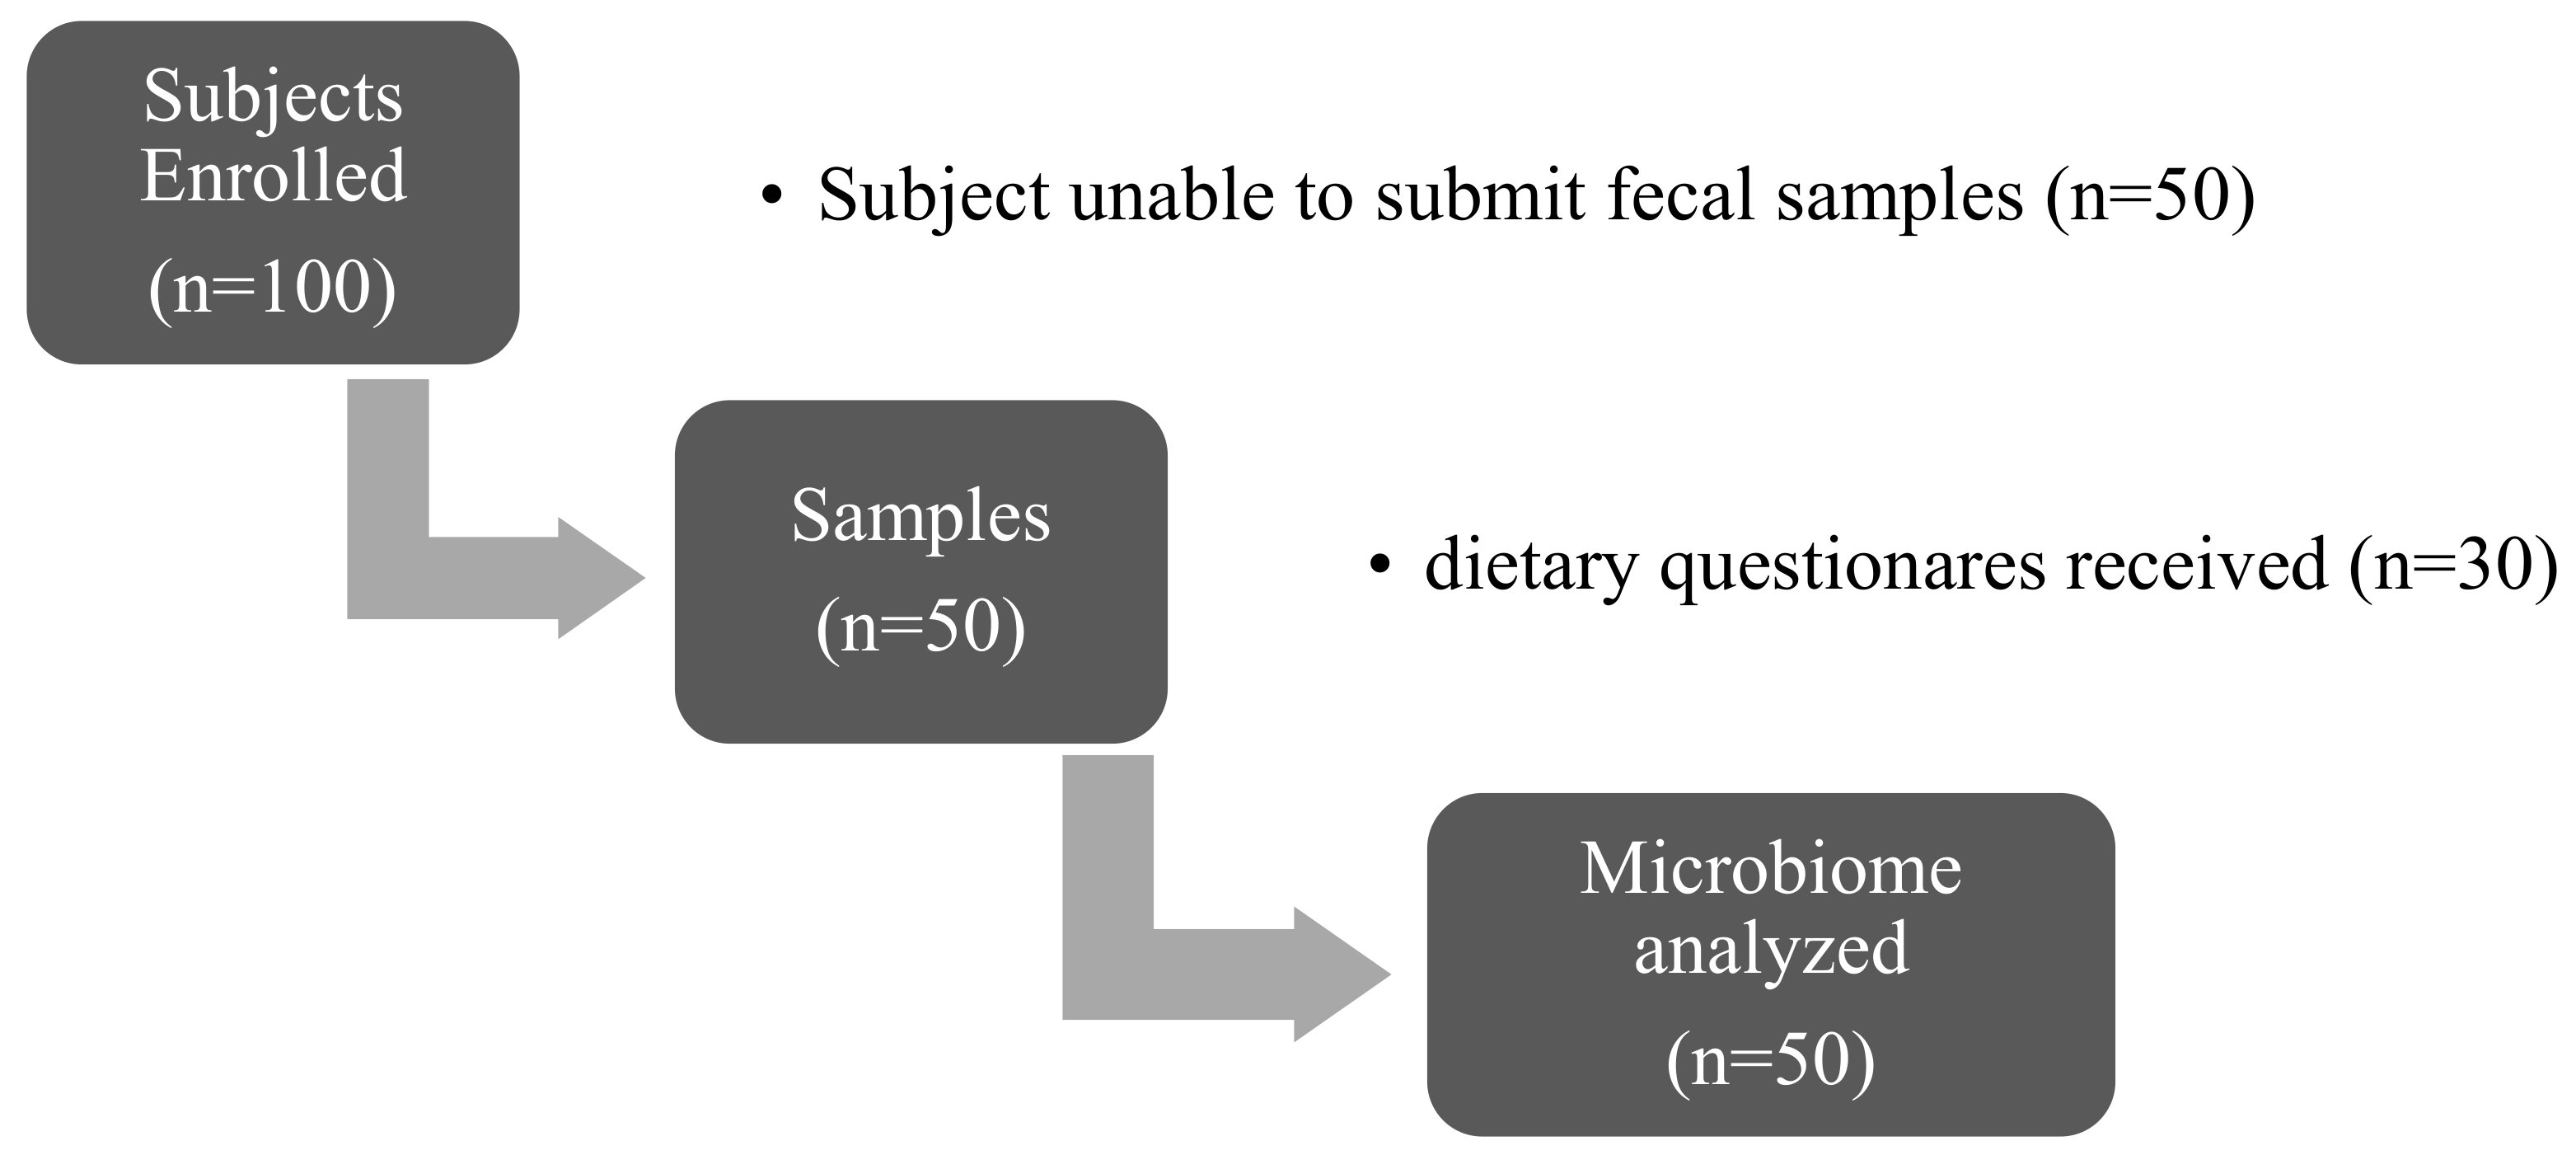
3.1. Baseline Characteristics of Participants

In this study, we obtained informed consent from 100 subjects. Fifty of them, including 33 subjects with a diagnosis of obesity (Ob) and 17 with a diagnosis of metabolic syndrome (MetS), were included in the final study. Fifty subjects did not submit fecal samples and were excluded from the analysis (Figure 1).
The Ob cohort included 33 subjects with a mean age of 14.7 ± 2.3 years. The MetS cohort included 17 subjects with a mean age of 14.6 ± 2.5 years. There were no significant differences in gender, race, waist circumference, and height between the two groups. Subjects with MetS had higher serum triglycerides, lower HDL-cholesterol, and higher systolic and diastolic BPi, as well as a higher incidence of a family history of diabetes mellitus. The baseline characteristics of the subjects are presented in Table 1.
Categorical variables were analyzed using chi-squared analysis and are presented as percentages (%). Continuous variables were examined using the Student’s t-test for parametric variables and the Mann–Whitney U test for non-parametric variables. Statistical significance was set at p-value < 0.05.
All the subjects in our study had higher than normal body mass index (BMI) scores based on the standard guidelines [39,40,41]. We further stratified the enrolled subjects into two groups based on a BMI cut-off of 30. About 29.4% of the Ob group and 27.3% of the MetS group had a BMI of less than 30, whereas 70.6% of the Ob group and 72.7% of the MetS group had BMI scores greater than 30.

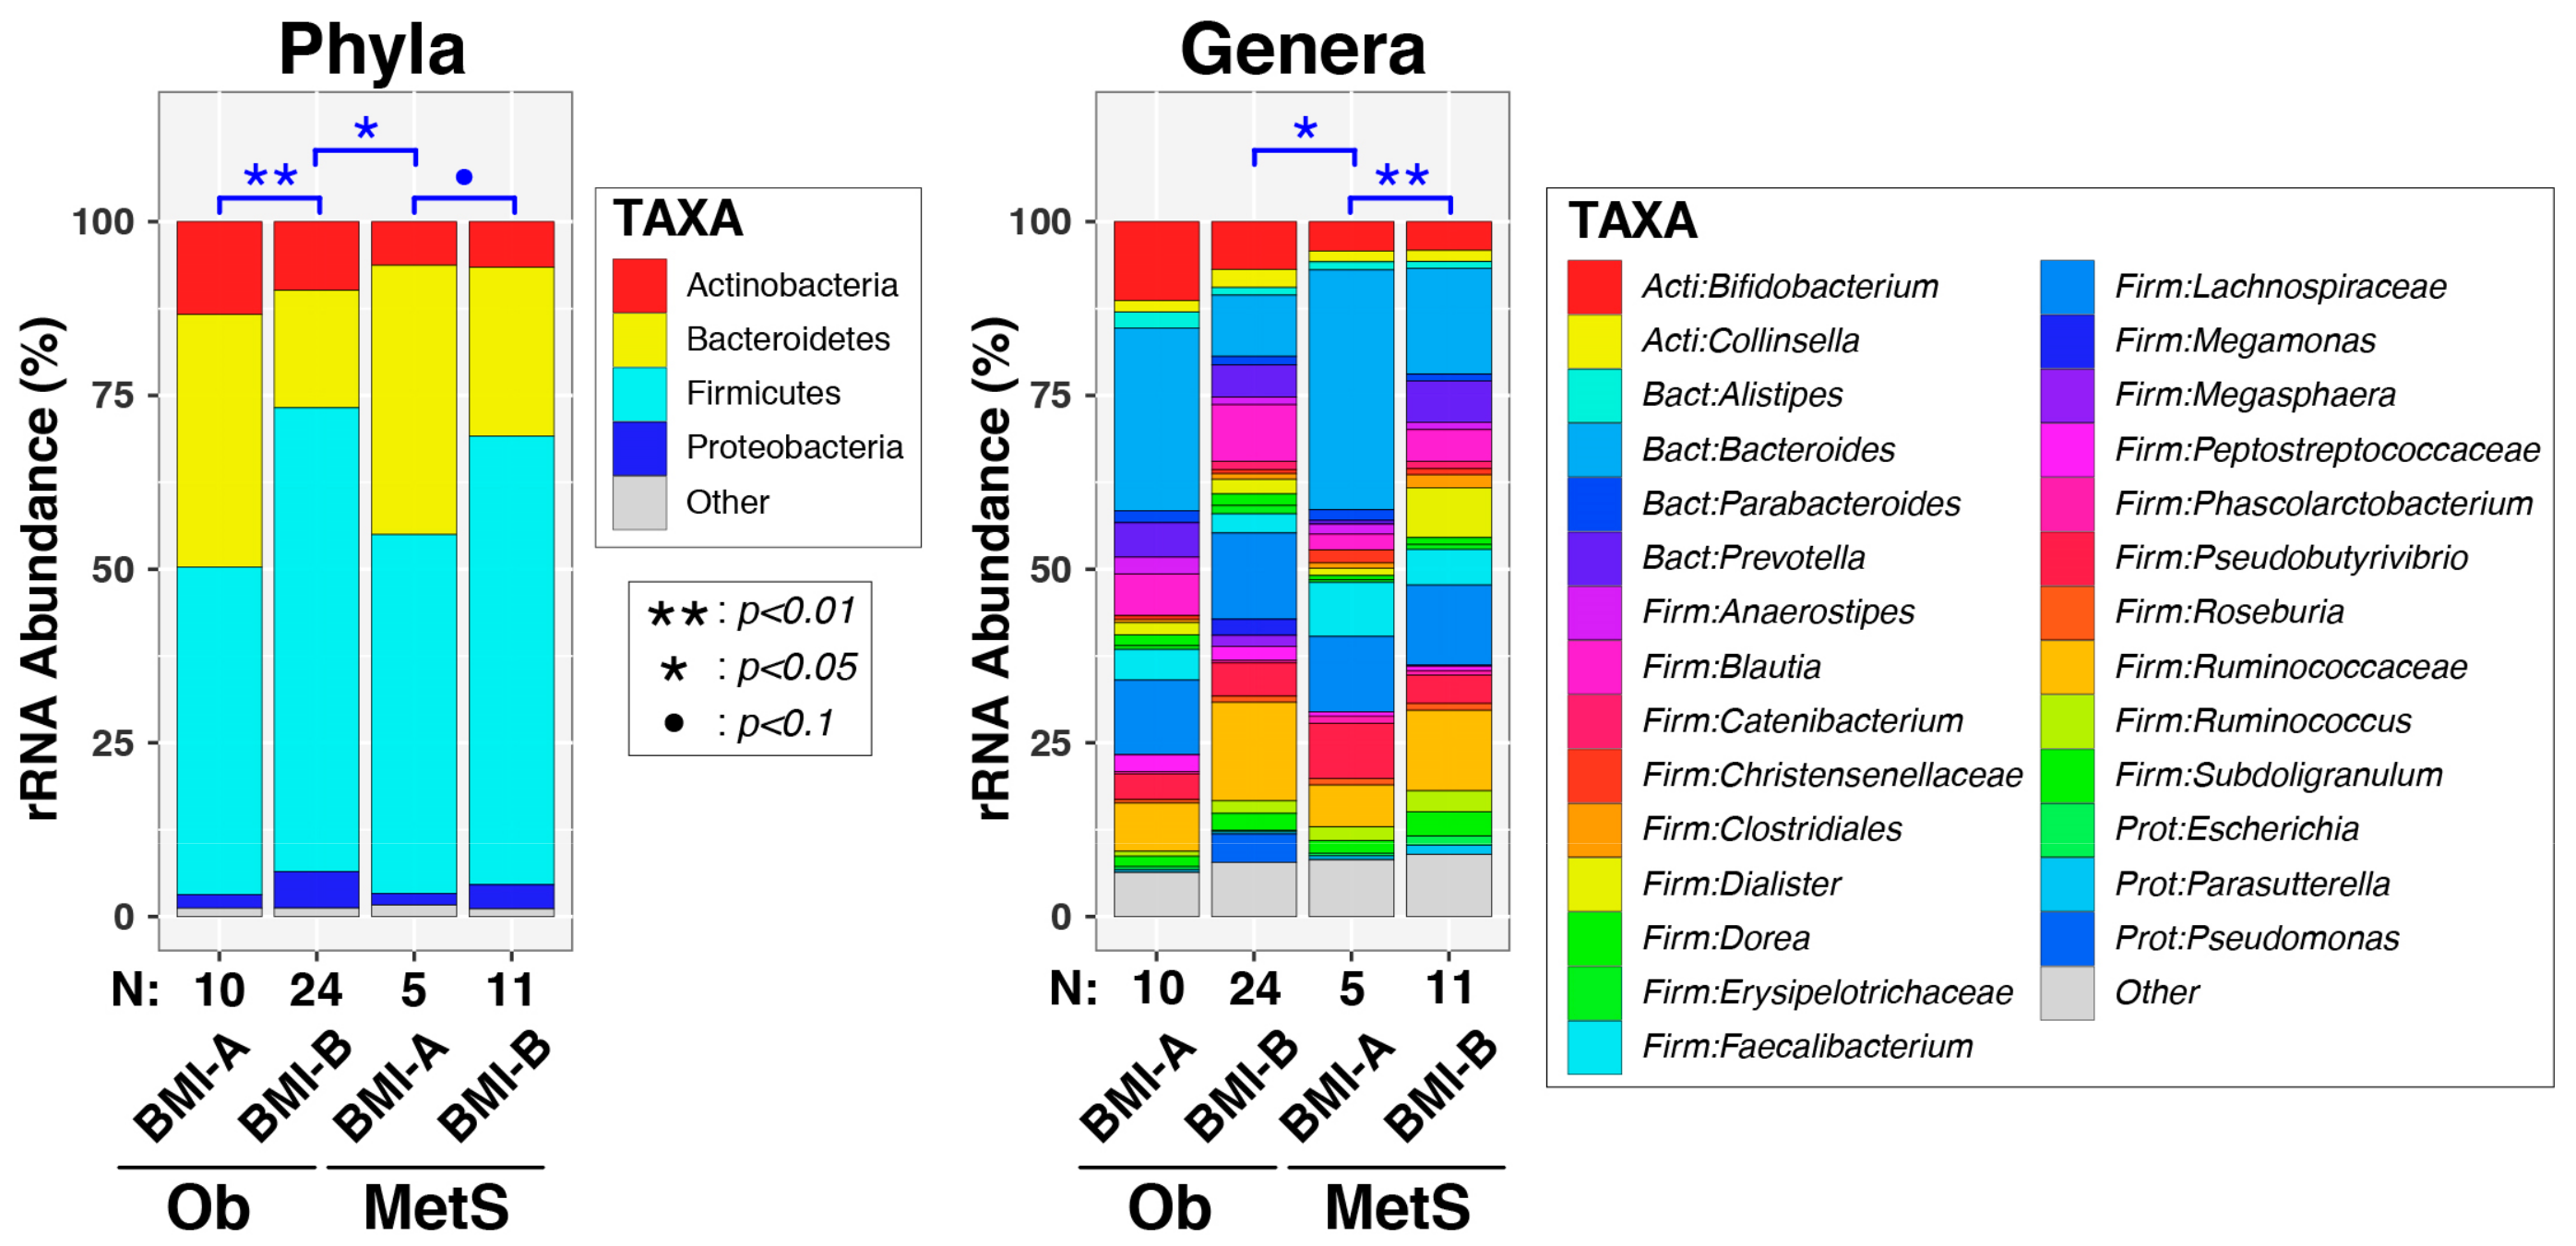
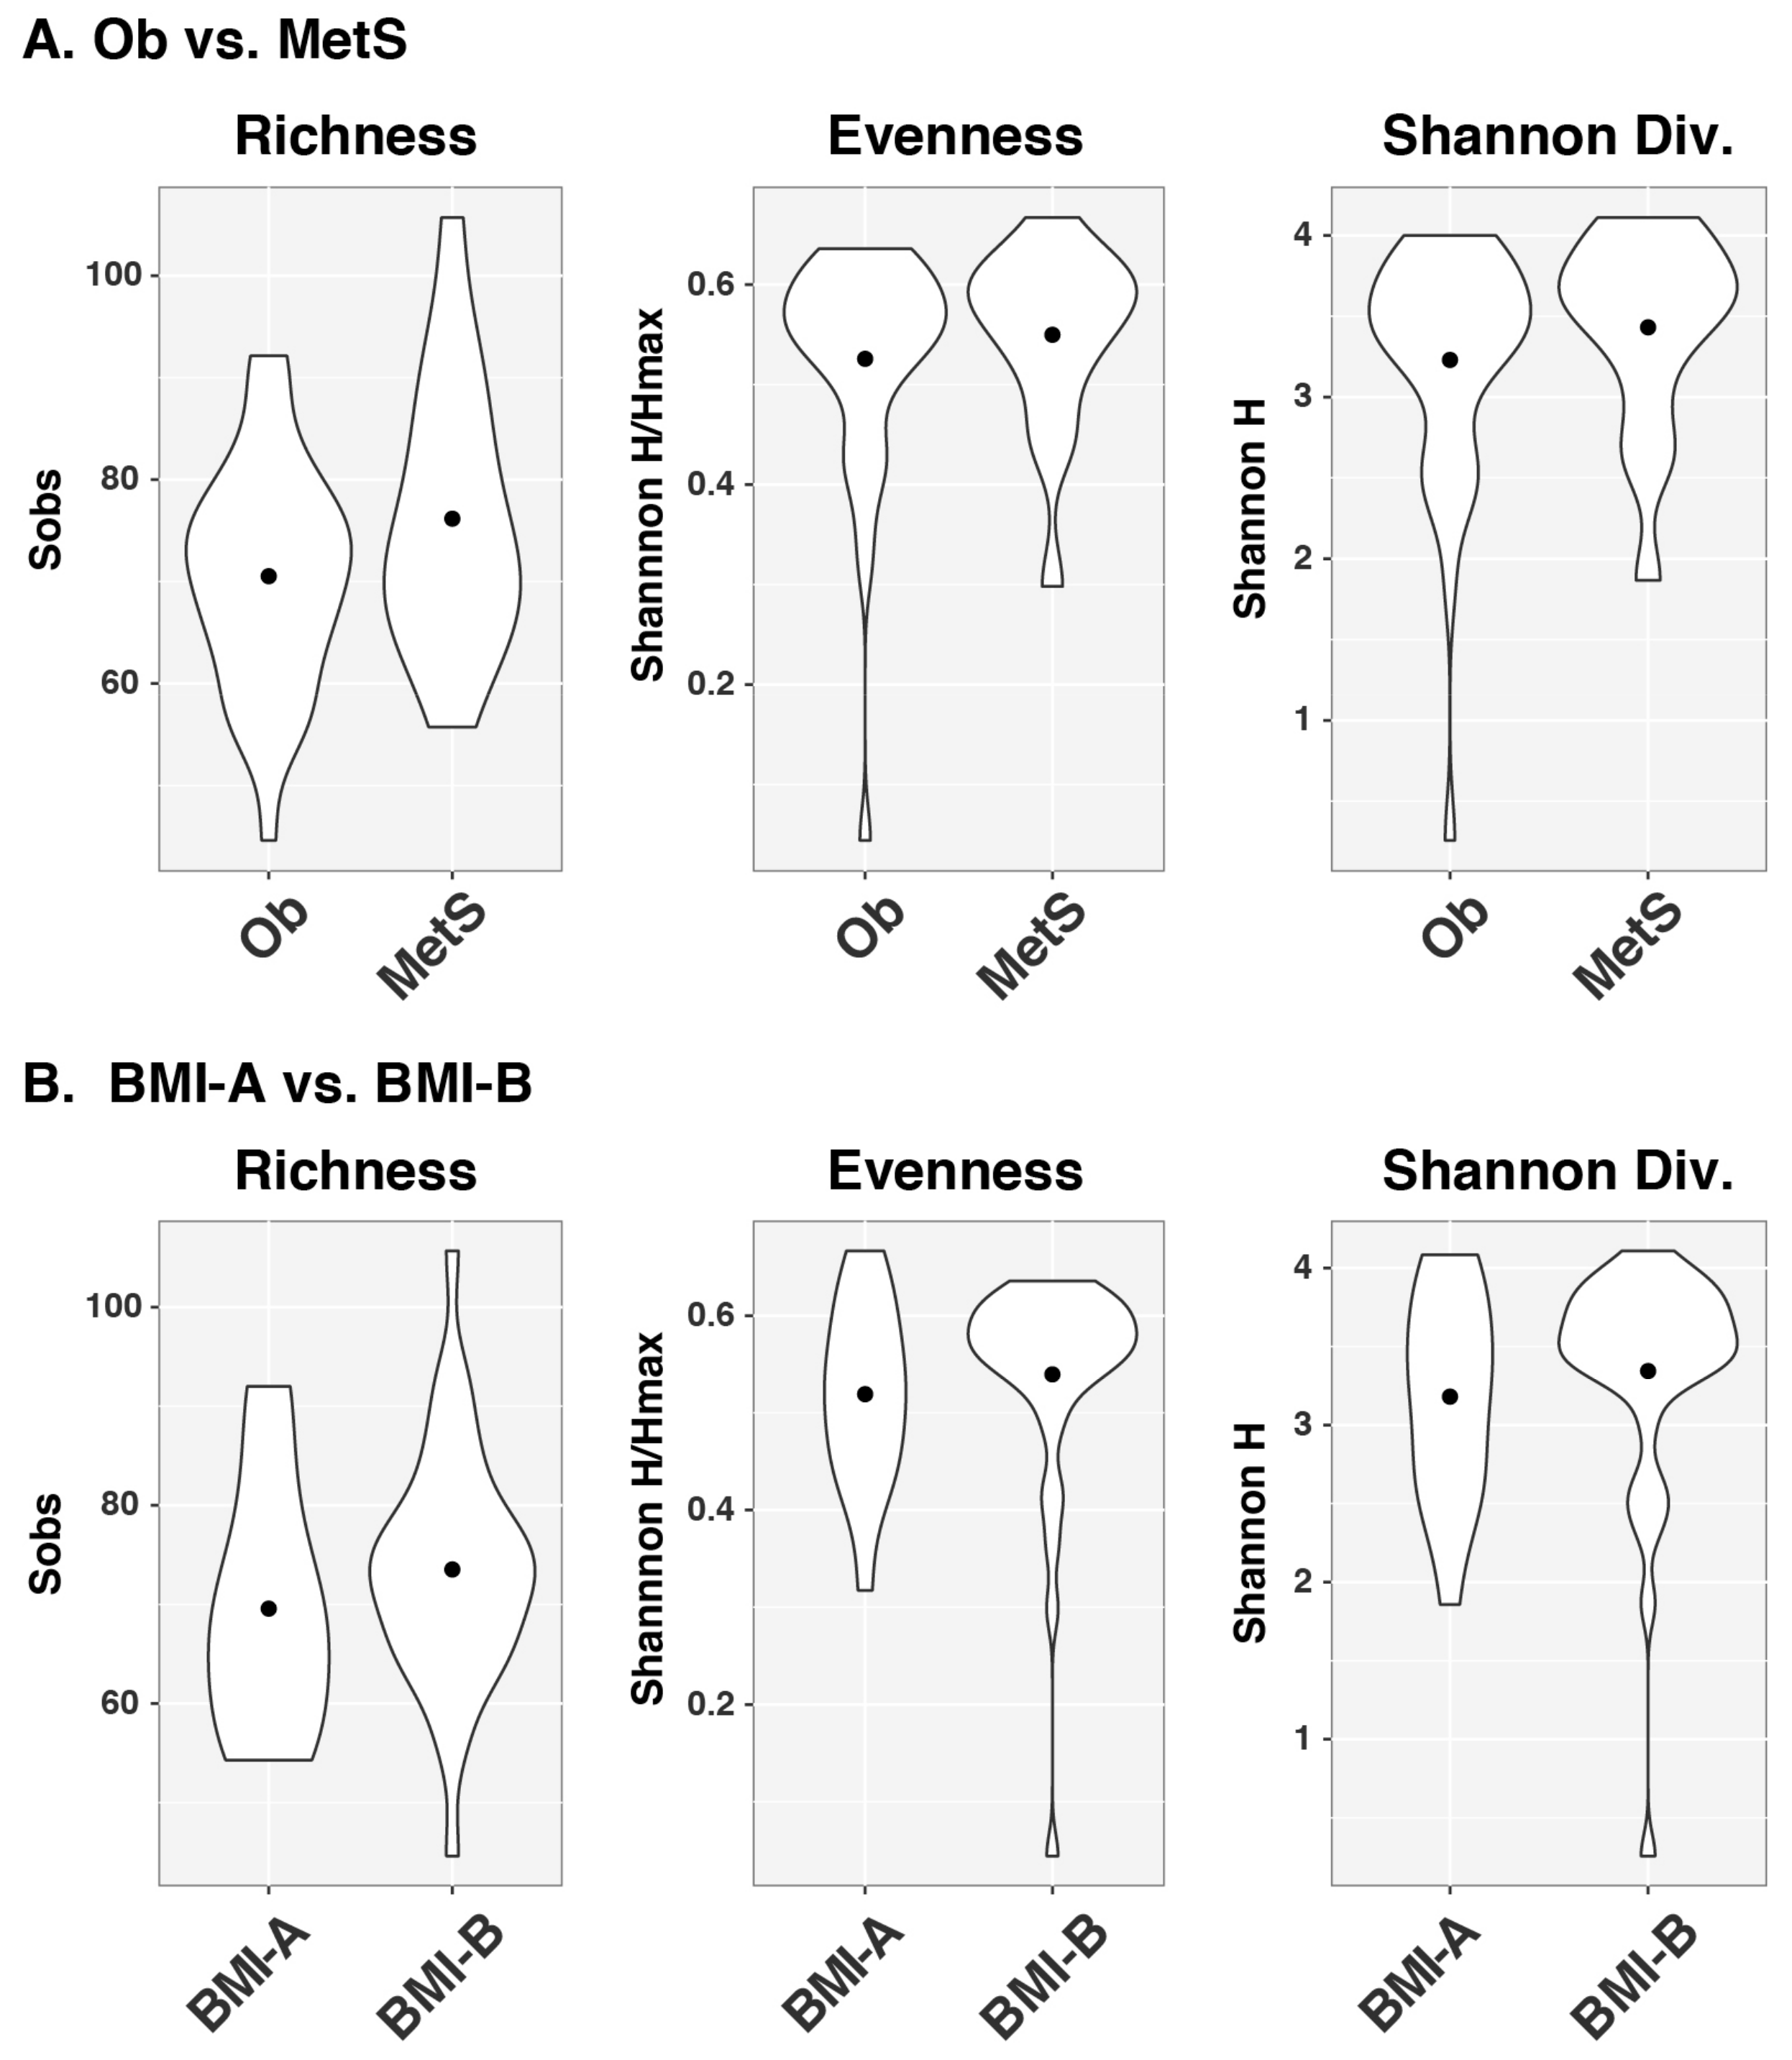
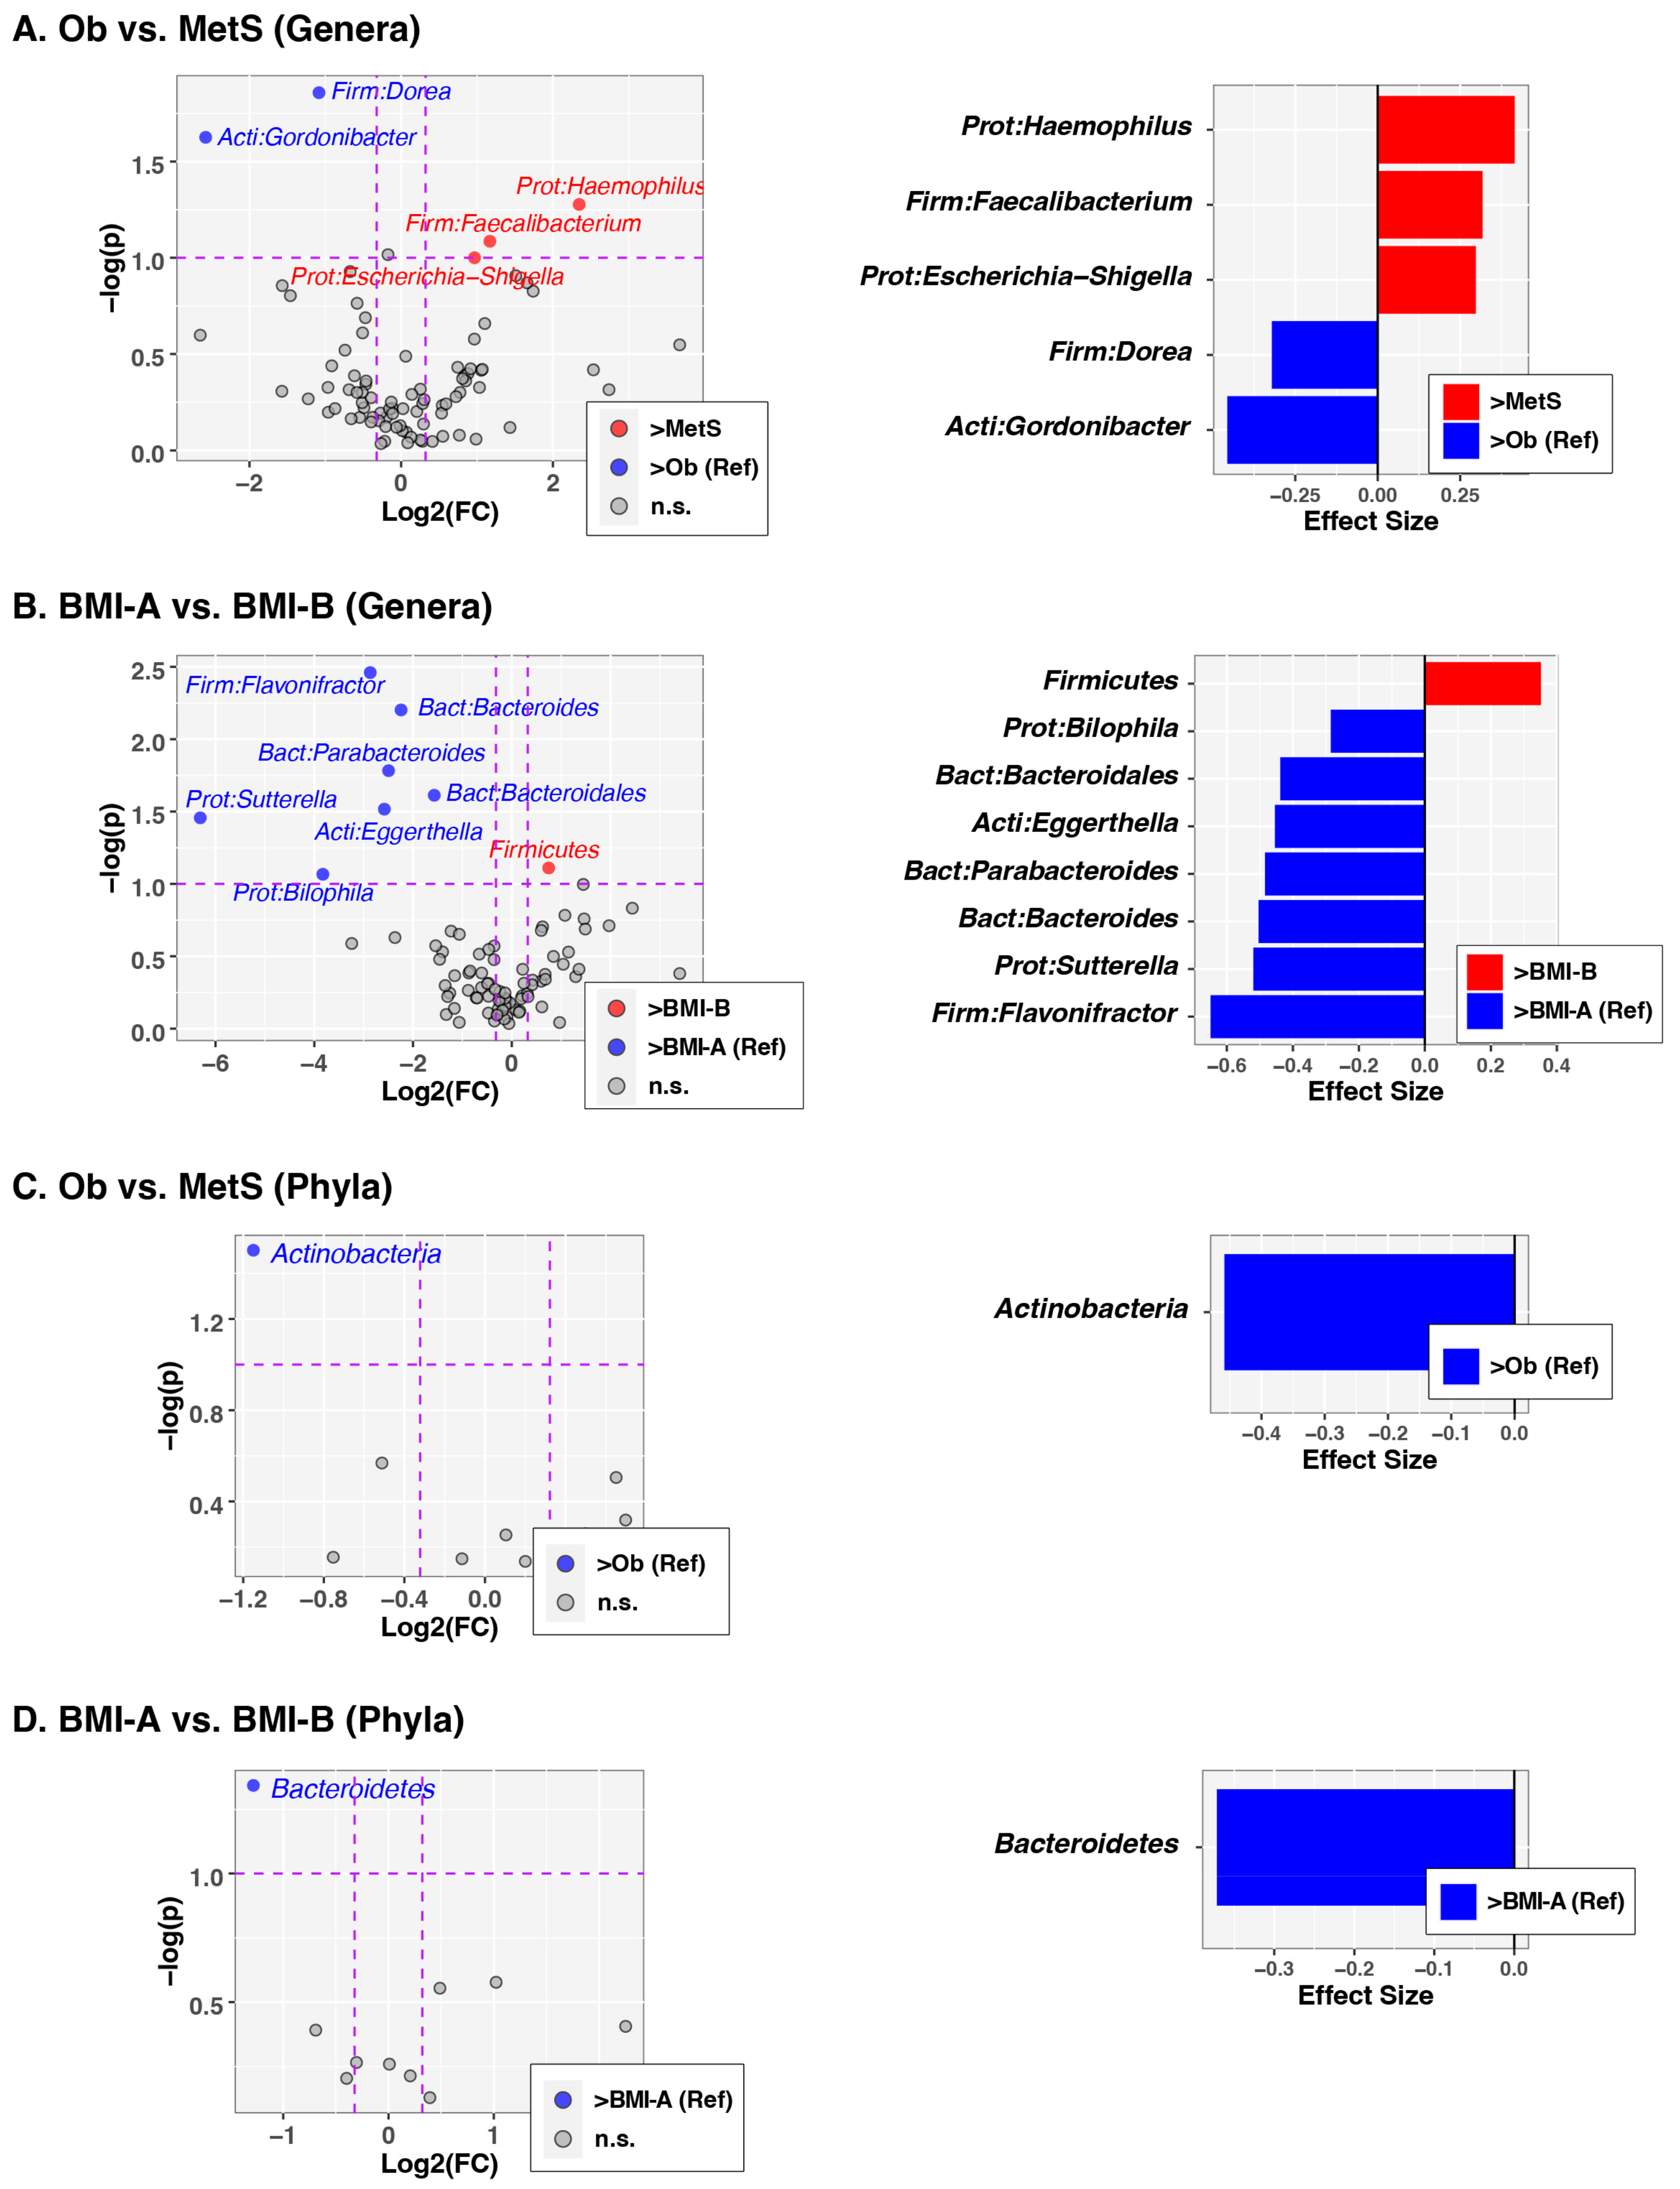
3.2. Analysis of Gut Microbiota Composition

Fecal bacteria were profiled cross-sectionally in 50 enrolled subjects using bacterial 16S rRNA gene sequencing. As expected, four phyla accounted for the most bacterial diversity in each study participant: Firmicutes, Bacteroidetes, Actinobacteria, and Proteobacteria (Figure 2).
We analyzed the gut microbiota among the subjects based on two stratification criteria: (1) enrollment group of obese (Ob) vs. metabolic syndrome (MetS) and (2) BMI < 30 (BMI-A) vs. BMI ≥ 30 (BMI-B). We initially examined associations between these variables, as well as other clinical and demographic variables, nutrient intake (Table 2), and overall microbiota composition (beta diversity) at both the genus and phylum levels. Univariable PERMANOVA tests (Table 3) were significant, or trended towards significance, for BMI category (P[genus] = 0.013 and P[phylum] = 0.0028), age (P[genus] = 0.054), and ethnicity (P[genus] = 0.046 and P[phylum] = 0.052). In contrast, neither MetS diagnosis, sex, HISBPI, HIDBP, nor abBP were significant in the PERMANOVA tests. Multivariable PERMANOVA tests that included BMI category, age, and ethnicity revealed that BMI category and age, but not ethnicity, remained significant after adjusting for other covariates. The final bivariable models documented significant, independent effects of both BMI category (P[genus] = 0.0037 and P[phylum] = 0.00045) and age (P[genus] = 0.014 and P[phylum] = 0.033) on fecal microbiota. Lastly, when subjects were stratified using both MetS diagnosis and BMI category (Figure 2), the effects of BMI on genus-level microbiota were observed primarily in the MetS group (p = 0.0019). At the phylum level, both the non-MetS and MetS groups exhibited differences in microbiota according to the BMI category (p = 0.0071 and p = 0.053, respectively).
As was the case for beta diversity, no significant differences in microbial community richness (Sobs), evenness (Shannon H/Hmax), or diversity indices (Shannon H) were observed between the Ob and MetS groups (Figure 3A). Similarly, the BMI category was not associated with any of these three alpha diversity indices (Figure 3B).
We next assessed whether individual bacterial taxa differed between the MetS and BMI categories (Figure 4). At the genus level, there was a greater abundance of Doria and Gordonibacter among subjects with obesity compared to children with MetS (Figure 4A). In contrast, the MetS group was characterized by relatively higher abundances of the genera Haemophilus, Faecalibacterium, and Escherichia (Figure 4A). Children with BMI < 30 had relatively higher abundances in several genera including Flavonifractor, Bacteroides, Parabacteroides, Bacteroidales, Eggerthella, Sutterella, and Bilophilla (Figure 4B). At the phylum level, a greater relative abundance of Actinobacteria was observed among the subjects with Ob (Figure 4C). In addition, we found that the phylum Bacteroidetes was diminished among subjects with a BMI ≥ 30, irrespective of their clinical diagnosis (Figure 4D).

4. Discussion

In the present study, we carried out a comparative analysis of the fecal microbiome of 50 children ranging in age from 10 to 18 years old and with Ob and MetS. The dietary intake was similar between the two groups. The estimates of Vitamin D and Folate consumption was higher among subjects with metabolic syndrome. We confirmed that children with MetS had high triglycerides, low HDL-cholesterol, hypertension, type 2 diabetes, and insulin resistance. However, when we broadly compared the two enrollment groups, we did not find significant differences in the complexity or distribution of the fecal microbiome profiles. In this broad comparison, we incorporated the dietary intake and clinical/biochemical parameters of the two groups of children. Similar patterns of microbial richness, evenness, and diversity were observed in each cohort. This is similar to a previous study in which obese and normal-weight school-age children did not show differences in alpha diversity [42]. In further support of our findings, a recent study of adult patients with MetS in which similar clinical and biochemical parameters were examined found no differences in the alpha diversity of the fecal microbiome [43].
Next, we compared the composition of the gut microbiota between the two enrollment cohorts. The phylum Actinobacteria was relatively less abundant among subjects with MetS. A study among adults with Mets revealed relatively lower abundances of genera within the phylum Bacteroidetes, including Alistipes and Bacteroides, compared to healthy controls [44]. We observed that genera including Doria and Gordonibacter were more abundant among subjects without a diagnosis of MetS, whereas greater abundances of the genera including Heamophilus, Faecalibacterium, and Escherichia were observed among children with MetS (Figure 4). These findings contrasted with the outcomes of a previous study, in which MetS patients were observed to have a higher abundance of the genera Bacteroides, Eubacterium, and Lactobacillus. Consistent with other studies, Faecalibacterium prausnitzi abundance was depleted in our cohort of children with MetS [45].
The range in BMI varied from 25.22 to 44.28 in the obese cohort and from 24.98 to 51.61 in the MetS cohort. When we stratified our analysis using a BMI cut-off of 30, we found significant differences in beta diversity. Bacteroidetes were significantly more abundant in fecal samples from children with a BMI < 30 compared to samples from children with a BMI > 30 (see Figure 4A). Children with a BMI greater than 30 in the Ob and MetS groups had greater abundances of Ruminococcaceae compared to children with a BMI < 30. Subjects with a BMI < 30 had higher abundances of genera including Flavonifractor, Bacteroides, Parabacteroides, Bacteroidales, Eggerthella, Sutterella, and Bilophilla, whereas subjects with a BMI > 30 had higher abundances of unclassified Firmicutes. It was previously reported that higher abundances of Actinobacteria and Firmicutes and lower abundances of Bacteroidetes are observed among children and adults with obesity compared to those with a normal BMI [7,46,47]. A recent study of children with MetS reported greater abundances of Firmicutes, Proteobacteria, and Actinobacteria and a lower abundance of Bacteroidetes [7,48]. The outcomes from our study and others illustrate that children with obesity have gut microbiota profiles that more closely resemble those of adults with obesity [20]. More studies are required to delineate the mechanisms underlying this phenotype. Studies should also examine the long-term outcomes of dysbiosis, particularly among children with BMI scores greater than 30.
Our study highlights important differences between children with obesity and with metabolic syndrome, especially children with BMI scores greater than 30. Children may be more amenable and responsive to interventions that alter the progression of obesity and MetS. This is consistent with the worldwide morbidity and mortality rates [49]. A better understanding of the gut microbiome in children with obesity may reveal specific measures for intervention. We acknowledge several limitations in our study. Stool collection proved to be very difficult and limited our study size. We did not include a healthy control group of the same age with a normal BMI. This may have increased our detection of differences in microbiome profiles between the subsets. Moreover, diet logs from the subjects were obtained for only a period of seven days and were subject to recall bias.
In summary, we present a comparative profile of fecal microbiome diversity and composition among school-age children with obesity and metabolic syndrome. We observed significant differences in the diversity and composition of the fecal microbiome when children with obesity and metabolic syndrome were stratified using a BMI cut-off of 30. Children with a BMI value greater than 30 had a lower abundance of Bacteroidetes and a greater abundance of Actinobacteria and Firmicutes. This gut microbiota signature more closely resembles that of adults with obesity compared to healthy children of the same age and may represent accelerated GIT aging. We propose that larger studies be conducted to identify specific factors that drive early gut microbiota maturation and disturbances in the temporal gut microbiome development among children with obesity.

Author Contributions

Conceptualization R.W.; methodology, G.N.G., D.N.F. and J.F.L.; software, D.N.F. and C.E.R.; validation, D.N.F. and C.E.R.; formal analysis, D.N.F., B.M.B. and C.E.R.; investigation, A.C., G.N.G., J.F.L. and R.W.; resources, A.C. and R.W.; data curation, K.M; writing—original draft preparation, G.N.G.; writing—review and editing, G.N.G., D.N.F., J.F.L., C.E.R., K.M., A.C. and R.W; visualization, R.W.; supervision, A.C. and R.W.; project administration, K.M.; funding acquisition, A.C. and R.W. All authors have read and agreed to the published version of the manuscript.

Funding

Financial support was provided through an intramural grant to R.W. and A.C. by the Department of Pediatrics at Stony Brook Hospital.

Institutional Review Board Statement

This clinical trial was approved by the ethics committee of the Stony Brook University Office of Research Compliance (No. 677872).

Informed Consent Statement

Pediatric patients (age ≥ 7 years) with a diagnosis of obesity or metabolic syndrome were identified. Written consent was obtained from the guardians of all the participants in a consecutive fashion. Participants who were 18 years old were of the age to provide their own written consent.

Data Availability Statement

The data presented in this study are openly available. Sequence data and clinical/demographic metadata were deposited in the NCBI Sequence Read Archive under BioProject accession number PRJNA1016449.

Acknowledgments

We are grateful to all the families that participated in the study.

Conflicts of Interest

The authors have no conflict of interest.

References

  1. Hales, C.M.; Carroll, M.D.; Fryar, C.D.; Ogden, C.L. Prevalence of Obesity Among Adults and Youth: United States, 2015–2016. NCHS Data Brief 2017, 288, 1–8. [Google Scholar]
  2. Zawada, A.; Rychter, A.M.; Ratajczak, A.E.; Lisiecka-Masian, A.; Dobrowolska, A.; Krela-Kazmierczak, I. Does Gut-Microbiome Interaction Protect against Obesity and Obesity-Associated Metabolic Disorders? Microorganisms 2020, 9, 18. [Google Scholar] [CrossRef] [PubMed]
  3. Smith, K.B.; Smith, M.S. Obesity Statistics. Prim. Care 2016, 43, 121–135. [Google Scholar] [CrossRef] [PubMed]
  4. Janssen, F.; Bardoutsos, A.; Vidra, N. Obesity Prevalence in the Long-Term Future in 18 European Countries and in the USA. Obes. Facts 2020, 13, 514–527. [Google Scholar] [CrossRef]
  5. Magge, S.N.; Goodman, E.; Armstrong, S.C.; Daniels, S.; Corkins, M.; de Ferranti, S.; Golden, N.H.; Kim, J.H.; Schwarzenberg, S.J.; Sills, I.N.; et al. The Metabolic Syndrome in Children and Adolescents: Shifting the Focus to Cardiometabolic Risk Factor Clustering. Pediatrics 2017, 140, e20171603. [Google Scholar] [CrossRef]
  6. Farpour-Lambert, N.J.; Baker, J.L.; Hassapidou, M.; Holm, J.C.; Nowicka, P.; O’Malley, G.; Weiss, R. Childhood Obesity Is a Chronic Disease Demanding Specific Health Care—A Position Statement from the Childhood Obesity Task Force (COTF) of the European Association for the Study of Obesity (EASO). Obes. Facts 2015, 8, 342–349. [Google Scholar] [CrossRef]
  7. Carrizales-Sanchez, A.K.; Garcia-Cayuela, T.; Hernandez-Brenes, C.; Senes-Guerrero, C. Gut microbiota associations with metabolic syndrome and relevance of its study in pediatric subjects. Gut Microbes 2021, 13, 1960135. [Google Scholar] [CrossRef]
  8. Weihe, P.; Weihrauch-Bluher, S. Metabolic Syndrome in Children and Adolescents: Diagnostic Criteria, Therapeutic Options and Perspectives. Curr. Obes. Rep. 2019, 8, 472–479. [Google Scholar] [CrossRef]
  9. Almeida, A.; Mitchell, A.L.; Boland, M.; Forster, S.C.; Gloor, G.B.; Tarkowska, A.; Lawley, T.D.; Finn, R.D. A new genomic blueprint of the human gut microbiota. Nature 2019, 568, 499–504. [Google Scholar] [CrossRef]
  10. Davis, C.D. The Gut Microbiome and Its Role in Obesity. Nutr. Today 2016, 51, 167–174. [Google Scholar] [CrossRef]
  11. Cuevas-Sierra, A.; Ramos-Lopez, O.; Riezu-Boj, J.I.; Milagro, F.I.; Martinez, J.A. Diet, Gut Microbiota, and Obesity: Links with Host Genetics and Epigenetics and Potential Applications. Adv. Nutr. 2019, 10 (Suppl. S1), S17–S30. [Google Scholar] [CrossRef] [PubMed]
  12. King, C.H.; Desai, H.; Sylvetsky, A.C.; LoTempio, J.; Ayanyan, S.; Carrie, J.; Crandall, K.A.; Fochtman, B.C.; Gasparyan, L.; Gulzar, N.; et al. Baseline human gut microbiota profile in healthy people and standard reporting template. PLoS ONE 2019, 14, e0206484. [Google Scholar] [CrossRef] [PubMed]
  13. Dabke, K.; Hendrick, G.; Devkota, S. The gut microbiome and metabolic syndrome. J. Clin. Investig. 2019, 129, 4050–4057. [Google Scholar] [CrossRef] [PubMed]
  14. Marotz, C.A.; Zarrinpar, A. Treating Obesity and Metabolic Syndrome with Fecal Microbiota Transplantation. Yale J. Biol. Med. 2016, 89, 383–388. [Google Scholar]
  15. Rinninella, E.; Raoul, P.; Cintoni, M.; Franceschi, F.; Miggiano, G.A.D.; Gasbarrini, A.; Mele, M.C. What is the Healthy Gut Microbiota Composition? A Changing Ecosystem across Age, Environment, Diet, and Diseases. Microorganisms 2019, 7, 14. [Google Scholar] [CrossRef]
  16. Le Chatelier, E.; Nielsen, T.; Qin, J.; Prifti, E.; Hildebrand, F.; Falony, G.; Almeida, M.; Arumugam, M.; Batto, J.M.; Kennedy, S.; et al. Richness of human gut microbiome correlates with metabolic markers. Nature 2013, 500, 541–546. [Google Scholar] [CrossRef]
  17. Cunningham, A.L.; Stephens, J.W.; Harris, D.A. A review on gut microbiota: A central factor in the pathophysiology of obesity. Lipids Health Dis. 2021, 20, 65. [Google Scholar] [CrossRef]
  18. Abenavoli, L.; Scarpellini, E.; Colica, C.; Boccuto, L.; Salehi, B.; Sharifi-Rad, J.; Aiello, V.; Romano, B.; De Lorenzo, A.; Izzo, A.A.; et al. Gut Microbiota and Obesity: A Role for Probiotics. Nutrients 2019, 11, 2690. [Google Scholar] [CrossRef]
  19. Mazidi, M.; Rezaie, P.; Kengne, A.P.; Mobarhan, M.G.; Ferns, G.A. Gut microbiome and metabolic syndrome. Diabetes Metab. Syndr. 2016, 10 (Suppl. S1), S150–S157. [Google Scholar] [CrossRef]
  20. Radjabzadeh, D.; Boer, C.G.; Beth, S.A.; van der Wal, P.; Kiefte-De Jong, J.C.; Jansen, M.A.E.; Konstantinov, S.R.; Peppelenbosch, M.P.; Hays, J.P.; Jaddoe, V.W.V.; et al. Diversity, compositional and functional differences between gut microbiota of children and adults. Sci. Rep. 2020, 10, 1040. [Google Scholar] [CrossRef]
  21. Ahrens, W.; Moreno, L.A.; Marild, S.; Molnar, D.; Siani, A.; De Henauw, S.; Bohmann, J.; Gunther, K.; Hadjigeorgiou, C.; Iacoviello, L.; et al. Metabolic syndrome in young children: Definitions and results of the IDEFICS study. Int. J. Obes. 2014, 38 (Suppl. S2), S4–S14. [Google Scholar] [CrossRef] [PubMed]
  22. Frank, D.N.; Qiu, Y.; Cao, Y.; Zhang, S.; Lu, L.; Kofonow, J.M.; Robertson, C.E.; Liu, Y.; Wang, H.; Levens, C.L.; et al. A dysbiotic microbiome promotes head and neck squamous cell carcinoma. Oncogene 2022, 41, 1269–1280. [Google Scholar] [CrossRef]
  23. Vickery, T.W.; Armstrong, M.; Kofonow, J.M.; Robertson, C.E.; Kroehl, M.E.; Reisdorph, N.A.; Ramakrishnan, V.R.; Frank, D.N. Altered tissue specialized pro-resolving mediators in chronic rhinosinusitis. Prostaglandins Leukot. Essent. Fat. Acids 2021, 164, 102218. [Google Scholar] [CrossRef]
  24. Soderborg, T.K.; Clark, S.E.; Mulligan, C.E.; Janssen, R.C.; Babcock, L.; Ir, D.; Young, B.; Krebs, N.; Lemas, D.J.; Johnson, L.K.; et al. The gut microbiota in infants of obese mothers increases inflammation and susceptibility to NAFLD. Nat. Commun. 2018, 9, 4462. [Google Scholar] [CrossRef] [PubMed]
  25. Homo Sapiens UCSC Hg19 Human Genome Sequence from iGenome. Available online: https://support.illumina.com/sequencing/sequencing_software/igenome.html (accessed on 8 December 2014).
  26. Langmead, B.; Salzberg, S.L. Fast gapped-read alignment with Bowtie 2. Nat. Methods 2012, 9, 357–359. [Google Scholar] [CrossRef] [PubMed]
  27. Ewing, B.; Green, P. Base-calling of automated sequencer traces using phred. II. Error probabilities. Genome Res. 1998, 8, 186–194. [Google Scholar] [CrossRef]
  28. Edgar, R.C.; Haas, B.J.; Clemente, J.C.; Quince, C.; Knight, R. UCHIME improves sensitivity and speed of chimera detection. Bioinformatics 2011, 27, 2194–2200. [Google Scholar] [CrossRef]
  29. Schloss, P.D.; Gevers, D.; Westcott, S.L. Reducing the effects of PCR amplification and sequencing artifacts on 16S rRNA-based studies. PLoS ONE 2011, 6, e27310. [Google Scholar] [CrossRef]
  30. Pruesse, E.; Peplies, J.; Glockner, F.O. SINA: Accurate high-throughput multiple sequence alignment of ribosomal RNA genes. Bioinformatics 2012, 28, 1823–1829. [Google Scholar] [CrossRef] [PubMed]
  31. Quast, C.; Pruesse, E.; Yilmaz, P.; Gerken, J.; Schweer, T.; Yarza, P.; Peplies, J.; Glockner, F.O. The SILVA ribosomal RNA gene database project: Improved data processing and web-based tools. Nucleic Acids Res. 2013, 41, D590–D596. [Google Scholar] [CrossRef]
  32. Robertson, C.E.; Harris, J.K.; Wagner, B.D.; Granger, D.; Browne, K.; Tatem, B.; Feazel, L.M.; Park, K.; Pace, N.R.; Frank, D.N. Explicet: Graphical user interface software for metadata-driven management, analysis and visualization of microbiome data. Bioinformatics 2013, 29, 3100–3101. [Google Scholar] [CrossRef] [PubMed]
  33. A Language and Environment for Statistical Computing; R Foundation for Statistical Computing: Vienna, Austria, 2019.
  34. Anderson, M.J.J. A new method for non-parametric multivariate analysis of variance. Austral. Ecol. 2001, 26, 32–46. [Google Scholar] [CrossRef]
  35. Oksanen, J.B.G.; Friendly, M.; Kindt, R.; Legendre, P.; McGlinn, D.; Minchin, P.R.; O’Hara, R.B.; Simpson, G.L.; Solymos, P.; Stevens, M.H.; et al. Vegan: Community Ecology Package. R Package version 2.5-4. 2019. Available online: https://cran.r-project.org/web/packages/vegan/index.html (accessed on 16 July 2023).
  36. Benjamini, Y.; Hochberg, Y. Controlling the false discovery rate: A practical and powerful approach to multiple testing. J. R. Stat. Soc. Ser. B Methodol. 1995, 57, 289–300. [Google Scholar] [CrossRef]
  37. Fernandes, A.D.; Macklaim, J.M.; Linn, T.G.; Reid, G.; Gloor, G.B. ANOVA-like differential expression (ALDEx) analysis for mixed population RNA-Seq. PLoS ONE 2013, 8, e67019. [Google Scholar] [CrossRef] [PubMed]
  38. Fernandes, A.D.; Reid, J.N.; Macklaim, J.M.; McMurrough, T.A.; Edgell, D.R.; Gloor, G.B. Unifying the analysis of high-throughput sequencing datasets: Characterizing RNA-seq, 16S rRNA gene sequencing and selective growth experiments by compositional data analysis. Microbiome 2014, 2, 15. [Google Scholar] [CrossRef]
  39. Grummer-Strawn, L.M.; Reinold, C.; Krebs, N.F.; Centers for Disease Control and Prevention. Use of World Health Organization and CDC growth charts for children aged 0–59 months in the United States. MMWR Recomm. Rep. 2010, 59, 1–15. [Google Scholar] [PubMed]
  40. de Onis, M.; Onyango, A.W.; Borghi, E.; Siyam, A.; Nishida, C.; Siekmann, J. Development of a WHO growth reference for school-aged children and adolescents. Bull. World Health Organ. 2007, 85, 660–667. [Google Scholar] [CrossRef] [PubMed]
  41. Cole, T.J.; Bellizzi, M.C.; Flegal, K.M.; Dietz, W.H. Establishing a standard definition for child overweight and obesity worldwide: International survey. BMJ Clin. Res. Ed 2000, 320, 1240–1243. [Google Scholar] [CrossRef]
  42. Joseph, N.; Clayton, J.B.; Hoops, S.L.; Linhardt, C.A.; Mohd Hashim, A.; Mohd Yusof, B.N.; Kumar, S.; Amin Nordin, S. Alteration of the Gut Microbiome in Normal and Overweight School Children from Selangor with Lactobacillus Fermented Milk Administration. Evol. Bioinform. Online 2020, 16, 1176934320965943. [Google Scholar] [CrossRef]
  43. Wutthi-In, M.; Cheevadhanarak, S.; Yasom, S.; Kerdphoo, S.; Thiennimitr, P.; Phrommintikul, A.; Chattipakorn, N.; Kittichotirat, W.; Chattipakorn, S. Gut Microbiota Profiles of Treated Metabolic Syndrome Patients and their Relationship with Metabolic Health. Sci. Rep. 2020, 10, 10085. [Google Scholar] [CrossRef]
  44. Qin, Q.; Yan, S.; Yang, Y.; Chen, J.; Li, T.; Gao, X.; Yan, H.; Wang, Y.; Wang, J.; Wang, S.; et al. A Metagenome-Wide Association Study of the Gut Microbiome and Metabolic Syndrome. Front. Microbiol. 2021, 12, 682721. [Google Scholar] [CrossRef] [PubMed]
  45. Haro, C.; Garcia-Carpintero, S.; Alcala-Diaz, J.F.; Gomez-Delgado, F.; Delgado-Lista, J.; Perez-Martinez, P.; Rangel Zuniga, O.A.; Quintana-Navarro, G.M.; Landa, B.B.; Clemente, J.C.; et al. The gut microbial community in metabolic syndrome patients is modified by diet. J. Nutr. Biochem. 2016, 27, 27–31. [Google Scholar] [CrossRef] [PubMed]
  46. Zhong, H.; Penders, J.; Shi, Z.; Ren, H.; Cai, K.; Fang, C.; Ding, Q.; Thijs, C.; Blaak, E.E.; Stehouwer, C.D.A.; et al. Impact of early events and lifestyle on the gut microbiota and metabolic phenotypes in young school-age children. Microbiome 2019, 7, 2. [Google Scholar] [CrossRef] [PubMed]
  47. Nirmalkar, K.; Murugesan, S.; Pizano-Zarate, M.L.; Villalobos-Flores, L.E.; Garcia-Gonzalez, C.; Morales-Hernandez, R.M.; Nunez-Hernandez, J.A.; Hernandez-Quiroz, F.; Romero-Figueroa, M.D.S.; Hernandez-Guerrero, C.; et al. Gut Microbiota and Endothelial Dysfunction Markers in Obese Mexican Children and Adolescents. Nutrients 2018, 10, 2009. [Google Scholar] [CrossRef] [PubMed]
  48. Gallardo-Becerra, L.; Cornejo-Granados, F.; Garcia-Lopez, R.; Valdez-Lara, A.; Bikel, S.; Canizales-Quinteros, S.; Lopez-Contreras, B.E.; Mendoza-Vargas, A.; Nielsen, H.; Ochoa-Leyva, A. Metatranscriptomic analysis to define the Secrebiome, and 16S rRNA profiling of the gut microbiome in obesity and metabolic syndrome of Mexican children. Microb. Cell Fact. 2020, 19, 61. [Google Scholar] [CrossRef]
  49. Parekh, P.J.; Balart, L.A.; Johnson, D.A. The Influence of the Gut Microbiome on Obesity, Metabolic Syndrome and Gastrointestinal Disease. Clin. Transl. Gastroenterol. 2015, 6, e91. [Google Scholar] [CrossRef]
Figure 1. Flow chart of participants recruited and the samples obtained.
Obesities 03 00021 g001
Figure 2. Intestinal microbiota differed in overall composition (β diversity) according to BMI and MetS category. Relative abundances of taxa are summarized at the phylum and genus levels and stratified using both body mass index (BMI; kg/m2) and occurrence of metabolic syndrome (MetS). Between-group differences in β diversity were evaluated using permutational ANOVA. Significant results are indicated by asterisks. Abbreviations: Ob, obese; MetS, metabolic syndrome; BMI-A (<30); BMI-B (≥30). Note: ● = p < 0.1, * = p < 0.05, ** = p < 0.01.
Obesities 03 00021 g002
Figure 3. α diversity indices do not differ by MetS or BMI categories. Violin plots of α diversity indices, including richness, evenness, and Shannon diversity, stratified using (A) disease category of obesity and metabolic syndrome and (B) BMI-A (<30) and BMI-B (≥30). Abbreviations: Div., diversity; BMI, body mass index.
Obesities 03 00021 g003
Figure 4. Differentially abundant taxa according to the MetS and BMI categories. The left column of panels shows volcano plots of fold-change (FC; Log2 transformed) vs. p-values (−Log10 transformed) ascertained via ALDEx2 analysis. Vertical and horizontal dashed lines represent cut-offs of FC ≥ 1.5 and p-value ≤ 0.1, respectively. The right column of panels shows the ALDEx2-calculated effect sizes of taxa meeting FC and p-value cutoffs. In all panels, taxa enriched in the reference group (Ob or BMI-A) are highlighted in ed with FC and effect sizes less than zero, while taxa enriched in comparison groups (MetS or BMI-B) are highlighted in blue with FC and effect sizes greater than zero. (A) Genus-level differences between the Ob and MetS groups. (B) Genus-level differences in the BMI-A vs. BMI-B groups. (C) Phylum-level differences in the Ob vs. MetS groups. (D) Phylum-level differences in the BMI-A vs. BMI-B groups. Abbreviations: Ob, obese; MetS, metabolic syndrome; g, grams; BMI, body mass index (kg/m2); BMI-A (<30); BMI-B (≥30).
Obesities 03 00021 g004
Table 1. Baseline characteristics.
VariableOB (N = 33)MetS (N = 17)p Value
Age (Years)14.7 ± 2.314.6 ± 2.50.9090t
Males18 (54.6%)11 (64.7%)0.490f
White
Latino
Other
20 (60.6%)
7 (21.2%)
6 (18.2%)
6 (35.3%)
6 (35.3%)
5 (29.41%)
0.237f
Body mass index (kg/m2)32.5 ± 4.335.3 ± 7.80.1060t
Waist circumference (cm)102.7 ± 15.5105.5 ± 24.60.83t
Height (cm)164.4 ± 8.7162.6 ± 11.60.5477t
Triglycerides115.3 ± 47.6218.2 ± 127.50.0007t
HDL-cholesterol47.0 ± 7.438.8 ± 13.60.0158t
Systolic BPi0.91 ± 0.061.0 ± 0.10.0008t
Diastolic BPi0.84 ± 0.090.94 ± 0.120.0021t
Hemoglobin A1C (%)5.5 ± 0.35.8 ± 0.50.0229t
Family history of diabetes mellitus9 (27.3%)10 (58.8%)0.029f
Values are presented as median and interquartile range (25th percentile–75th percentile), except for categoric data shown as count (%). Abbreviations: HDL, high-density lipoprotein; Bpi, blood pressure index.
Table 2. Nutrient intake and dietary analysis for seven days.
VariableOb (N = 20)MetS (N = 10)t
Age (years)14 ± 2.316.2 ± 1.40.01
Male11(55%)5 (50%)0.99f
Latino7 (35%)2 (20%)0.55f
BMI31.9 (IQR 28.7, 34)33.7 (IQR 32.6, 35.8)0.12k
Average Intake Per Day
Kilocalories1670.9 ± 555.61557.4 ± 380.70.57t
Protein (g)68.2 ± 18.669.6 ± 12.80.83t
Carbohydrate (g)210.1 (IQR 133.7, 289.4)190.9 (IQR 166.8, 199.2)0.96k
Sugar, Total (g)88.0 (IQR 31.5, 109.4)68.4 (IQR 46.1, 76.4)0.92k
Total Dietary Fiber (g)12.5 ± 4.815.7 ± 6.60.14t
Fat (g)62.7 (IQR 47.2, 78.8)55.9 (IQR 51.6, 55.6)0.21k
Saturated fat (g)23.1 ± 9.118.6 ± 4.20.16t
Sodium (mg)2656.9 ± 765.72563.4 ± 471.40.73t
Potassium (mg)1383.7 ± 458.91766.5 ± 520.40.049t
Vitamin D (IU)100.5 (IQR 39.6, 163.7)170.5 (IQR 146.3, 174.2)0.02k
Folate (ug)216.7 (IQR 122.5, 305.4)409.6 (IQR 273.5, 476.5)0.005k
Caffeine (mg)15.7 (IQR 0, 22.1)1.2 (IQR 0, 3.6)0.19k
Values are presented as median and interquartile range (25th percentile–75th percentile), except for categoric data shown as count (%). Abbreviations: Ob, obese; MetS, metabolic syndrome; g, grams; BMI, body mass index (kg/m2); f, Fisher’s exact test; t, Student t test; k, Kruskal–Wallis; IQR, interquartile range.
Table 3. Summary of permutational ANOVA (PERMANOVA) tests of β diversity.
PERMANOVA p-Value
VariableGenusPhylumNotes
Disease Category0.320.77Ob vs. MetS
BMI0.0130.0028BMI < 30 vs. BMI ≥ 30
Age0.0540.31Years
Sex0.750.93F vs. M
Ethnicity0.0460.052Asian, Black, Latino, White, and other
SBPI0.550.56High vs. Low SBPI (SBPI > 1)
DBPI0.360.59High vs. Low DBPI (DBPI > 1)
abBP0.240.68Low BP vs. High (SBPI OR DBPI)
Abbreviations: Ob, obese; MetS, metabolic syndrome; BMI, body mass index (kg/m2); BMI-A (<30) and BMI-B (≥30); SBPI, systolic blood pressure index; DBPI, diastolic blood pressure index; abBP, abnormal blood pressure.
Disclaimer/Publisher’s Note: The statements, opinions and data contained in all publications are solely those of the individual author(s) and contributor(s) and not of MDPI and/or the editor(s). MDPI and/or the editor(s) disclaim responsibility for any injury to people or property resulting from any ideas, methods, instructions or products referred to in the content.

