Article

Investigation of Mechano-Electrochemical Effects on Hydrogen Distribution at Corrosion Defects

1
Gathering and Transportation Engineering Technology Research Institute, PetroChina Southwest Oil & Gasfield Company, Chengdu 610041, China
2
School of Safety and Ocean Engineering, China University of Petroleum (Beijing), Beijing 102249, China
3
National Institute of Clean-and-Low-Carbon Energy, Beijing 102211, China
*
Authors to whom correspondence should be addressed.
Hydrogen 2025, 6(3), 69; https://doi.org/10.3390/hydrogen6030069
Submission received: 25 June 2025 / Revised: 28 August 2025 / Accepted: 28 August 2025 / Published: 12 September 2025
(This article belongs to the Special Issue Advances in Hydrogen Production, Storage, and Utilization)

Abstract

This study employed tensile test, hydrogen permeation measurements, and potentiodynamic polarization testing to investigate the mechanical properties, hydrogen diffusion coefficients, and electrochemical behavior of X80 steel. A multifield coupled finite element (FE) model was developed that incorporated the mechano-electrochemical (M-E) effect to analyze the stress–strain distribution, anodic equilibrium potential, cathodic exchange current density, and hydrogen distribution characteristics at pipeline corrosion defects under varying tensile strains. The results indicated that tensile strain significantly modulated the anodic equilibrium potential and cathodic exchange current density, leading to localized hydrogen accumulation at corrosion defects. The stress concentration and plastic deformation at the defect site intensified as the tensile strain increased, further promoting hydrogen enrichment. The study concluded that the M-E effect exacerbated hydrogen enrichment at the defect sites, increasing the risk of hydrogen-induced cracking. The simulation results showed that the hydrogen distribution state aligned with the stress–hydrogen diffusion coupling model when considering the M-E effect. However, the M-E effect slightly increased the hydrogen concentration at the defect. These findings provide critical insights for enhancing the safety and durability of hydrogen transmission pipelines.

1. Introduction

Fossil fuels release large amounts of greenhouse gases that lead to abnormal climate change and the frequent extreme weather events [1]. Therefore, replacing existing fossil fuels with environmentally friendly and sustainable new energy has become an important issue during the development of current international energy strategies. Hydrogen energy shows promise as a vital future energy source due to its high efficiency, cleanliness, and low carbon emissions [2]. Although transportation via preexisting pipelines can increase hydrogen gas utilization efficiency [3], these pipelines are built for large-scale, long-distance natural gas transportation and are highly sensitive to hydrogen embrittlement (HE) due to their strength [4]. According to the current research findings, the higher the strength of steel, the more sensitive it becomes to hydrogen embrittlement. Hydrogen transportation also increases the risk of corrosion failure on the outer pipeline wall. Therefore, to prevent soil corrosion, a protective coating is applied to the external surfaces of buried pipelines [5], which can be damaged by long-term service and aggravate the degree of corrosion [6]. Therefore, the pipeline transportation of hydrogen presents various challenges that require further investigation.
Although various studies have explored these two typical failure mechanisms, the synergistic effect between them remains largely ignored. First, corrosion defects can form on the steel pipeline surface exposed to soil due to a damaged protective coating [7], which, in turn, can enhance the local stress concentration, resulting in local hydrogen accumulation [8]. Moreover, local stress at the tips of corrosion defects caused by internal pressure can accelerate hydrogen accumulation [9,10], which can aggravate cracking propagation [11]. Therefore, the synergistic effect of the load and electrochemical reaction will exacerbate the corrosion failure of pipeline steel, intensify hydrogen damage, and ultimately pose safety risks to future hydrogen energy transportation.
This study determines the mechanical properties, hydrogen diffusion coefficient, and potential polarization characteristics of X80 steel via tensile test, hydrogen permeation, and potential polarization tests. A finite element (FE) model was established of the mechano-electrochemical (M-E) effect on hydrogen distribution to analyze the Von Mises stress, hydrostatic stress, and equivalent plastic strain distribution at the corrosion defects of a X80 pipeline under different degrees of tensile strain. The anode equilibrium potential, cathode exchange current density, and hydrogen distribution were also analyzed. Finally, the hydrogen diffusion and enrichment at the corrosion defects in the pipeline were revealed.

2. Experimental Procedures

2.1. Materials and Tensile Tests

X80 steel was selected for testing, and the chemical compositions are shown in Table 1.
Figure 1 shows the flat dog-bone-type specimens, which were machined in the rolling direction. The uniaxial tensile tests were performed at a strain rate of 1 × 10⁻⁴ s−1 at room temperature using an MTS Landmark tensile testing machine.

2.2. Electrochemical Measurements

An electrochemical workstation (Ivium-n-Stat, Ivium Technologies BV, Eindhoven, The Netherland) was used for the electrochemical measurements. A platinum wire and saturated calomel electrode (SCE) served as the counter and reference electrodes, respectively. The samples were mechanically polished before the electrochemical tests, which were conducted at approximately 298 K. A solution was used for nitrogen purging throughout the experiment to remove oxygen.

2.2.1. Hydrogen Permeation Test

The hydrogen diffusion was characterized using the modified “Devanathan–Stachurski cell” [12] (Figure 2). The exit side of the sample was coated with a 100 nm Ni film to achieve a sufficiently low anodic current. The solution-exposed surface was 4.91 cm2 (a circle with a diameter of 25 mm). The exit side was immersed in a sodium hydroxide solution (0.1 M NaOH) to determine the anodic overpotential (0.200 V). A mixed charging solution (0.5 M H2SO4, 0.2 g/L CH4N2S) was used for the entrance while −1100 mV was used as the overpotential. The effective diffusion coefficient ( D eff ) was calculated using the “time-lag” method [13]:
t 0.63 = L 2 6 D e f f
J = i F
C a p p = J L / D e f f
where L is the membrane thickness, t 0.63 is the time where i i 0 / i i 0 = 0.63 , i 0 is the initial current density of the hydrogen permeation curve, i is the steady-state current density of the hydrogen permeation curve, J is the hydrogen diffusion flux, and C app is the subsurface hydrogen concentration.

2.2.2. Potentiodynamic Polarization Tests

The potentiodynamic polarization tests were performed in an NS4 solution containing 483 mg/L NaHCO3, 122 mg/L KCl, 181 mg/L CaCl2·2H2O, and 131 mg/L MgSO4·7H2O. The potentiodynamic polarization curves were obtained at 0.5 mV/s.
The electrochemical anodic and cathodic reactions of the X80 steel in the deoxygenated, near-neutral pH NS4 solution represented steel oxidation and hydrogen evolution, respectively [14].
Anodic reaction:
F e F e 2 + + 2 e
Cathodic reaction:
H 2 O + e H + O H
It was assumed that the dominant anodic reaction was the dissolution of the iron in the steel, and that the pipeline steel was in an active dissolution state in the test solution. Although the cathodic reaction was described as the single electron production of atomic hydrogen, the destination of the produced atomic hydrogen was not specified [15]. The electrode kinetics of the steel for the anodic and cathodic reactions were activation-controlled and described as follows:
i a = i 0 , a e x p η a b
i c = i 0 , c e x p η c b
η = ϕ ϕ e q
where i and i0 represent the charge-transfer and exchange current densities of the electrochemical reactions, respectively. Φ and Φeq denote the electrode and equilibrium electrode potential, respectively, while η is the activation overpotential, and b is the Tafel slope.
Nernst equations were used to obtain the equilibrium potentials of the steel oxidation and hydrogen evolution:
ϕ a , e q 0 = ϕ a , e q 0 , s + 0.0592 2 l o g F e 2 +
ϕ c , e q 0 = ϕ c , e q 0 , s + 0.0592 l o g H + = 0.0592 p H
where ϕ a , eq 0 , s and ϕ c , eq 0 , s are the standard equilibrium potentials for the anodic and cathodic reactions, which are calculated as −0.859 VSCE and −0.644 VSCE [15].

2.3. FE Simulation

2.3.1. Initial and Boundary Conditions

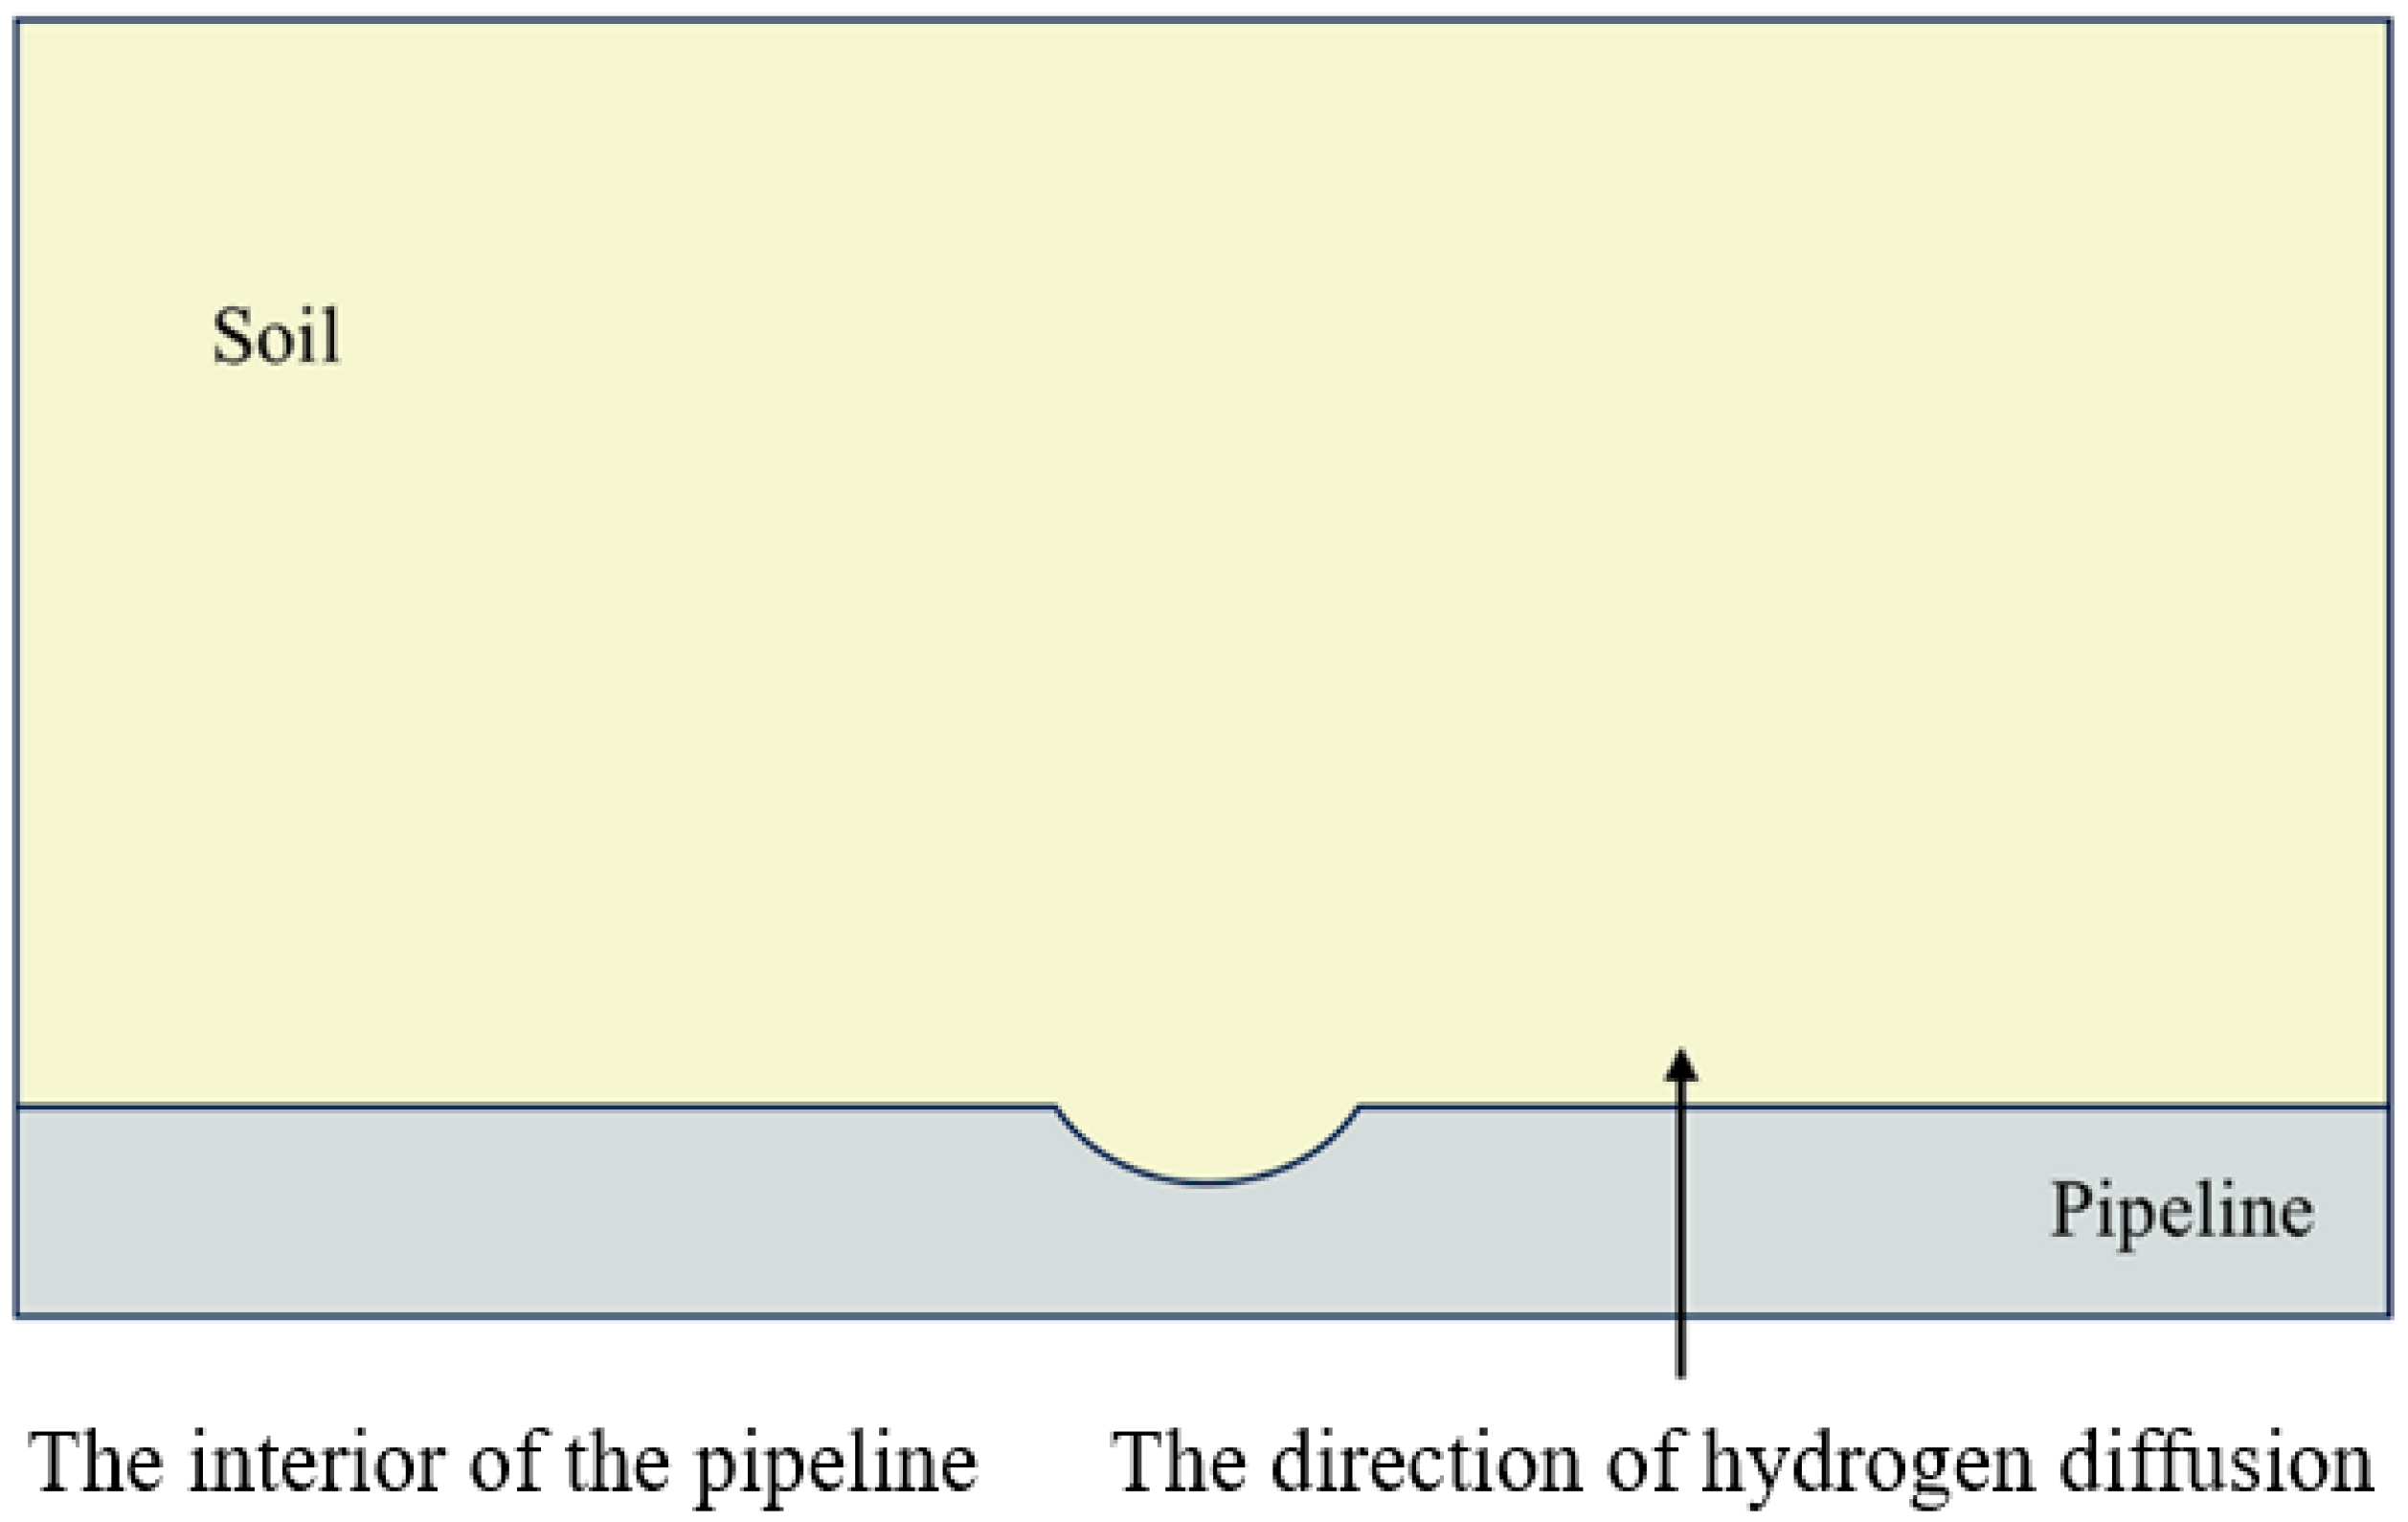
Commercial COMSOL Multiphysics 6.0 software was used for multifield coupling simulations of the mechanical, electrochemical, and hydrogen diffusion. Figure 3 shows the geometrical model of the X80 steel pipe containing an external corrosion defect. The thickness and length of the pipe were 18.4 mm and 1 m, respectively. The corrosion defect was elliptical, with a length and depth of 40 mm and 7.36 mm, respectively. The depth of the defects changed during the corrosion process.
The contact boundary between the solution and the pipeline was set as the free boundary, while the other boundary conditions of the solution were electrically isolated. During the deformation process, the left side of the pipeline was fixed, which was subjected to various tensile strains (0, 0.1%, 0.2%, 0.3%, and 0.4%). The inner wall of the pipeline was set as the hydrogen source during hydrogen fusion. The initial hydrogen concentration (mol/m3) was obtained from the hydrogen permeation test. The unit of mol/m3 could be converted to ppm by 1 mol/m3 = 0.13 ppm [16].
A triangular mesh type was used, which consisted of 5503 domain cells and 439 boundary cells. The maximum and minimum element sizes of the pipeline were 6 mm and 1 mm, respectively, with a maximum element growth rate of 1.05. The curvature factor and the narrow area resolution were 0.6 and 1, respectively. Contrarily, the maximum and minimum element sizes of the soil were 134 mm and 8 mm, respectively, with a maximum element growth rate of 1.2. The curvature factor and the narrow area resolution were 0.6 and 1, respectively. The inner wall of the pipeline was set as a hydrogen source, and the initial concentration was determined using a hydrogen permeation test.

2.3.2. Hydrogen Atom Distribution Simulation

The hydrogen atoms in metals move from higher to lower chemical potential positions, causing hydrogen diffusion. The driving force behind the diffusion may include one or more potential gradients. When the interaction between the diffusing substances is not taken into account, the diffusion rate of hydrogen atoms depends on their mobility [17]. If the metal displays an ideal lattice, the diffusion flux J of hydrogen atoms can be expressed using Equation (11) [18]:
J = M C μ
where M represents the hydrogen atom mobility in the lattice, M = D/RT, D is the diffusion coefficient of the hydrogen atoms, R is the general gas constant, T is the absolute temperature, C is the hydrogen concentration in the lattice, and μ is the chemical potential of the hydrogen in the lattice.
If stress is not considered, the chemical potential of the hydrogen atoms is expressed using Equation (12):
μ = μ 0 + R T l n C
where μ0 represents the chemical potential at the reference temperature and pressure.
When the hydrogen atoms occupy tetrahedral or octahedral interstitial positions in the α-iron lattice, the volumes of both interstitial positions expand. If there is external stress, the volume at the gap position is larger, and the chemical potential decreases to a lower level [19]. At this point, the chemical potential μ is expressed using Equation (13):
μ = μ 0 + R T l n C + μ σ
where μσ represents the chemical potential related to external stress, which is expressed using Equation (14) [20]:
μ σ = σ h V h
where σh is the hydrostatic stress, σ h = 1 3 i = 1 3 σ i i , σii is the principal stress, and Vh is the partial molar volume of the hydrogen.
The relationship between hydrogen diffusion flux and hydrogen concentration is obtained by substituting Equations (13) and (14) into Equation (9), as shown in Equation (15):
J = D C + D R T C V h σ h
When considering a random volume surrounded by surface S, the law of mass conservation requires that the change rate of the total hydrogen volume V is equal to the flux through the surface S [16]. Therefore, Equation (16) is used express mass conservation:
𝜕 𝜕 t V C d V + S J n d S = 0
where 𝜕 / 𝜕 t is the partial derivative regarding time, and n is the outward unit normal vector.
The mass conservation equations for the hydrogen concentration C and σh hydrostatic stress m can be obtained by replacing the hydrogen diffusion flux J in Equation (16) with Equation (15), as shown in Equation (17):
𝜕 𝜕 t V C d V + S D C + D R T C V h σ h   n d S = 0
Using the divergence theorem, Equation (17) is expressed as Equation (18):
𝜕 C 𝜕 t + D C + D C V h R T σ h = 0

2.3.3. M-E Effect and Hydrogen Distribution Simulation

Stress Field Simulation
An isotropic hardening model was adopted to simulate the elastoplastic stress–strain on pipelines while the hardening parameter of X80 steel was obtained from the true stress–strain curve.
Electrochemical Field Simulation
(1)
Anodic reaction
Gutman [21] revealed that elastoplastic strain affects the anodic equilibrium potential, as shown in Equations (19) and (20).
Elastic deformation:
φ a , e q e = P V M z F
Plastic deformation:
φ a , e q p = T R z F l n v α N 0 ε p + 1
The anodic equilibrium potential affected by continuous elastoplastic tension is shown in Equation (21):
φ a , e q p = φ a , e q 0 P m V M z F T R z F l n v α N 0 ε p + 1
where Δ φ a , e q 0 is the standard anodic equilibrium potential, Δ P and Δ P m are the excess pressure (equal to 1/3 of the uniaxial tensile stress) and the excess pressure-to-elastic deformation limit (equal to 1/3 of the yield strength of the steel), respectively. Δ φ a , e q e and Δ φ a , e q p represent the shifts in the equilibrium potential of the anodic reaction under elastic and plastic deformation, respectively. P m is the molar volume of the steel (7.13 × 10⁶ m3), z is the number of charges (2 for steel), t is an orientation-dependent factor (0.45), N 0 is the initial dislocation density of the steel (1 × 108 cm−2) [22], ε p is the equivalent plastic strain, and α is a constant (1.67 × 1011 cm−2) [21]. R is the gas constant (8.314 J/mol K), T is the absolute temperature (298.15 K), and F is the Faraday’s constant (96,485 C/mol).
(2)
Cathodic reaction
Plastic deformation enhanced the cathodic reaction by facilitating the redistribution of electrochemical heterogeneities and expanding the cathodic reaction area [21,23]. Simultaneously, during the plastic deformation process, the activation energy of the cathodic reaction was reduced due to the formation of slip bands, microcracks, and other defects [15]. To simplify the FE simulation, a semi-empirical expression that only considered the increase in the exchange current density during plastic deformation was used to describe the M-E effect of the cathodic reaction [15]:
i c = i 0 , c × 10 σ M i s e s V M 6 F b c
where i 0 , c is the exchange current density of hydrogen evolution in the absence of external stress/strain, σ M i s e s is the Von Mises stress, and b c is the cathodic Tafel slope.
Distribution of the Electrical Fields in a Solution
The electrical field distribution in a solution for electrochemical reactions can be determined using electrical field theory [24]:
i k = Q k
i k = σ k φ k
where Q k is a general source term, and σ k and φ k are the conductivity and potential, respectively. The conductivities of the NS4 solution and steel electrode were set as 0.096 S/m and 106 S/m [15].
Multifield Coupling Simulation
The multifield coupled FE simulation of the X80 pipeline assessed three factors: the influence of the M-E effect on hydrogen distribution in the pipeline immersed in the solution, the electrochemical corrosion analysis of the steel/solution interface, and the elastoplastic solid mechanics analysis.
This paper combined five modules in the COMSOL software package: solid mechanics, secondary current distribution, deformation geometry, diluted species transport, and a general-form partial differential equation module. The solid mechanics module was solved first to obtain the relevant mechanical parameters, which were used as inputs in the secondary current distribution module to determine the size changes in the corrosion defects over time. Then, the relevant mechanical parameters and corrosion defect size changes were entered into the diluted species transport module to obtain the hydrogen diffusion behavior and concentration, as well as the deformation geometry and a general-form partial differential equation. Table 2 shows the other parameters of the three-field coupling simulation.

3. Results

3.1. Tensile, Hydrogen Permeation, and Potentiodynamic Polarization Characteristics

Figure 4a illustrates the engineering stress–strain curve of the X80 steel with a yield strength ( σ y ) of 638 MPa. The true stress–strain curve, which was converted from the engineering stress–strain curve, was used to establish the material hardening function in the COMSOL software. Figure 4b shows the transient hydrogen permeation current density curve of the X80 steel, with a steady-state current density ( i ) of 29 μA/cm2, an initial current density ( i 0 ) of 2.54 μA/cm2, a D eff of 7.73 × 10⁻¹⁰ m2/s, and a C app of 1.55 mol/m3.
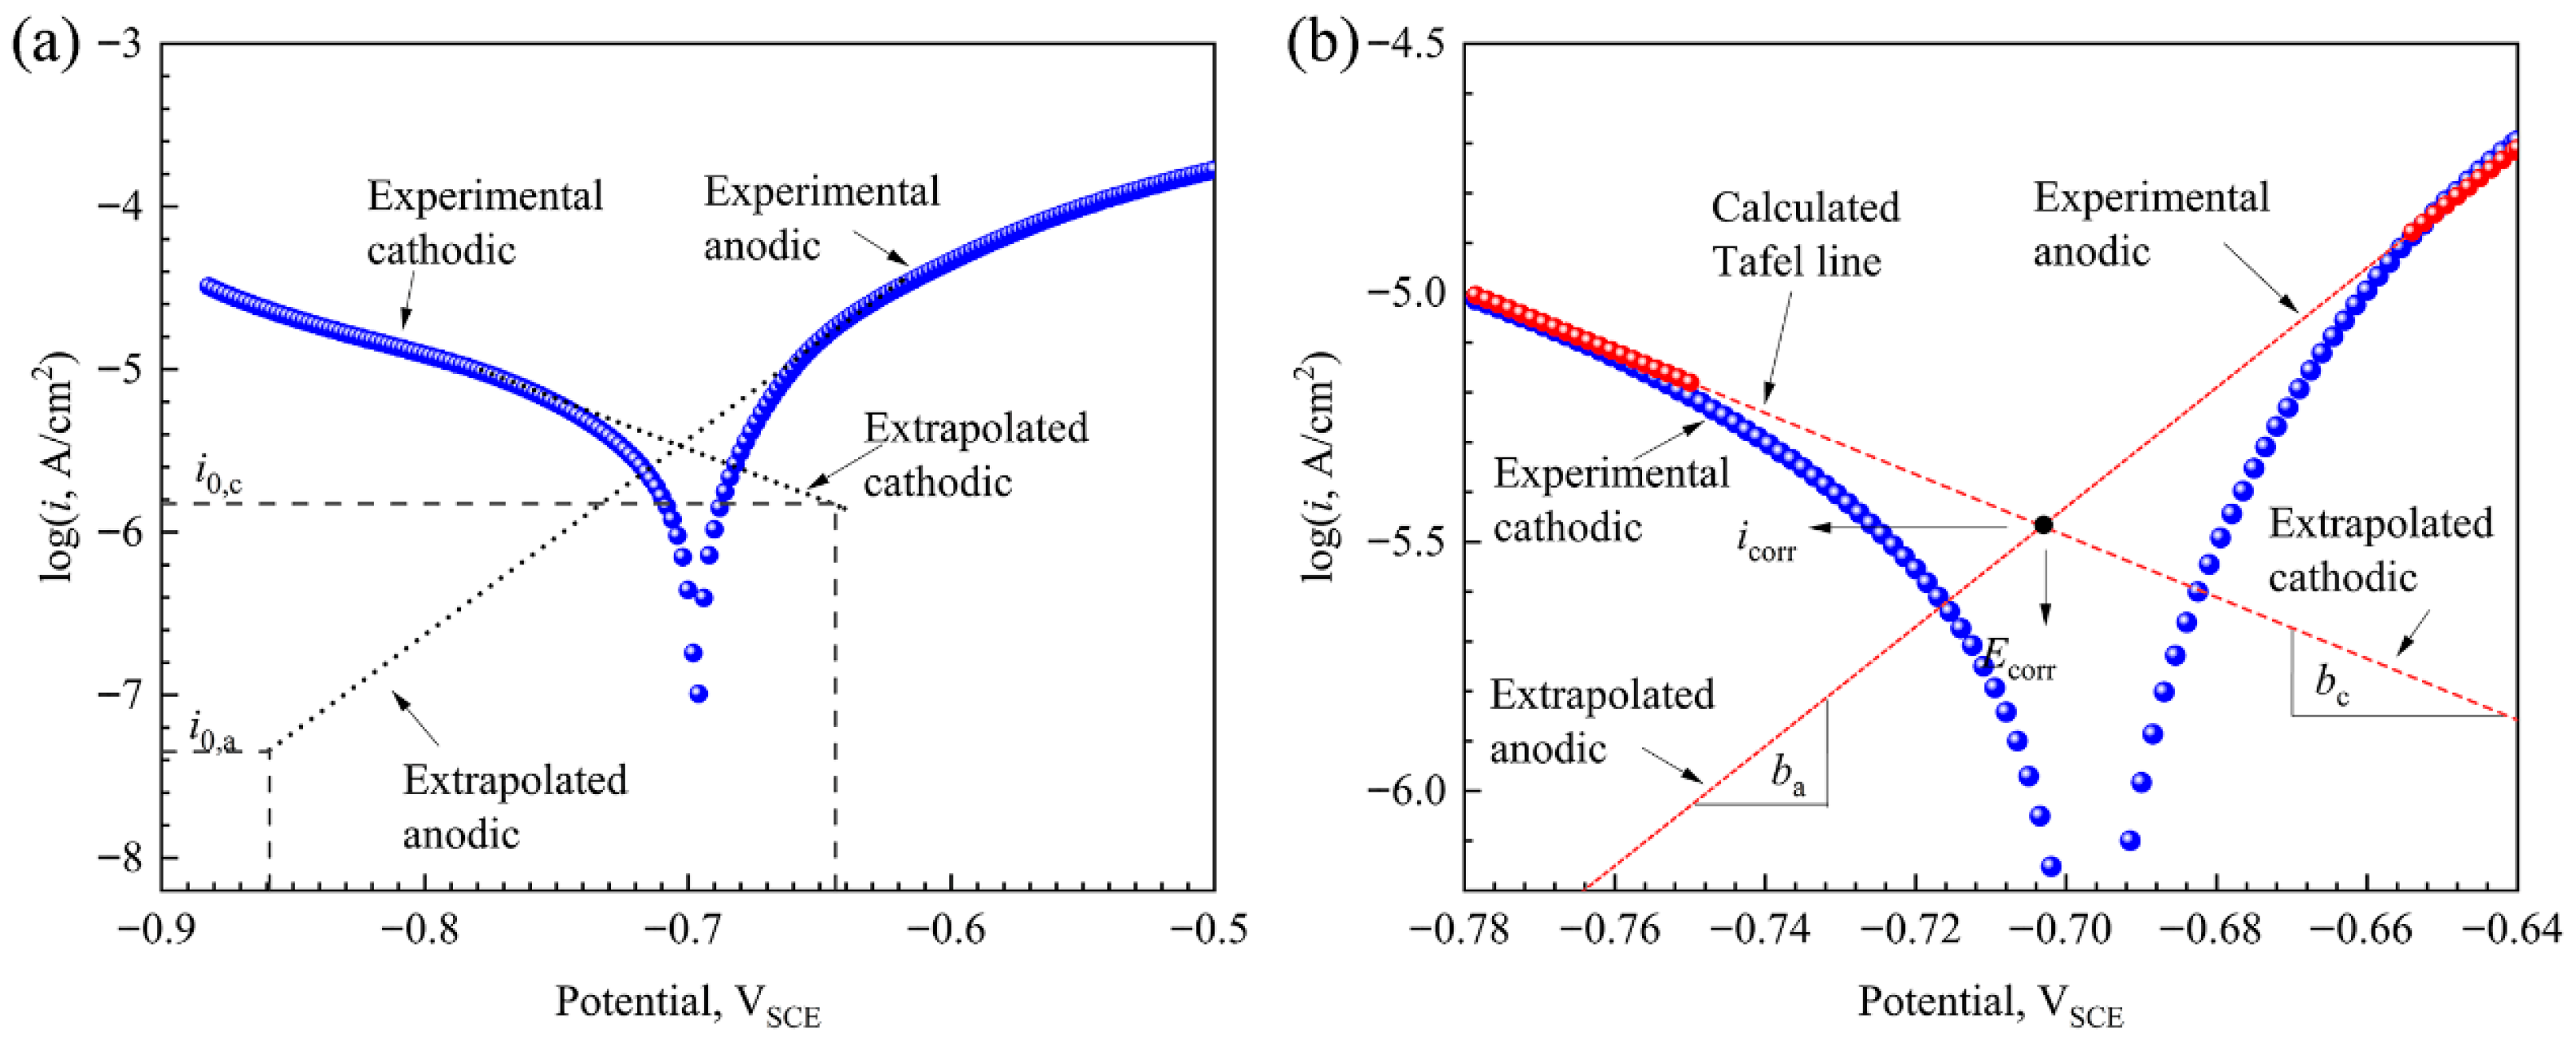
Figure 5 shows the potentiodynamic polarization curve. Various electrochemical corrosion parameters, including the corrosion potential ( E corr ), corrosion current density ( i corr ), anode Tafel slope ( b a ), cathodic Tafel slope ( b c ), anode exchange current density ( i 0 a ), cathodic exchange current density ( i 0 c ), anodic equilibrium potential ( φ 0 a ), and cathodic equilibrium potential ( φ 0 c ), were derived from the polarization curves and used as initial conditions for the FE calculations. Table 3 shows the values of these electrochemical corrosion parameters.

3.2. Stress and Strain Distributions

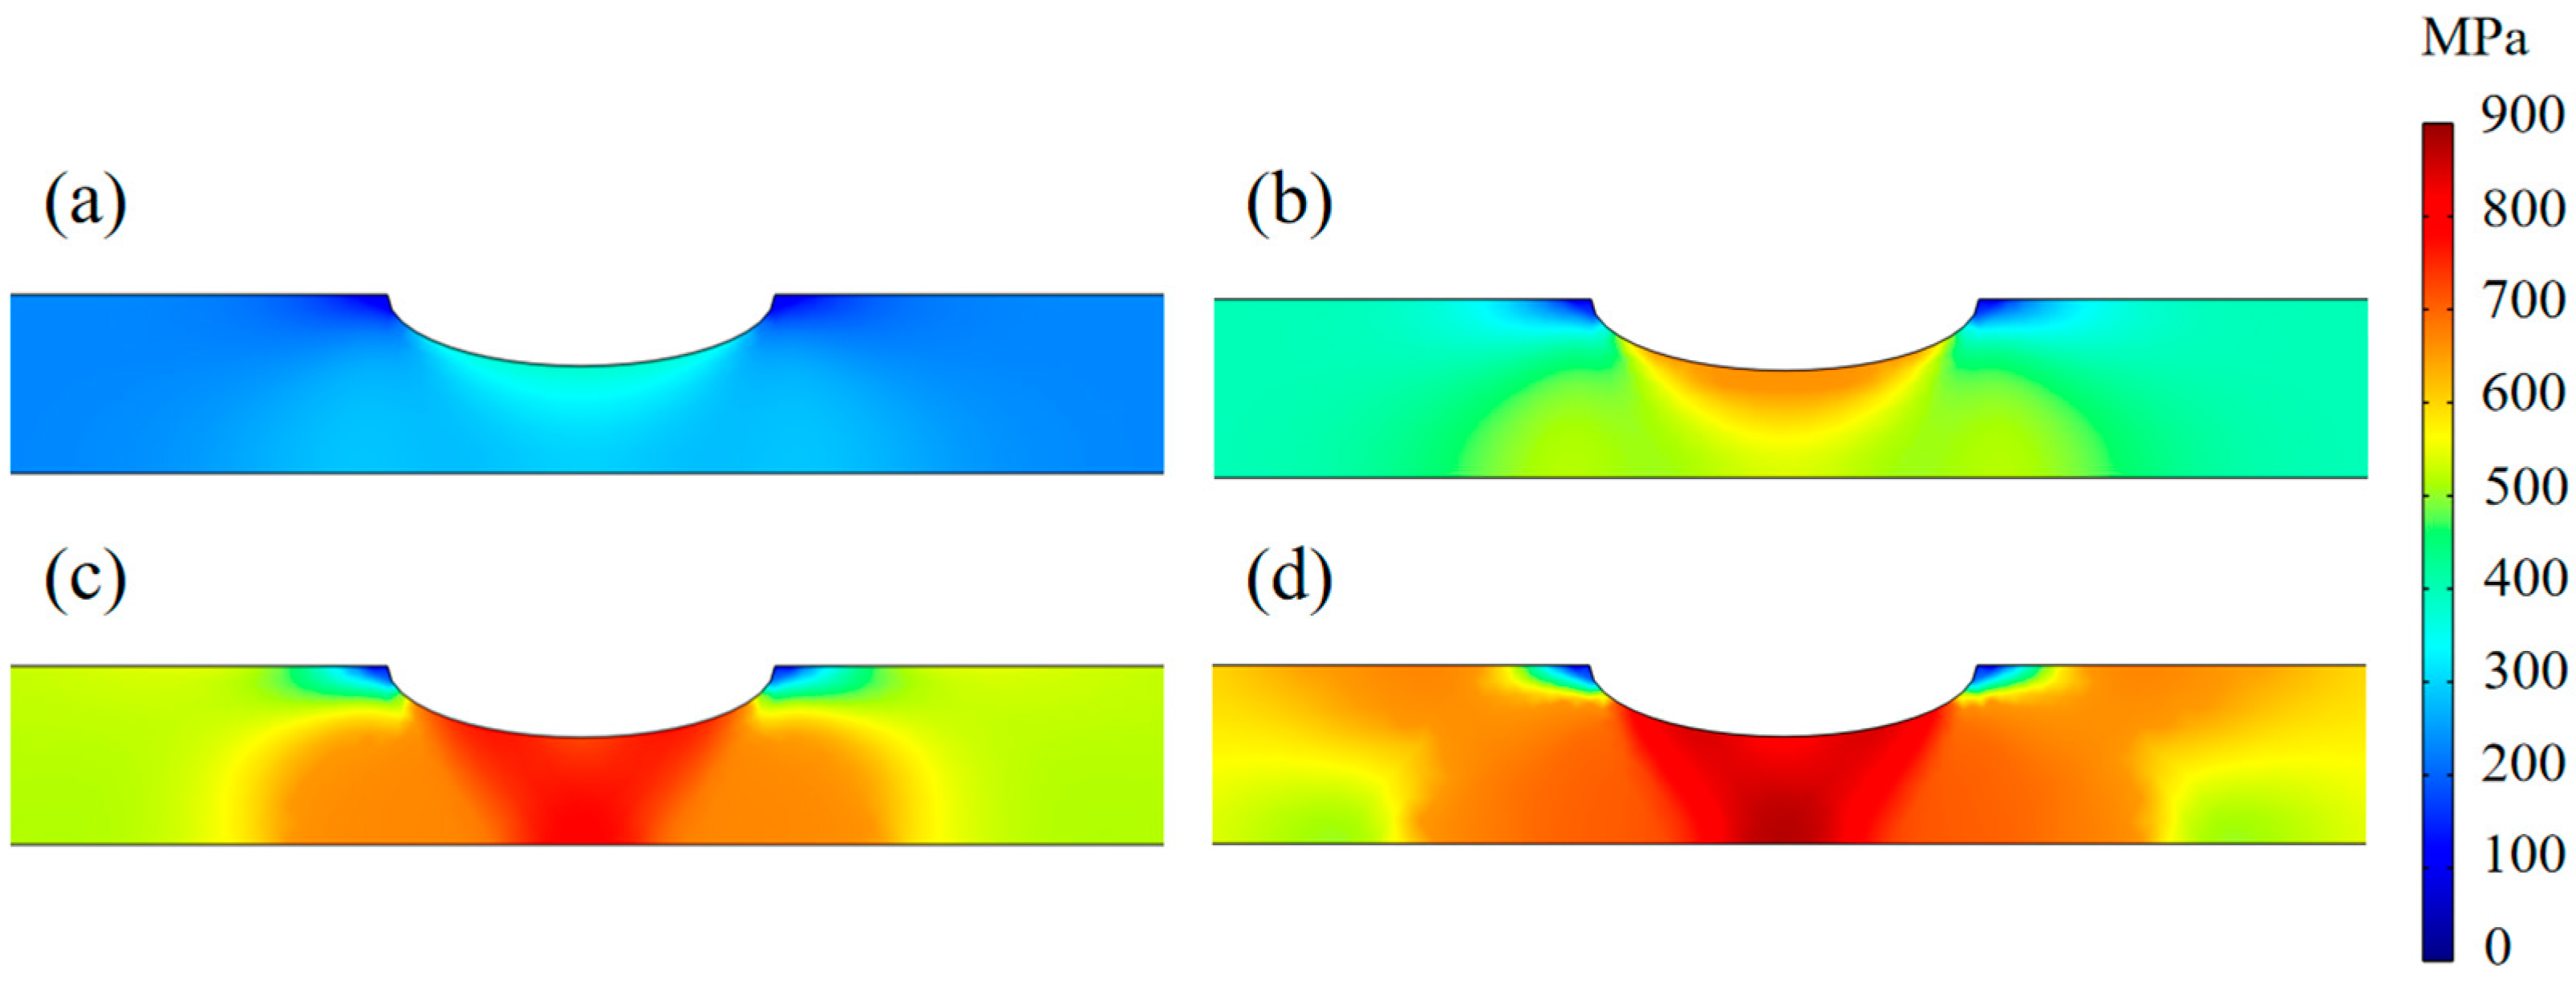
The numerical simulations using the hydrogen diffusion coefficient derived from the hydrogen permeation test indicated that approximately 9 d were required for hydrogen to reach a steady-state distribution in the pipeline model. Figure 6, Figure 7 and Figure 8 show the Von Mises stress, static water stress, and equivalent plastic strain distribution at the corrosion defect of the X80 pipeline under different tensile strains (0.1–0.4%) after simulation for 9 d, where the color legend indicates the stress (MPa). Consistent maximum Von Mises stress localization was evident at the center of the corrosion defect (Figure 6). The local Von Mises stress increased at a higher applied tensile strain. At applied tensile strains of 0.1% and 0.2%, maximum Von Mises stress values of 350 MPa and 600 MPa were present at the center of the corrosion defect, respectively, which were slightly higher than the stress level of the pipeline body. At this juncture, the corrosion defect was subjected to elastic deformation. A tensile strain of 0.3% significantly increased the localized stress at the defect site to 800 MPa, resulting in localized plastic deformation. The Von Mises stress levels in the root and subjacent regions of the defect were equal. At a tensile strain of 0.4%, the maximum Von Mises stress at the corrosion defect approached 900 MPa. However, the Von Mises stress level at the root of the defect was lower than that in the lateral and subjacent regions.
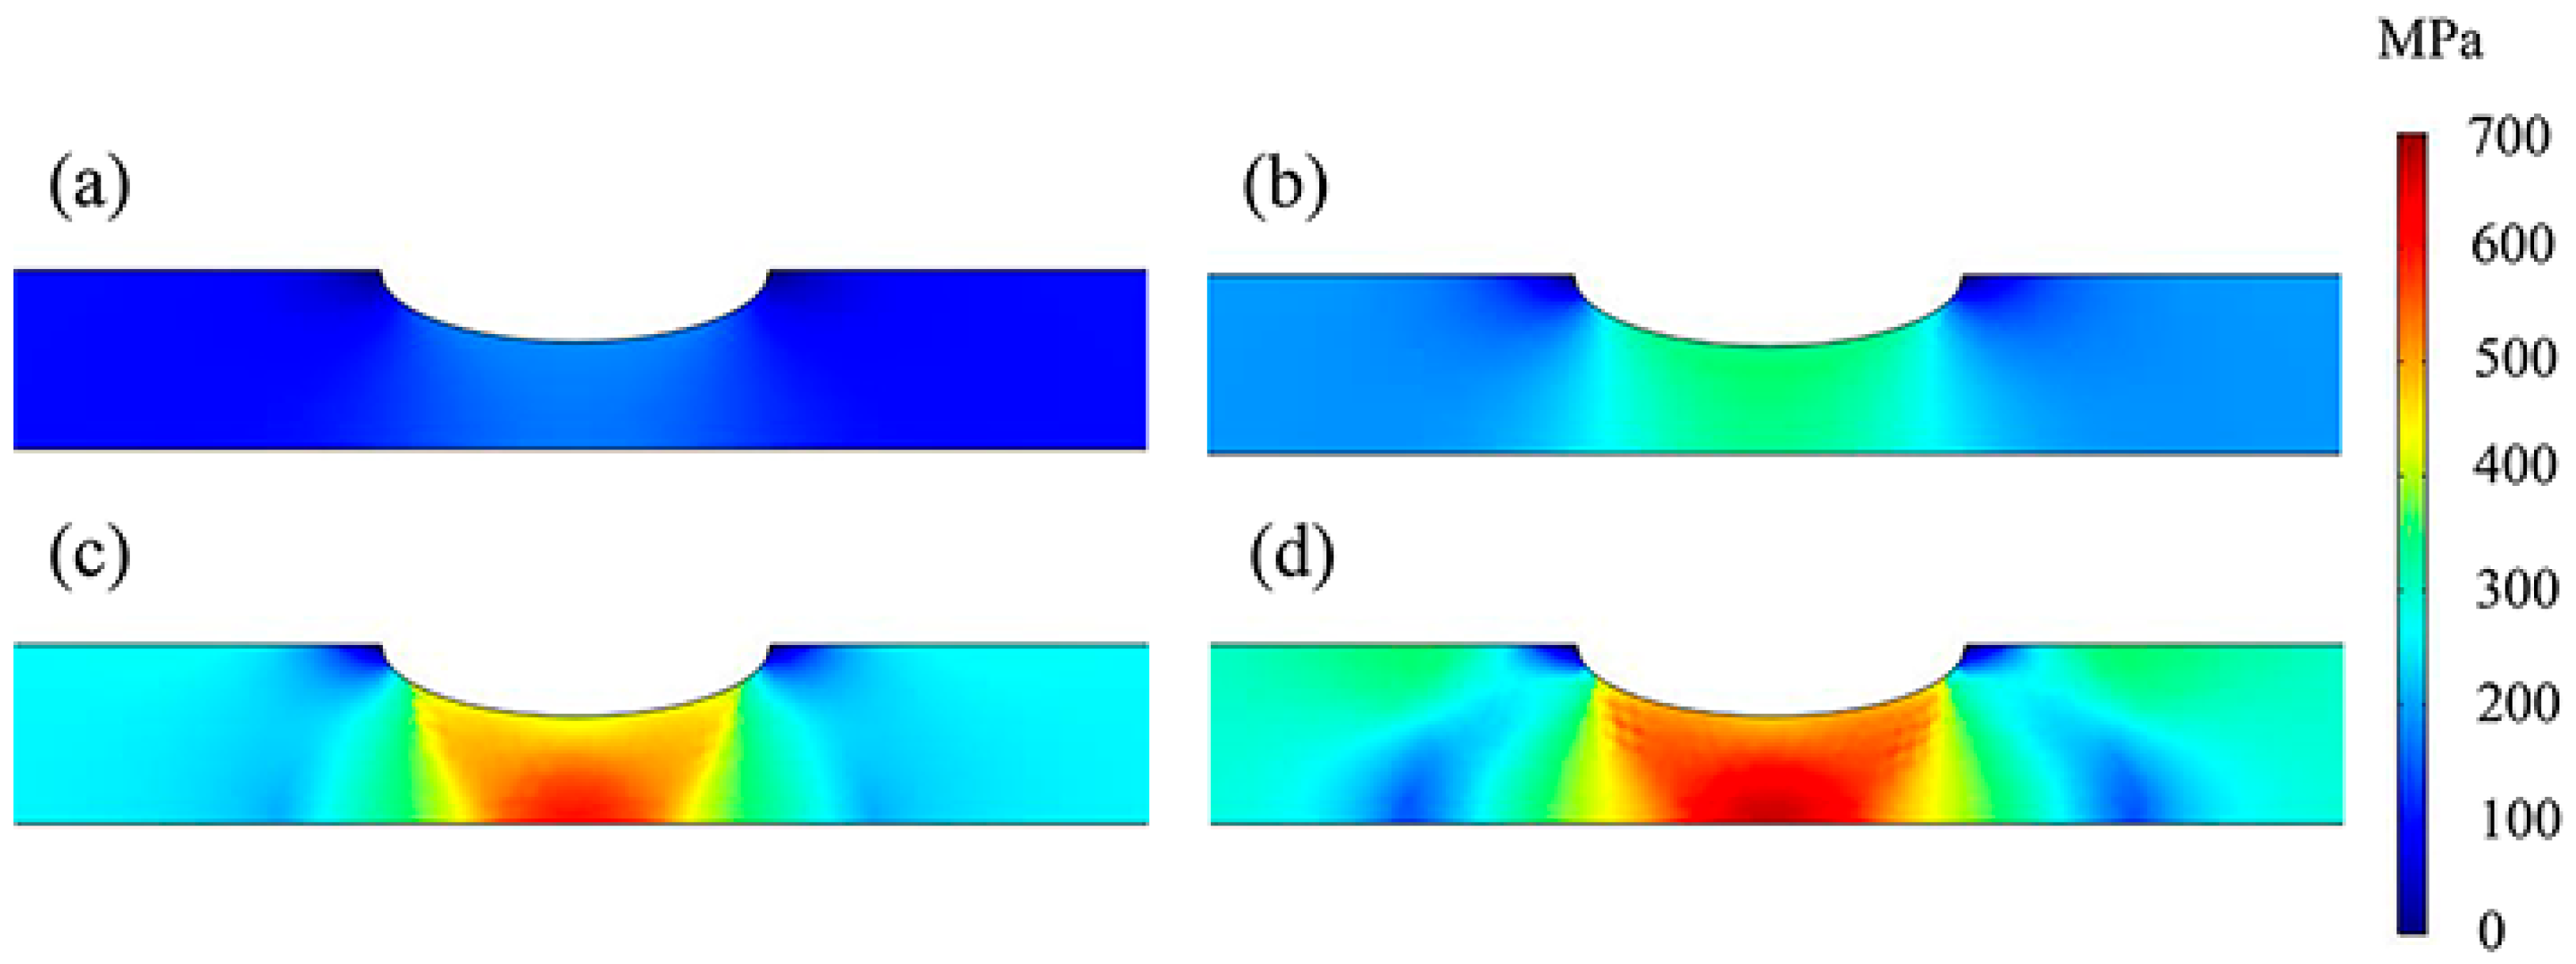
As shown in Figure 7, the magnitude of the local hydrostatic stress increased at a higher tensile strain, with the color legend referring to the hydrostatic stress (MPa). The hydrostatic stress at the corrosion defect (i.e., 200 MPa) was slightly higher than that of the pipeline body at an applied tensile strain of 0.1% and reached approximately 400 MPa at a tensile strain of 0.2%, which was below the yield strength of the steel. At tensile strains below 0.2%, the hydrostatic stress levels in the root and subjacent regions of the defect were essentially equal. When the tensile strain was increased to 0.3%, the local hydrostatic stress rose to 560 MPa, reaching a maximum subjacent to the corrosion defect. At a tensile strain of 0.4%, the maximum hydrostatic stress localized below the defect and along the inner wall of the pipeline reached 670 MPa.
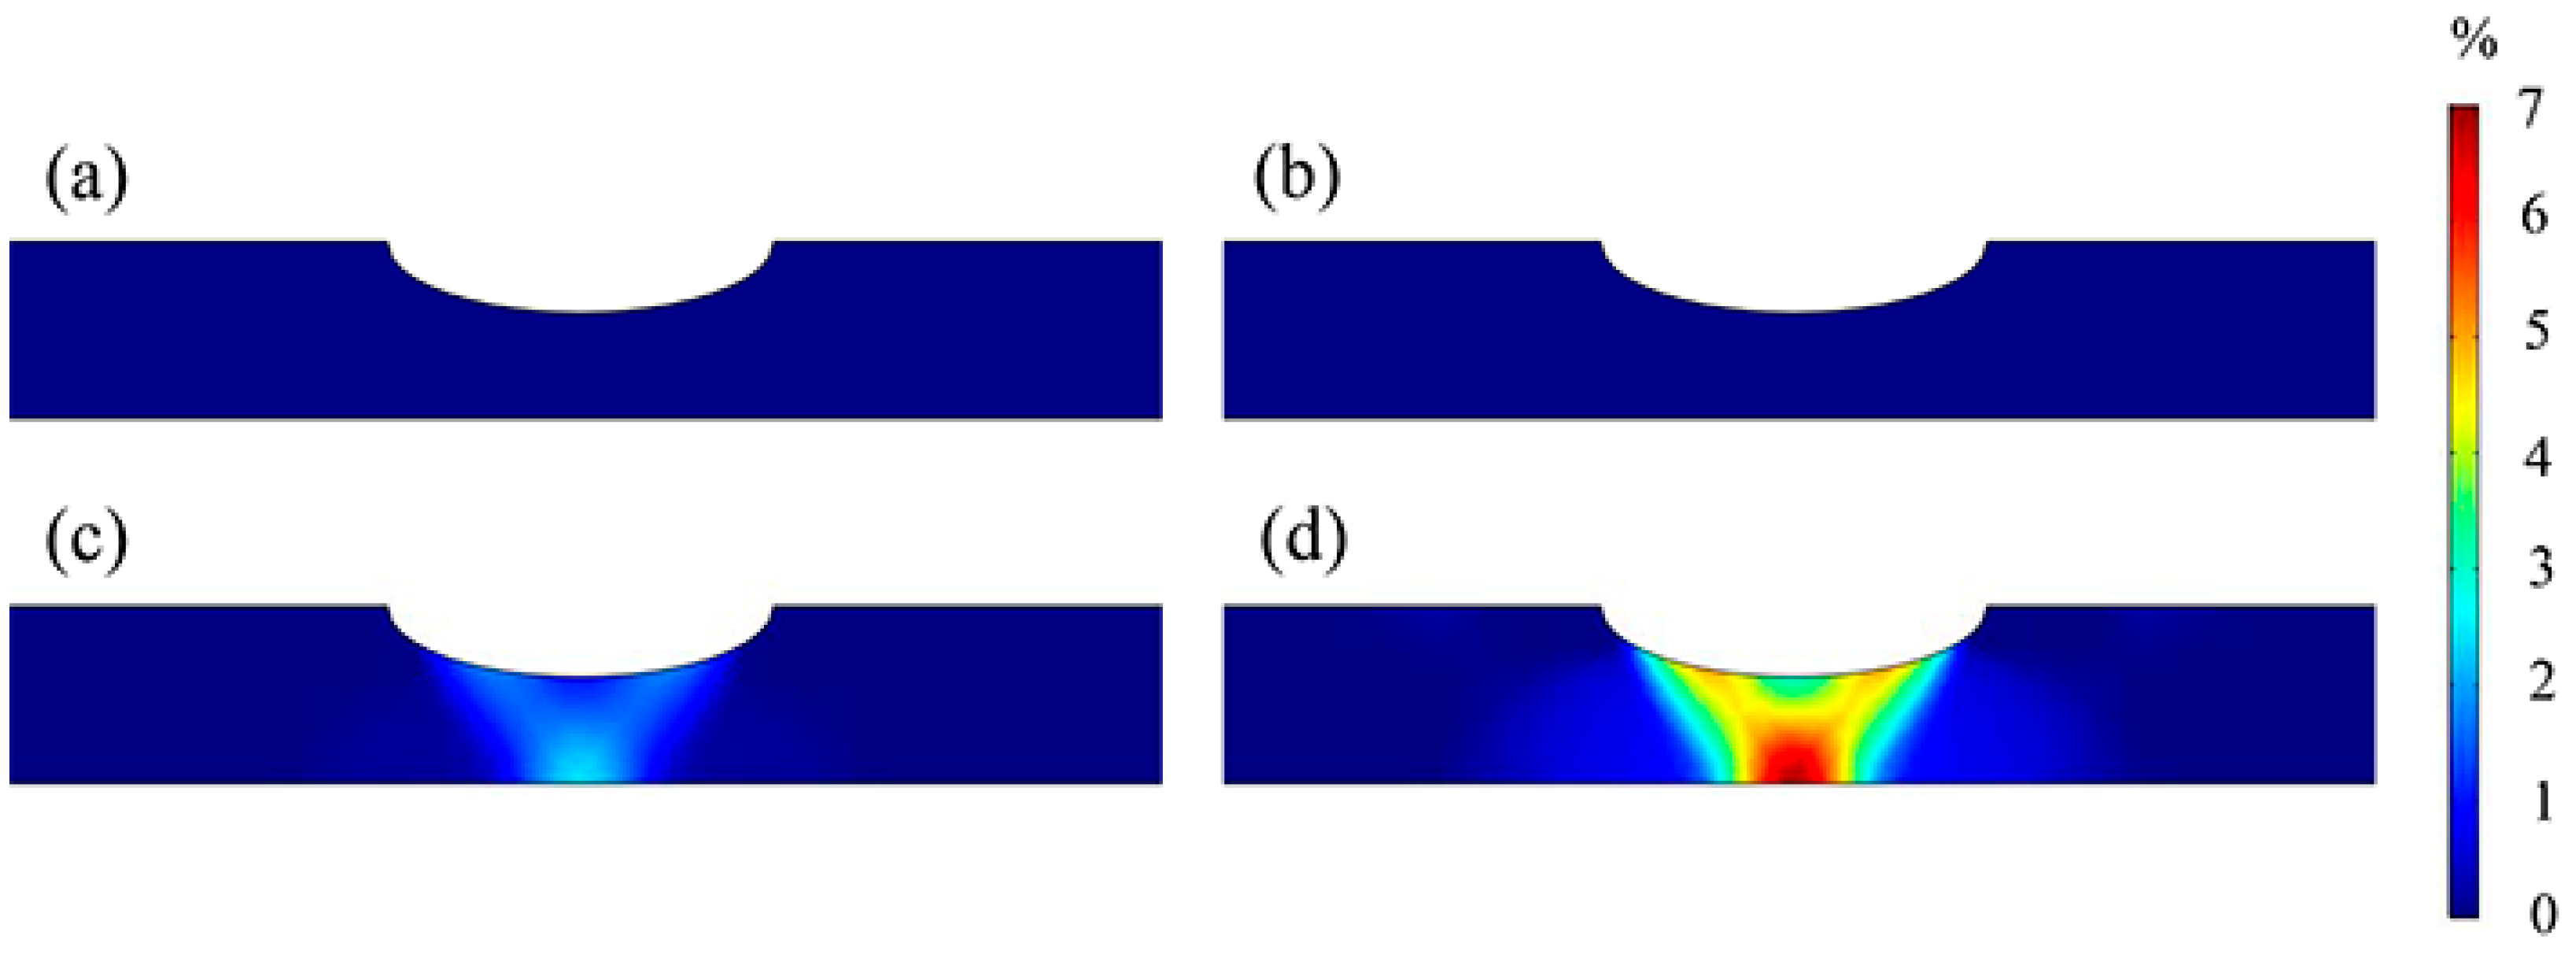
The stress concentration at the corrosion defect significantly altered the localized strain. As shown in Figure 8, the equivalent plastic strain at the corrosion defect remained negligible (0%) at externally applied tensile strains of 0.1% and 0.2%, which were consistent with the strain level of the pipeline body. However, a tensile strain of 0.3% caused a localized concentration of equivalent plastic strain at the defect site, attaining a maximum strain of approximately 2.7%. When the applied tensile strain was further elevated to 0.4%, the equivalent plastic strain at the defect site exhibited a pronounced increase, reaching 7%. Furthermore, the maximum equivalent plastic strain was localized subjacent to the defect and along the inner wall of the pipeline.

3.3. Anodic Equilibrium Potential and Cathodic Exchange Current Density Distributions

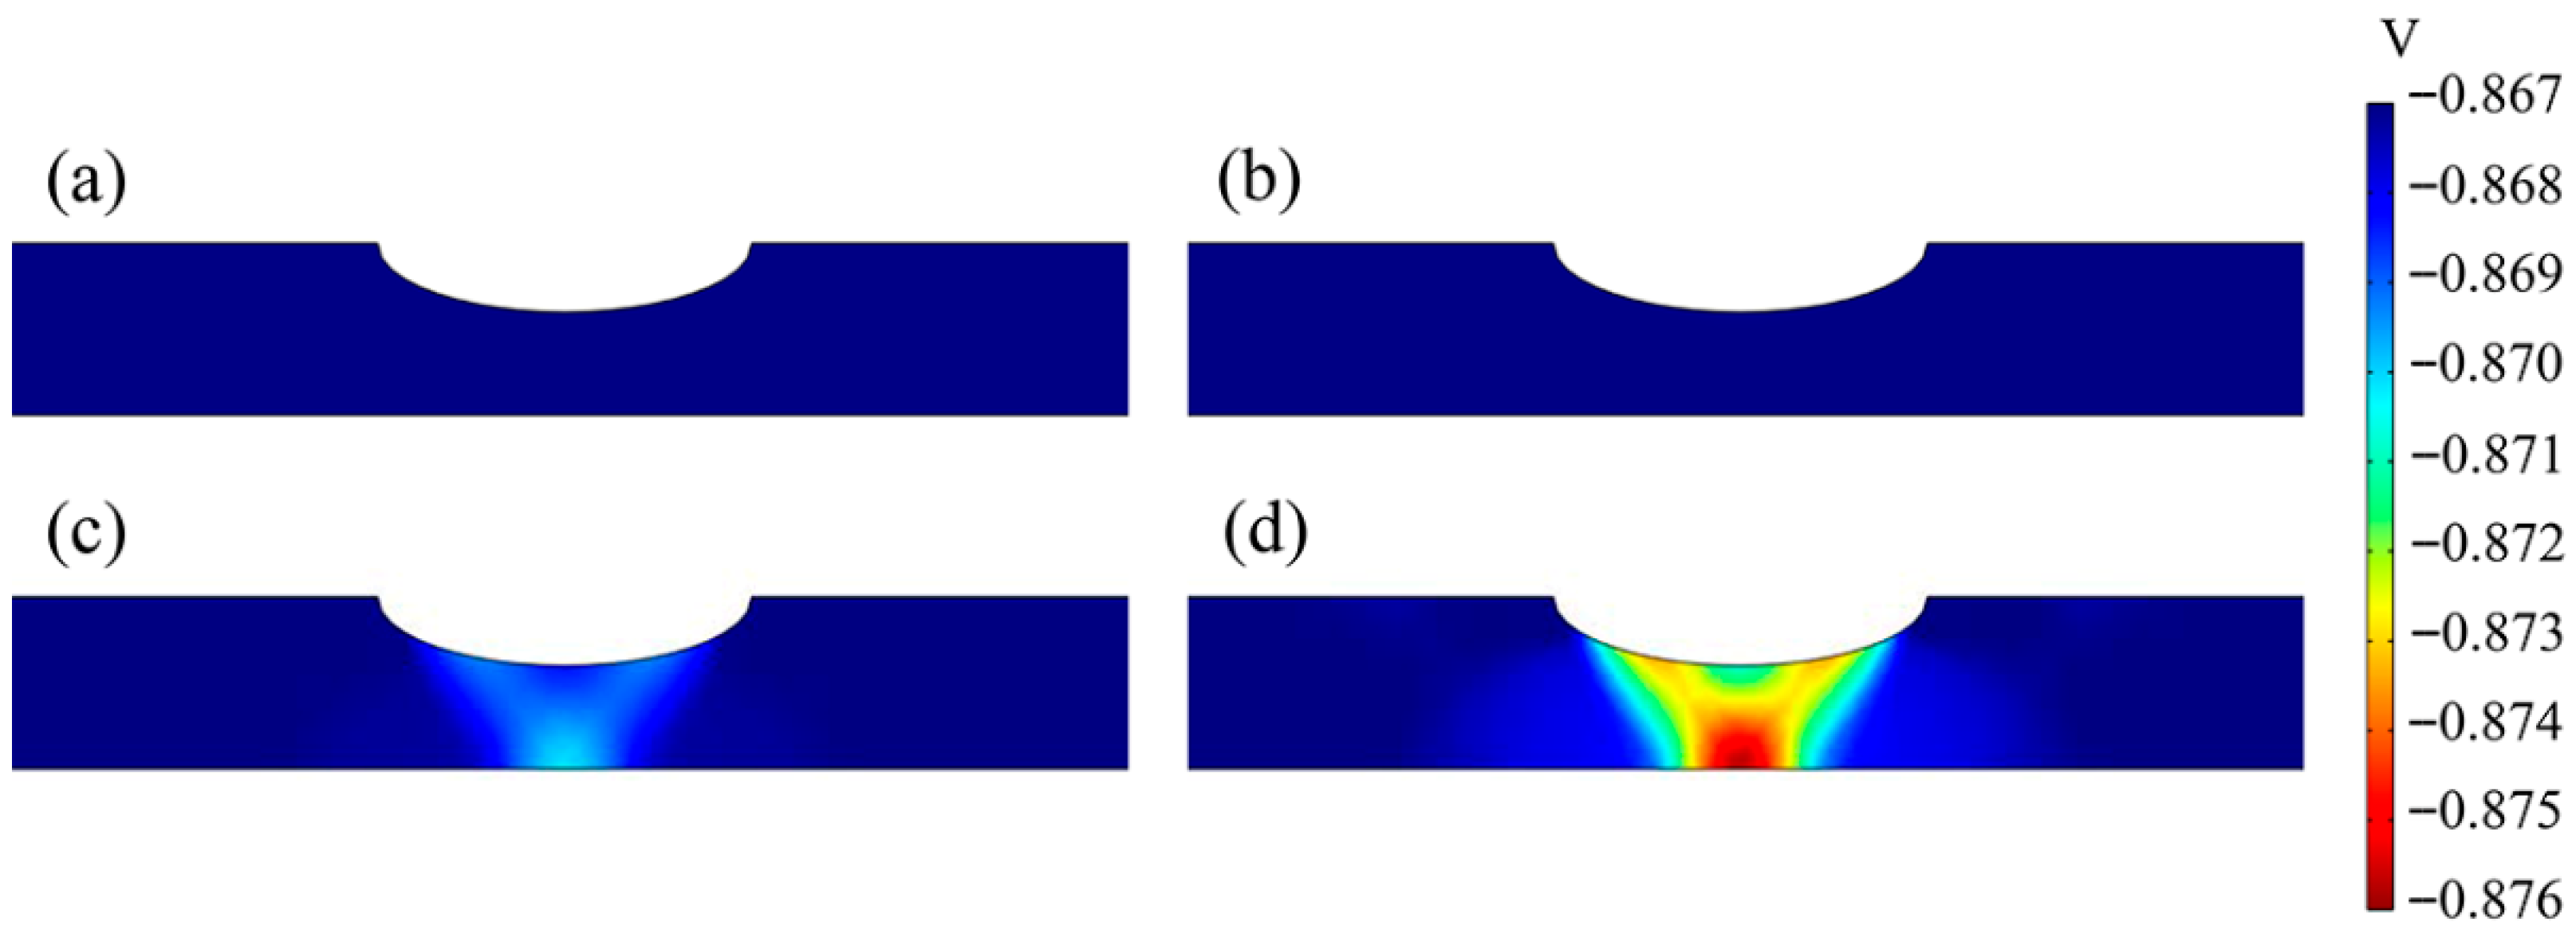
Figure 9 and Figure 10 show the distribution of the anodic equilibrium potential and cathodic exchange current density at the corrosion defect of the X80 pipeline at different tensile strains (0.1–0.4%) after simulation for 9 d. As shown in Figure 9, at external tensile strains of 0.1% and 0.2%, the anodic equilibrium potential at the corrosion defect site was equivalent to that on the pipeline body (−0.867 V). When the tensile strain reached 0.3%, the anodic equilibrium potential at the defect shifted to the negative side, with the most negative value approximating −0.871 V. When the applied tensile strain was increased to 0.4%, the negative shift of the anode equilibrium potential at the defect site became more pronounced, reaching −0.876 V.
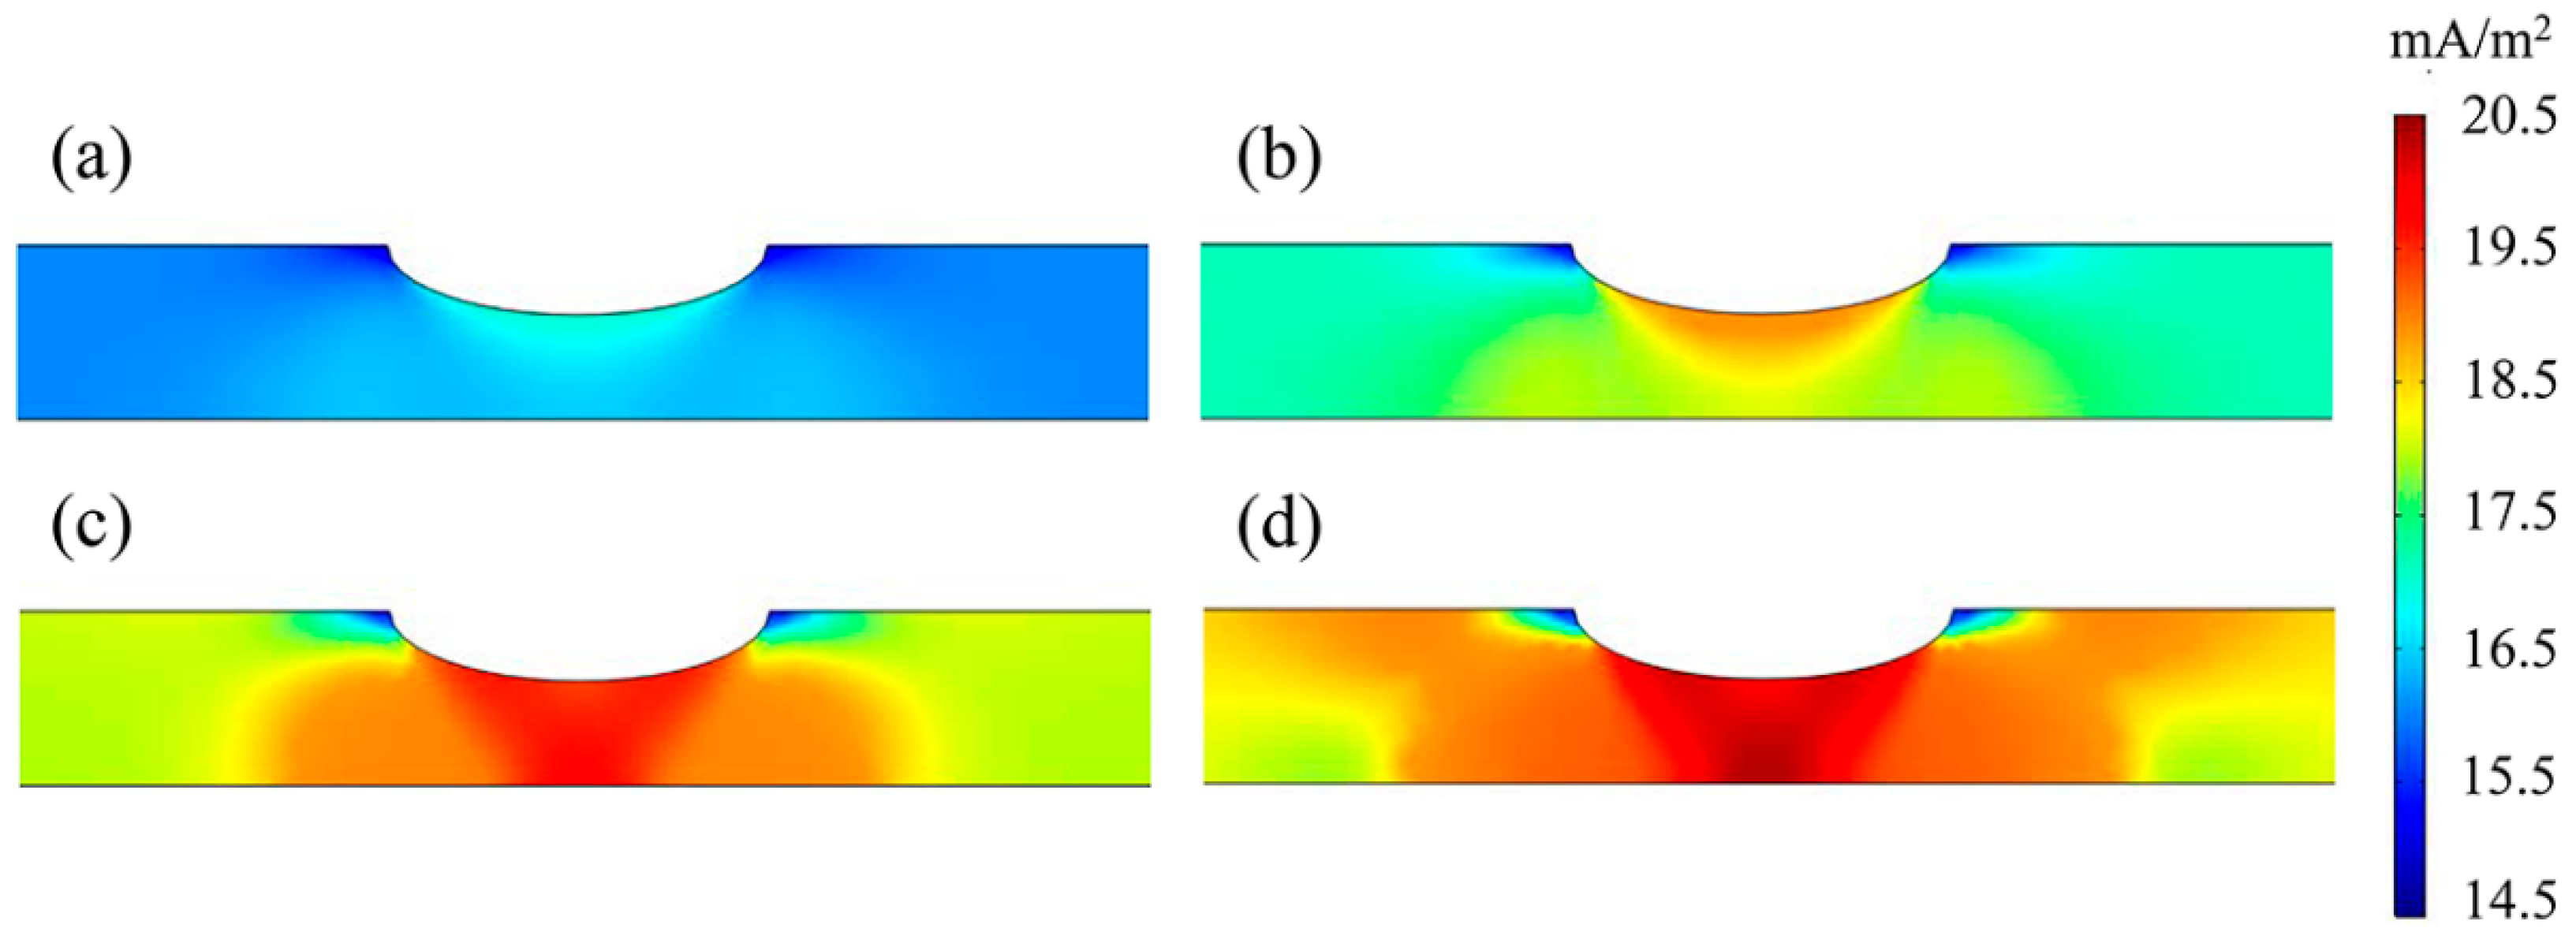
As illustrated in Figure 10, the cathodic exchange current density exhibited a progressive increase as the tensile strain rose. At tensile strains of 0.1% and 0.2%, the exchange current density at the periphery of the corrosion defect was higher than in other regions of the pipeline. The maximum exchange current density was localized at the defect root at 0.1% and 0.2% tensile strains, reaching 17 mA/m2 and 19 mA/m2, respectively. The cathodic exchange current density increased significantly at a tensile strain of 0.3%, with values in the root and subjacent regions of the defect exceeding 19.5 mA/m2. When the tensile strain was further increased to 0.4%, the maximum cathodic exchange current density at the corrosion defect surpassed 20 mA/m2, localized subjacent to the defect and along the inner wall of the pipeline.

3.4. Hydrogen Distribution

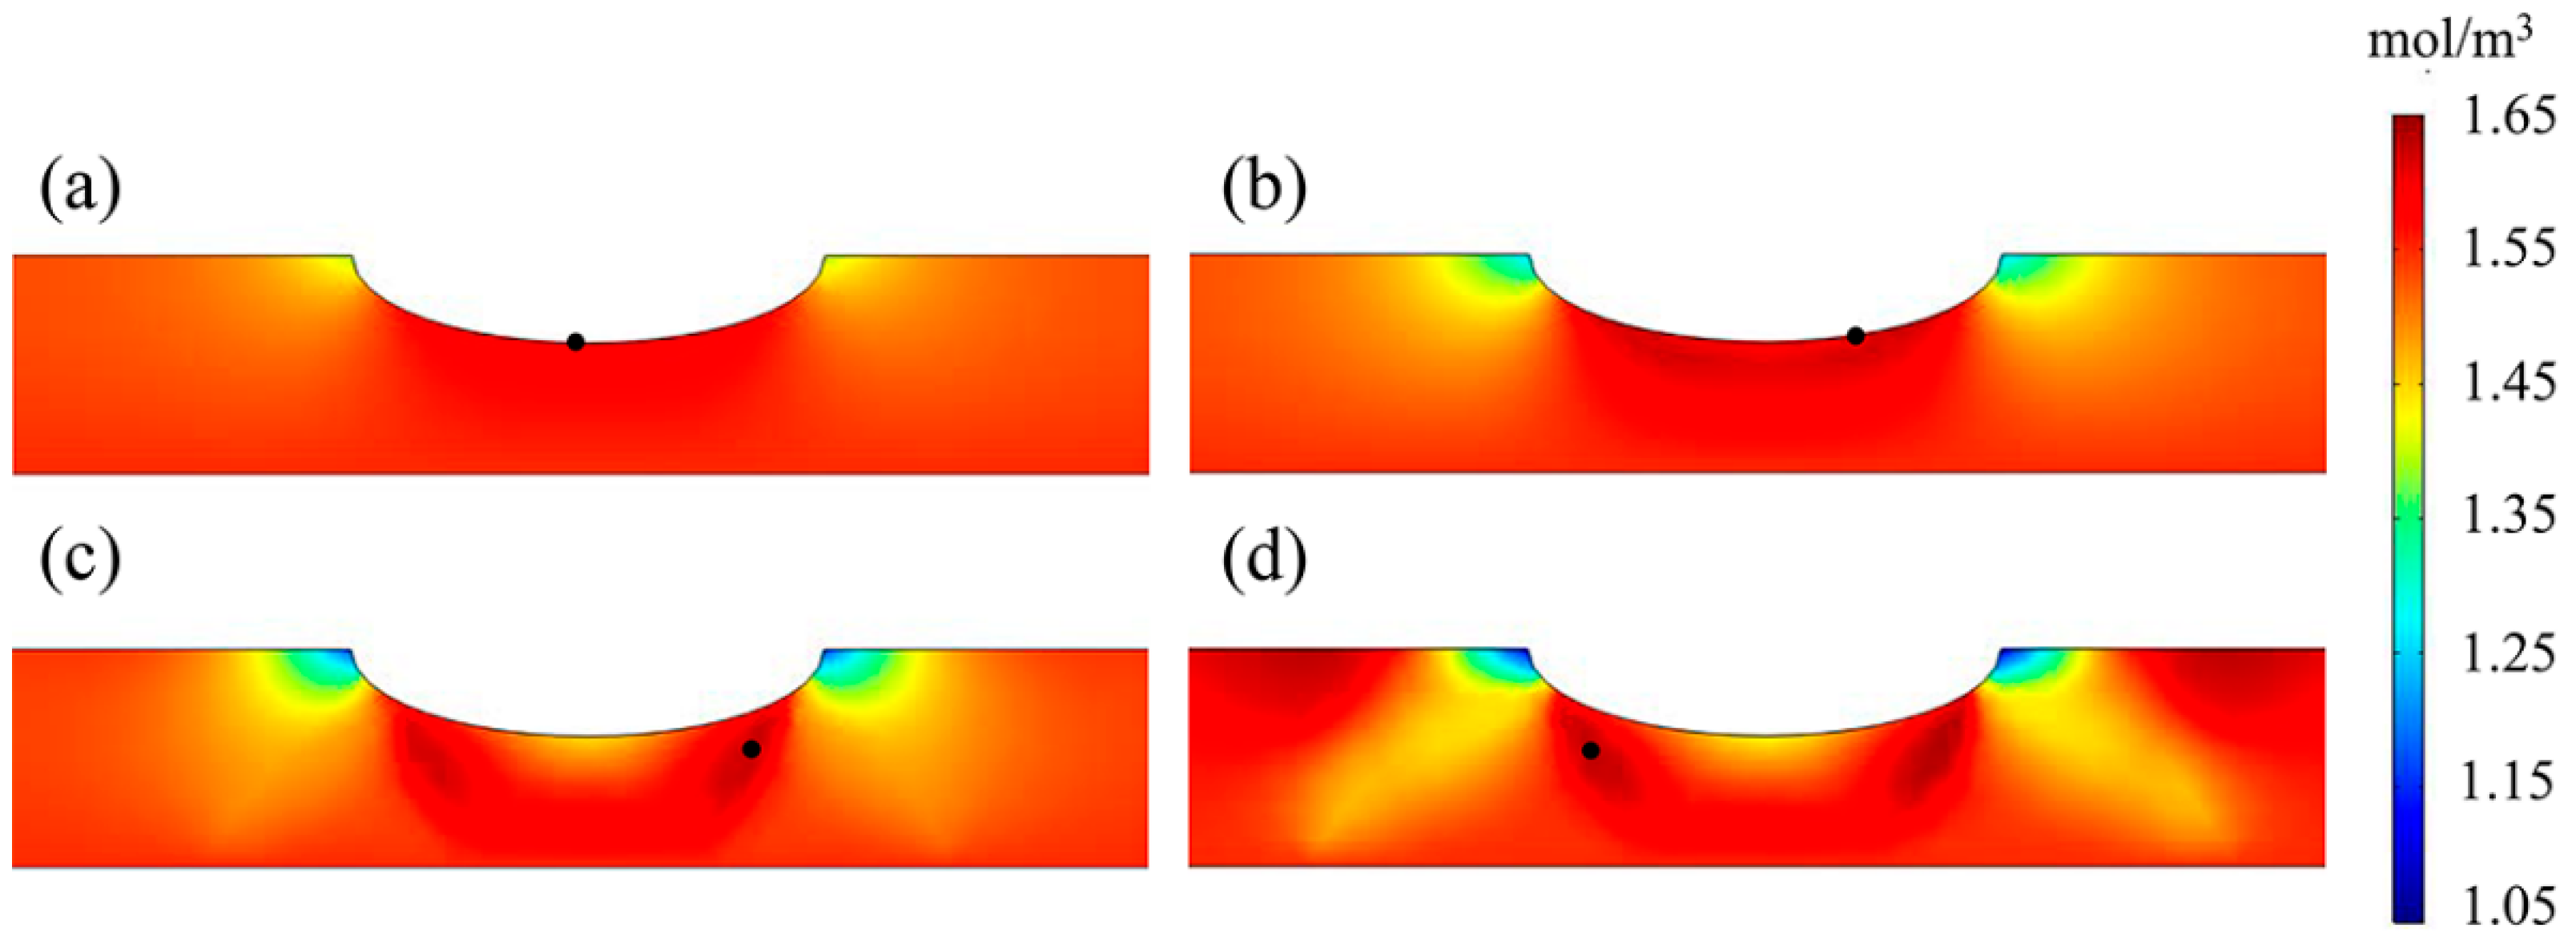
Figure 11 shows the stable-state distribution and maximum position of the hydrogen concentration at the corrosion defect site of the X80 pipeline at different tensile strains (0.1–0.4%) after a 9 d diffusion simulation. The application of tensile strain altered the hydrogen distribution in the pipeline, resulting in hydrogen accumulation at the corrosion defect. At a tensile strain of 0.1%, the hydrogen concentration at the root of the corrosion defect was slightly higher than that in the pipeline body. When the tensile strain reached 0.2%, the maximum hydrogen concentration exhibited lateral displacement along the corrosion defect periphery. The hydrogen enrichment at the corrosion defect became more pronounced as the tensile strain increased, while the locus of maximum hydrogen concentration migrated both externally and subjacent to the defect root.
Figure 12 shows the coupled hydrogen concentration results of the stress hydrogen diffusion in the same conditions, which are consistent with those in Figure 11. To facilitate comparative analysis, the maximum and minimum hydrogen concentration values are listed in Table 4.

3.5. Linear Distribution of the Current Density and Hydrogen Concentration

Figure 13 illustrates the linear distributions of the anodic current density, cathodic current density, and hydrogen concentration along the periphery of the corrosion defect in the X80 pipeline at tensile strains ranging between 0% and 0.4% after a 9 d simulation. The anodic and cathodic current density values at the defect edge increased at a higher tensile strain and were comparable in the absence of tensile strain (Figure 13a,b). However, the values of current densities displayed divergent trends with applied strain. At 0.1% and 0.2% tensile strain, the anodic current density increased, while that of the cathodic current decreased. Despite these changes, the current density distribution remained uniform across the defects. As the tensile strain increased to 0.3% and 0.4%, the anodic and cathodic current densities were symmetrically distributed on both sides of the defect root. Although the anodic and cathodic current density increased significantly at the defect center, only a slight decrease was evident at the defect sides. The cathodic current density exhibited a substantial increase at the defect center and a marginal reduction on both sides. The peak anode current densities reached 19.1 mA/m2 and 21.4 mA/m2 at tensile strains of 0.3% and 0.4%, respectively. Furthermore, the most negative cathodic current densities were −17.2 mA/m2 and −19.4 mA/m2 at 0.3% and 0.4% tensile strains, respectively.
The linear hydrogen concentration distribution in Figure 13c aligns with the pattern observed in Figure 11. The hydrogen concentration along the periphery of the defect remained nearly uniform across the defect. The hydrogen concentration at the defect center increased at tensile strains of 0.1% and 0.2%, while the side values decreased to below that of the center. At tensile strains of 0.3% and 0.4%, the hydrogen concentration presented a pronounced non-uniform distribution. The disparity between the hydrogen concentration in the central and peripheral regions exhibited a substantial augmentation.

4. Discussion

4.1. The Effect of Tensile Strain on the Anodic Equilibrium Potential and Cathodic Exchange Current Density

Higher tensile strains increased the local Von Mises stress, hydrostatic stress, and equivalent plastic strain at the corrosion defect of the X80 pipeline (Figure 6, Figure 7 and Figure 8). Similar to previous research findings, the tensile strain had varying effects on the stress–strain distribution [10]. Although both the von Mises and hydrostatic stress exhibited an upward trend at higher global tensile strains on the pipeline, the stress concentration at the corrosion defect was more pronounced than in the intact areas. Unlike global stress evolution, equivalent plastic strain only increased locally at the defect while remaining zero elsewhere in the pipeline. At lower tensile strains, the stress concentration was more pronounced at the defect root. As the tensile strain increased, the maximum stress and strain values shifted to the area below the defect and the inner wall of the pipeline.
The anodic and cathodic reactions of steel in near-neutral solutions were influenced by stress and strain, causing a negative shift in the anodic equilibrium potential and promoting hydrogen evolution reactions [21]. According to Equations (21) and (22), the anodic equilibrium potential and cathodic exchange current density varied in accordance with the equivalent plastic strain and Von Mises stress, respectively. This is because plastic deformation and stress can lead to the formation of defects in the material that increase the density of electrochemically active sites [28], and also increase the surface roughness of the metal, thereby altering its electronic properties [29]. Ultimately, these changes affect both the cathodic and anodic reactions.
Therefore, the distribution of the anodic equilibrium potential in Figure 9 and the cathodic exchange current density in Figure 10 correspond to the strain and stress distributions in Figure 8 and Figure 6, respectively. Therefore, it can be concluded that low tensile strains (<0.3%), which induced elastic deformation in the pipeline, resulted in an equivalent plastic strain of zero and no alteration to the anodic equilibrium potential of the X80 steel in the NS4 solution. Contrarily, high tensile strains (≥0.3%) promoted localized plastic deformation at the corrosion defect, which is consist with previous research [30]. These phenomena could induce equivalent plastic strain amplification and a subsequent negative shift in the anodic equilibrium potential. Similarly, cathodic kinetics demonstrated strain-dependent localization. The cathodic exchange current density was concentrated at the defect midpoint in the elastic regime. However, in the plastic regime, correlated with the Von Mises stress redistributions, the maximum value of the cathodic exchange current density also migrated away from the defect root.

4.2. The Influence of the M-E Effect on the Anodic and Cathodic Current Densities

Due to the influence of stress on the potential distribution across the X80 pipeline, the high-stress region at the root of the defect became the anode, while the low-stress regions at both ends of the defect acted as the cathode. Electrons from the anodic reaction migrated through the pipeline to the cathodic regions, while Fe2+ ions diffused via the electrolyte. This further accelerated the anodic dissolution at the root of the defect while reducing the anodic dissolution at both ends. In the absence of tensile strain, the X80 steel underwent uniform dissolution, with an anodic current density of 12.0 mA/m2 (Figure 13) However, at a tensile strain of 0.4%, the maximum anodic current density at the edge of the defect reached 21.4 mA/m2, corresponding to the high-stress region, while the current density at both low-stress ends measured 11 mA/m2. The current density at the root of the defect was 19.1 mA/m2, indicating that this region did not represent the location of the fastest steel dissolution.
As shown in Figure 13, the M-E effect promoted hydrogen evolution, while the local corrosion reaction at the defect edge disrupted the linear distribution of the cathodic current density. In the absence of tensile strain, the defect underwent self-corrosion, with equal anodic and cathodic current densities at −12.0 mA/m2. The application of a 0.4% tensile strain yielded maximum anodic and cathodic current densities of 21.4 mA/m2 and −19.4 mA/m2, respectively, creating an imbalance between the two. The algebraic difference between these values is referred to as the net current density. When considering the influence of the M-E effect on the electrochemical corrosion reaction, the polarization in the high-stress region was more pronounced, resulting in a positive net current density, indicating that this region was in an anodic polarization state, which enhanced corrosion. Contrarily, the ends of the defect were in a cathodic polarization state. For example, a 0.3% tensile strain resulted in a cathodic current density of −13.4 mA/m2 and an anodic current density of 11.5 mA/m2, yielding a net current density of −1.9 mA/m2 at the ends, suggesting corrosion mitigation.

4.3. The Influence of the M-E Effect on the Hydrogen Distribution

In the coupled stress–hydrogen diffusion simulation, hydrogen diffusion was driven by both the hydrogen concentration and hydrostatic stress gradients in the pipeline. The combined effect of the hydrogen concentration and hydrostatic stress determined the distribution state. In this case, the magnitude of hydrostatic stress depended directly on the applied tensile strain. When considering the M-E effect, the size of the defect changed continuously as the corrosion reaction progressed, affecting the hydrostatic stress concentration at the defect. Therefore, even if the applied tensile strain remained constant, the hydrogen concentration distribution still underwent change.
As shown in Figure 11 and Figure 12, the hydrogen distribution states and the locations of the maximum hydrogen concentration were the same for both the M-E effect–hydrogen diffusion and stress–hydrogen diffusion coupled simulations. The hydrogen enrichment at the corrosion defect was insignificant at a tensile strain of 0.1%, with only a slightly higher concentration at the defect root compared to the surrounding areas. Hydrogen enrichment occurred at the corrosion defect at a tensile strain of 0.2%, while the location of the maximum hydrogen concentration shifted to the right along the defect edge. Although higher tensile strains intensified hydrogen enrichment, the enriched region and peak concentration site shifted away from the defect root, moving toward the sides and downward. As shown in Figure 13, the maximum hydrogen concentration on the defect edge also shifts from the center to the sides under the influence of tensile strain.
As indicated in Table 4, the maximum and minimum hydrogen concentrations differed when considering the M-E effect compared to the stress–hydrogen diffusion coupling, reflecting the influence of the dynamic evolution of the corrosion defect on hydrogen diffusion distribution. At different tensile strains, the difference in the minimum hydrogen concentration was around 0.01 mol/m3, while that of the maximum hydrogen concentration did not exceed 0.006 mol/m3, which was approximately 0.39% of the initial hydrogen concentration. This suggests that the M-E effect has a relatively minor influence on the hydrogen concentration in the simulated conditions compared to the impact of the applied tensile strain. This was because the change range in the anodic equilibrium potential (−0.876 to −0.867 V) and the cathodic exchange current density (14.5 to 20.5 mA/m2) in this simulation environment was small, indicating a relatively low corrosion rate. Therefore, the difference between the hydrogen concentration of the M-E effect and stress–hydrogen diffusion coupling was minimal. In this case, the hydrogen diffusion behavior was still dominated by the hydrostatic stress and hydrogen concentration gradients. However, the stress–hydrogen diffusion coupling did not account for the progression of the corrosion reaction over time. The simulation time in this chapter was 9 d, while in practical scenarios, predictions often cover multiple years. The continued corrosion reaction over time changed the shape and size of the corrosion defect, altering the related stress and strain, which in turn affected the anodic equilibrium potential and the hydrogen concentration and its distribution. When considering the long-term development of corrosion defects and hydrogen distribution, the model combining the M-E effect with hydrogen diffusion remains applicable. Existing research shows that extended time results in a higher hydrogen concentration enriched at the corrosion defect, increasing the risk of hydrogen-induced cracking.

5. Conclusions

This study employed an FE model to simulate hydrogen diffusion and distribution in an X80 pipeline with corrosion defects in a near-neutral solution. It analyzed the mechanism of the M-E effect behind hydrogen diffusion and enrichment behavior by coupling the stress field in the steel and the electrochemical field at the steel/solution interface to ensure that the simulation process and results were more consistent with the actual conditions of field pipelines. The main conclusions are as follows:
(1)
The tensile strain influenced the cathodic and anodic reactions by altering the stress–strain distribution on the X80 pipeline. Under elastic deformation, the anodic equilibrium potential was uniform across the pipeline, while the maximum cathodic exchange current density was evident at the defect root. Under plastic deformation, the anodic equilibrium potential displayed a negative shift, while the maximum cathodic exchange current density deviated from the center.
(2)
The M-E effect induced anodic polarization in high-stress regions, which enhanced corrosion, while cathodic polarization occurs in low-stress regions, resulting in corrosion mitigation.
(3)
In a near-neutral solution environment, the hydrogen distribution state on the X80 pipeline was consistent with that of the stress–hydrogen diffusion coupling when considering the M-E effect. However, the presence of the M-E effect slightly increased the hydrogen concentration at the corrosion defect.

Author Contributions

Conceptualization, Z.D. and J.T.; methodology, Z.D.; software, J.T.; validation, S.Z., F.W. and Q.B.; formal analysis, S.Z.; data curation, F.W.; writing—original draft preparation, S.G. and J.T.; writing—review and editing, L.C. and Z.D.; visualization, X.W.; supervision, X.W.; project administration, P.K.; funding acquisition, P.K. All authors have read and agreed to the published version of the manuscript.

Funding

Scientific Research Projects of PetroChina Southwest Oil & Gasfield Company, 20230312-08.

Conflicts of Interest

Zhixiang Dai, Sijia Zheng, Feng Wang, Qin Bie, Pengcheng Kang and Xinyi Wang were employed by the Gathering and Transportation Engineering Technology Research Institute, PetroChina Southwest Oil & Gasfield Company, The remaining authors declare that the research was conducted in the absence of any commercial or financial relationships that could be construed as a potential conflict of interest.

References

  1. Faye, O.; Szpunar, J.; Eduok, U. A critical review on the current technologies for the generation, storage, and transportation of hydrogen. Int. J. Hydrogen Energy 2022, 47, 13771–13802. [Google Scholar] [CrossRef]
  2. Abdalla, A.M.; Hossain, S.; Nisfindy, O.B.; Azad, A.T.; Dawood, M.; Azad, A.K. Hydrogen production, storage, transportation and key challenges with applications: A review. Energy Convers. Manag. 2018, 165, 602–627. [Google Scholar] [CrossRef]
  3. Zhu, Y.-Q.; Song, W.; Wang, H.-B.; Qi, J.-T.; Zeng, R.-C.; Ren, H.; Jiang, W.-C.; Meng, H.-B.; Li, Y.-X. Advances in reducing hydrogen effect of pipeline steels on hydrogen-blended natural gas transportation: A systematic review of mitigation strategies. Renew. Sustain. Energy Rev. 2023, 189, 113950. [Google Scholar] [CrossRef]
  4. Yang, H.; Zhang, H.; Liu, C.; Wang, C.; Fan, X.; Cheng, Y.F.; Li, Y. Effects of defect on the hydrogen embrittlement behavior of X80 pipeline steel in hydrogen-blended natural gas environments. Int. J. Hydrogen Energy 2024, 58, 158–173. [Google Scholar] [CrossRef]
  5. Chen, X.; Li, X.; Du, C.; Cheng, Y. Effect of cathodic protection on corrosion of pipeline steel under disbonded coating. Corros. Sci. 2009, 51, 2242–2245. [Google Scholar] [CrossRef]
  6. Perdomo, J.; Song, I. Chemical and electrochemical conditions on steel under disbonded coatings: The effect of applied potential, solution resistivity, crevice thickness and holiday size. Corros. Sci. 2000, 42, 1389–1415. [Google Scholar] [CrossRef]
  7. Wu, W.; Liu, Z.; Li, X.; Du, C. Electrochemical characteristic and stress corrosion behavior of API X70 high-strength pipeline steel under a simulated disbonded coating in an artificial seawater environment. J. Electroanal. Chem. 2019, 845, 92–105. [Google Scholar] [CrossRef]
  8. Vanboven, G.; Chen, W.; Rogge, R. The role of residual stress in neutral pH stress corrosion cracking of pipeline steels. Part I: Pitting and cracking occurrence. Acta Mater. 2007, 55, 29–42. [Google Scholar] [CrossRef]
  9. Zhang, Z.; Guo, L.; Cheng, Y.F. Interaction between internal and external defects on pipelines and its effect on failure pressure. Thin–Walled Struct. 2021, 159, 107230. [Google Scholar] [CrossRef]
  10. Guo, S.; Xu, L.; Dong, S.; Cheng, Y.F. Finite element modeling of hydrogen atom diffusion and distribution at corrosion defect on aged pipelines transporting hydrogen. Int. J. Hydrogen Energy 2023, 48, 13566–13577. [Google Scholar] [CrossRef]
  11. Li, W.; Guo, T.; Xu, L.; Chen, L.; Jiang, B.; Wang, X.; Wu, H.; Qiao, L. Promotion of pitting corrosion at hydrogen-enriched α/γ phase boundaries in austenitic stainless steel weld joints. Acta Mater. 2022, 227, 117728. [Google Scholar] [CrossRef]
  12. Devanathan, M.A.V.; Stachurski, Z. The mechanism of hydrogen evolution on iron in acid solutions by determination of permeation rates. J. Electrochem. Soc. 1964, 111, 619–623. [Google Scholar] [CrossRef]
  13. Doyle, D.; Palumbo, G.; Aust, K.; El-Sherik, A.; Erb, U. The influence of intercrystalline defects on hydrogen activity and transport in nickel. Acta Met. Mater. 1995, 43, 3027–3033. [Google Scholar] [CrossRef]
  14. Cheng, Y.F. Fundamentals of hydrogen evolution reaction and its implications on near-neutral pH stress corrosion cracking of pipelines. Electrochim. Acta 2007, 52, 2661–2667. [Google Scholar] [CrossRef]
  15. Xu, L.; Cheng, Y. Development of a finite element model for simulation and prediction of mechanoelectrochemical effect of pipeline corrosion. Corros. Sci. 2013, 73, 150–160. [Google Scholar] [CrossRef]
  16. Hafsi, Z.; Mishra, M.; Elaoud, S. Hydrogen embrittlement of steel pipelines during transients. Procedia Struct. Integr. 2018, 13, 210–217. [Google Scholar] [CrossRef]
  17. Krom, A.; Koers, R.; Bakker, A. Hydrogen transport near a blunting crack tip. J. Mech. Phys. Solids 1999, 47, 971–992. [Google Scholar] [CrossRef]
  18. Wijmans, J.; Baker, R. The solution-diffusion model: A review. J. Membr. Sci. 1995, 107, 1–21. [Google Scholar] [CrossRef]
  19. Sofronis, P.; McMeeking, R. Numerical analysis of hydrogen transport near a blunting crack tip. J. Mech. Phys. Solids 1989, 37, 317–350. [Google Scholar] [CrossRef]
  20. McLellan, A.G.; Fyfe, W.S. Non-hydrostatic thermodynamics of chemical systems. Proc. R. Soc. Lond. A Math. Phys. Sci. 1970, 314, 443–455. [Google Scholar]
  21. Gutman, E.; Solovioff, G.; Eliezer, D. The mechanochemical behavior of type 316L stainless steel. Corros. Sci. 1996, 38, 1141–1145. [Google Scholar] [CrossRef]
  22. Wu, X.; Teng, M.; Jia, W.; Cai, J. Study on the mechanical properties of X80 pipeline steel under pre-charged high-pressure gaseous hydrogen. Int. J. Hydrogen Energy 2024, 84, 39–52. [Google Scholar] [CrossRef]
  23. Xu, L.; Cheng, Y. Corrosion of X100 pipeline steel under plastic strain in a neutral pH bicarbonate solution. Corros. Sci. 2012, 64, 145–152. [Google Scholar] [CrossRef]
  24. Gutman, E.M. Mechanochemistry of Solid Surfaces; World Scientific Publishing Company: Singapore, 1994. [Google Scholar]
  25. Celikin, M. The role of dynamic transmission electron microscopy on the development of next generation magnesium alloys. Mater. Today 2015, 18, 472. [Google Scholar] [CrossRef]
  26. Saxena, A.; Findley, K. Modelling the Effects of Hydrogen Pressure on Fatigue Crack Growth Behavior in SA372 Pressure Vessel Steels. In Proceedings of the ASME 2022 Pressure Vessels & Piping Conference, Las Vegas, Nevada, 17–22 July 2022. [Google Scholar] [CrossRef]
  27. Toribio, J.; González, B.; Matos, J.-C. Numerical modeling of hydrogen embrittlement of pearlitic steel in the presence of blunt notches. Procedia Struct. Integr. 2021, 33, 1215–1218. [Google Scholar] [CrossRef]
  28. Sahal, M.; Creus, J.; Sabot, R.; Feaugas, X. The effects of dislocation patterns on the dissolution process of polycrystalline nickel. Acta Mater. 2006, 54, 2157–2167. [Google Scholar] [CrossRef]
  29. Dai, Y.Z.; Chiang, F.P. On the Mechanism of Plastic Deformation Induced Surface Roughness. J. Eng. Mater. Technol. 1992, 114, 432–438. [Google Scholar] [CrossRef]
  30. Huang, H.; Jia, C.; Guo, L. Effect of local corrosion on tensile behavior of steel plates. Structures 2022, 43, 977–989. [Google Scholar] [CrossRef]
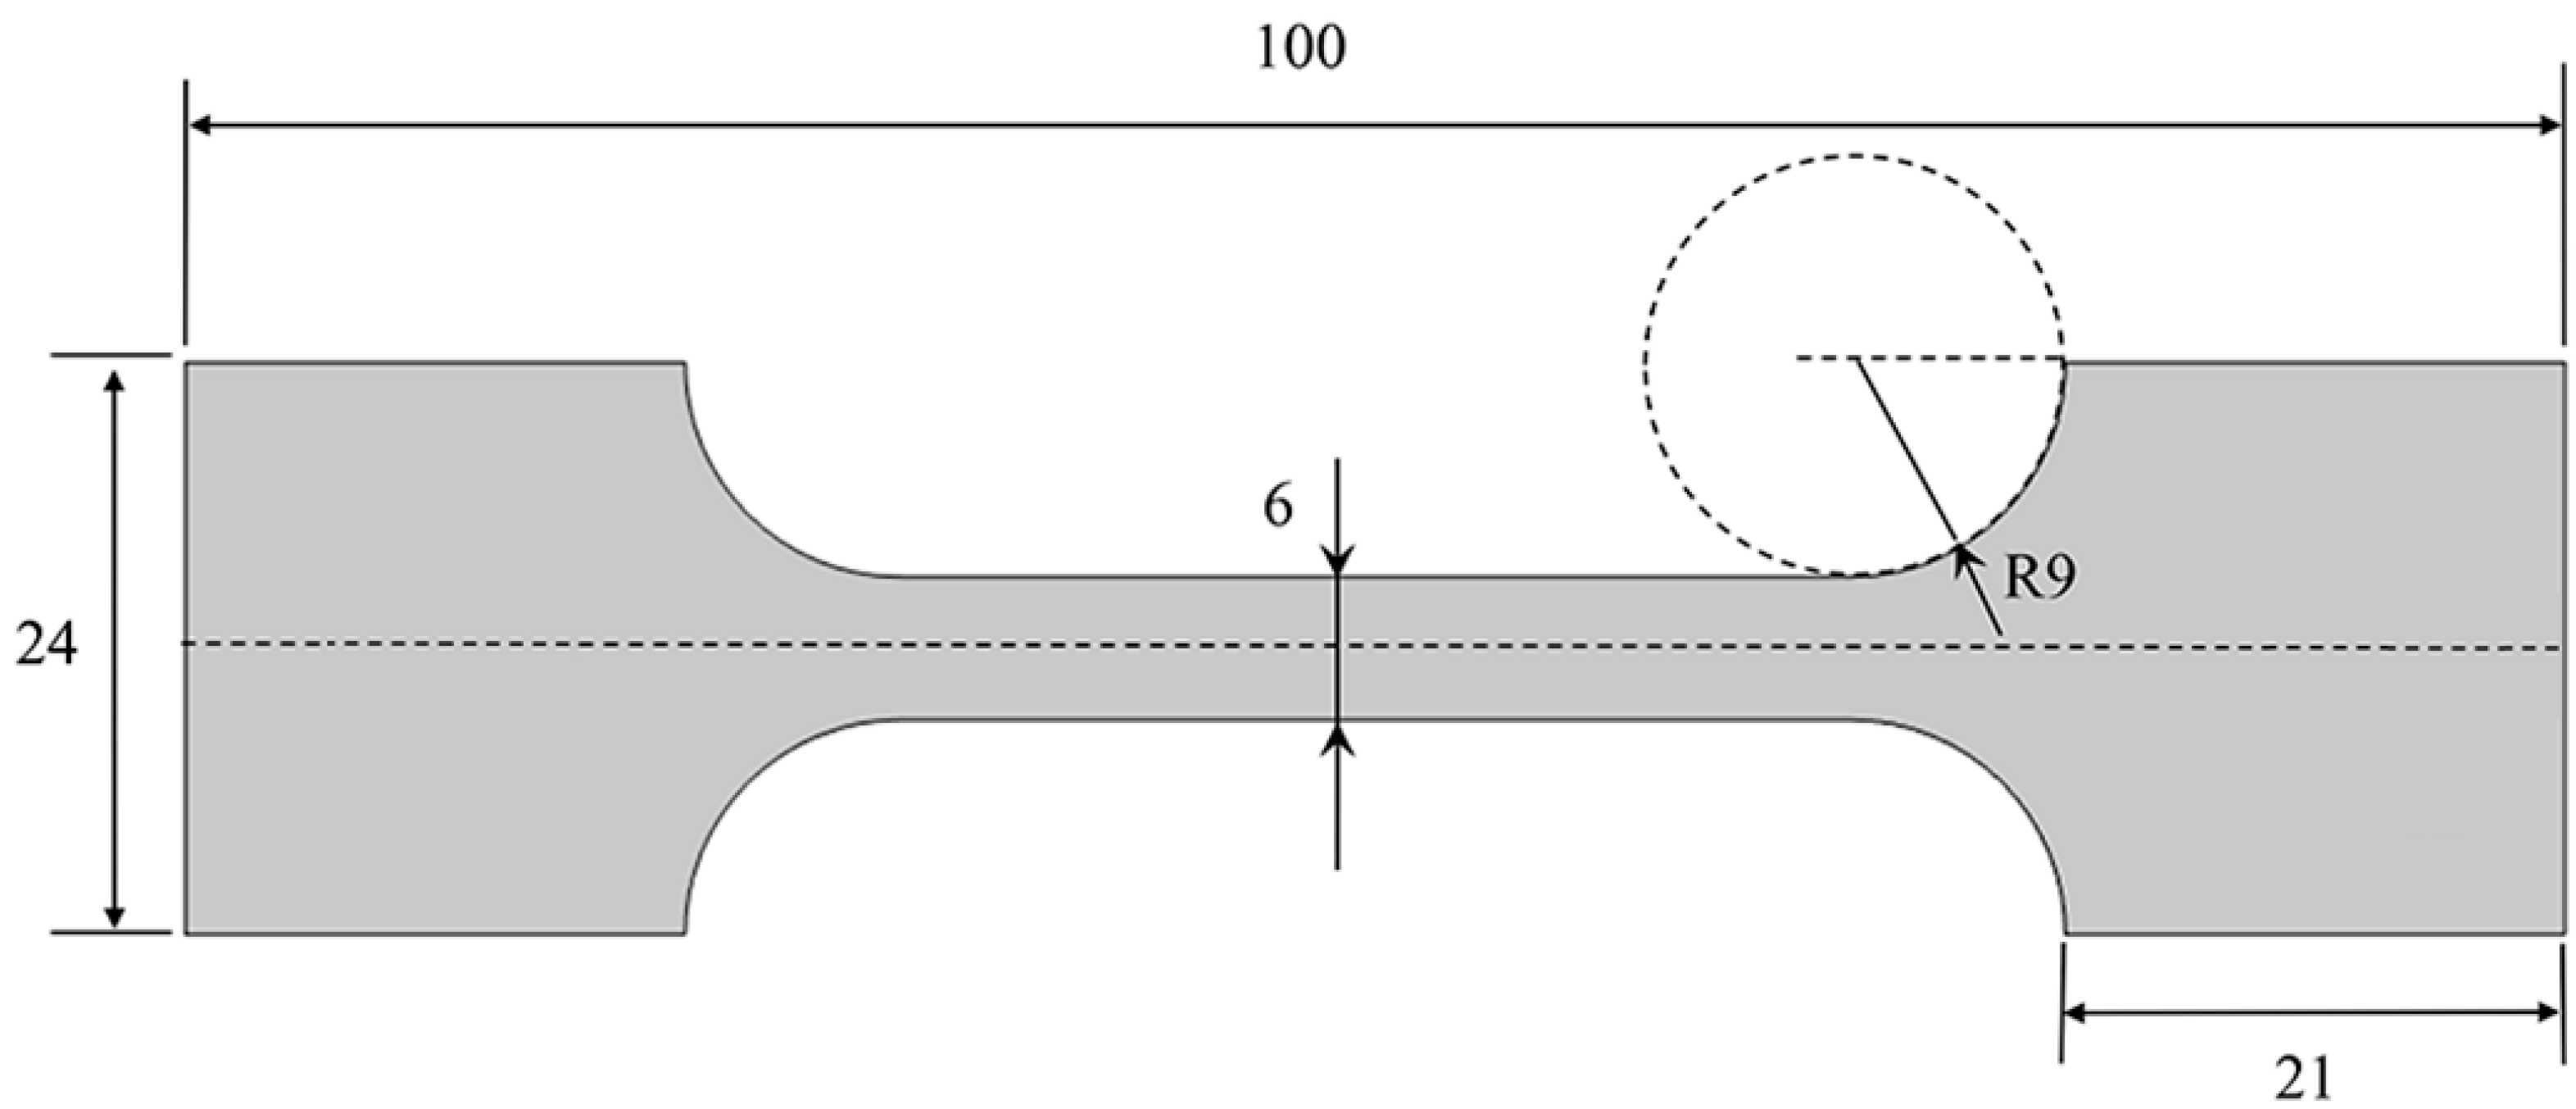
Figure 1. The sizes and shapes of the flat dog-bone-type specimens (mm), with a thickness of 1.5 mm.
Hydrogen 06 00069 g001
Figure 2. Modified “Devanathan–Stachurski cell” used in the experiment (C.E.: Counter Electrode, R.E.: Reference Electrode, W.E.: Specimens).
Hydrogen 06 00069 g002
Figure 3. Geometrical model of the X80 steel pipe containing a corrosion defect.
Hydrogen 06 00069 g003
Figure 4. (a) Engineering and true stress–strain curves of the X80 steel. (b) Transient hydrogen permeation current density curve of the X80 steel.
Hydrogen 06 00069 g004
Figure 5. Potentiodynamic polarization curve of the X80 steel. (b) is the enlarged image of (a).
Hydrogen 06 00069 g005
Figure 6. Von Mises stress distribution at the corrosion defect at different tensile strains of 0.1%, 0.2%, 0.3%, and 0.4% (ad).
Hydrogen 06 00069 g006
Figure 7. Hydrostatic stress distribution at the corrosion defect at different tensile strains of 0.1%, 0.2%, 0.3%, and 0.4% (ad).
Hydrogen 06 00069 g007
Figure 8. Equivalent plastic strain distribution at the corrosion defect at different tensile strains of 0.1%, 0.2%, 0.3%, and 0.4% (ad).
Hydrogen 06 00069 g008
Figure 9. Anodic equilibrium potential distribution at the corrosion defect at different tensile strains of 0.1%, 0.2%, 0.3%, and 0.4% (ad).
Hydrogen 06 00069 g009
Figure 10. Cathodic exchange current density distribution at the corrosion defect at different tensile strains of 0.1%, 0.2%, 0.3%, and 0.4% (ad).
Hydrogen 06 00069 g010
Figure 11. Hydrogen concentration distribution at the corrosion defect in the Mechano-electrochemical–hydrogen diffusion field at different tensile strains of 0.1%, 0.2%, 0.3%, and 0.4% (ad).
Hydrogen 06 00069 g011
Figure 12. Hydrogen concentration distribution at the corrosion defect in the stress–hydrogen diffusion field at different tensile strains of 0.1%, 0.2%, 0.3%, and 0.4% (ad).
Hydrogen 06 00069 g012
Figure 13. (a) Linear distribution of the anodic current density along the corrosion defect edge. (b) Linear distribution of the cathodic current density along the corrosion defect edge. (c) Linear distribution of the hydrogen concentration along the corrosion defect edge.
Hydrogen 06 00069 g013
Table 1. The chemical composition of the X80 steel (wt. × 10−2).
CSiMnPSCrMoNiNbVCuBAl
0.0760.211.890.0100.00220.270.280.0550.0820.0290.0590.00020.038
Table 2. Parameters of the three-field coupling simulation.
ParameterValue
The density of steel, ρ (g/cm3)7.85 [25]
Molar mass of steel, M (g/mol)56
Partial molar volume of hydrogen, Vh (m3/mol)2 × 10−6 [26,27]
Table 3. Values of the electrochemical corrosion parameters.
E corr
V
i corr
A/cm2
φ eqa 0
V
φ eqc 0
V
b a
V/dec
b c
V/dec
i 0 a
A/cm2
i 0 c
A/cm2
−0.7043.373 × 10−6−0.859−0.6440.162−0.0834.508 × 10−81.496 × 10⁻⁶
Table 4. Maximum and minimum hydrogen concentrations (mol/m3).
Physical FieldHydrogen Concentration
Tensile Strain0.1%0.2%0.3%0.4%
mechano-chemical–H atom diffusionminimum value1.3921.2581.1651.116
maximum value1.5921.6221.6271.635
stress–H atom diffusionminimum value1.3821.2481.1571.107
maximum value1.5871.6171.6211.632
Disclaimer/Publisher’s Note: The statements, opinions and data contained in all publications are solely those of the individual author(s) and contributor(s) and not of MDPI and/or the editor(s). MDPI and/or the editor(s) disclaim responsibility for any injury to people or property resulting from any ideas, methods, instructions or products referred to in the content.