Abstract
This paper presents a techno-economic assessment of liquid hydrogen produced from small modular reactors (SMRs) for maritime applications. Pink hydrogen is examined as a carbon-free alternative to conventional marine fuels, leveraging the zero-emission profile and dispatchable nature of nuclear energy. Using Greece as a case study, the analysis includes both production and transportation costs, along with a sensitivity analysis on key parameters influencing the levelized cost of hydrogen (LCOH), such as SMR and electrolyzer CAPEX, uranium cost, and SMR operational lifetime. Results show that with an SMR CAPEX of 10,000 EUR/kW, the LCOH reaches 6.64 EUR/kg, which is too high to compete with diesel under current market conditions. Economic viability is achieved only if carbon costs rise to 0.387 EUR/kg and diesel prices exceed 0.70 EUR/L. Under these conditions, a manageable deployment of fewer than 1000 units (equivalent to 77 GW) is sufficient to achieve economies of mass production. Conversely, lower carbon and fuel prices require over 10,000 units (770 GW), rendering their establishment impractical.
1. Introduction
1.1. Motivation
Maritime transport is a vital component of the European Union’s economy and one of the most energy-efficient modes of transport. Approximately 77% of the EU’s external trade and 35% of intra-EU trade by value is carried by sea and inland waterways. Currently, maritime transport is a significant source of carbon dioxide (CO2) emissions, accounting for 3–4% of the EU’s total CO2 emissions, equivalent to over 144 million tons in 2019 [1]. Projections indicate that, under various long-term economic and energy scenarios, these emissions could increase by 90% to 130% compared to 2008 levels by 2050, highlighting the urgent need for decarbonization strategies in the sector [2]. The recent strategy adopted by the International Maritime Organization (IMO) sets a target to reduce total annual greenhouse gas (GHG) emissions from international shipping by at least 50% by 2050, relative to 2008 levels [1]. Achieving this ambitious goal will require not only the widespread implementation of energy efficiency measures, but also the adoption of alternative marine propulsion systems that produce significantly lower CO2 emissions compared to conventional fossil-based marine fuels. Pink hydrogen has the potential to serve as a sustainable and carbon-free fuel for maritime applications.
SMRs represent a new generation of nuclear reactors designed to generate up to 300 megawatts of electric power. According to the International Atomic Energy Agency, SMRs are characterized by their compact size and modular construction, which allows for factory fabrication of components and transportation to installation sites for rapid assembly [3]. Compared to large reactors, SMRs are designed with inherent and passive safety features that enhance their operational robustness, reliability, and safety [3]. Their safety systems often rely on natural physical principles such as gravity and convection, reducing dependency on active mechanical components and external power sources. They also offer significant advantages over intermittent renewables, particularly in terms of reliability, high-capacity factors, and consistent energy output [4]. Furthermore, they require substantially less land than renewables to produce the same amount of energy. They also provide (partial) load-following capabilities [5], and their waste heat can be harnessed for various thermal applications [6].
These characteristics make SMRs particularly well-suited as primary sources for hydrogen production [4]. Unlike blue or grey hydrogen, SMR-generated pink hydrogen is carbon-free. Moreover, it offers greater controllability compared to green hydrogen from renewables, as nuclear reactors deliver a stable and continuous power supply. Therefore, the system avoids the need for frequent power ramping and thus minimizes thermal and mechanical stress on reactor components, extending equipment lifespan. From an economic perspective, continuous operation also maximizes the capacity factors of both the SMR and the electrolyzer, enhancing capital utilization and reducing the levelized cost of hydrogen (LCOH).
1.2. Literature Review and Contribution
Kim et al. [7] investigated the integration of a small modular reactor with a PEM-based hydrogen production system to supply Jeju Island. The study demonstrates that the nuclear-hybrid energy system can effectively meet local demand of a renewable-rich grid, by addressing the intermittency and vulnerability of renewables using hydrogen as an intermediate energy carrier. Notably, surplus pink hydrogen—generated as a byproduct of annual load-following operation—can reach up to 10,000 tons from a 12 × 50 MW NuScale SMR plant. Zhang et al. [8] performed a techno-economic analysis of a hybrid nuclear–wind system with hydrogen storage to evaluate its ability to meet real-time electricity demand and deliver long-term economic returns. Results show that, with proper configuration, the system can handle grid demand under variable wind conditions, while hydrogen storage is essential for maintaining reliability. Without storage, demand shortfalls can exceed 300 MW. Additionally, the inclusion of hydrogen storage improves the internal rate of return by 2.74%. References [7,8] examined pink hydrogen as a byproduct of otherwise curtailed renewable electricity, rather than as the output of an autonomous SMR–electrolyzer system specifically designed for pink hydrogen production, which is the focus of this paper.
In [9], the authors conducted a techno-economic comparative analysis of hydrogen production technologies across the entire color spectrum, with a primary focus on colors other than pink hydrogen. Saha et al. [10] conducted a comparative analysis of various Generation IV nuclear reactor types, evaluating their potential for large-scale hydrogen production and exploring possible design adaptations to enhance their suitability for this purpose. However, the study does not provide any insight into the cost of the hydrogen produced. Alabbadi et al. [11] executed an extensive study on the LCOH produced from large (conventional) nuclear reactors with capacities ranging from 360 MW to 1100 MW. The analysis focused on Advanced Pressurized Water Reactors (APWR) and High-Temperature Gas-cooled Reactors (HTGR). For APWR systems using compressed gas (CG) storage, the LCOH was estimated at USD 8.20/kg for a 360 MWe plant, decreasing to USD 6.06/kg for a 1117 MWe plant due to economies of scale. Additionally, the study found that HTGRs integrated with high-temperature steam electrolysis (HTSE) could produce hydrogen at USD 3.51/kg, slightly below the cost of hydrogen from grid electricity, which was estimated at USD 3.55/kg.
However, SMRs are at an economic disadvantage primarily due to their lower power output. SMRs produce less than 300 MW per unit, in contrast to the approximately 1000 MW output of conventional large-scale reactors that have been deployed over the past four decades [12]. This reflects a common principle in industrial engineering, where a power law is used to estimate capital costs across facilities of varying sizes. Typically, this is expressed using an exponent of 0.6, such that the cost ratio between two facilities equals the capacity ratio [13]. Applying this rule, a 200 MW SMR would cost about 40% lower than a 1000 MW plant, yet it would only deliver 20% of the power output. As a result, the SMR’s cost per megawatt of capacity is roughly twice as high. The same applies to operational costs, which also scale less favorably for smaller units. These scale disadvantages contribute to a higher LCOH for hydrogen produced by SMRs compared to large reactors.
The techno-economic assessment of pink hydrogen remains largely underexplored in the academic literature. To the best of our knowledge, no prior study has specifically examined the economic feasibility of pink hydrogen produced via SMRs for maritime applications. The contributions of the paper are summarized below:
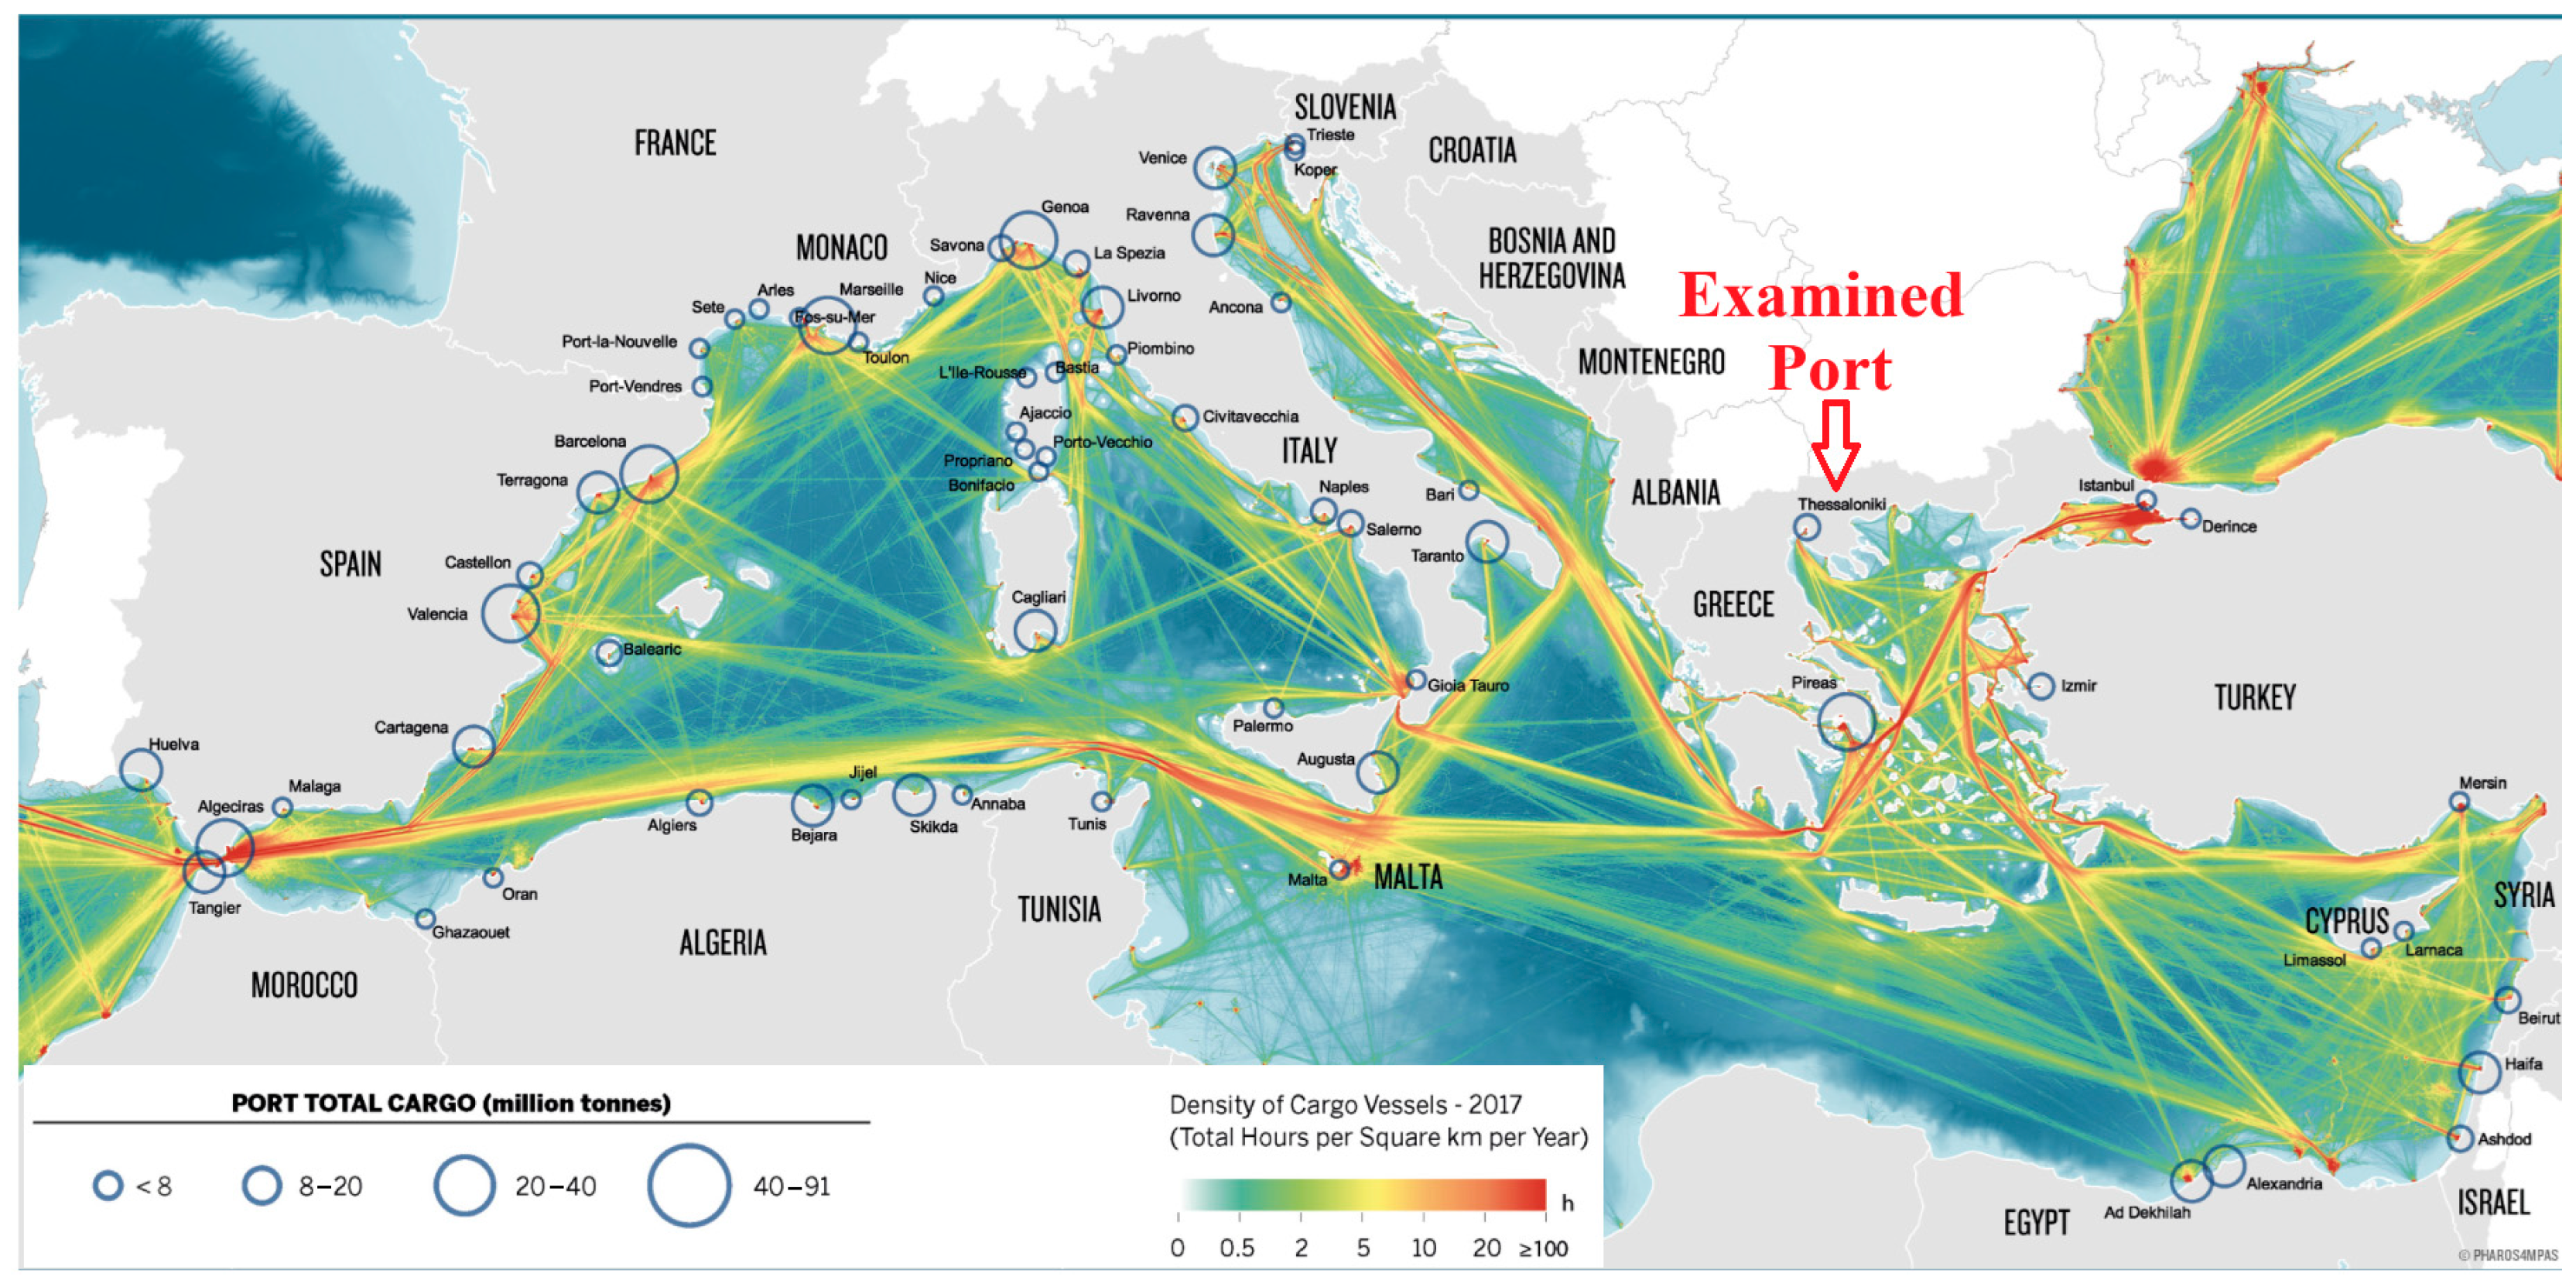
- It presents a comprehensive techno-economic assessment of hydrogen produced from SMRs for maritime use, using the port of Thessaloniki (the second-largest port in Greece) as a case study, as shown in Figure 2 [14]. The analysis includes both hydrogen production and transportation cost and evaluates the LCOH under a range of technical and economic scenarios.
- It conducts a detailed sensitivity analysis on key LCOH drivers, including the capital costs of SMRs and electrolyzer, the cost of uranium fuel, and the operational lifetime of SMR units.
- It investigates the economic viability of SMR-produced pink hydrogen as a marine fuel by directly comparing it to diesel, the dominant conventional fuel in the shipping sector. The study identifies specific threshold values for LCOH and SMR CAPEX that must be achieved to make the transition to hydrogen-fueled shipping economically viable.
- It explores how the economics of mass SMR production can reduce unit capital costs and assesses whether these reductions are sufficient to make SMR-produced hydrogen competitive with diesel in maritime transport.
- Finally, it analyzes the extent to which policy mechanisms, particularly carbon pricing, can improve the economic viability of SMR-produced hydrogen in the maritime sector.
2. Description of the Installations
2.1. Nuclear Power Plant
Among the various SMR designs under development, NuScale’s modular reactor is one of the most advanced and viable candidates for supporting hydrogen refueling infrastructure in maritime applications due to its scalability, licensing progress, and potential for integration with electrolysis systems. One of NuScale’s key advantages is that it is the first—and currently the only—SMR design to receive design certification from the U.S. Nuclear Regulatory Commission, with formal approval granted in 2020 and the final rule issued in early 2023. This regulatory milestone significantly reduces licensing risk compared to other designs still under development, such as the GE Hitachi BWRX-300 and Holtec’s SMR-160 [3]. The reactor design eliminates the need for external pumps by utilizing natural circulation for cooling. Together with its passive safety systems, it ensures safe shutdown and heat removal during emergencies—without relying on external power sources or operator intervention [15]. Each NuScale module produces 77 MWe, and up to 12 modules can be installed in a single site. This modular approach allows for flexible scaling based on hydrogen demand. In this study, we consider a configuration of 4 modules (totaling 4 × 77 MWe), which is well-suited for medium-scale hydrogen production hubs [16,17,18]. Table 1 outlines the key characteristics of a NuScale module.

Table 1.
Characteristics of NuScale Power Module.
2.2. Uranium Supply Chain
Greece hosts known uranium occurrences, particularly within the Serbo-Macedonian Massif and the Maronia Pluton located in the northern part of the country. Geological investigations have identified uranium-bearing minerals such as uraninite and thorianite within the Maronia monzodiorite, confirming the presence of uranium in this granitoid complex [21]. In addition, actinide-rich coastal sand deposits in regions including Kavala, Sithonia, and Mykonos have been shown to contain monazite and allanite, minerals typically associated with uranium and thorium [21,22]. Despite these findings, there are currently no active uranium mining operations in Greece. The economic viability of exploiting these deposits remains uncertain due to factors such as ore grade, accessibility, and lack of comprehensive feasibility studies [21,23].
Once extracted, uranium is typically converted into uranium oxide concentrate (U3O8 or “yellowcake”) for transport. The transportation of this material is subject to stringent international safety protocols and is commonly conducted by road, rail, or maritime routes, depending on regional infrastructure [24,25]. The enrichment process transforms natural uranium (i.e., U3O8) into enriched uranium dioxide (UO2) by increasing the concentration of the fissile isotope U-235, typically from 0.7% to 3–5%, through chemical conversion, gas centrifugation, and reconversion to solid fuel. Enriched uranium UO2, the fuel used by commercial nuclear reactors, contains 3456 GJ of energy per kilogram UO2, which is magnitudes larger than the energy density of traditional fossil fuels.
Table 2 outlines indicative costs of key stages involved in uranium fuel processing, each representing a critical step in transforming raw uranium into reactor-ready fuel. The process begins with U3O8 (“yellowcake”), which is chemically converted into uranium hexafluoride (UF6), a solid (at room temperature) that is heated to a gaseous state suitable for enrichment. During the enrichment stage, the concentration of the fissile isotope U-235 is increased—typically from 0.7% to 3–5%—using gas centrifuge or other separation technologies. The enriched UF6 is then reconverted to solid form and shaped into uranium dioxide (UO2) pellets through the fabrication stage, which involves pressing, sintering, and assembly into fuel rods ready for use in nuclear reactors.
The burnup efficiency of the final UO2, also named low-enriched uranium (LEU), is approximately 3456 GJ/kg, equivalent to 960 MWh/kg [26]. However, due to thermodynamic losses in the thermal power conversion cycle, only about 33% of this energy is converted into net electrical output delivered to the grid. Over time, the buildup of fission products and heavy elements makes fuel unusable, so it is typically removed after 18–36 months. The refueling period lasts about 10 days [19]. Spent fuel usually contains about 1% U-235, 0.6% fissile plutonium (≈1% total Pu), 95% U-238, and ~3% fission products and minor actinides. When removed from the reactor, spent fuel emits intense radiation (mainly from fission products) and significant heat. It is first placed in a storage pond next to the reactor, where water provides both radiation shielding and cooling via heat exchangers. After several months (or even years) in the pond, the fuel may be moved to dry, air-cooled storage, typically on site [26].
Table 2.
Indicative Cost Estimates Along the Uranium Processing.
Table 2.
Indicative Cost Estimates Along the Uranium Processing.
| U3O8 | 200 EUR/kg [27] |
| Conversion (UF6) | 38 EUR/kg [27] |
| Enrichment | 452 EUR/kg [27] |
| Fabrication | 240 EUR/kg [27] |
| Total | ~930 EUR/kg [27] |
2.3. Hydrogen Supply Chain
Figure 1a depicts the hydrogen supply chain, tracing the process from production to delivery at the Port of Thessaloniki. The pink hydrogen is subsequently liquefied by cooling it below 21 K, increasing its energy density to approximately 71 kg/m3 [20]. Hydrogen liquefaction is a highly energy-intensive process, consuming about 30% of the hydrogen’s total energy content in the form of electricity, yielding an overall liquefaction efficiency of 70%. Finally, the hydrogen is delivered to a consumption site in liquid form via trucks, enabling direct use in vessels (unless if vessels use gas hydrogen; in this case hydrogen evaporation is required). The installed capacity of the electrolyzer is 4 × 77 MW (equal to SMR capacity). While electrolysis traditionally relies on high-purity water as feedstock, recent advances in electrocatalyst development and system design have made the direct use of seawater increasingly feasible [28].
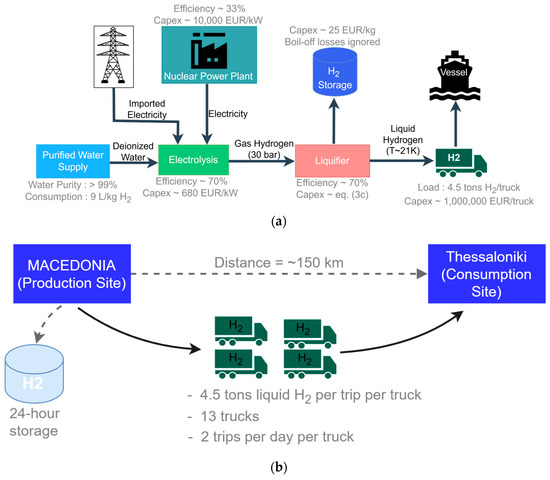
Figure 1.
Schematic representation of (a) hydrogen supply chain tracing the process from production to delivery at the Port of Thessaloniki and (b) hydrogen transport.
Figure 1b depicts the transport details from the production site to the port. In this study, the annual hydrogen production is approximately 40,062.4 tons (computed in the next section), corresponding to a daily output of 109.76 tons. According to [20], each truck can transport an average of 4.5 tons of liquid-hydrogen per trip. Assuming each truck covers around 500–600 km and the average distance from the production to consumption site is 150 km, then each truck can complete two round trips daily. Therefore, a fleet of 13 trucks would be required to transport the entire daily hydrogen output from Macedonia to the Port of Thessaloniki. The Port of Thessaloniki, shown in Figure 2, handles 16,777,263 tons of cargo and 520,048 standard shipping containers (data of 2023), making it one of the busiest cargo ports in Greece and the country’s second-largest container port. The storage capacity is sized at 109.76 tons, providing a full 24 h hydrogen reserve.
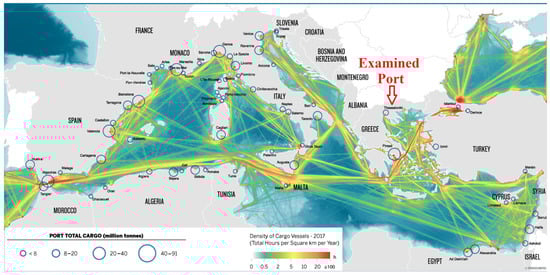
Figure 2.
Ship traffic density map of Mediterranean Sea [14]. The examined port is marked.
3. Methodology
This section describes the methodology used to calculate the end-user LCOH for the hydrogen produced by SMRs. The analysis is divided into three core components: hydrogen production estimation (Section 3.1), cost estimation (Section 3.2), and techno-economic evaluation (Section 3.3).
3.1. Hydrogen Production Estimation
The study assumes a nuclear reactor system with an electrical output of 4 × 77 MW (4 units × 77 MW each), operating at an average capacity factor of 98.5%, which corresponds to approximately 8640 operational hours per year, i.e., 360 days of full power. This 5-day outage time per year is for maintenance and fuel replacement purposes [29].
Hydrogen is produced through water electrolysis. The electrolyzer operates with an assumed efficiency of 70% [30], while the hydrogen liquefaction process consumes approximately one-third of the hydrogen’s energy content. Therefore, the liquefaction efficiency is also considered to be around 70% [20]. Using the above assumptions, the mass of hydrogen produced at hour (an hourly analysis is used) is calculated in Equation (1):
In (1), denotes the electric power produced from the nuclear station as long as it remains operational—that is, for all , where represents the set of hours during the year when the station undergoes maintenance. During the scheduled maintenance and refueling intervals of the nuclear station (i.e., for all ), power demand is covered by importing electricity from the grid, represented by . and represent the efficiency of electrolyzer and liquification station, respectively, while the number 33 kWh/kg is the lower heating value (LHV) of hydrogen and is used to convert electrical energy input (in kWh) into the equivalent mass of hydrogen produced (in kg).
The annual hydrogen production is calculated in Equation (2) by summing the hourly production values over 8760 h:
3.2. Cost Estimation
3.2.1. Capital Expenditures (CAPEX)
The total CAPEX is categorized into two components: the nuclear station and hydrogen infrastructure cost. is defined in Equation (3a) as the product of levelized nuclear station cost and the power capacity of the station. The CAPEX cost of electrolyzer, liquefication unit, storage installation, and transportation cost are defined in Equations (3b) to (3e), respectively. In those equations, is the installed power capacity of the electrolyzer; represents the electrolyzer’s specific capital cost. is estimated based on economies of scale, assuming a reference cost of EUR 105 million for a facility with a production capacity of 50 tons of hydrogen per day. represents liquid hydrogen storage’s specific cost. The storage capacity is designed to provide 24 h full autonomy in case of hydrogen production failures. Finally, is the number of trucks for transferring the hydrogen from production to consumption site, while is the cost of each truck (including the cost of hydrogen trailer).
3.2.2. Operational Expenditures (OPEX)
The OPEX of nuclear station is given in Equation (4a), including a fixed 3% of nuclear CAPEX, and fuel cost based on uranium priced (EUR/kg), burnup (kWh/kg LEU) and fuel-to-electric efficiency [31]. The nuclear station is assumed to operate continuously (at full power) throughout the year, except during scheduled maintenance periods; that is, for all time steps t ∈ {1, …, 8760}, such that . The cost of imported electricity from the grid during the nuclear station’s maintenance periods is denoted by .
The OPEX of each component of the hydrogen facility, including electrolyzer, liquefier, and storage, is given in Equations (4b) and (4c), as a ratio of CAPEX cost [20]. Hydrogen production OPEX is estimated at 3% of its CAPEX [20], encompassing water treatment, electrolyzer upkeep, and system management [32]. Finally, the OPEX of hydrogen transport is given as the product of the number of trucks and the annual OPEX per truck
3.3. Economic Evaluation and LCOH Calculation
The LCOH is calculated using a techno-economic model that annualizes the capital cost of each component individually by applying a component-specific capital recovery factor (CRF) based on its technical lifetime and a weighted average cost of capital (WACC) of 3% [33,34,35]. The CRF for component is computed in (5) using:
is the lifetime of component where is the set that includes all individual components of the installation, such as IC = {nuclear, el/zer, liquefier, storage, trucks}.
The final LCOH is calculated in Equation (6) as:
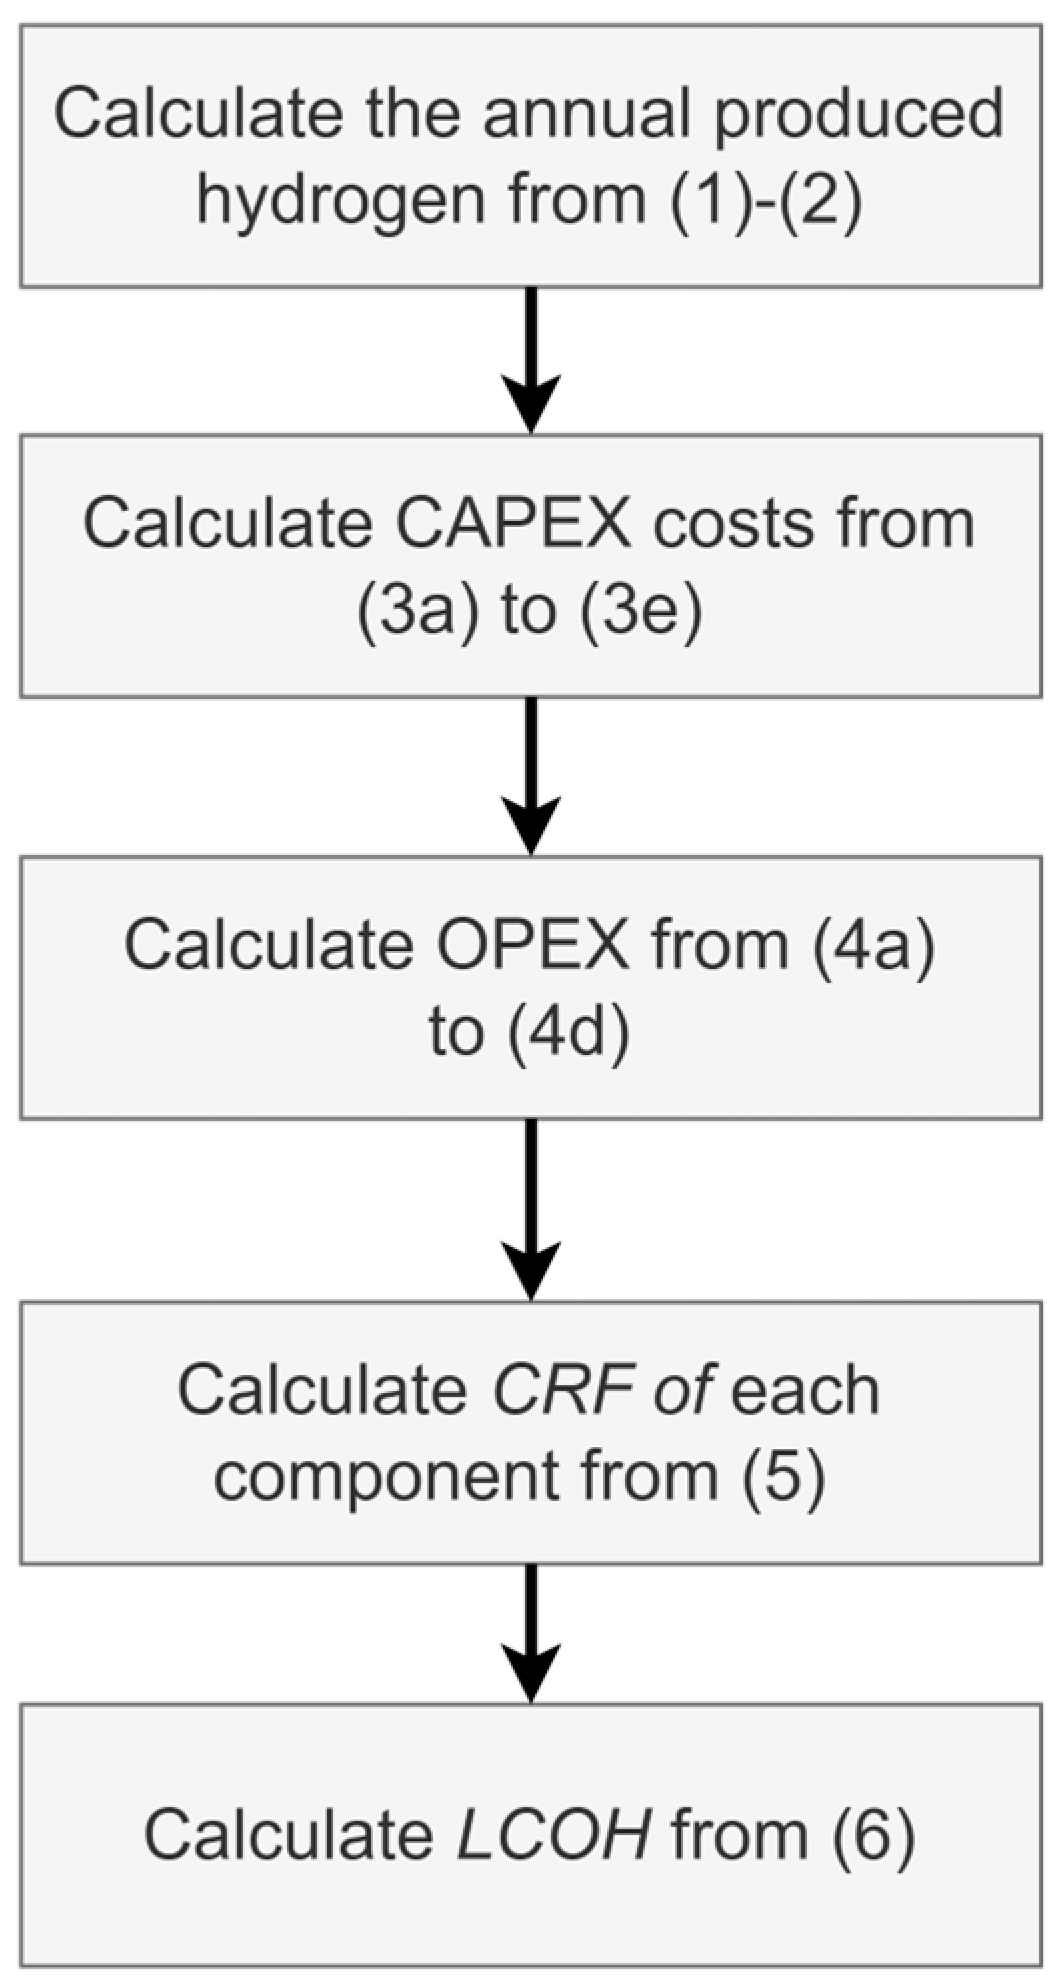
where is defined in Equations (3a)–(3e); is defined in Equations (4a)–(4d); is defined in (5); and is expressed in Equation (2). Figure 3 presents a flowchart summarizing the process for calculating the LCOH.
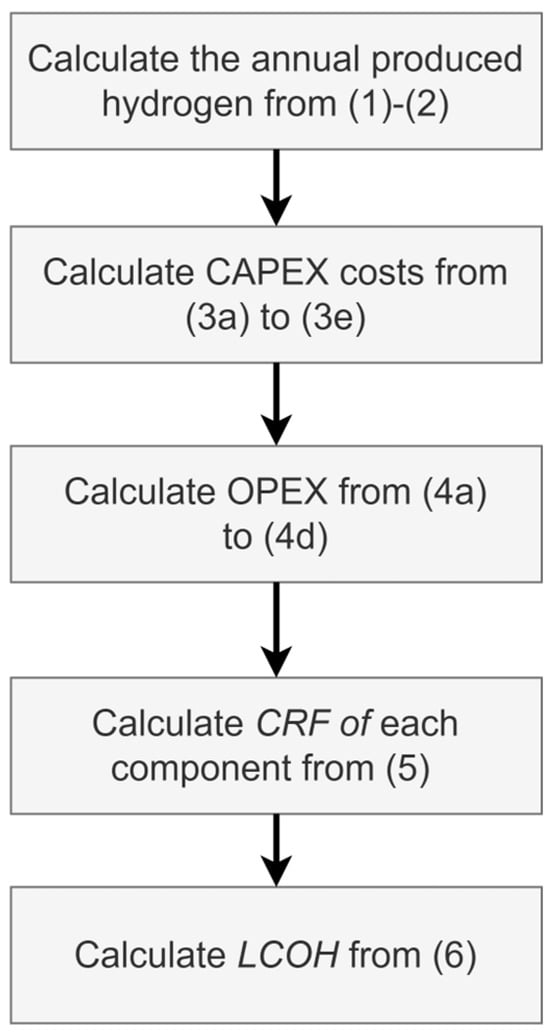
Figure 3.
Flowchart of the proposed method for estimating the LCOH in SMR-powered hydrogen production facilities.
4. Techno-Economic Analysis
4.1. Techno-Economic Data
Table 3 quotes the techno-economic parameters for the SMR. The specific cost of SMR is assumed to have a base value of 10,000 EUR/kW [19,36,37,38]. The cost of LEU is 930 EUR/kg [19,27]; the burnup of LEU is 3456 GJ/kg [19,26,27]; the thermal-to-electric efficiency of SMR is 33% [19]. Note that the and correspond to the low-enriched uranium (LEU) with a U-235 content of 3–5%. The cost of imported electricity is assumed 0.15 EUR/kWh [39]. Finally, the lifetime of SMR is 60 years [19].
Table 3.
Estimated cost and lifetime for SMR facility.
Table 4 includes the parameters for hydrogen-related facilities. The specific cost of electrolyzer is assumed to have a base value of 680 EUR/kW [40]. Note that this cost corresponds to the current estimated cost of alkaline electrolyzers, as reported in [40]. However, PEM electrolyzers exhibit comparable cost levels, and therefore the results maintain general applicability across technologies. The specific cost of liquid hydrogen storage is 25 EUR/kg H2 [20]. The cost of each truck for transporting liquid hydrogen is considered EUR 1 million [20]. The transport operational expenditure per truck is estimated at EUR 110,000 annually [20]. This includes a driver salary of EUR 30,000, maintenance costs of EUR 5000, and diesel expenses of EUR 75,000—based on a daily travel distance of 600 km and a fuel consumption rate of 35 L/100 km. Approximately 13 trucks are required to cover the route from Macedonia to Thessaloniki port, as detailed in Section 2.3. The lifetime of all hydrogen facility components is 20 years [20]. The efficiencies of electrolyzer and liquifier are both 70% [20,39].
Table 4.
Estimated cost and lifetime for hydrogen production, storage, and transportation facilities.
4.2. Techno-Economic Results
The installation under consideration is estimated to produce approximately 40,062.4 tons of hydrogen annually, at an LCOH of around 6.64 EUR/kg, as shown in Table 5. This end-user cost includes production, liquefaction, storage, and road transport (in liquid form), based on the cost assumptions outlined in Section 4.1. This amount of hydrogen could roughly supply ~7–12 medium-sized ferries (each consuming 150–250 MWh/day) or ~30–60 small harbor vessels (e.g., tugs, patrol boats) consuming ~30–60 MWh/day each, or ~2 cruise ships (each consuming 864 MWh/day) [41]. Therefore, the assumed production capacities are well aligned with realistic uptake scenarios without jeopardizing hydrogen oversupply.
Table 5.
Summary of Hydrogen Production and Levelized Cost.
Table 6 depicts the breakdown by cost category. The LCOH is primarily driven by the production cost, owing to the high CAPEX and OPEX of the SMR and electrolyzer units. Specifically, hydrogen production accounts for 5.93 EUR/kg and liquefaction accounts for 0.6483 EUR/kg, while storage contributes 0.0066 EUR/kg. The low storage cost is attributed to the limited storage capacity (only 24 h of backup) and the relatively low cost of liquid hydrogen. Notably, boil-off losses are neglected in this study, as they amount to only 0.03% and have negligible impact on the total LCOH [20,42]. Furthermore, boil-off hydrogen can be recovered or repurposed through various strategies, such as re-liquefaction systems, venting into low-pressure buffers for combustion or power generation, or direct utilization in port equipment and fuel cell systems [43]. The transportation accounts for a small share of the total LCOH—only 0.0575 EUR/kg—due to the relatively short distance considered in our study (~150 km). Even if this distance was doubled, the transportation cost would increase proportionally to approximately 0.1 EUR/kg, which remains a minor contribution to the overall hydrogen cost.
Table 6.
LCOH Breakdown by Cost Category.
The total CAPEX is estimated at approximately EUR 3.4816 billion (Table 7), with the SMR unit being the dominant contributor (EUR 3.08 billion), followed by the electrolyzer (EUR 209.44 million) and the liquefaction unit (EUR 176.43 million). Such high capital requirements may raise concerns about the bankability of these projects, particularly in comparison to more mature and competitive technologies like PV, wind, or gas-fired units, whose investment cost is typically less than one tenth of that of SMR systems.
Table 7.
CAPEX Breakdown by Cost Category.
Finally, Table 8 summarizes the annual OPEX by component. The SMR unit incurs an annual OPEX of EUR 105.76 million, primarily comprising fixed O&M costs (3% of CAPEX, or EUR 92.4 million), the fuel cost (EUR 7.81 million), and grid electricity consumed during refueling and maintenance periods (EUR 5.54 million). The OPEX of the electrolyzer and storage is EUR 6.28 million and EUR 0.08 million, respectively (Equation (4b)), while the liquefaction unit accounts for EUR 14.11 million (Equation (4c)), and the transport system contributes EUR 1.43 million (Equation (4d)).
Table 8.
Annual OPEX Breakdown by Cost Category.
4.3. Sensitivity Analysis
Due to the uncertainty in defining the exact values of key parameters for SMRs and electrolyzers, stemming from the immaturity of both technologies, a sensitivity analysis is conducted. The objective is to assess how the LCOH responds to variations in the CAPEX of the SMR and electrolyzer, the price of uranium, and the operational lifetime of the SMR. The base values, as presented in Table 3 and Table 4, include a CAPEX of 10,000 EUR/kW for the SMR, 680 EUR/kW for the electrolyzer, a LEU cost of 930 EUR/kg, and a 60-year SMR lifetime. Parameter variations are expressed as percentages relative to these baseline values; for example, an 80% SMR CAPEX corresponds to 8000 EUR/kW.
Figure 4 shows the LCOH as a function of SMR CAPEX and uranium cost. The analysis reveals that LEU cost has only a marginal impact on LCOH due to the exceptionally high energy density and relatively low specific cost of nuclear fuel. Specifically, fuel cost accounts for only 7.81 million EUR/year out of a total operation and maintenance cost of 105.76 million EUR/year, as detailed in Section 4.2. In contrast, SMR CAPEX is identified as the most critical factor influencing LCOH. For instance, halving the SMR CAPEX to 5000 EUR/kW results in a substantial LCOH reduction from 6.64 EUR/kg to 4.1 EUR/kg. Conversely, doubling the CAPEX to 20,000 EUR/kW, as is currently the pilot cost estimate of NuScale project [44,45], drives the LCOH up to 11.7 EUR/kg.
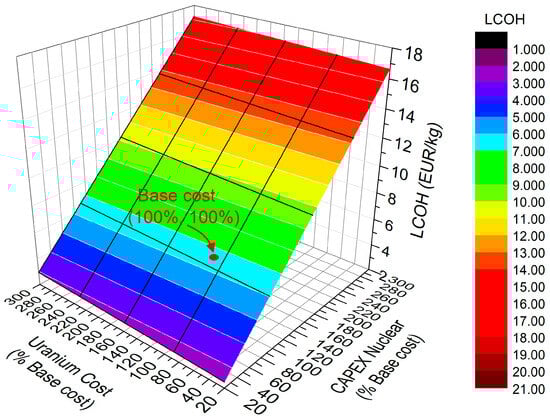
Figure 4.
LCOH (z-axis) versus the CAPEX of Nuclear station (x-axis) and the cost of Uranium (y-axis).
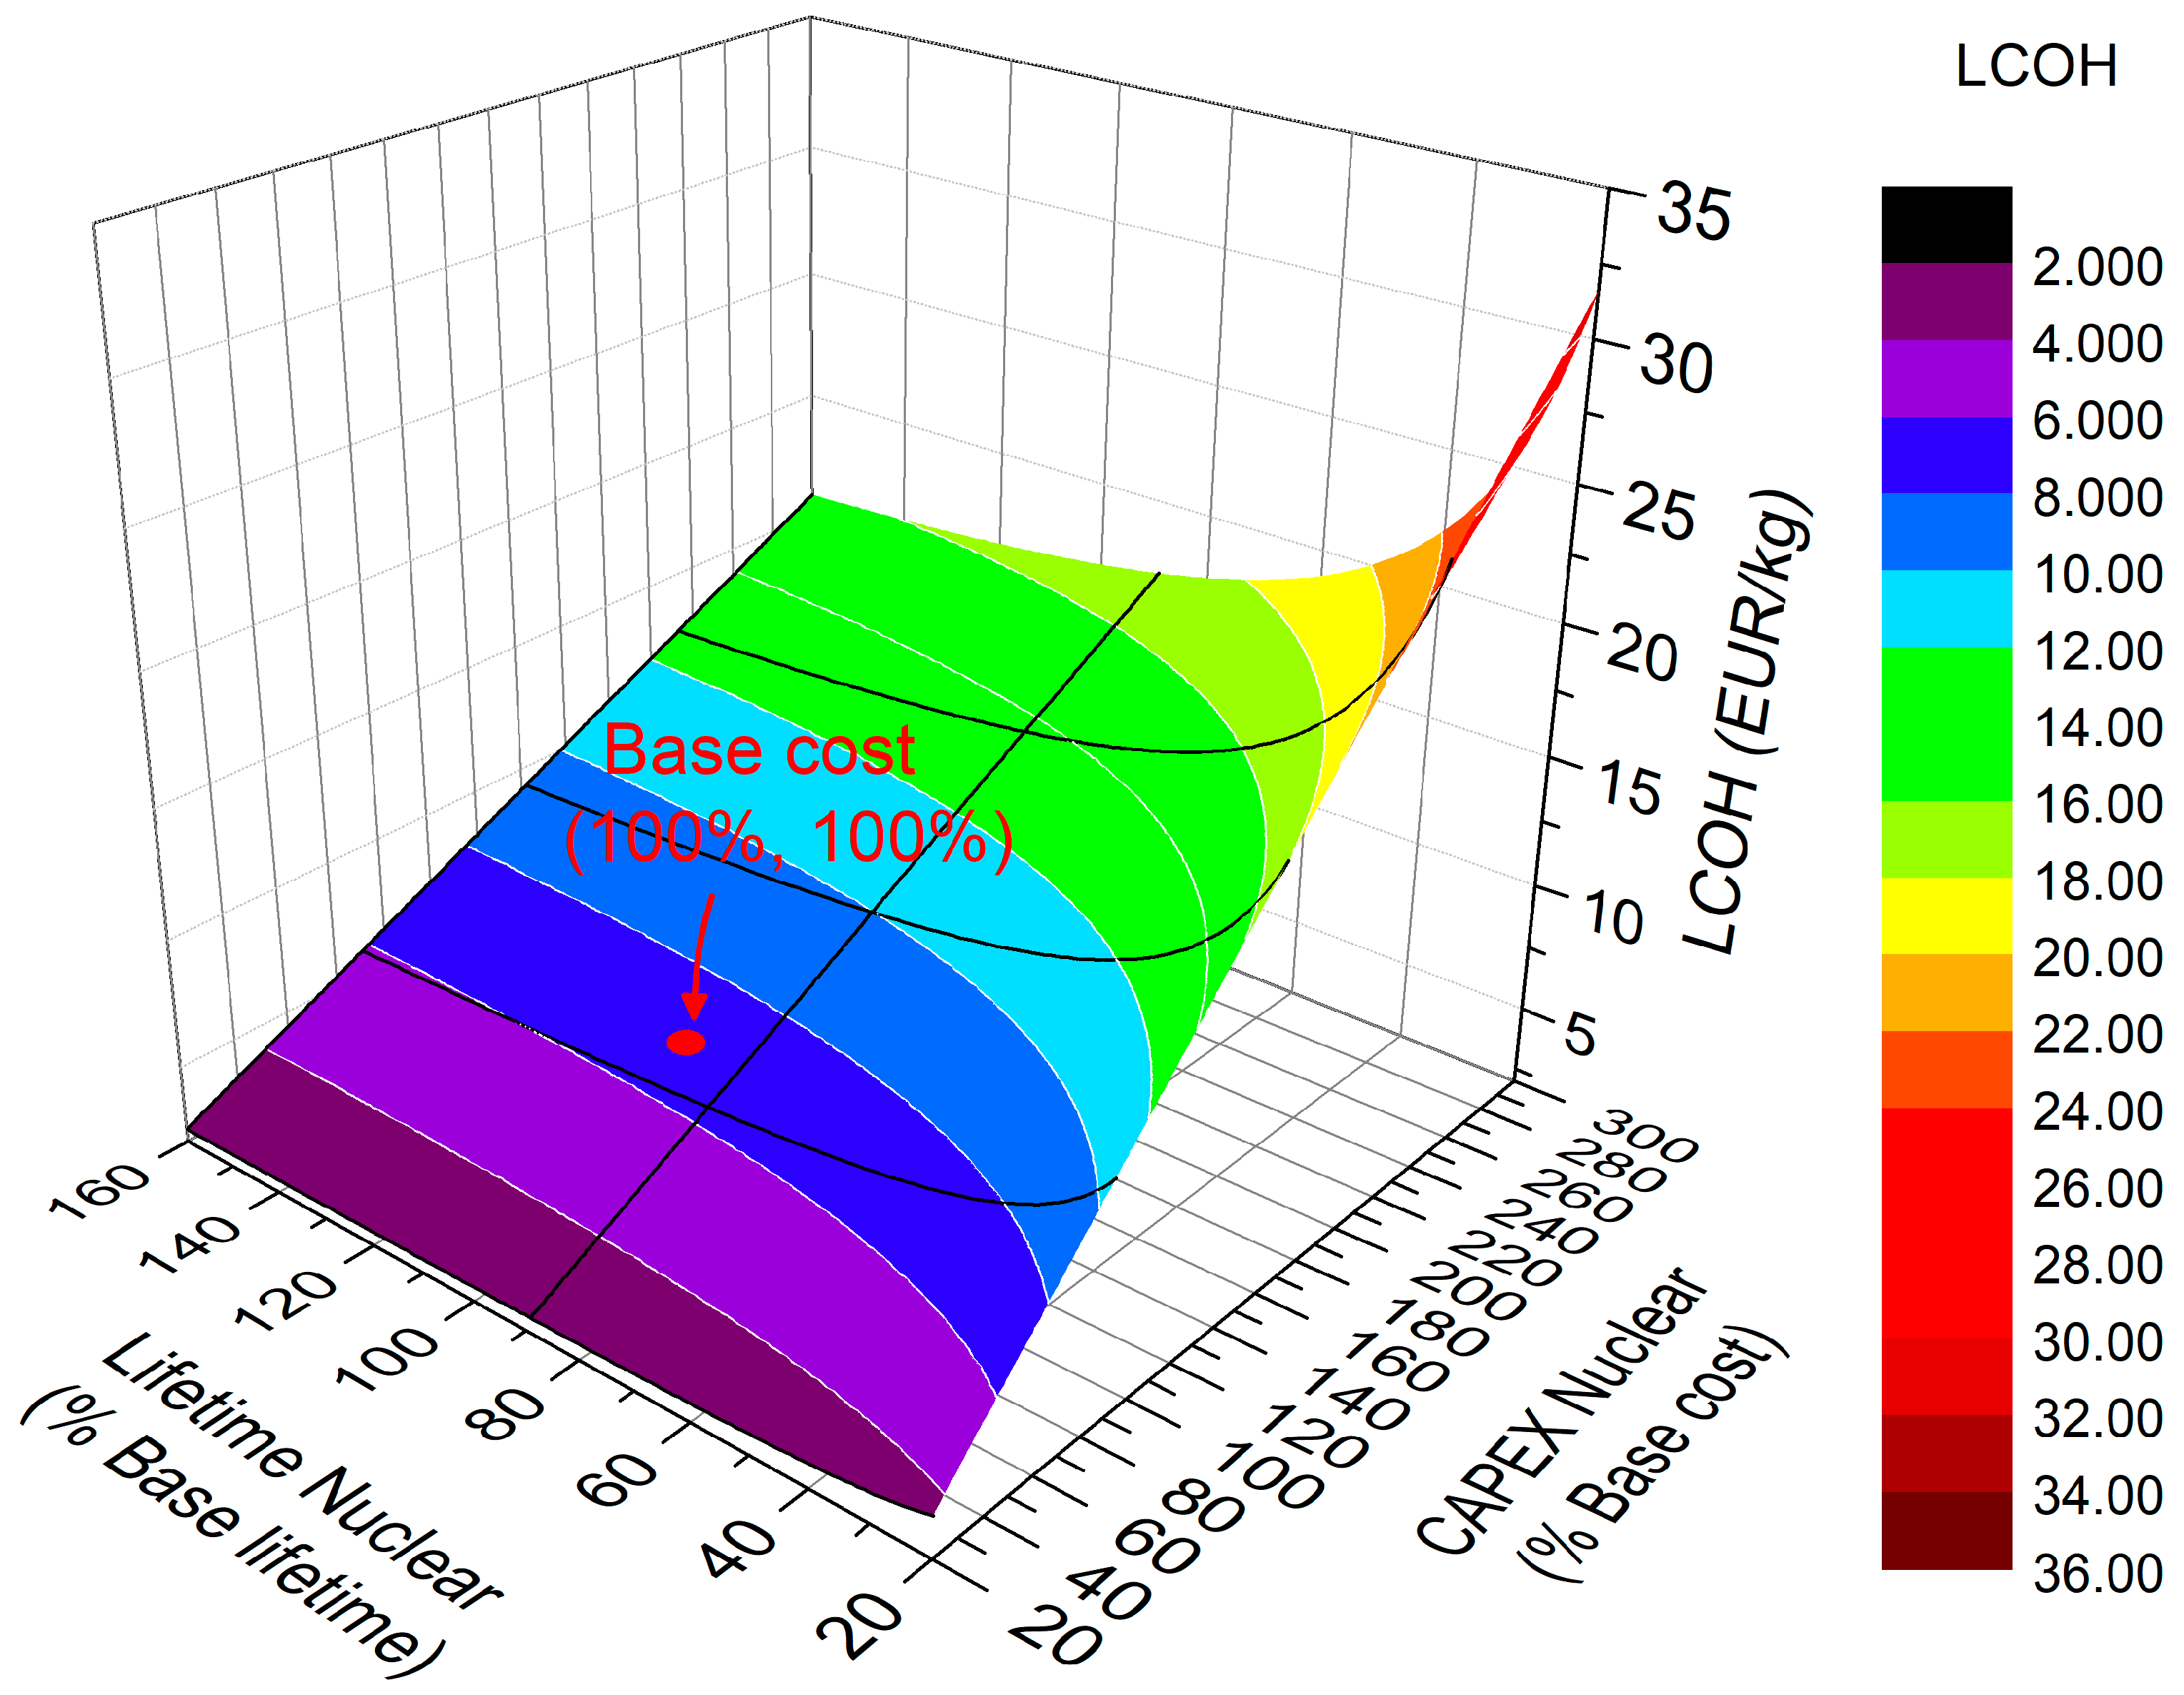
Figure 5 presents the LCOH as a function of SMR and electrolyzer CAPEX. The electrolyzer CAPEX is shown to have a relatively minor effect; doubling its base value from 680 EUR/kW to 1360 EUR/kW increases the LCOH only moderately—from 6.64 EUR/kg to 7.14 EUR/kg. Finally, Figure 6 illustrates the LCOH as a function of SMR CAPEX and lifetime. While the SMR lifetime does influence LCOH, its effect is less pronounced. For example, reducing the SMR lifetime from 60 years to 30 years increases the LCOH to 7.78 EUR/kg, whereas extending the lifetime to 96 years (160% of the base case) reduces the LCOH only slightly to 6.18 EUR/kg.
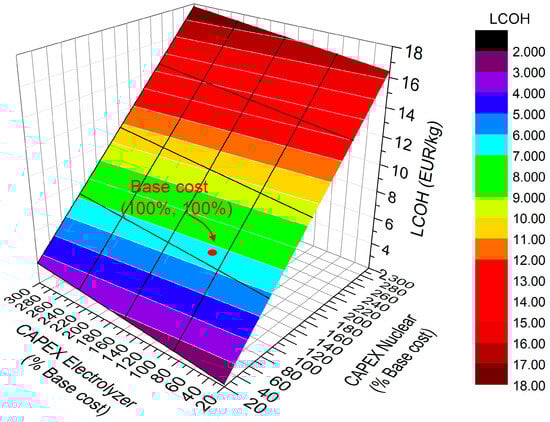
Figure 5.
LCOH (z-axis) versus the CAPEX of Nuclear station (x-axis) and the CAPEX of electrolyzer (y-axis).
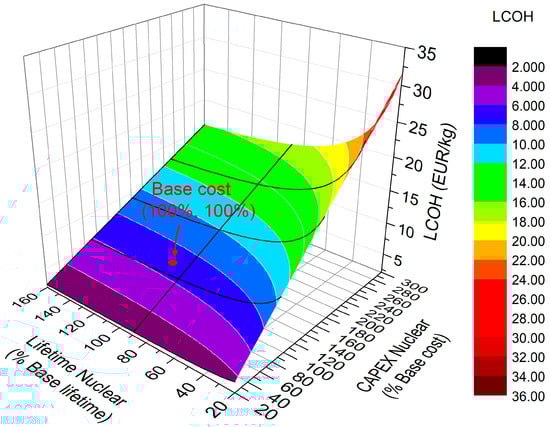
Figure 6.
LCOH (z-axis) versus the CAPEX (x-axis) and the lifetime of Nuclear station (y-axis).
5. Investigating Economic Viability of Hydrogen Ships
5.1. Specifying Viability Thresholds for LCOH and SMR’s CAPEX
This section examines the conditions under which hydrogen-fueled vessels can become economically competitive with conventional diesel engines using very low sulfur fuel oil (VLSFO), from the perspective of ship owners. For consistency, both propulsion systems are assumed to operate 12 h per day. The technical and economic characteristics of each system are detailed in Table 9 and Table 10. Notably, the EU Emissions Trading System (ETS), which requires purchasing allowances for every ton of CO2 emitted, applies only to diesel engines and not to those powered by pink hydrogen [46].
The levelized Net Present Cost (NPC) per megawatt of engine capacity—for both diesel and hydrogen-based propulsion systems—is computed using (7a) and (7b), respectively:
In (7a), is the specific fuel consumption for diesel, taken as 185 kg/MWh; is the daily operating time, assumed to be 12 h; is the diesel price, varying between 0.6 EUR/L and 1.4 EUR/L; is the diesel engine’s CO2 emission factor, considered as 3.15 kg CO2 per kg of diesel; is the carbon emmission cost varied from 0 to 1 EUR/kg CO2; LT is the engine lifetime, assumed to be 20 years; and is the capital cost of the diesel engine, taken as 0.25 million EUR/MW. Similarly, in (7b), is the specific hydrogen consumption, assumed to be 60 kg H2/MWh, and is the initial aggregate cost of the fuel cell system, inverter, and electric motor, considered as 1 million EUR/MW. All data are summarized in Table 9 and Table 10. By setting , the maximum allowable LCOH can be determined for varying diesel prices and CO2 emission costs, identifying the thresholds at which hydrogen propulsion becomes a viable alternative.
Figure 7 illustrates the viability threshold for the LCOH across a wide range of diesel and carbon emission costs. The current diesel price is estimated at 0.6 EUR/kg [47], while the carbon emission cost stands at 0.129 EUR/kg CO2 [48,49]. Under these conditions, hydrogen becomes economically viable for maritime use only if the LCOH does not exceed 3 EUR/kg, as shown in the figure. Above this threshold, hydrogen-fueled vessels lose economic competitiveness. Both diesel and carbon emission costs significantly influence hydrogen’s viability since it in increases the viability threshold. For example, doubling the diesel cost from 0.6 EUR/kg to 1.2 EUR/kg raises the LCOH threshold from 3 EUR/kg to 4.81 EUR/kg. Likewise, doubling the carbon cost from 0.129 EUR/kg to 0.258 EUR/kg increases the threshold to 4.23 EUR/kg, while tripling it results in a threshold of 5.5 EUR/kg. This indicates that increasing carbon pricing can be an effective measure for promoting the adoption of hydrogen in maritime transport. The EU Emissions Trading System II (EU ETS II), scheduled for launch in 2027, is designed to reduce emissions in the transport, buildings, and small industry sectors by progressively raising carbon costs [50]. However, while this policy supports the energy transition, it may also raise end-user expenses, with transport costs projected to increase by up to 27% and home heating costs by as much as 41%.
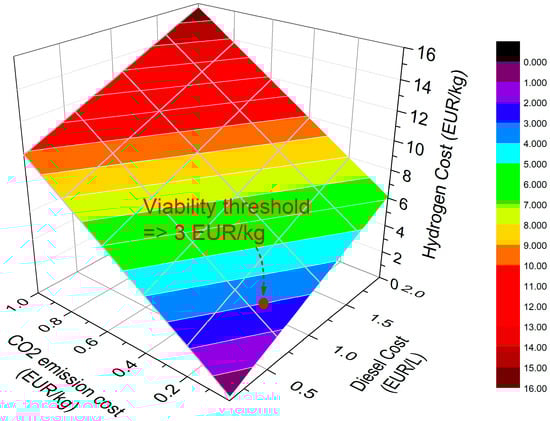
Figure 7.
LCOH viability threshold (Z-axis) as a function of diesel fuel cost (X-axis) and CO2 emissions cost (Y-axis). The figure indicates the maximum LCOH in order for the hydrogen-fueled vessels to be economically viable, under various diesel and CO2 costs.
Table 9.
Characteristics of Diesel Engine.
Table 9.
Characteristics of Diesel Engine.
| Specific Fuel Consumption * | Diesel Price | Emissions | CO2 Emissions Cost | Cost of Engine | Lifetime of Engine |
|---|---|---|---|---|---|
| 185 kg fuel/MWh [48,51] | X-axis (Figure 7) | 3.15 kg CO2/kg fuel [48] | Y-axis (Figure 7) | 0.25 million EUR/MW [48] | 20 years |
* The amount of fuel required to generate 1 MWh of electricity.
Table 10.
Characteristics of Fuel Cell Propulsion System.
Table 10.
Characteristics of Fuel Cell Propulsion System.
| Specific Fuel Consumption | Hydrogen Price | Cost of Fuel Cell, Inverter, Electric Motor | Lifetime |
|---|---|---|---|
| 60 kg H2/MWh | Z-axis (Figure 7) | 1 million EUR/MW [52] | 20 years |
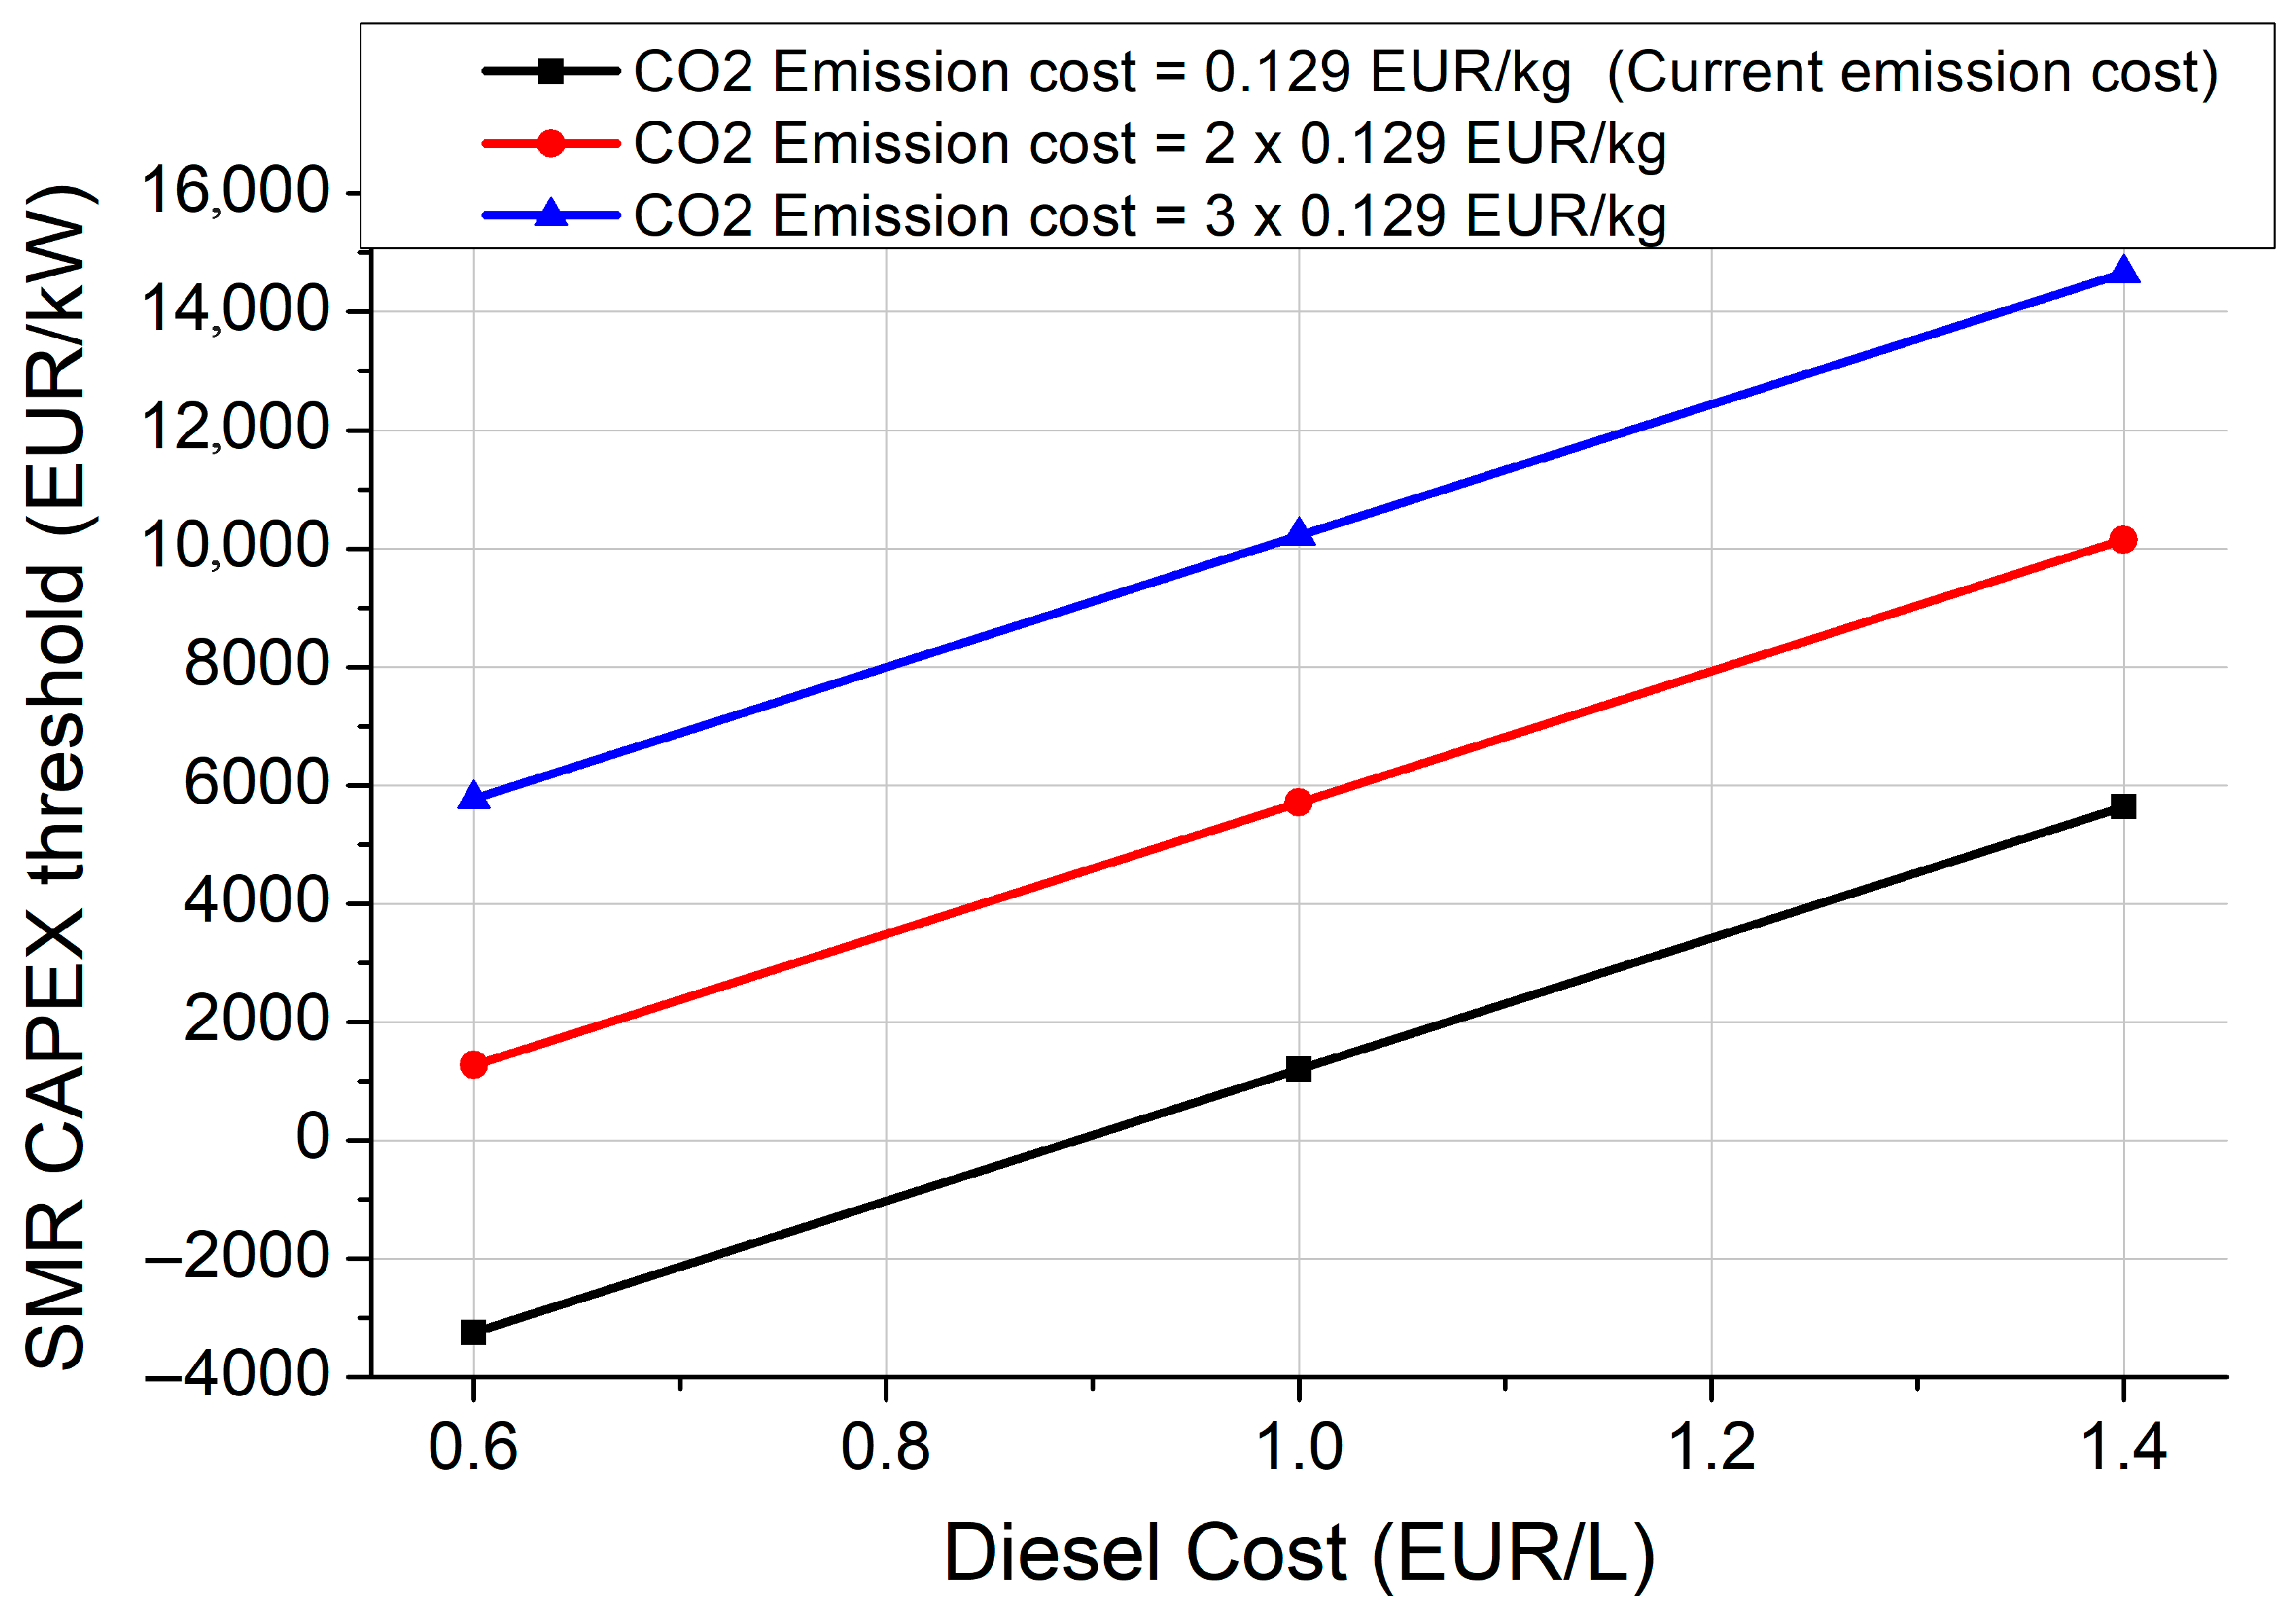
Figure 8 presents the viability threshold for SMR CAPEX across a wide range of diesel prices under three carbon emission cost scenarios. The figure is derived by computing the SMR CAPEX values that correspond to the LCOH thresholds shown in Figure 7. As illustrated, when the carbon emission cost is 0.129 EUR/kg and diesel prices remain below 0.90 EUR/L, pink hydrogen from SMRs becomes entirely unviable—since the required CAPEX would need to fall to negative values, which is clearly unrealistic. Even with diesel prices reaching 1.40 EUR/L under the same carbon cost, SMR CAPEX would need to be as low as 5639 EUR/kW—an optimistic target that may be unachievable, even with substantial economics of mass production. In our view, in order for pink hydrogen from SMRs to become viable in the maritime sector, a significant policy shift is necessary: carbon emission costs must triple to around 0.387 EUR/kg, while diesel prices must exceed 1 EUR/L. Under these conditions, an SMR CAPEX of approximately 10,000 EUR/kW (which is a realistic cost) would be sufficient to render pink hydrogen competitive with diesel-fueled vessels.
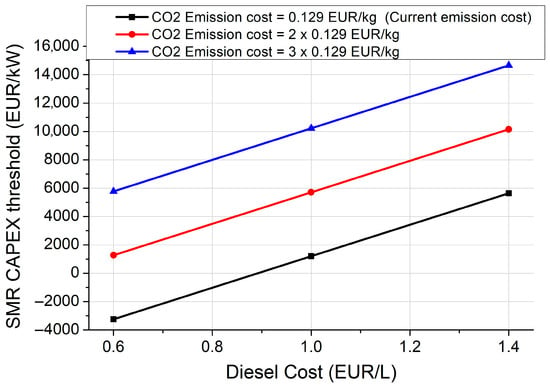
Figure 8.
SMR’s CAPEX viability threshold (Y-axis) as a function of diesel fuel cost (X-axis) for three different CO2 emissions costs. The figure illustrates the maximum allowable SMR CAPEX in order for the hydrogen-fueled vessels to become economically viable, under various diesel and CO2 costs.
5.2. Defining the Minimum SMR Fleet for Economies of Mass Production
This section examines the minimum number of SMRs that must be manufactured to achieve sufficient economies of mass production. For this purpose, Wright’s law expressed as in (8) provides a useful framework for capturing the learning effects. It is particularly relevant to key cost drivers, such as improved labor productivity, standardization, modularization, and accumulated operational experience. The learning rate in (8) quantifies the percentage reduction in cost associated with each doubling of cumulative production. Overall, Wright’s law reflects how costs tend to decline through economics of mass production and continuous process improvements [44].
In (8), is the specific cost (in EUR/kW) of the SMR after the sale of the unit; is the current SMR cost taken as (this cost refers to the NuScale model, which remains at the pilot stage [44,45]); is assumed to be 0.1 as reported in Table VII of [44]. Solving (8) for yields (9):
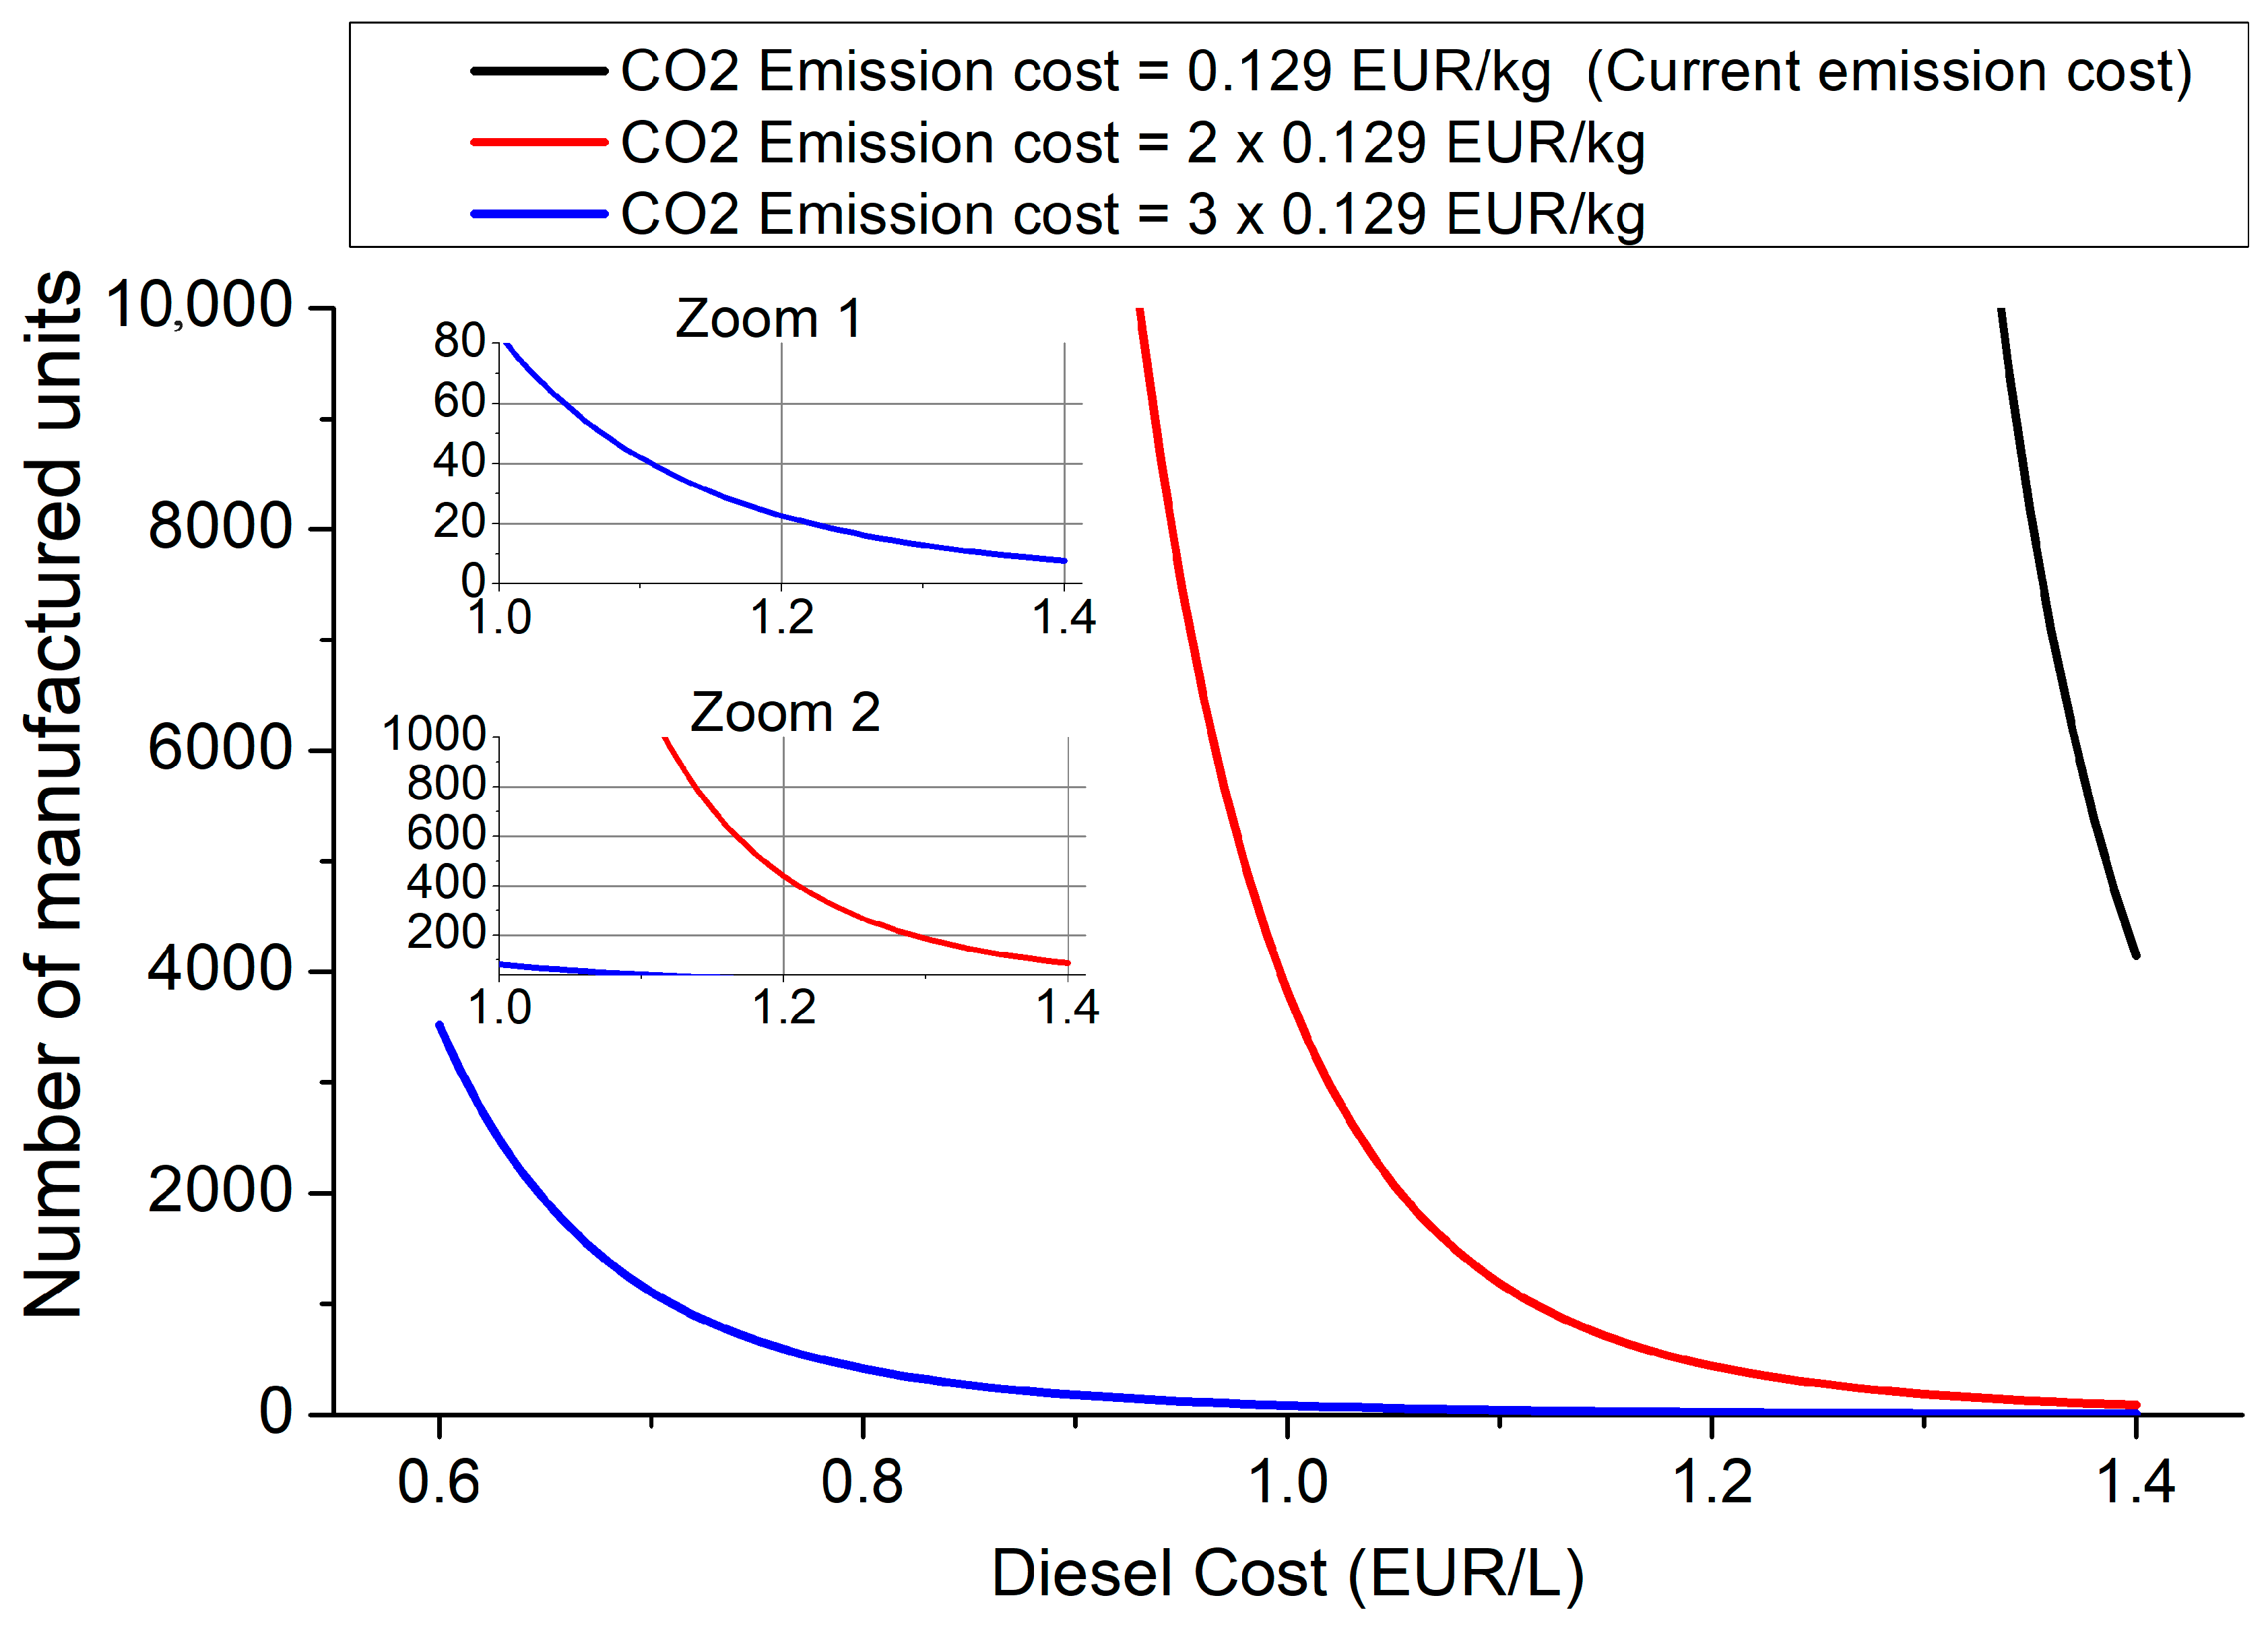
Equation (9) determines the minimum number of NuScale SMR required to achieve a reduction in the CAPEX from to through economies of mass production. Figure 9 is a critical diagram illustrating the number of required NuScale units, n, as a function of diesel cost under three carbon emission cost scenarios. The figure is constructed by setting in (9) equal to the SMR CAPEX values obtained from Figure 8.
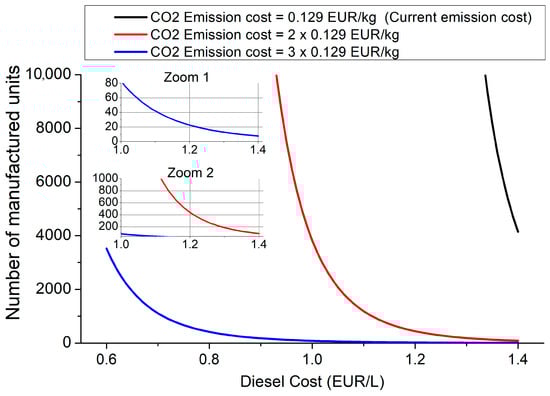
Figure 9.
Minimum number of NuScale SMR units required to achieve economics of mass production (Y-axis) as a function of diesel fuel cost (X-axis), for three different CO2 emissions costs.
As shown, for a carbon emission cost of 0.129 EUR/kg and diesel prices below 1.30 EUR/L, the required number of units tends toward infinity, indicating an economically unfeasible scenario. When the carbon cost increases to 0.258 EUR/kg and diesel prices remain below 0.9 EUR/L, the required number exceeds 10,000 units, which is a rather impossible figure corresponding to a total capacity of 770 GW (based on 77 MW per unit). For comparison, the current global nuclear fleet stands at around 400 GW. Even for carbon cost as high as 0.387 EUR/kg and diesel prices around 0.6 EUR/L (current diesel price), economic feasibility is achieved with 3500 units, corresponding to a huge capacity of approximately 269.5 GW. In contrast, for a carbon cost of 0.387 EUR/kg and diesel prices around 1.00 EUR/L, economic feasibility is achieved with as few as 80 manufactured units (see Zoom 1 in the figure), corresponding to a reasonable capacity of approximately 6.2 GW. In summary, the economic feasibility of SMRs is attainable only if the carbon cost rises to 0.387 EUR/kg and diesel prices exceed 0.70 EUR/L, conditions under which a manageable deployment of fewer than 1000 units (equivalent to 77 GW) is sufficient to achieve economies of mass production.
6. Conclusions and Discussion
This paper presents a techno-economic assessment of liquid hydrogen produced from SMRs for maritime applications. Pink hydrogen emerges as a promising carbon-free alternative for the shipping sector, owing to the zero-emission profile of nuclear power and the dispatchable nature of nuclear reactors. This work contributes by offering a comprehensive analysis of the production and transportation costs of pink hydrogen derived from SMRs, using Greece as a representative case study with broader applicability. A detailed sensitivity analysis is conducted to identify the most influential factors affecting the LCOH. Furthermore, the study evaluates the economic viability of pink hydrogen as a marine fuel by benchmarking it against diesel. Finally, the paper explores policy interventions and technological developments that could reduce LCOH, thereby enhancing the competitiveness of SMR-based hydrogen relatives to fossil-based maritime fuels.
The paper has several key findings, the most important of which are summarized below:
- ✓
- Assuming an average SMR’s CAPEX of 10,000 EUR/MW, the end-user LCOH is as high as 6.64 EUR/kg, which is too high to compete with diesel engines under the current diesel and carbon emission prices.
- ✓
- For a carbon emission cost of 0.129 EUR/kg (the current cost), the number of units required to achieve sufficient economies of mass production grows to infinite, clearly indicating an economically unfeasible scenario for SMRs.
- ✓
- The economic feasibility of SMRs is attainable only if the carbon cost rises to 0.387 EUR/kg and diesel prices exceed 0.70 EUR/L, conditions under which a manageable deployment of fewer than 1000 units (equivalent to 77 GW) is sufficient to achieve economies of mass production.
Although pink hydrogen constitutes a promising alternative for maritime applications, there are various critical issues to be considered. One of the key concerns relates to the siting of SMRs. Greece is the most seismically active country in Europe and ranks sixth globally in terms of seismic hazard [53]. This high level of seismicity raises legitimate safety concerns regarding the deployment of nuclear infrastructure, even with the inherently safer design features of SMRs. It is essential to ensure that location decisions consider seismic risk, particularly when considering long-term operational stability and public safety. In this context, the region of Macedonia (Northern Greece) stands out as a relatively favorable location, as it historically exhibits the lowest seismic hazard compared to other parts of the country [53]. Nonetheless, seismic vulnerability is closely linked to issues of public acceptance, a particularly sensitive matter in countries like Greece, where societal perception of nuclear technology is shaped not only by policy and safety design but also by underlying geological risks. As such, future studies should further investigate these socio-technical constraints, recognizing that public trust and geophysical suitability are equally essential for the successful deployment of SMR-based hydrogen systems.
Regarding spent nuclear fuel (SNF), although it is initially stored onsite in pools or dry casks, its long-term management remains technically and regulatory challenging. Studies show that SMRs, despite their smaller size, produce two to thirty times more high-level waste per unit of electricity than large reactors, due to factors like lower burnup, compact cores, and higher neutron leakage [54]. Greece, which has no commercial nuclear reactors, also lacks infrastructure for managing, storing, or disposing of SNF. The GRR-1 research reactor has been shut down, and current plans involve returning fuel abroad [17]. Thus, introducing SMRs would require entirely new legal, technical, and regulatory frameworks. While Northern Greece (Macedonia) offers geological stability [53], it lacks nuclear infrastructure and trained personnel, necessitating major investments in safety systems, radiation protection, and emergency response. However, the cost of managing SNF is rather low. Technoeconomic studies estimate back-end costs, including storage, transport, and disposal, at 4–6 EUR/MWh of electricity produced [55,56,57]. With typical hydrogen yields of ~20 kg H2/MWh, this results in an added cost of (only) 0.2–0.3 EUR/kg H2 to the LCOH.
Persistent cost overruns and delays in several new SMR projects have raised significant concerns about their near-term viability and investment appeal [58]. Projections suggesting that full commercial deployment may not occur until around 2045 cast doubt on the potential of SMRs to contribute meaningfully to urgent decarbonization efforts. This timeline is misaligned with the EU’s climate objectives, which call for substantial emissions reductions by 2030 and climate neutrality by 2050. Moreover, a fundamental challenge lies in the small size of SMRs, which results in unfavorable economics due to diseconomies of scale [59,60]. The disadvantage of small size can be compensated through the economics of mass production. However, a key barrier is the proliferation of designs, which may hinder the benefit from the economy of mass. Specifically, as of now, there are nearly 70 SMR concepts under development (see Table 2 in [44]). This design fragmentation reduces the likelihood that a single or small group of standardized models will dominate the market or be deployed in a coordinated manner across countries and private entities [58]. The analytics firm Rystad Energy argues that the number of SMR designs reaching the final stage should be limited to no more than 10, to enable sufficient learning and technological refinement for each design.
Converting existing coal-fired power plants into SMR-based facilities could lower capital expenditures by approximately 15% to 35% and maintain local jobs and economic activity in sites currently hosting coal plants [61]. A study finds that around 80% of U.S. coal plants are suitable candidates for hosting nuclear reactors [61]. However, transforming retiring coal plants into nuclear facilities is technically complex, as many existing components may be incompatible with SMR designs or too degraded to reuse, requiring costly upgrades to meet nuclear-grade standards, such as shielding, containment, and cybersecurity. Additional challenges include site remediation, workforce retraining, and community acceptance, all of which can lead to increased capital costs and delay project viability [62].
Finally, concerning liquid hydrogen, although it offers high energy density and is well-suited for long-distance maritime operations, it presents significant technical challenges, such as the need to maintain extremely low temperatures (−253 °C), which demands advanced insulation systems and materials capable of withstanding intense thermal stress [63]. Additionally, fuel cell durability remains a major hurdle, as current lifespans are roughly half that of conventional diesel engines—an issue further exacerbated by the harsh and corrosive maritime environment [64]. Hydrogen internal combustion engines (H2ICEs) offer improved mechanical robustness and greater durability compared to fuel cells, making them potentially more suitable for demanding marine conditions [64]. However, despite being carbon-free, they still produce nitrogen oxides (NOx), which pose environmental concerns and may require the implementation of additional exhaust after-treatment systems to comply with maritime emission regulations.
Author Contributions
Conceptualization, E.E.P.; Methodology, E.E.P. and T.P.; Software, E.E.P. and T.P.; Validation, E.E.P. and T.P.; Formal analysis, E.E.P. and T.P.; Investigation, E.E.P.; Resources, E.E.P.; Writing—original draft, E.E.P. and T.P.; Supervision, E.E.P.; Project administration, E.E.P. All authors have read and agreed to the published version of the manuscript.
Funding
This research received no external funding.
Data Availability Statement
The original contributions presented in this study are included in the article. Further inquiries can be directed to the corresponding author.
Conflicts of Interest
The authors declare no conflict of interest.
References
- Melideo, D.; Desideri, U. The use of hydrogen as alternative fuel for ship propulsion: A case study of full and partial retrofitting of roll-on/roll-off vessels for short distance routes. Int. J. Hydrogen Energy 2024, 50 Pt B, 1045–1055. [Google Scholar] [CrossRef]
- Pompodakis, E.E.; Ahmed, A.; Condaxakis, C.; Orfanoudakis, G.I.; Karapidakis, E.S. Paving the way toward hydrogen mobility: An effective policy to reduce the green hydrogen cost. Int. J. Hydrogen Energy 2025, 100, 417–427. [Google Scholar] [CrossRef]
- Vinoya, C.L.; Ubando, A.T.; Culaba, A.B.; Chen, W.H. State-of-the-Art Review of Small Modular Reactors. Energies 2023, 16, 3224. [Google Scholar] [CrossRef]
- Maio, F.D.; Bani, L.; Zio, E. The Contribution of Small Modular Reactors to the Resilience of Power Supply. J. Nucl. Eng. 2022, 3, 152–162. [Google Scholar] [CrossRef]
- Zhang, Z.; Jiang, J. On load-following operations of small modular reactors. Prog. Nucl. Energy 2024, 173, 105274. [Google Scholar] [CrossRef]
- Poudel, B.; Gokaraju, R. Small Modular Reactor (SMR) Based Hybrid Energy System for Electricity & District Heating. IEEE Trans. Energy Convers. 2021, 36, 2794–2802. [Google Scholar]
- Kim, J.Y.; Seo, J.H.; Bang, I.C. Carbon neutrality strategy with small modular reactor-based hybrid energy system: A case study for a small Island and isolated power grid. Energy Convers. Manag. 2024, 301, 118041. [Google Scholar] [CrossRef]
- Zhang, T. Techno-economic analysis of a nuclear-wind hybrid system with hydrogen storage. J. Energy Storage 2022, 46, 103807. [Google Scholar] [CrossRef]
- Arcos, J.M.M.; Santos, D.M.F. The Hydrogen Color Spectrum: Techno-Economic Analysis of the Available Technologies for Hydrogen Production. Gases 2023, 3, 25–46. [Google Scholar] [CrossRef]
- Ayon, A.S.; Alif, A.R.; Nasim, A.S.M. A Review and Analysis of Nuclear Hydrogen Production in Generation IV Reactors. Int. J. Nucl. Secur. 2024, 9, 1. [Google Scholar] [CrossRef]
- Alabbadi, A.A.; Obaid, O.A.; AlZahrani, A.A. A comparative economic study of nuclear hydrogen production, storage, and transportation. Int. J. Hydrogen Energy 2024, 54, 849–863. [Google Scholar] [CrossRef]
- Ramana, M.V. Available online: https://www.utilitydive.com/news/nuscale-uamps-project-small-modular-reactor-ramanasmr-/705717/ (accessed on 7 June 2025).
- Mignacca, B.; Locatelli, G. Economics and finance of Small Modular Reactors: A systematic review and research agenda. Renew. Sustain. Energy Rev. 2020, 118, 109519. [Google Scholar] [CrossRef]
- WWF. Available online: https://www.wwfmmi.org/medtrends/shifting_blue_economies/maritime_traffic/ (accessed on 14 June 2025).
- Jin, I.J.; Bang, I.C. The time for revolutionizing small modular reactors: Cost reduction strategies from innovations in operation and maintenance. Prog. Nucl. Energy 2024, 174, 105288. [Google Scholar] [CrossRef]
- Baumhof, M.T.; Raheli, E.; Johnsen, A.G.; Kazempour, J. Optimization of Hybrid Power Plants: When Is a Detailed Electrolyzer Model Necessary? In Proceedings of 2023 IEEE PowerTech Conference, Belgrade, Serbia, 25–29 June 2023.
- International Atomic Energy Agency. Nuclear Power Reactors in the World, Reference Data Series No.2; IAEA: Vienna, Austria, 2020. [Google Scholar]
- NuScale Power. NuScale 2023 Analyst Day Presentation; U.S. Securities and Exchange Commission: Washington, DC, USA, 2023. [Google Scholar]
- Simoglou, C.K.; Kaissas, I.M.; Biskas, P.N. Assessing the Implications of Integrating Small Modular Reactors in Modern Power Systems. Energies 2025, 18, 2578. [Google Scholar] [CrossRef]
- Reuß, M.; Grube, T.; Robinius, M.; Preuster, P.; Wasserscheid, P.; Stolten, D. Seasonal storage and alternative carriers: A flexible hydrogen supply chain model. Appl. Energy 2017, 200, 290–302. [Google Scholar] [CrossRef]
- Papoutsa, A.; Vasilatos, C. The REE-Zr-U-Th Minerals of the Maronia Monzodiorite, N. Greece: Implications on the Saturation and Segregation Mechanisms of Critical Metals in Intermidiate-Mafic Compositions. Minerals 2023, 13, 1256. [Google Scholar]
- Tsikos, H.; Tzifas, I.T.; Papadopoulos, A. The Potential of REE and Associated Critical Metals in Coastal Sand (Placer) Deposits of Greece: A Review. Minerals 2019, 9, 469. [Google Scholar] [CrossRef]
- Yao, J.; Li, G. A Review of In Situ Leaching (ISL) for Uranium Mining. Mining 2024, 4, 120–148. [Google Scholar] [CrossRef]
- International Atomic Energy Agency. Ensuring Safe and Secure Passage for the Nuclear Industry’s Vital Natural Resource. Available online: https://www.iaea.org/newscenter/news/ensuring-safe-and-secure-passage-for-the-nuclear-industrys-vital-natural-resource (accessed on 19 June 2025).
- Gao, R.X.; Youn, S.R.; Ko, W.I.; Kim, S.K. Nuclear fuel cycle cost estimation and sensitivity analysis of unit costs on the basis of an equilibrium model. Nucl. Eng. Technol. 2015, 47, 306–314. [Google Scholar]
- World Nuclear Association. Available online: https://world-nuclear.org/information-library/nuclear-fuel-cycle/introduction/nuclear-fuel-cycle-overview (accessed on 2 June 2025).
- Palacios, J.C.; Alonso, G.; Ramirez, R.; Gomez, A.; Ortiz, J.; Longoria, L.C. Levelized Costs for Nuclear, Gas and Coal for Electricity, Under the Mexican Scenario. In Proceedings of the Americas Nuclear Energy Symposium (ANES 2004), Miami, FL, USA, 3–6 October 2004. [Google Scholar]
- Huang, G.; Huang, Y.; Ali, A.; Chen, Z.; Shen, P.K.; Ni, B.J.; Zhu, J. Phase-controllable cobalt phosphide heterostructure for efficient electrocatalytic hydrogen evolution in water and seawater. Electron 2024, 2, e58. [Google Scholar] [CrossRef]
- International Atomic Energy Agency. Maintenance, Testing, Surveillance and Inspection in Nuclear Power Plants; IAEA Safety Standards Series No. SSG-74; IAEA: Vienna, Austria, 2022. [Google Scholar]
- Pashchenko, D. Green hydrogen as a power plant fuel: What is energy efficiency from production to utilization? Renew. Energy 2024, 223, 120033. [Google Scholar] [CrossRef]
- Sofranko, M.; Khouri, S.; Vegsoova, O.; Kacmary, P.; Mudarri, T.; Koncek, M.; Tyulenev, M.; Simkova, Z. Possibilities of Uranium Deposit Kuriskova Mining and Its Influence on the Energy Potential of Slovakia from Own Resources. Energies 2020, 13, 4209. [Google Scholar] [CrossRef]
- IEA. The Future of Hydrogen; IEA: Paris, France, 2019; Available online: https://www.iea.org/reports/the-future-of-hydrogen#overview (accessed on 14 June 2025).
- Jannelli, E.; Di Micco, S.; Forcina, A.; Perna, A.; Minutillo, M. Analyzing the levelized cost of hydrogen in refueling stations with on-site hydrogen production via water electrolysis in the Italian scenario. Int. J. Hydrogen Energy 2021, 46, 13667–13677. [Google Scholar]
- Ahmed, A.; Pompodakis, E.E.; Katsigiannis, Y.; Karapidakis, E.S. Optimizing the installation of a Centralized Green Hydrogen Production Facility in the Island of Crete, Greece. Energies 2024, 17, 1924. [Google Scholar] [CrossRef]
- Pompodakis, E.E.; Kryonidis, G.C.; Karapidakis, E.S. Optimizing the installation of hybrid power plants in non-interconnected islands. J. Energy Storage 2023, 74 Pt B, 109511. [Google Scholar] [CrossRef]
- Arif, A.F.M.; Brandl, P. Assessing the viability of non-light water reactor concepts for electricity and heat generation in decarbonized energy systems. arXiv 2024, arXiv:2412.15083. [Google Scholar]
- Asuega, A.; Limb, B.J.; Quinn, J.C. Techno-economic analysis of advanced small modular nuclear reactors. Appl. Energy 2023, 334, 120669. [Google Scholar] [CrossRef]
- Feinstein, D. Eye-Popping New Cost Estimates Released for NuScale Small Modular Reactor; Institute for Energy Economics and Financial Analysis (IEEFA): Victoria, Australia, 2023. [Google Scholar]
- Pompodakis, E.E.; Karapidakis, E.s.; Katsigiannis, G.; Orfanoudakis, G.I. Hydrogen Production from Wave Power Farms to Refuel Hydrogen-Powered Ships in the Mediterranean Sea. Hydrogen 2024, 5, 494–518. [Google Scholar] [CrossRef]
- Holst, M.; Aschbrenner, S.; Smolinka, T.; Voglstatter, C.; Grimm, G. Cost Forecast for Low Temperature Electrolysis—Technology Driven Bottom-Up Prognosis for Pem and Alkaline Water Electrolysis Systems, a Cost Analysis Study on Behalf of Clean Air Task Force; Fraunhofer Institute for Solar Energy Systems ISE: Freiburg, Germany, 2021; p. 79. [Google Scholar]
- Mäkelä, M.; Niemi, S.; Nuortila, C.; Nyystilä, L. Applicability of Hydrogen Fuel for a Cruise Ship. Clean Technol. 2025, 7, 6. [Google Scholar] [CrossRef]
- Barckholtz, T.; Burgunder, A.; Casey, D.; Dillich, S.; Elgowainy, A.; Merritt, J.; Parks, G.; Pawel, S.; Simnick, J.; Soto, H. Hydrogen Delivery Technical Team Roadmap, U.S.D. Partnership, Editor. 2013. Available online: https://www.energy.gov/eere/fuelcells/articles/hydrogen-delivery-roadmap, (accessed on 28 June 2025).
- Morales-Ospino, R.; Celzard, A.; Fierro, V. Strategies to recover and minimize boil-off losses during liquid hydrogen storage. Renew. Sustain. Energy Rev. 2023, 182, 113360. [Google Scholar] [CrossRef]
- Nøland, J.K.; Hjelmeland, M.N.; Hartmann, C.; Tjernberg, L.B.; Korpås, M. Overview of Small Modular and Advanced Nuclear Reactors and Their Role in the Energy Transition. IEEE Trans. Energy Convers. 2025, 1–12. [Google Scholar] [CrossRef]
- Institute for Energy Economics and Financial Analysis, Eye-Popping New Cost Estimates Released for NuScale Small Modular Reactor. Available online: https://ieefa.org/resources/eye-popping-new-cost-estimates-released-nuscale-small-modular-reactor (accessed on 14 June 2025).
- European Commission (EC). Document 52021PC0551, Proposal for a DIRECTIVE OF THE EUROPEAN PARLIAMENT AND OF THE COUNCIL Amending Directive 2003/87/EC Establishing a System for Greenhouse Gas Emission Allowance Trading Within the Union, Decision (EU) 2015/1814 Concerning the Establishment and Operation of a Market Stability Reserve for the Union Greenhouse Gas Emission Trading Scheme and Regulation (EU) 2015/757; European Commission (EC): Brussels, Belgium, 2021. [Google Scholar]
- VLSO Price. Available online: https://www.statista.com/statistics/1109263/monthly-vlsfo-bunker-price-worldwide/ (accessed on 16 July 2024).
- Bui, K.Q.; Perera, L.P.; Emblemsvåg, J. Life-cycle cost analysis of an innovative marine dual-fuel engine under uncertainties. J. Clean. Prod. 2022, 380 Pt 2, 134847. [Google Scholar] [CrossRef]
- Perna, A.; Jannelli, E.; Di Micco, S.; Romano, F.; Minutillo, M. Designing, sizing and economic feasibility of a green hydrogen supply chain for maritime transportation. Energy Convers. Manag. 2023, 278, 116702. [Google Scholar] [CrossRef]
- Bloomberg NEF, Europe’s New Emissions Trading System Expected to Have World’s Highest Carbon Price in 2030 at €149. Available online: https://shorturl.at/YG559 (accessed on 10 June 2025).
- Wu, P.; Wu, P.; Bucknall, R. Marine propulsion using battery power. In Proceedings of the Shipping in Changing Climates Conference 2016, Newcastle, UK, 10–11 November 2016. [Google Scholar]
- Temiz, M.; Dincer, I. Techno-economic analysis of green hydrogen ferries with a floating photovoltaic based marine fueling station. Energy Convers. Manag. 2021, 247, 114760. [Google Scholar] [CrossRef]
- Tsapanos, T. Seismicity and Seismic Hazard Assessment in Greece. In Earthquake Monitoring and Seismic Hazard Mitigation in Balkan Countries; Springer: Dordrecht, The Netherlands, 2008. [Google Scholar] [CrossRef]
- Krall, L.M.; Macfarlane, A.M.; Ewing, R.C. Nuclear waste from small modular reactors. Proc. Natl. Acad. Sci. USA 2022, 119, e2111833119. [Google Scholar] [CrossRef] [PubMed]
- World Nuclear Association. Economics of Nuclear Power. Available online: https://shorturl.at/EA2EW (accessed on 6 July 2025).
- Hall, M.; Corradini, M.; Pawel, R. Technoeconomic Analysis of Small Modular Reactors for Hydrogen Production; U.S. Department of Energy Office of Scientific and Technical Information (OSTI): Oak Ridge, TN, USA, 2022; Report No. 2338209. [Google Scholar]
- Ganda, F.; Dixon, B.; Wigeland, R.; Taiwo, T.; Todosow, M. Economic Analysis of Complex Nuclear Fuel Cycles with NE-COST. Nucl. Technol. 2016, 193, 219–233. [Google Scholar] [CrossRef]
- Ramana, M.V. Small Modular and Advanced Nuclear Reactors: A Reality Check. IEEE Access 2021, 9, 42090–42099. [Google Scholar] [CrossRef]
- Abdulla, A.; Azevedo, I.L.; Morgan, M.G. Expert assessments of the cost of light water small modular reactors. Proc. Natl. Acad. Sci. USA 2013, 110, 9686–9691. [Google Scholar] [CrossRef]
- Anadón, L.D.; Bosetti, V.; Bunn, M.; Catenacci, M.; Lee, A. Expert judgments about RD&D and the future of nuclear energy. Environ. Sci. Technol. 2012, 46, 11497–11504. [Google Scholar]
- Hansen, J.K.; Jenson, W.D.; Wrobel, A.M.; Stauff, N.; Biegel, K.; Kim, T.K.; Belles, R.; Omitaomu, F. Investigating Benefits and Challenges of Converting Retiring Coal Plants into Nuclear Plants; Idaho National Laboratory (INL): Idaho Falls, ID, USA, 2022. [Google Scholar] [CrossRef]
- Cothron, E. Resources for Coal Repowering with Nuclear Energy; Nuclear Innovation Alliance: Washington, DC, USA, 2023; Available online: https://nuclearinnovationalliance.org/resources-coal-repowering-nuclear-energy (accessed on 7 June 2025).
- Zhou, Z.; Tao, J. Hydrogen-powered vessels in green maritime decarbonization: Policy drivers, technological frontiers and challenges. Front. Mar. Sci. 2025, 12, 1601617. [Google Scholar] [CrossRef]
- Ventayol, A.A.; Lam, J.S.L.; Bai, X.; Chen, Z.S. Comparative life cycle assessment of hydrogen internal combustion engine and fuel cells in shipping. Int. J. Hydrogen Energy 2025, 109, 774–788. [Google Scholar] [CrossRef]


Disclaimer/Publisher’s Note: The statements, opinions and data contained in all publications are solely those of the individual author(s) and contributor(s) and not of MDPI and/or the editor(s). MDPI and/or the editor(s) disclaim responsibility for any injury to people or property resulting from any ideas, methods, instructions or products referred to in the content. |
© 2025 by the authors. Licensee MDPI, Basel, Switzerland. This article is an open access article distributed under the terms and conditions of the Creative Commons Attribution (CC BY) license (https://creativecommons.org/licenses/by/4.0/).