
Substituting Natural Gas with Hydrogen for Thermal Application in a Hard-to-Abate Industry: A Real Case Study


Abstract
1. Introduction
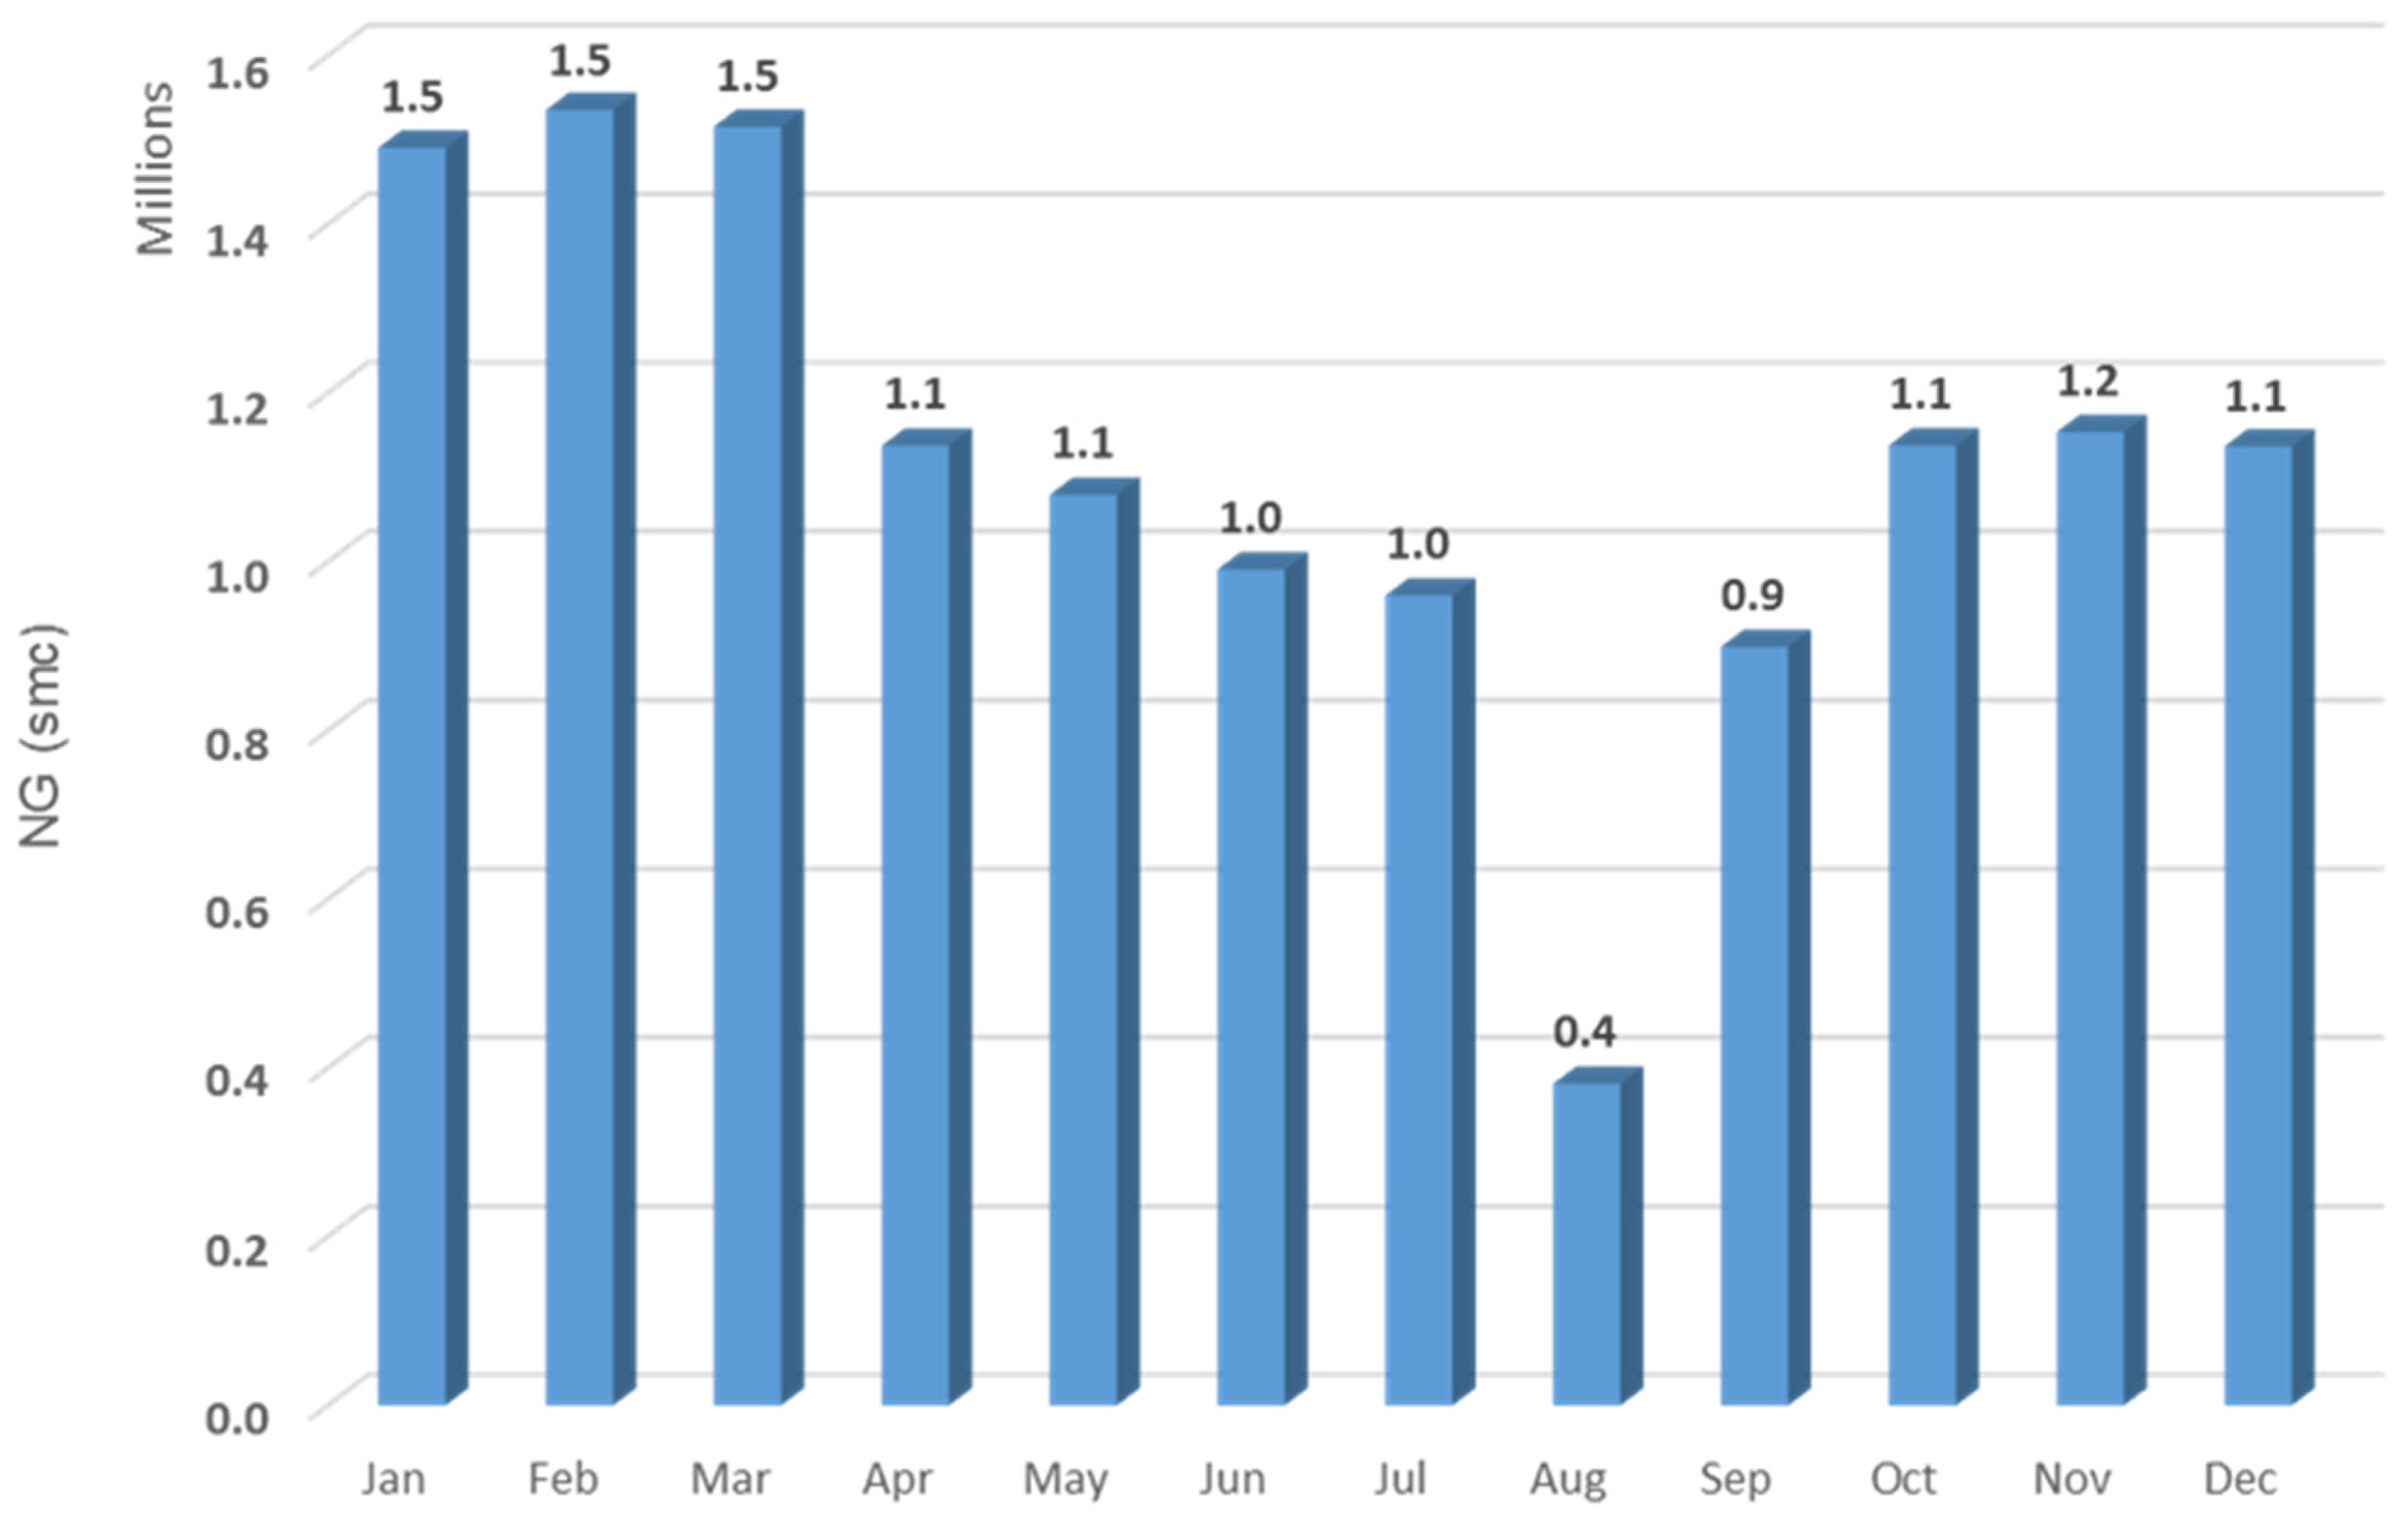
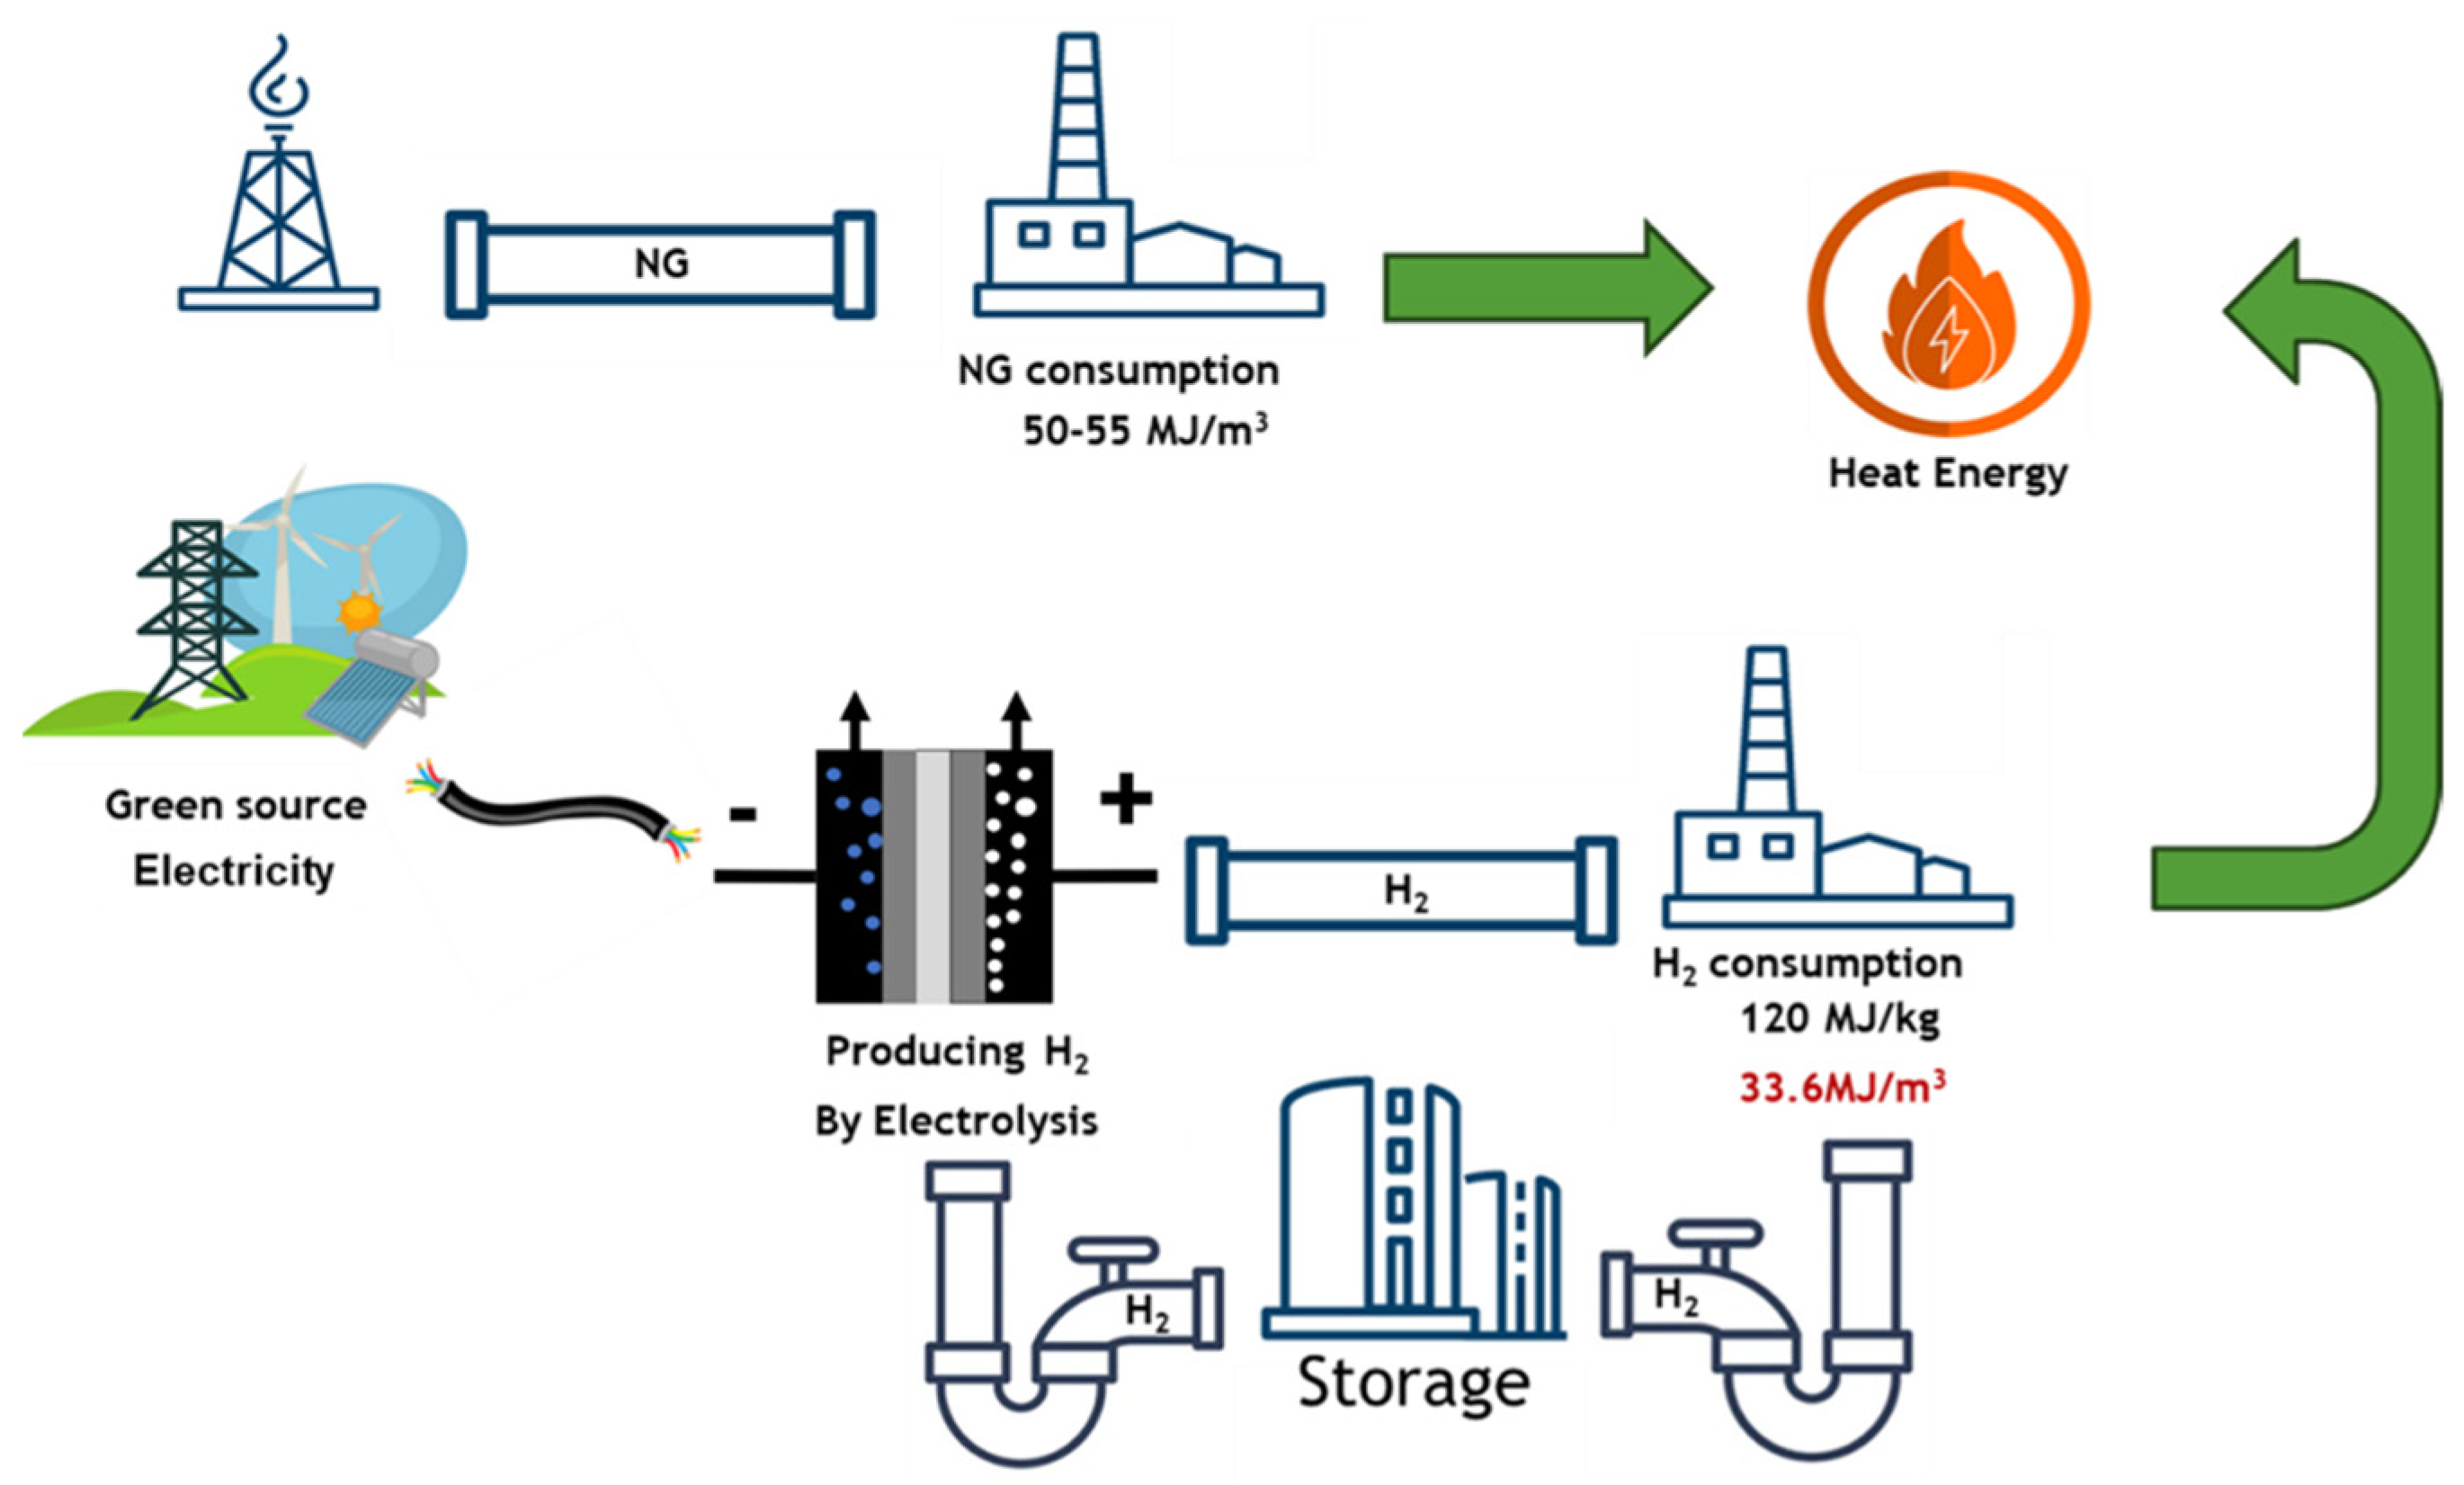
2. Methods
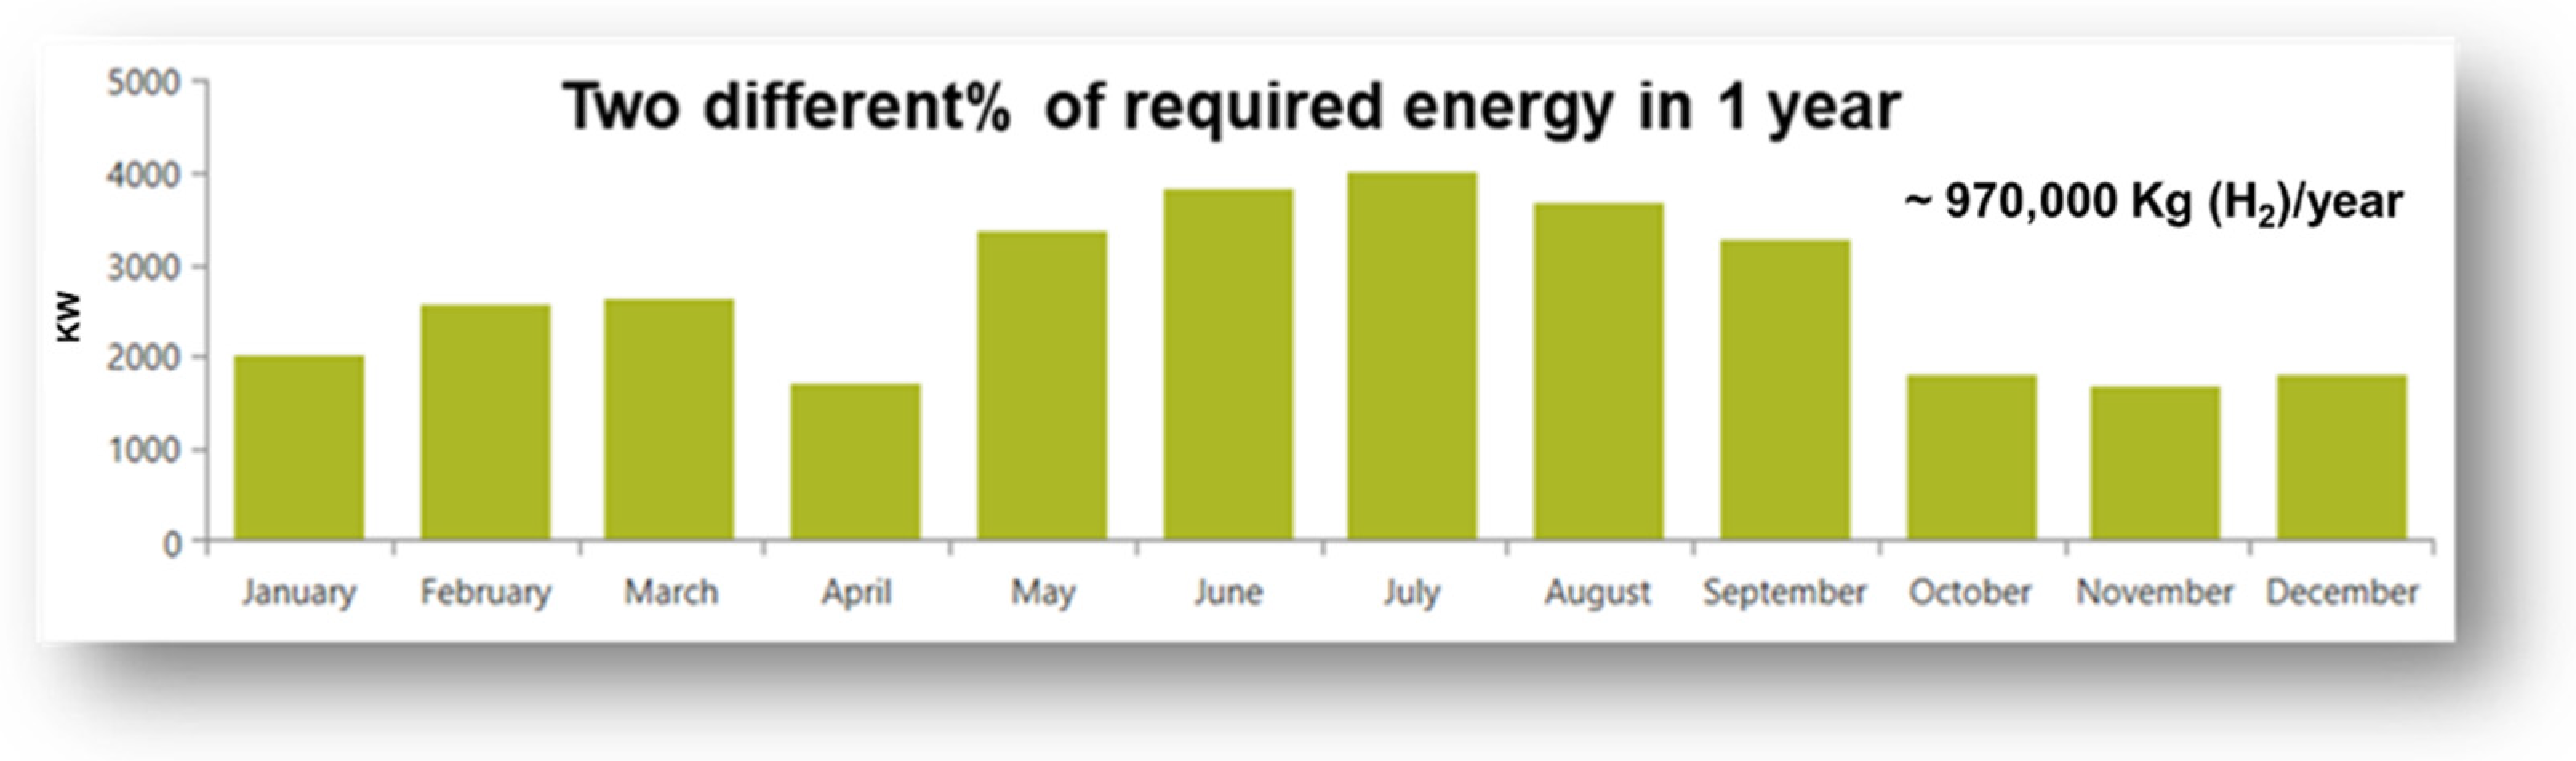
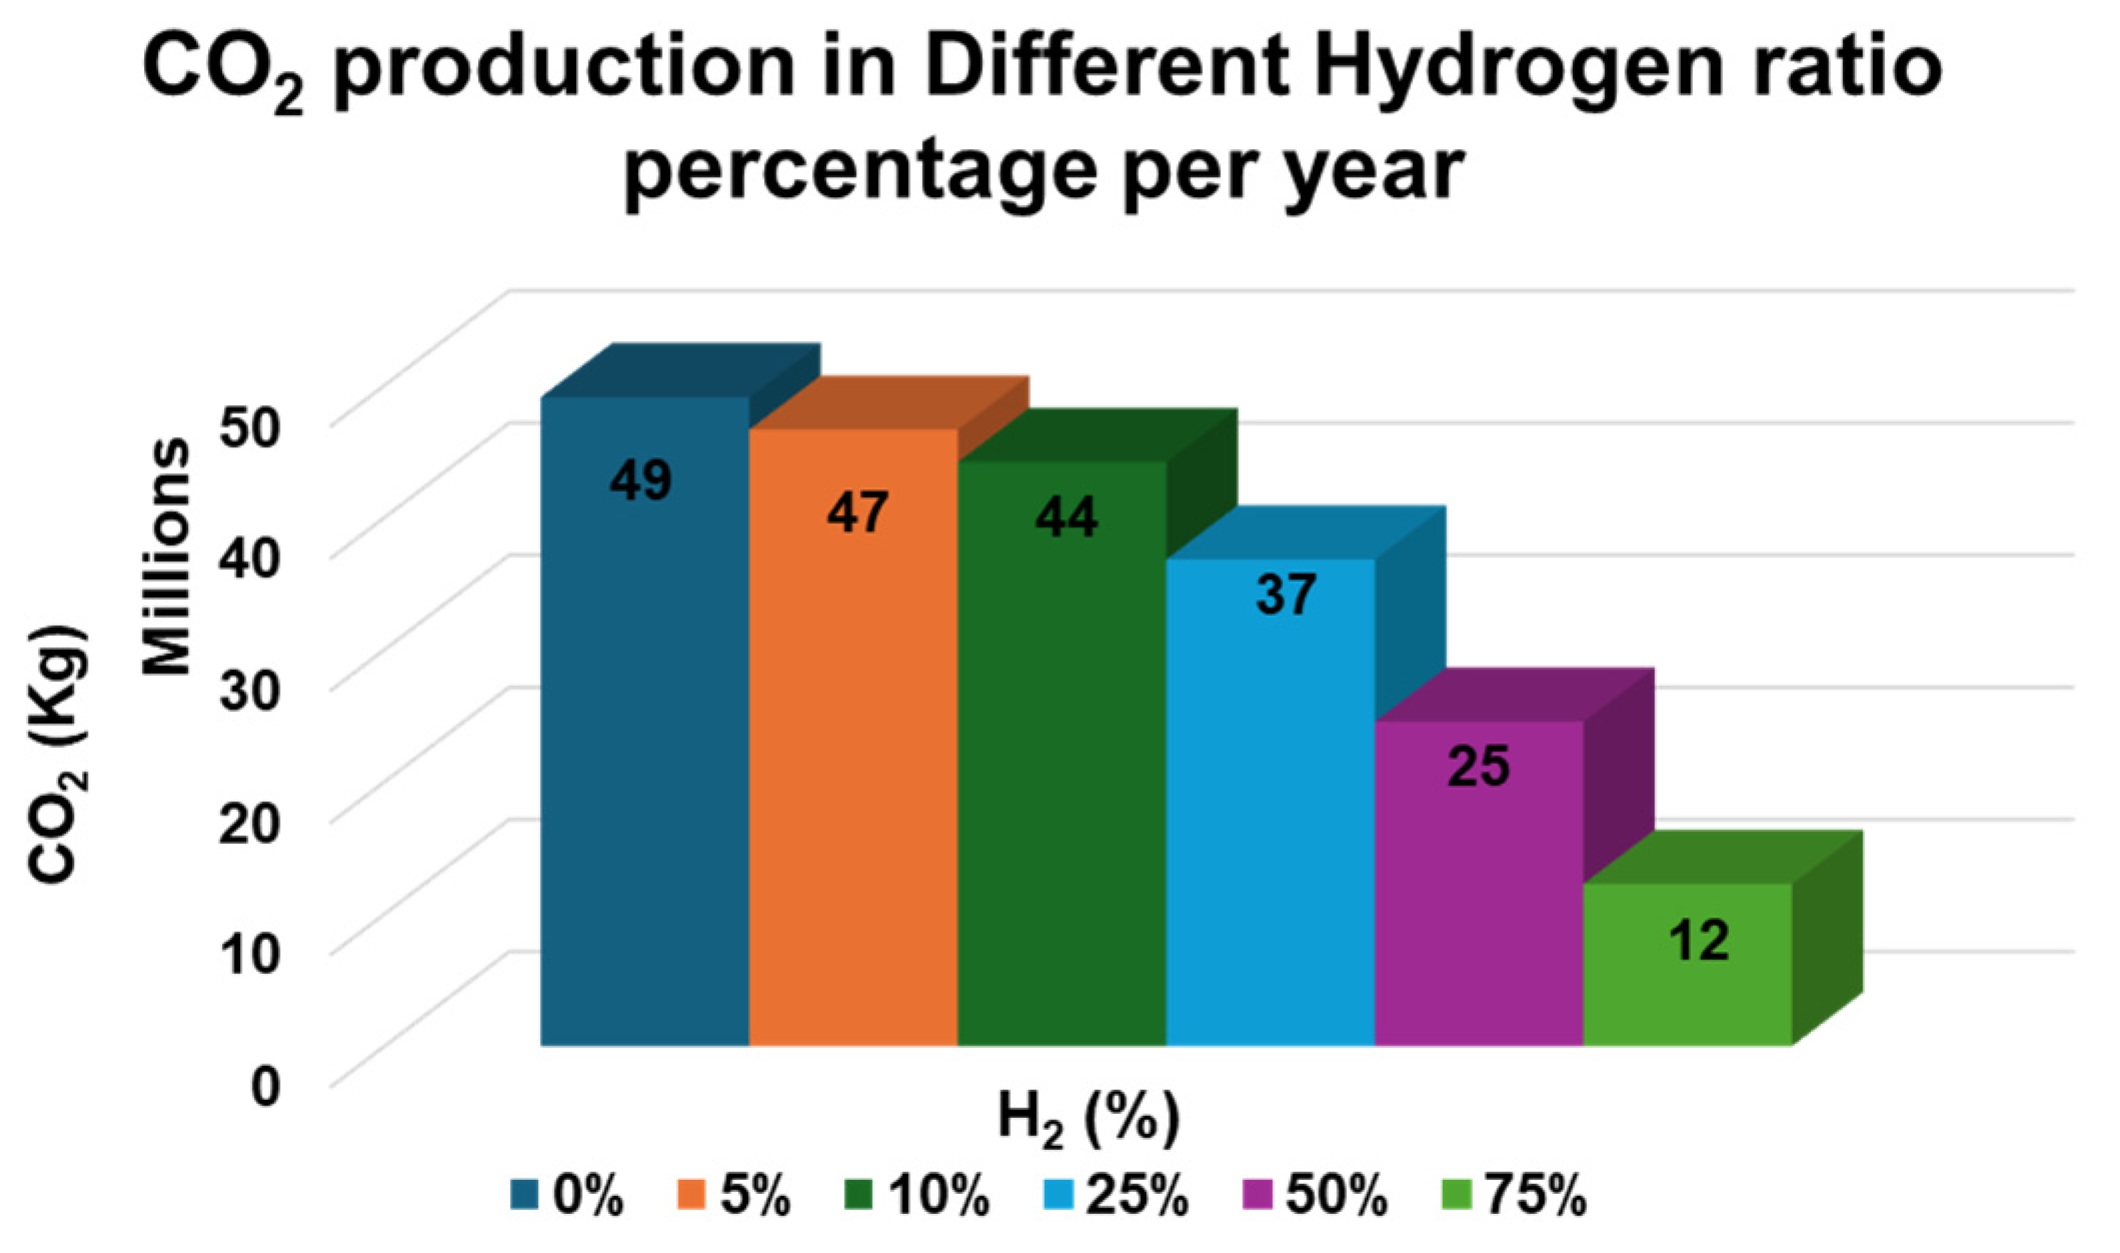
3. Results
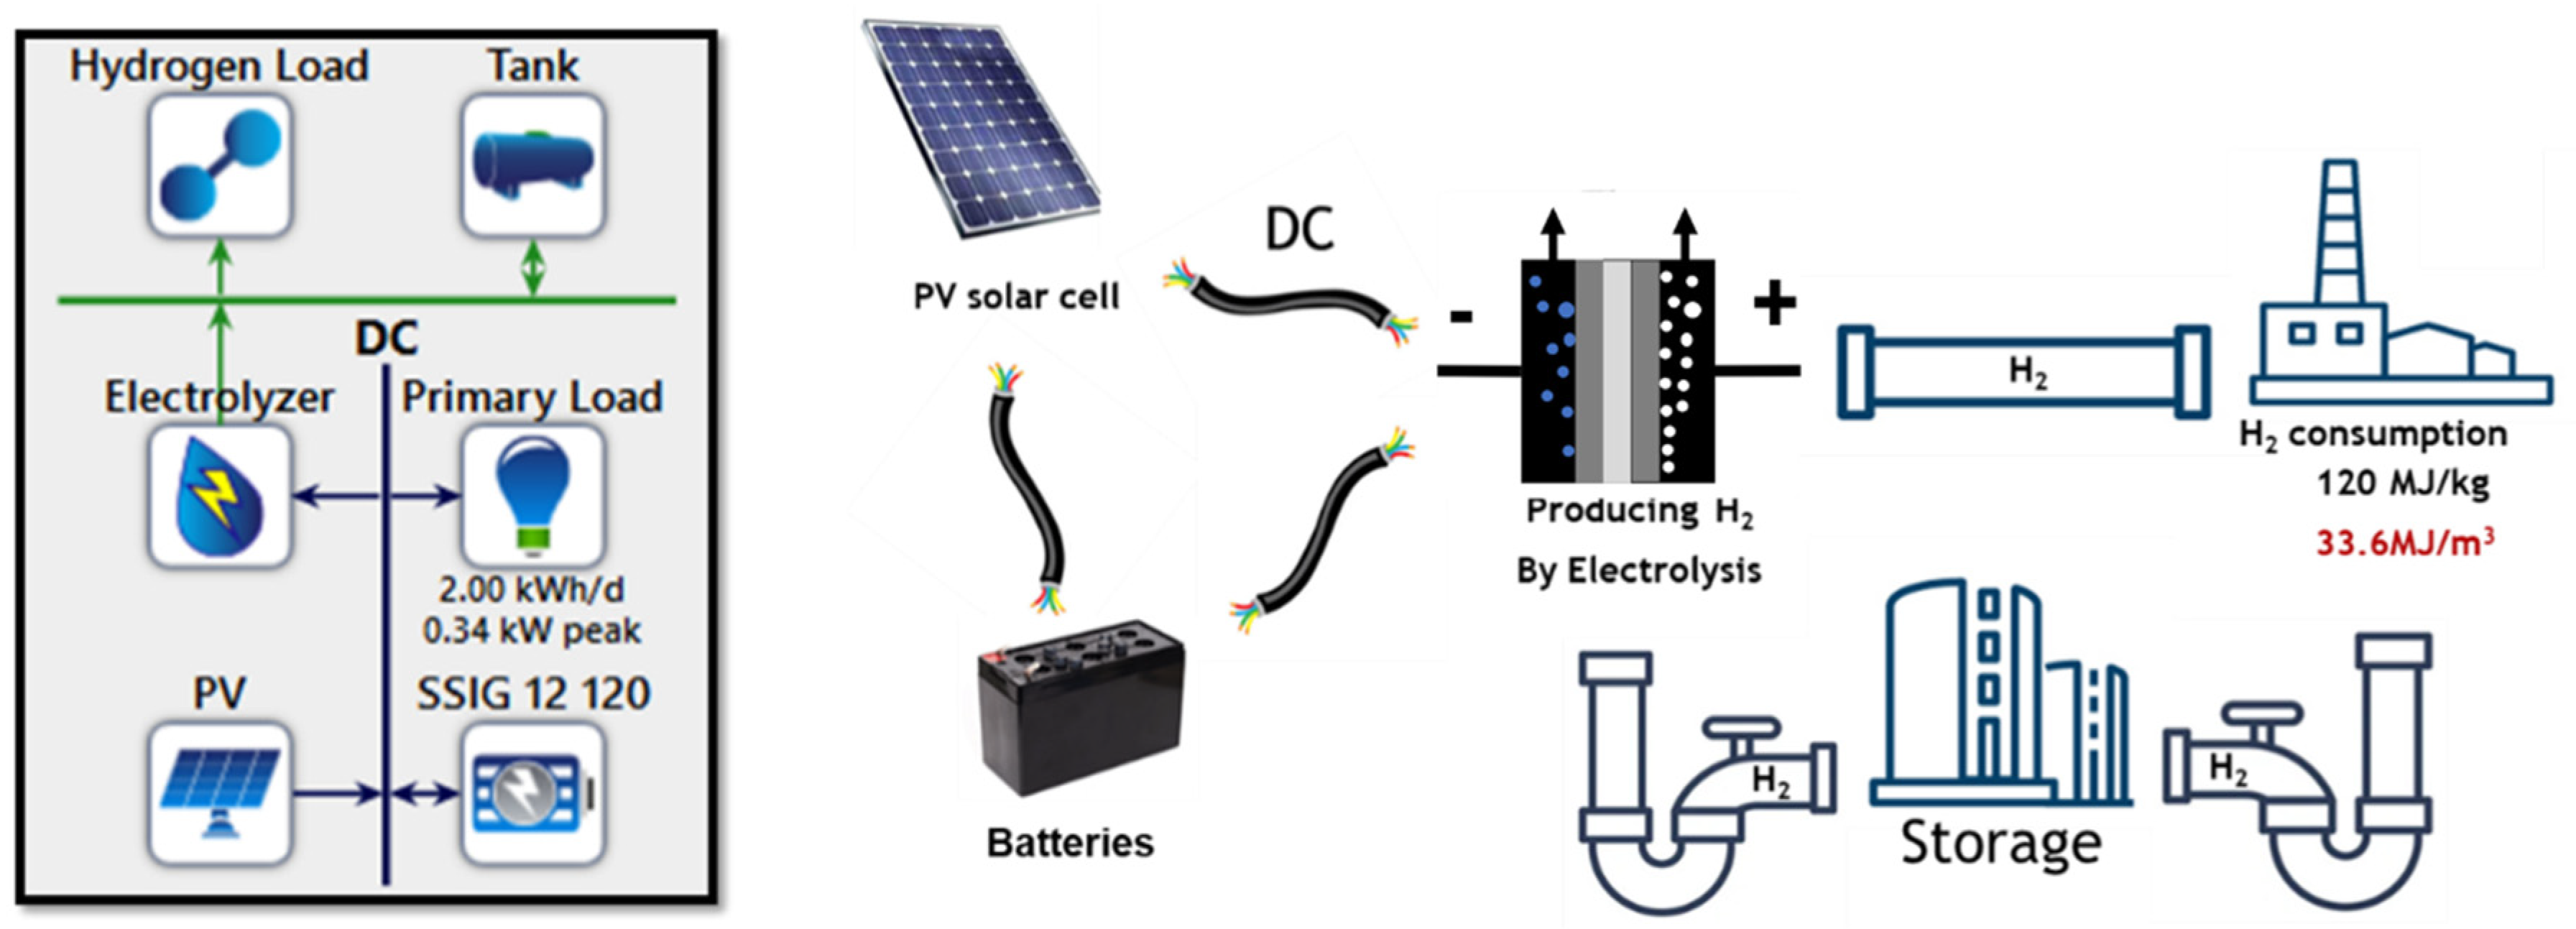
3.1. First Scenario—Using PV as an Electricity Resource
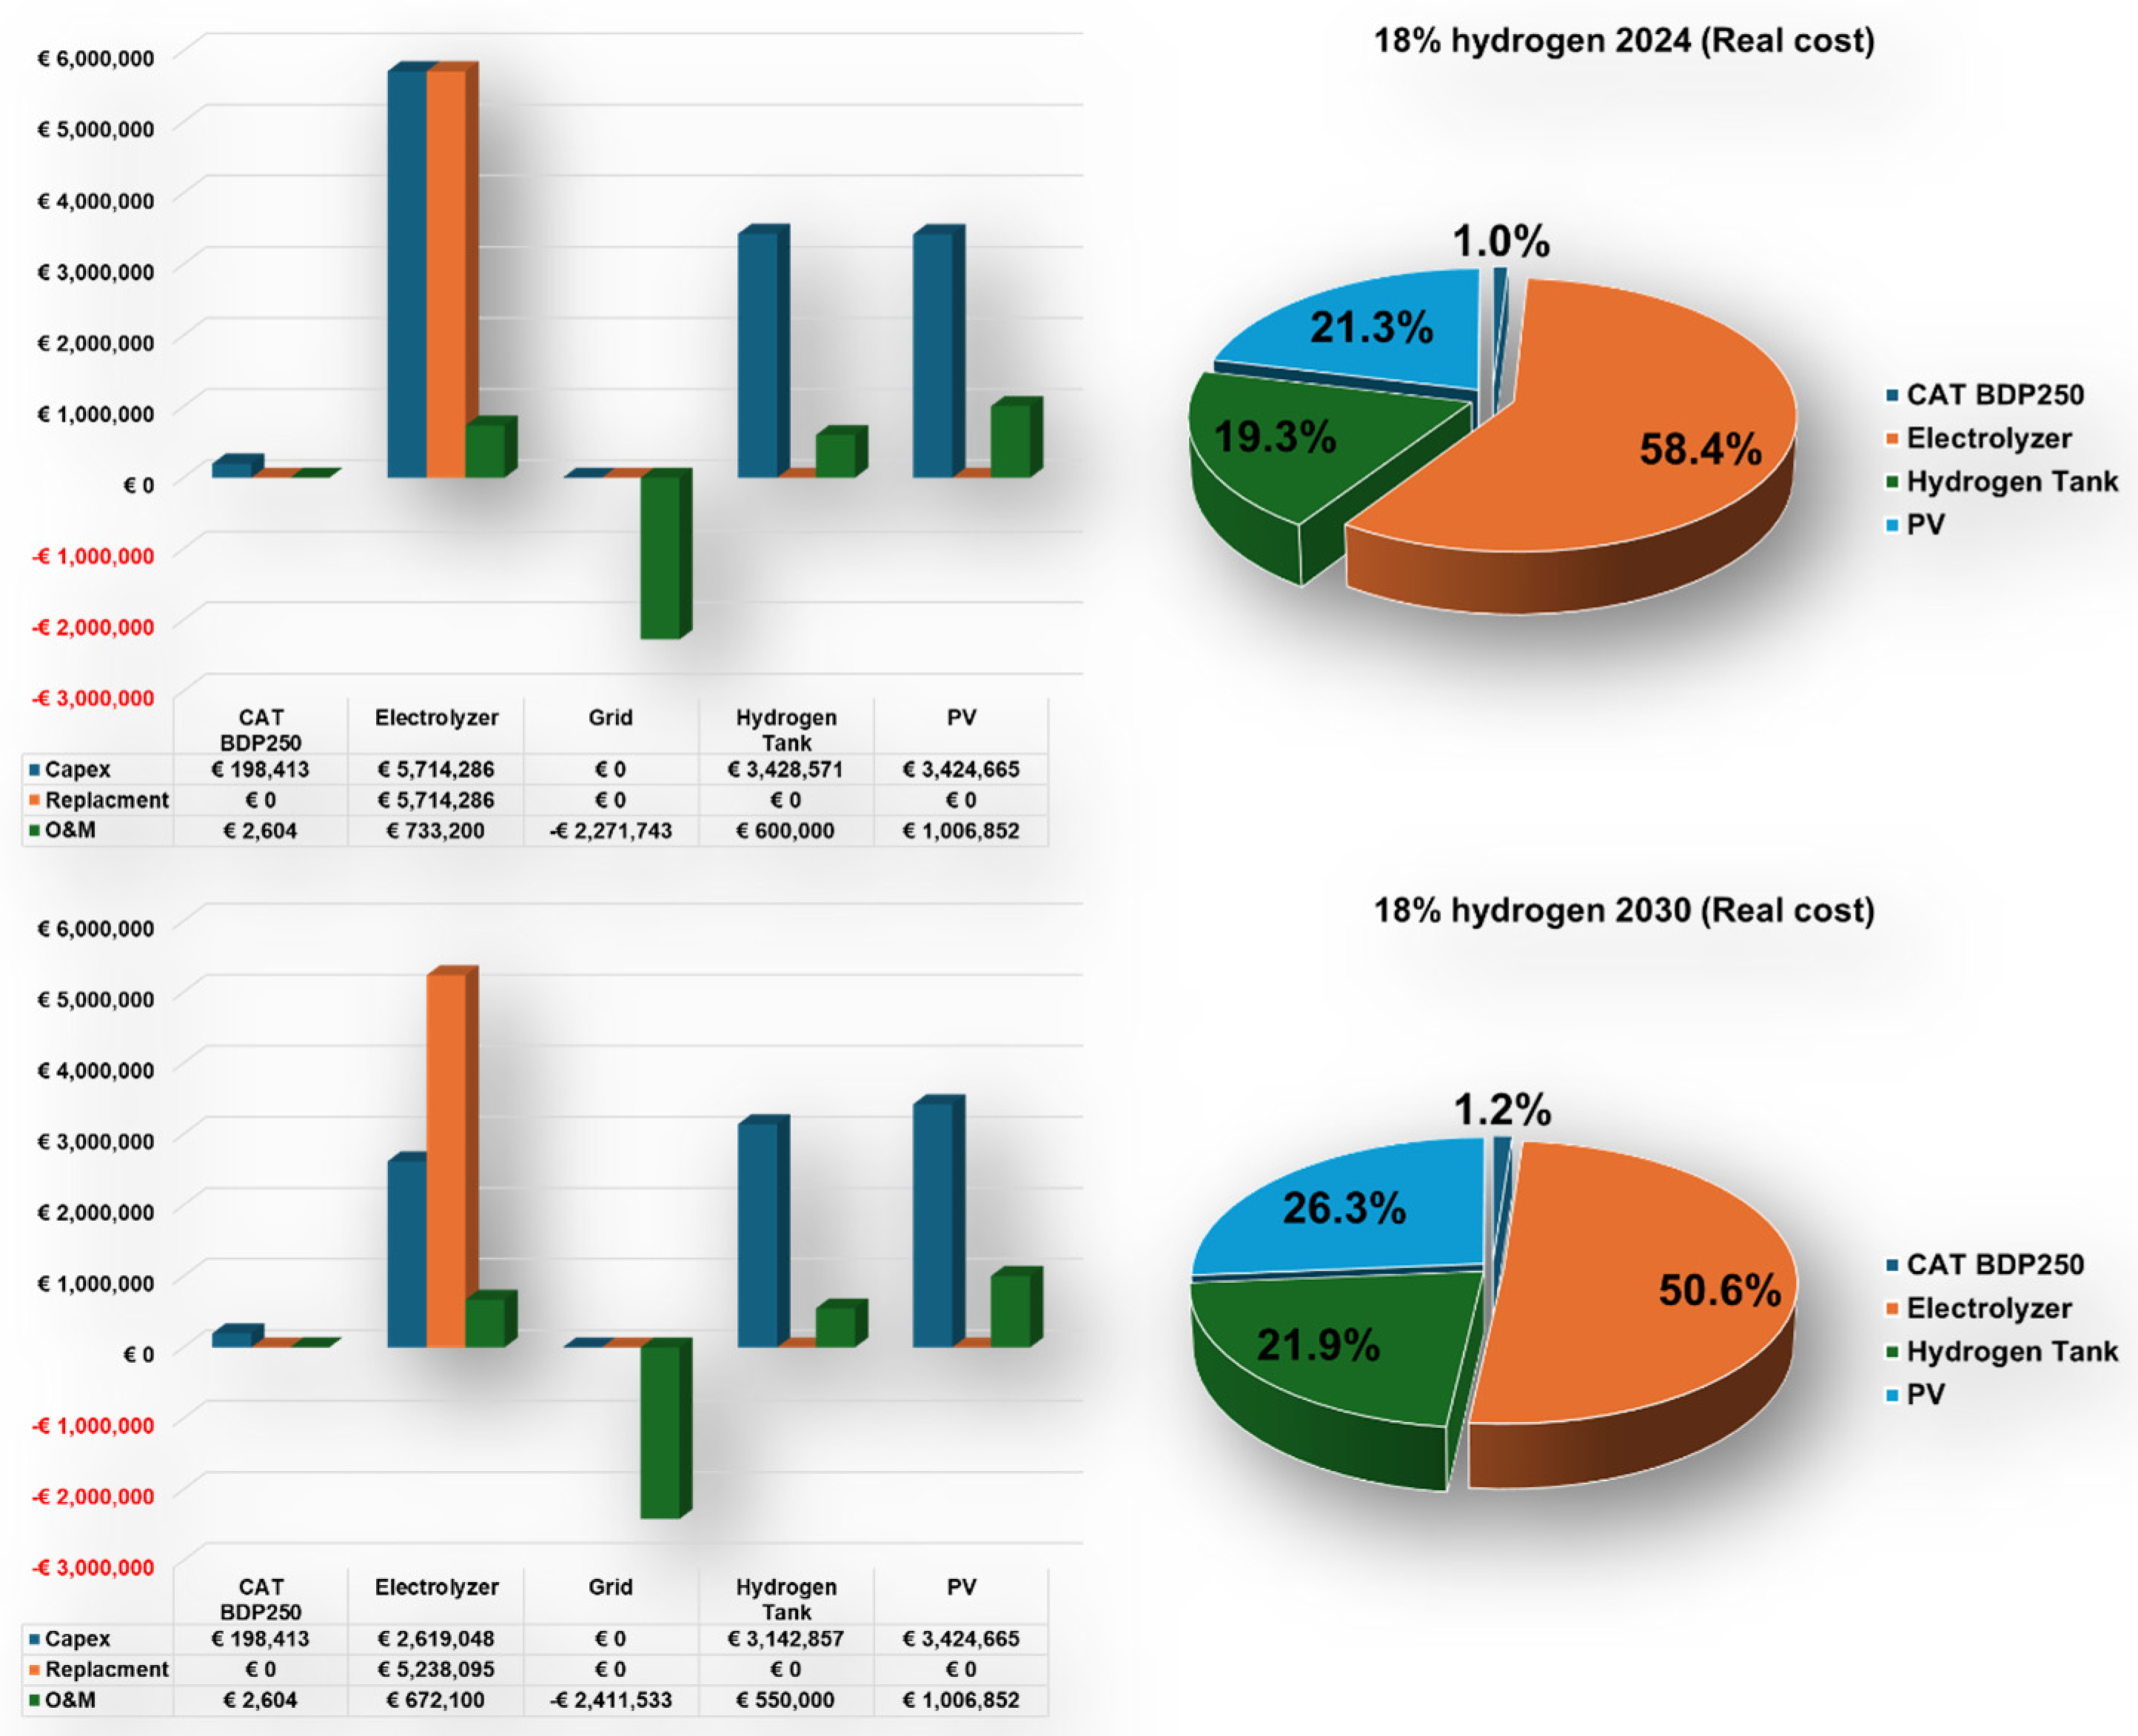
3.2. Reducing the Costs (Second Scenario)
4. Outlook
5. Conclusions
Author Contributions
Funding
Data Availability Statement
Acknowledgments
Conflicts of Interest
References
- Global Energy Review: CO2 Emissions in 2021—Analysis. IEA. 2022. Available online: https://www.iea.org/reports/global-energy-review-co2-emissions-in-2021-2 (accessed on 2 November 2024).
- Onn, C.C.; Chai, C.; Abd Rashid, A.F.; Karim, M.R.; Yusoff, S. Vehicle electrification in a developing country: Status and issue, from a well-to-wheel perspective. Transp. Res. Part Transp. Environ. 2017, 50, 192–201. [Google Scholar] [CrossRef]
- Alabi, T.M.; Agbajor, F.D.; Yang, Z.; Lu, L.; Ogungbile, A.J. Strategic potential of multi-energy system towards carbon neutrality: A forward-looking overview. Energy Built Environ. 2023, 4, 689–708. [Google Scholar] [CrossRef]
- Renewables 2019—Analysis. IEA. 2019. Available online: https://www.iea.org/reports/renewables-2019 (accessed on 2 November 2024).
- Burke, K. 4.02—Current Perspective on Hydrogen and Fuel Cells. In Comprehensive Renewable Energy; Sayigh, A., Ed.; Elsevier: Oxford, UK, 2012; pp. 29–63. [Google Scholar]
- Carey, E.; Yang, X. From Paris to Glasgow and beyond: What future for clean energy technology deployment under Article 6? In A Research Agenda for Energy Politics; Edward Elgar Publishing: Cheltenham, UK, 2023; pp. 127–154. [Google Scholar]
- Wennersten, R.; Sun, Q.; Li, H. The future potential for Carbon Capture and Storage in climate change mitigation—An overview from perspectives of technology, economy and risk. J. Clean. Prod. 2015, 103, 724–736. [Google Scholar] [CrossRef]
- Rubin, E.S.; Zhai, H. The Cost of Carbon Capture and Storage for Natural Gas Combined Cycle Power Plants. Environ. Sci. Technol. 2012, 46, 3076–3084. [Google Scholar] [CrossRef]
- Damen, K.; van Troost, M.; Faaij, A.; Turkenburg, W. A comparison of electricity and hydrogen production systems with CO2 capture and storage—Part B: Chain analysis of promising CCS options. Prog. Energy Combust. Sci. 2007, 33, 580–609. [Google Scholar] [CrossRef]
- María Villarreal Vives, A.; Wang, R.; Roy, S.; Smallbone, A. Techno-economic analysis of large-scale green hydrogen production and storage. Appl. Energy 2023, 346, 121333. [Google Scholar] [CrossRef]
- Oliveira, A.M.; Beswick, R.R.; Yan, Y. A green hydrogen economy for a renewable energy society. Curr. Opin. Chem. Eng. 2021, 33, 100701. [Google Scholar] [CrossRef]
- Staffell, I.; Scamman, D.; Abad, A.V.; Balcombe, P.; Dodds, P.E.; Ekins, P.; Shah, N.; Ward, K.R. The role of hydrogen and fuel cells in the global energy system. Energy Environ. Sci. 2019, 12, 463–491. [Google Scholar] [CrossRef]
- Arsad, S.R.; Ker, P.J.; Hannan, M.A.; Tang, S.G.H.; R S, N.; Chau, C.F.; Mahlia, T.M.I. Patent landscape review of hydrogen production methods: Assessing technological updates and innovations. Int. J. Hydrogen Energy 2024, 50, 447–472. [Google Scholar] [CrossRef]
- Taibi, E.; Miranda, R.; Vanhoudt, W.; Winkel, T.; Lanoix, J.-C.; Barth, F. Hydrogen from Renewable Power: Technology Outlook for the Energy Transition; IRENA: Bonn, Germany, 2018. [Google Scholar]
- Kusoglu, A. Chalkboard 1—The Many Colors of Hydrogen. Electrochem. Soc. Interface 2021, 30, 44. [Google Scholar] [CrossRef]
- Weidner, T.; Tulus, V.; Guillén-Gosálbez, G. Environmental sustainability assessment of large-scale hydrogen production using prospective life cycle analysis. Int. J. Hydrogen Energy 2023, 48, 8310–8327. [Google Scholar] [CrossRef]
- Gielen, D.; Gorini, R.; Leme, R.; Prakash, G.; Wagner, N.; Janeiro, L.; Collins, S.; Kadir, M.; Asmelash, E.; Ferroukhi, R.; et al. World Energy Transitions Outlook: 1.5 °C Pathway; IRENA: Bonn, Germany, 2021. [Google Scholar]
- Sens, L.; Neuling, U.; Wilbrand, K.; Kaltschmitt, M. Conditioned hydrogen for a green hydrogen supply for heavy duty-vehicles in 2030 and 2050—A techno-economic well-to-tank assessment of various supply chains. Int. J. Hydrogen Energy 2024, 52, 1185–1207. [Google Scholar] [CrossRef]
- Sorensen, B.; Spazzafumo, G. Hydrogen and Fuel Cells: Emerging Technologies and Applications; Academic Press: Cambridge, MA, USA, 2018. [Google Scholar]
- Hosseini, S.E. Fundamentals of Hydrogen Production and Utilization in Fuel Cell Systems; Elsevier: Amsterdam, The Netherlands, 2023. [Google Scholar]
- Hassan, Q.; Abdulateef, A.M.; Hafedh, S.A.; Al-samari, A.; Abdulateef, J.; Sameen, A.Z.; Salman, H.M.; Al-Jiboory, A.K.; Wieteska, S.; Jaszczur, M. Renewable energy-to-green hydrogen: A review of main resources routes, processes and evaluation. Int. J. Hydrogen Energy 2023, 48, 17383–17408. [Google Scholar] [CrossRef]
- Inal, O.B.; Zincir, B.; Deniz, C. Investigation on the decarbonization of shipping: An approach to hydrogen and ammonia. Int. J. Hydrogen Energy 2022, 47, 19888–19900. [Google Scholar] [CrossRef]
- Zhang, L.; Jia, C.; Bai, F.; Wang, W.; An, S.; Zhao, K.; Li, Z.; Li, J.; Sun, H. A comprehensive review of the promising clean energy carrier: Hydrogen production, transportation, storage, and utilization (HPTSU) technologies. Fuel 2024, 355, 129455. [Google Scholar] [CrossRef]
- Kamlungsua, K.; Su, P.-C.; Chan, S. Hydrogen Generation Using Solid Oxide Electrolysis Cells. Fuel Cells 2020, 20, 644–649. [Google Scholar] [CrossRef]
- Buttler, A.; Spliethoff, H. Current status of water electrolysis for energy storage, grid balancing and sector coupling via power-to-gas and power-to-liquids: A review. Renew. Sustain. Energy Rev. 2018, 82, 2440–2454. [Google Scholar] [CrossRef]
- Santoro, C.; Lavacchi, A.; Mustarelli, P.; Di Noto, V.; Elbaz, L.; Dekel, D.R.; Jaouen, F. What is Next in Anion-Exchange Membrane Water Electrolyzers? Bottlenecks, Benefits, and Future. ChemSusChem 2022, 15, e202200027. [Google Scholar] [CrossRef]
- Brauns, J.; Turek, T. Alkaline Water Electrolysis Powered by Renewable Energy: A Review. Processes 2020, 8, 248. [Google Scholar] [CrossRef]
- Carmo, M.; Fritz, D.L.; Mergel, J.; Stolten, D. A comprehensive review on PEM water electrolysis. Int. J. Hydrogen Energy 2013, 38, 4901–4934. [Google Scholar] [CrossRef]
- Cavaliere, P. Electrolysis Economy. In Water Electrolysis for Hydrogen Production; Cavaliere, P., Ed.; Springer International Publishing: Cham, Switzerland, 2023; pp. 793–830. [Google Scholar]
- Hydrogen Europe. Hydrogen Europe position paper on PFAS. Available online: https://www.scribd.com/document/838541773/Hydrogen-Europe-position-paper-on-PFAS-ban-v12-FINAL (accessed on 18 May 2025).
- Dias, A. JRC Science for Policy Report. Available online: https://publications.jrc.ec.europa.eu/repository/bitstream/JRC126594/JRC126594_01.pdf (accessed on 18 May 2025).
- Andrew Miller, H.; Bouzek, K.; Hnat, J.; Loos, S.; Immanuel Bernäcker, C.; Weißgärber, T.; Röntzsch, L.; Meier-Haack, J. Green hydrogen from anion exchange membrane water electrolysis: A review of recent developments in critical materials and operating conditions. Sustain. Energy Fuels 2020, 4, 2114–2133. [Google Scholar] [CrossRef]
- Wu, Y.; Jing, M.; Li, J.; Deng, W.; Yi, M.; Chen, Z.; Yang, M.; Wu, J.; Xu, X.; Bai, Y.; et al. Collaborative integration of Fe-Nx active center into defective sulfur/selenium-doped carbon for efficient oxygen electrocatalysts in liquid and flexible Zn-air batteries. Chin. Chem. Lett. 2024, 35, 109269. [Google Scholar] [CrossRef]
- Deng, W.; Li, G.; Wu, T.; He, L.; Wu, J.; Liu, J.; Zheng, H.; Li, X.; Yang, Y.; Jing, M.; et al. Heteroatom functionalized double-layer carbon nanocages as highly efficient oxygen electrocatalyst for Zn-Air batteries. Carbon 2022, 186, 589–598. [Google Scholar] [CrossRef]
- Li, W.; Wang, C.; Lu, X. Conducting polymers-derived fascinating electrocatalysts for advanced hydrogen and oxygen electrocatalysis. Coord. Chem. Rev. 2022, 464, 214555. [Google Scholar] [CrossRef]
- Deng, W.; Wu, T.; Wu, Y.; Chen, F.; Bai, Y.; Zou, X.; Jing, M.; Deng, W.; Hou, H.; Wang, X. Microcosmic modulation of the Co–N bonding structure improves the multi-functional electrocatalytic performance. J. Mater. Chem. A 2024, 12, 10349–10358. [Google Scholar] [CrossRef]
- Ariana Mirshokraee, S.; Muhyuddin, M.; Orsilli, J.; Berretti, E.; Capozzoli, L.; Lavacchi, A.; Vecchio, C.L.; Baglio, V.; Galli, A.; Zaffora, A.; et al. Mono-, bi- and tri-metallic platinum group metal-free electrocatalysts for hydrogen evolution reaction following a facile synthetic route. Ind. Chem. Mater. 2023, 1, 343–359. [Google Scholar] [CrossRef]
- Mirshokraee, S.A.; Muhyuddin, M.; Pianta, N.; Berretti, E.; Capozzoli, L.; Orsilli, J.; D’Acapito, F.; Viscardi, R.; Cosenza, A.; Atanassov, P.; et al. Ni-Phthalocyanine Derived Electrocatalysts for Oxygen Reduction Reaction and Hydrogen Evolution Reaction: Active Sites Formation and Electrocatalytic Activity. ACS Catal. 2024, 14, 14524–14538. [Google Scholar] [CrossRef]
- Mahmud, R.; Moni, S.M.; High, K.; Carbajales-Dale, M. Integration of techno-economic analysis and life cycle assessment for sustainable process design—A review. J. Clean. Prod. 2021, 317, 128247. [Google Scholar] [CrossRef]
- Zimmermann, A.W.; Wunderlich, J.; Müller, L.; Buchner, G.A.; Marxen, A.; Michailos, S.; Armstrong, K.; Naims, H.; McCord, S.; Styring, P.; et al. Techno-Economic Assessment Guidelines for CO2 Utilization. Front. Energy Res. 2020, 8, 5. [Google Scholar] [CrossRef]
- Davis, R.; Aden, A.; Pienkos, P.T. Techno-economic analysis of autotrophic microalgae for fuel production. Appl. Energy 2011, 88, 3524–3531. [Google Scholar] [CrossRef]
- Guo, B.; Ghalambor, A. Natural Gas Engineering Handbook; Elsevier: Amsterdam, The Netherlands, 2014. [Google Scholar]
- Cox, R.I. Hydrogen: Its Technology and Implication: Production Technology—Volume I; CRC Press: Boca Raton, FL, USA, 2018. [Google Scholar]
- Strategic Research and Innovation Agenda—Clean Hydrogen Partnership. Available online: https://www.clean-hydrogen.europa.eu/about-us/key-documents/strategic-research-and-innovation-agenda_en (accessed on 21 March 2025).
- Bahramara, S.; Moghaddam, M.P.; Haghifam, M.R. Optimal planning of hybrid renewable energy systems using HOMER: A review. Renew. Sustain. Energy Rev. 2016, 62, 609–620. [Google Scholar] [CrossRef]
- Yang, X.; Nielsen, C.P.; Song, S.; McElroy, M.B. Breaking the hard-to-abate bottleneck in China’s path to carbon neutrality with clean hydrogen. Nat. Energy 2022, 7, 955–965. [Google Scholar] [CrossRef]
- Superchi, F.; Mati, A.; Carcasci, C.; Bianchini, A. Techno-economic analysis of wind-powered green hydrogen production to facilitate the decarbonization of hard-to-abate sectors: A case study on steelmaking. Appl. Energy 2023, 342, 121198. [Google Scholar] [CrossRef]


| PV Solar Cells | Present (2024) | |
|---|---|---|
| Capex | 850 | (€ kW−1) |
| O&M | 11.9 | (€ kW−1 y−1) |
| Lifetime | 20 | (y) |
| Capacity | 1 | (kW) |
| Derating Factor | 80 | (%) |
| Hydrogen Tank | Present (2024) | |
|---|---|---|
| Capex | 1200 | (€ kg−1) |
| O&M | 10 | (€ y−1 kg−1) |
| Lifetime | 20 | (year) |
| AEM-WE | Now (2024) | Future (2030) | ||
|---|---|---|---|---|
| Capex | 550 | (EUR kW−1) | 300 | (EUR kW−1) |
| O&M | 12.22 | (EUR kW−1 y−1) | 10.38 | (EUR kW−1 y−1) |
| Replacement | 300 | (EUR kW−1) | 300 | (EUR kW−1) |
| Efficiency | 60 | (%) | 66.5 | (%) |
| Lifetime | 5 | (y) | 5 | (y) |
| Compound | Now (2024) | Future (2030) | ||
|---|---|---|---|---|
| AEM-WE | 170,000 | (kW) | 165,000 | (kW) |
| Generic flat plate PV | 330,000 | (kW) | 284,000 | (kW) |
| Hydrogen Tank | 80,500 | (kg) | 80,000 | (kg) |
| Electrolyzer | Present (2024) | Future (2030) | ||
|---|---|---|---|---|
| Capex | 2000 | (EUR kW−1) | 1000 | (EUR kW−1) |
| O&M | 12.22 | (EUR kW−1 y−1) | 12.22 | (EUR kW−1 y−1) |
| Replacement | 1000 | (EUR kW−1) | 1000 | (EUR kW−1) |
| Efficiency | 63.5 | (%) | 66.5 | (%) |
| Lifetime | 7 | (y) | 7 | (y) |
| Component | Now (2024) | Future (2030) | ||
|---|---|---|---|---|
| Electrolyzer | 60,000 | (kW) | 55,000 | (kW) |
| Generic flat plate PV | 85,000 | (kW) | 85,000 | (kW) |
| Hydrogen Tank | 60,000 | (kg) | 55,000 | (kg) |
| CAT | 52,000 | (kW) | 52,000 | (kW) |
Disclaimer/Publisher’s Note: The statements, opinions and data contained in all publications are solely those of the individual author(s) and contributor(s) and not of MDPI and/or the editor(s). MDPI and/or the editor(s) disclaim responsibility for any injury to people or property resulting from any ideas, methods, instructions or products referred to in the content. |
© 2025 by the authors. Licensee MDPI, Basel, Switzerland. This article is an open access article distributed under the terms and conditions of the Creative Commons Attribution (CC BY) license (https://creativecommons.org/licenses/by/4.0/).
Share and Cite
Mirshokraee, S.A.; Bedogni, S.; Bindi, M.; Santoro, C. Substituting Natural Gas with Hydrogen for Thermal Application in a Hard-to-Abate Industry: A Real Case Study. Hydrogen 2025, 6, 37. https://doi.org/10.3390/hydrogen6020037
Mirshokraee SA, Bedogni S, Bindi M, Santoro C. Substituting Natural Gas with Hydrogen for Thermal Application in a Hard-to-Abate Industry: A Real Case Study. Hydrogen. 2025; 6(2):37. https://doi.org/10.3390/hydrogen6020037
Chicago/Turabian StyleMirshokraee, Seyed Ariana, Stefano Bedogni, Massimiliano Bindi, and Carlo Santoro. 2025. "Substituting Natural Gas with Hydrogen for Thermal Application in a Hard-to-Abate Industry: A Real Case Study" Hydrogen 6, no. 2: 37. https://doi.org/10.3390/hydrogen6020037
APA StyleMirshokraee, S. A., Bedogni, S., Bindi, M., & Santoro, C. (2025). Substituting Natural Gas with Hydrogen for Thermal Application in a Hard-to-Abate Industry: A Real Case Study. Hydrogen, 6(2), 37. https://doi.org/10.3390/hydrogen6020037