1. Introduction
The pyrolytic gasification of lignocellulosic biomass enables the production of syngas (H
2 and CO) as well as hydrocarbon gases. When these combustible gases are utilized in gas engines, they enable small-scale, high-efficiency power generation, in contrast to steam turbine generation which is driven by heat from the direct combustion of biomass [
1]. Furthermore, technologies for synthesizing hydrocarbons (i.e., synthetic fuels) from syngas via the Fischer–Tropsch process [
2] have been established, highlighting the potential of biomass gasification, not only for energy production but also as a viable alternative to petroleum-based chemical industries.
However, the pyrolytic gasification of lignocellulosic biomass also produces byproducts such as tar and coke [
3,
4]. Tar is a dark brown, viscous, oil-like substance containing polycyclic aromatic hydrocarbons (PAHs), while coke is solid carbon formed through the secondary carbonization of volatile compounds. The accumulation of tar can lead to the clogging of gasifier piping, while coke deposition may cause the deterioration of the reactor and the deactivation of solid catalysts. In addition, lignocellulosic biomass contains small amounts of alkali metals (e.g., Na and K) and alkaline earth metals (e.g., Ca and Mg), whose oxides can melt during pyrolysis and solidify inside the gasifier as clinker [
5,
6]. The formation of tar, coke, and clinker significantly reduces the operability of gasification systems. Although these issues have been widely studied over many years, no fundamental solution has yet been found.
Through long-term investigations into the complex pyrolysis mechanisms of lignocellulosic biomass, the authors have reached a stage where molecular-level reactions can now be discussed in detail [
4]. According to these studies, cellulose, which accounts for roughly half of woody biomass, undergoes primary pyrolysis at temperatures above 350 °C, depolymerizing into levoglucosan, a relatively stable anhydrosugar. During the subsequent secondary pyrolysis, the decomposition pathway of levoglucosan differs depending on whether it remains in the gas phase or condenses into the liquid phase. In the gas phase, levoglucosan is relatively stable, but at temperatures exceeding 600 °C, it undergoes fragmentation via radical chain reactions, ultimately gasifying into H
2 and CO. In contrast, when cooled and condensed into the liquid phase, intermolecular hydrogen bonding acts as an acid catalyst, promoting polymerization and condensation reactions, which accelerate the formation of tar and coke.
Thus, efficient biomass gasification typically requires high-temperature conditions, usually 800 °C or higher [
7]. However, at such elevated temperatures, unsaturated intermediates such as ethylene and acetylene tend to polymerize and form PAHs, thereby promoting coke formation. Moreover, the melting of inorganic species increases the risk of clinker formation [
6].
Given these challenges, the reactivity of levoglucosan during secondary pyrolysis is considered a key factor. Promoting its gasification through radical chain reactions at lower temperatures may help mitigate the problems described above. Based on this concept, the authors have focused on plasma processes, which can provide a radical reaction field even at low temperatures [
8]. Plasma contains high-energy electrons, reactive species, and radicals, providing a chemically active environment. If gasification can be facilitated using low-temperature plasma, it may be possible to suppress the formation of tar, coke, and clinker.
Although the application of plasma technology to biomass conversion has been relatively limited, sporadic reports have appeared since the early 2000s. Most of these studies have focused on gasification, particularly those using direct current (DC) arc plasma [
9,
10,
11,
12] and microwave plasma [
13,
14,
15,
16,
17]. These studies generally report favorable outcomes, such as increased gas yields and reduced formation of tar and coke. However, few studies have addressed the chemical reactions of biomass components such as cellulose and lignin, and reliable discussions regarding the contribution of plasma to the gasification process remain insufficient. In most prior studies, plasma treatment was conducted at high power levels—typically several hundred watts to several kilowatts and in some cases up to 100 kW—resulting in gas temperatures often exceeding 1000 °C. Under such high-temperature conditions, biomass gasification proceeds regardless of whether plasma is present. In particular, high-power plasma systems induce rapid pyrolysis, which alone can reduce tar and coke formation and increase syngas yield [
4,
18], even without plasma-specific effects.
Therefore, to decouple the effects of plasma from those of temperature for fundamental understanding, it is essential to conduct investigations under low-power, low-temperature conditions. The authors have previously demonstrated that glow discharge plasma treatment at a gas temperature of approximately 50 °C can completely gasify cellulose over an extended period of 92 h, without generating any tar or coke [
19]. However, in that case, the reaction occurred only at the solid surface of cellulose, and the decomposition rate was extremely slow. In the present study, the authors investigated an alternative approach in which cellulose was first subjected to primary pyrolysis using infrared heating to generate volatile products, which were then treated using low-power dielectric barrier discharge plasma to enhance the gasification of the volatile products.
2. Materials and Methods
2.1. Cellulose Sample
Whatman No. 42 cotton filter paper (α-cellulose content >98%, ash content <0.007%, Whatman PLC, Maidstone, UK) was used as a cellulose sample. It was cut into approximately 5 mm square sheets and dried to a constant weight overnight in an oven at 105 °C before use. According to ISO 3130, this drying condition is the standard method for preparing an absolutely dried sample [
20]. Nonetheless, a trace amount of bound water may remain in cellulose even after drying; however, this is generally considered negligible.
2.2. Experimental Setup and Procedure
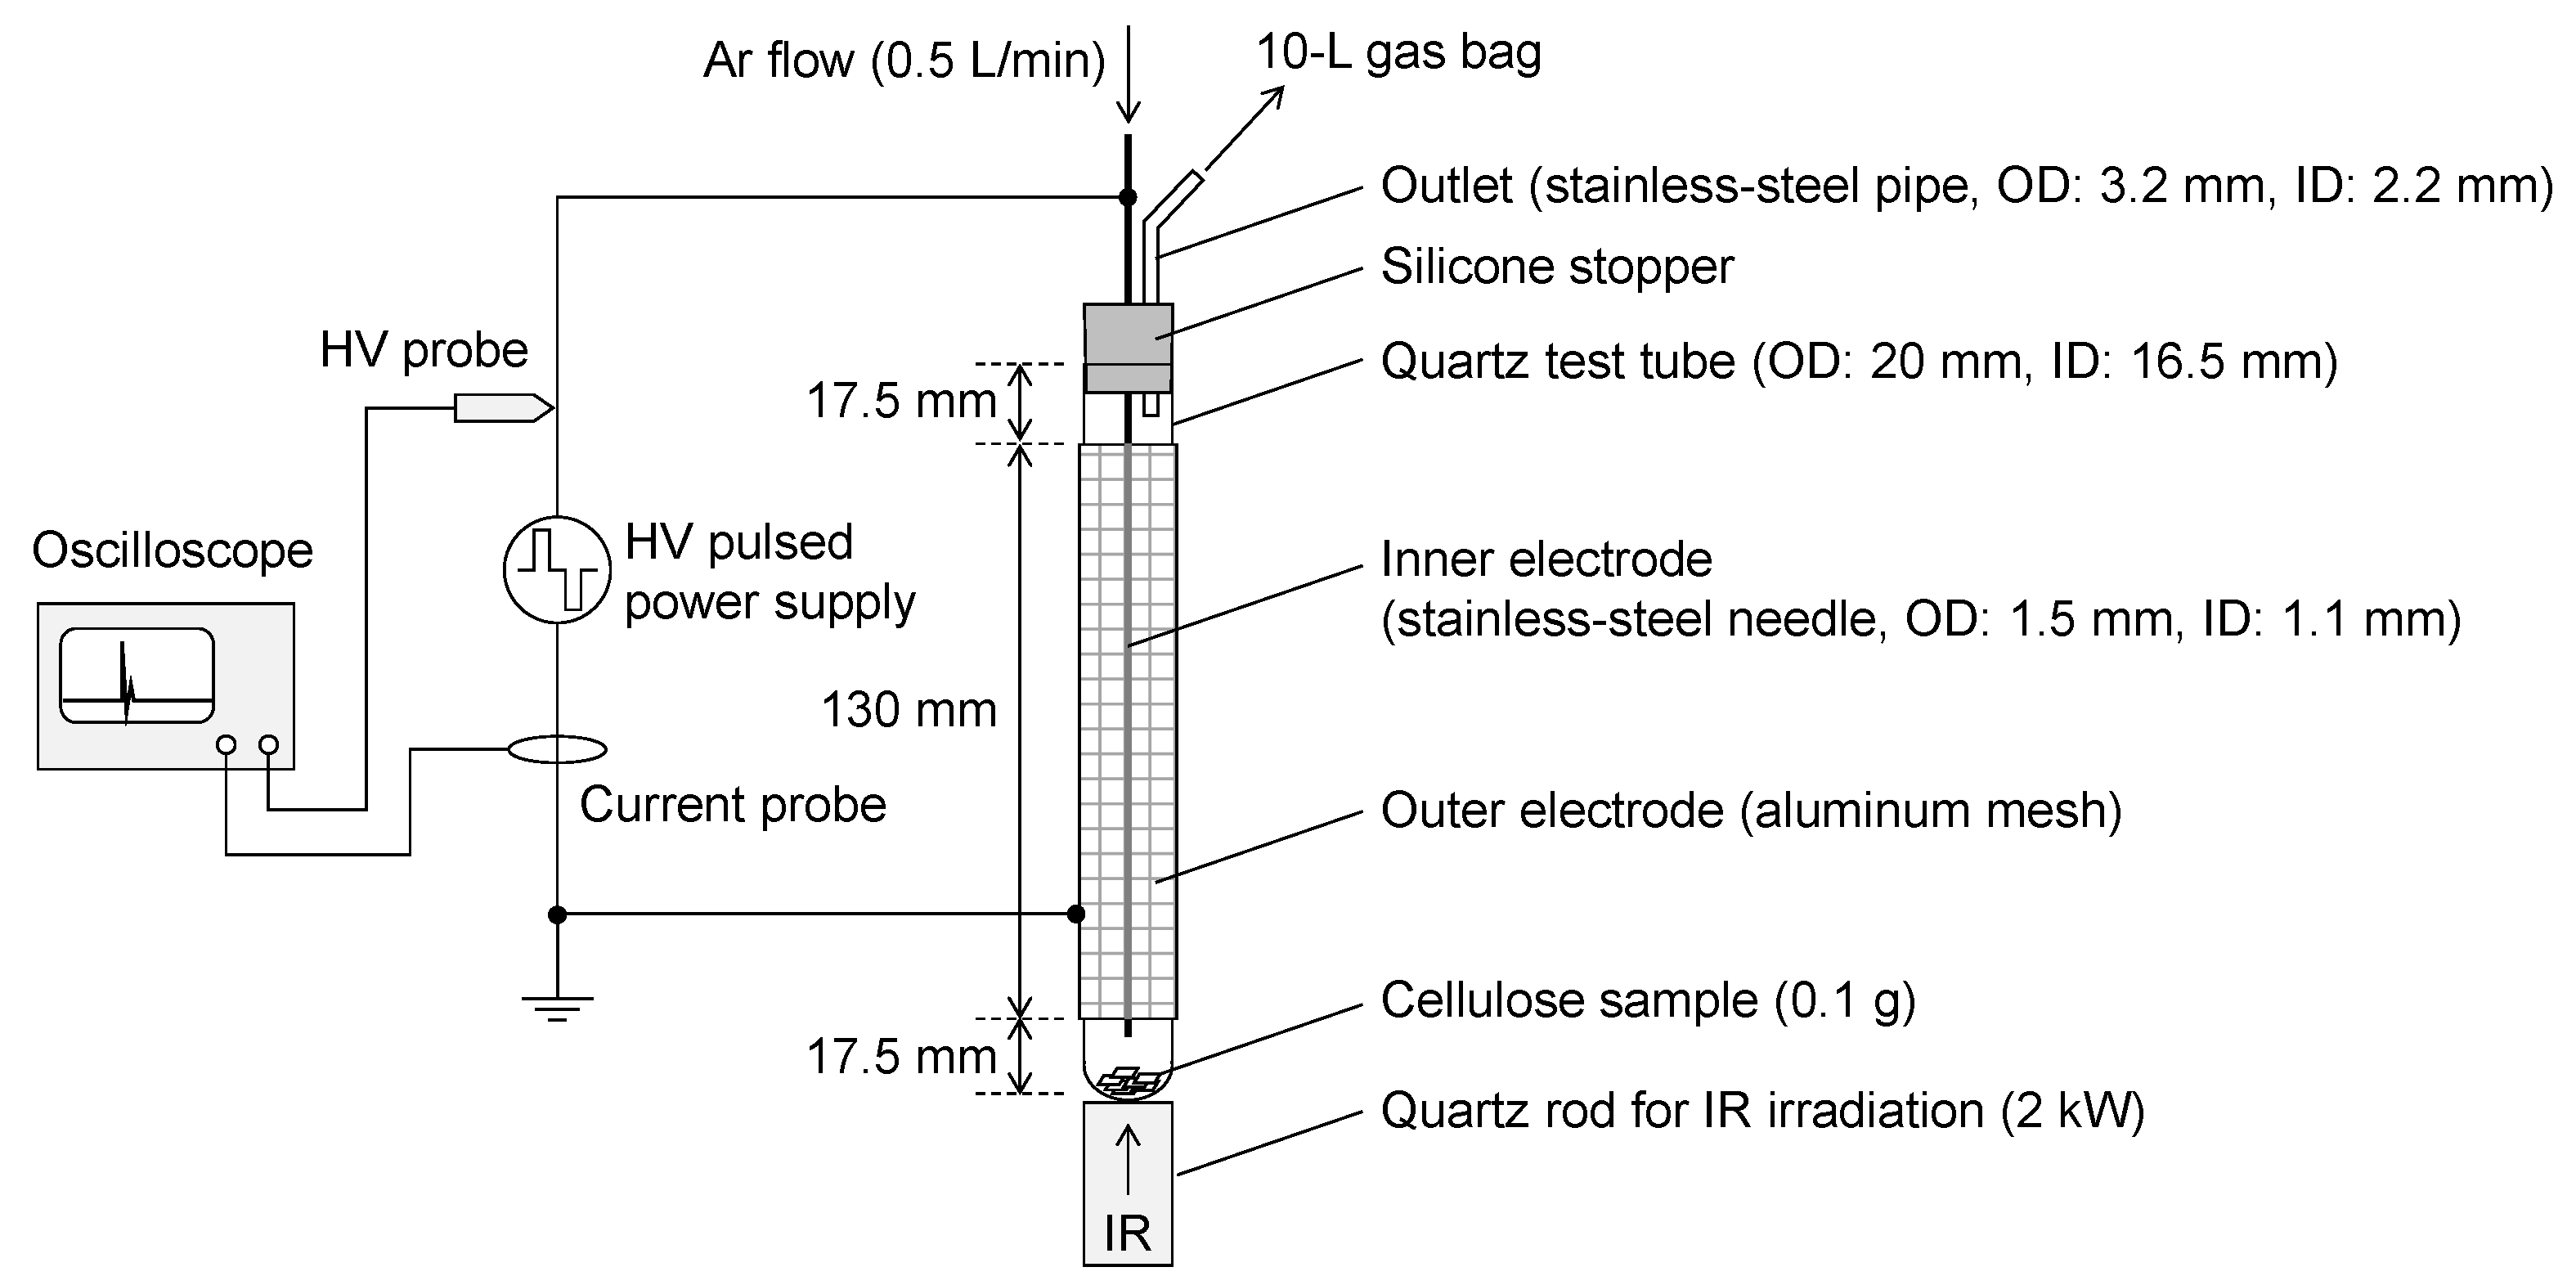
Figure 1 illustrates the configuration of the gasification reactor, which integrates pyrolysis and plasma treatment. The reactor primarily comprises a quartz test tube (outer diameter (OD): 20 mm, inner diameter (ID): 16.5 mm, and height: 165 mm), a stainless-steel needle (OD: 1.5 mm, ID: 1.1 mm, and length: 200 mm) serving as the inner electrode, and an aluminum mesh (130 mm wide) wrapped around the test tube as the outer electrode. Approximately 0.1 g of cellulose sheets was placed at the bottom of the test tube. Argon gas (Ar, purity: 99.9% and flow rate: 0.5 L/min) was introduced through the stainless-steel needle, and alternating high-voltage pulses (MPP04-A7A-30, Kurita Manufacturing Co., Ltd., Kyoto, Japan, no-load voltage: 7 kV
0−ₚ) were applied between the electrodes at a frequency of 20 kHz and pulse width settings of 0.56, 0.76, or 1.12 μs to generate dielectric barrier discharges (DBDs).
Simultaneously with the onset of DBDs, infrared (IR) radiation from a 2 kW IR lamp (GA298, Thermo Riko Co., Ltd., Tokyo, Japan) was applied from beneath the test tube via a quartz rod (OD: 20 mm) to induce the pyrolysis of the cellulose sample. The heating zone generated via IR irradiation was confined to approximately 1 cm from the tip of the quartz rod. As a result, only the region where the cellulose sample was placed was heated, and this region was spatially separated from the plasma region. Mist-like volatile products formed via the pyrolysis of the cellulose sample [
18] were carried upward by the Ar flow and passed through the DBD region for plasma treatment. The resulting gases and volatiles were then transported with the Ar carrier gas through a stainless-steel outlet pipe and collected in a 10 L Tedlar gas bag.
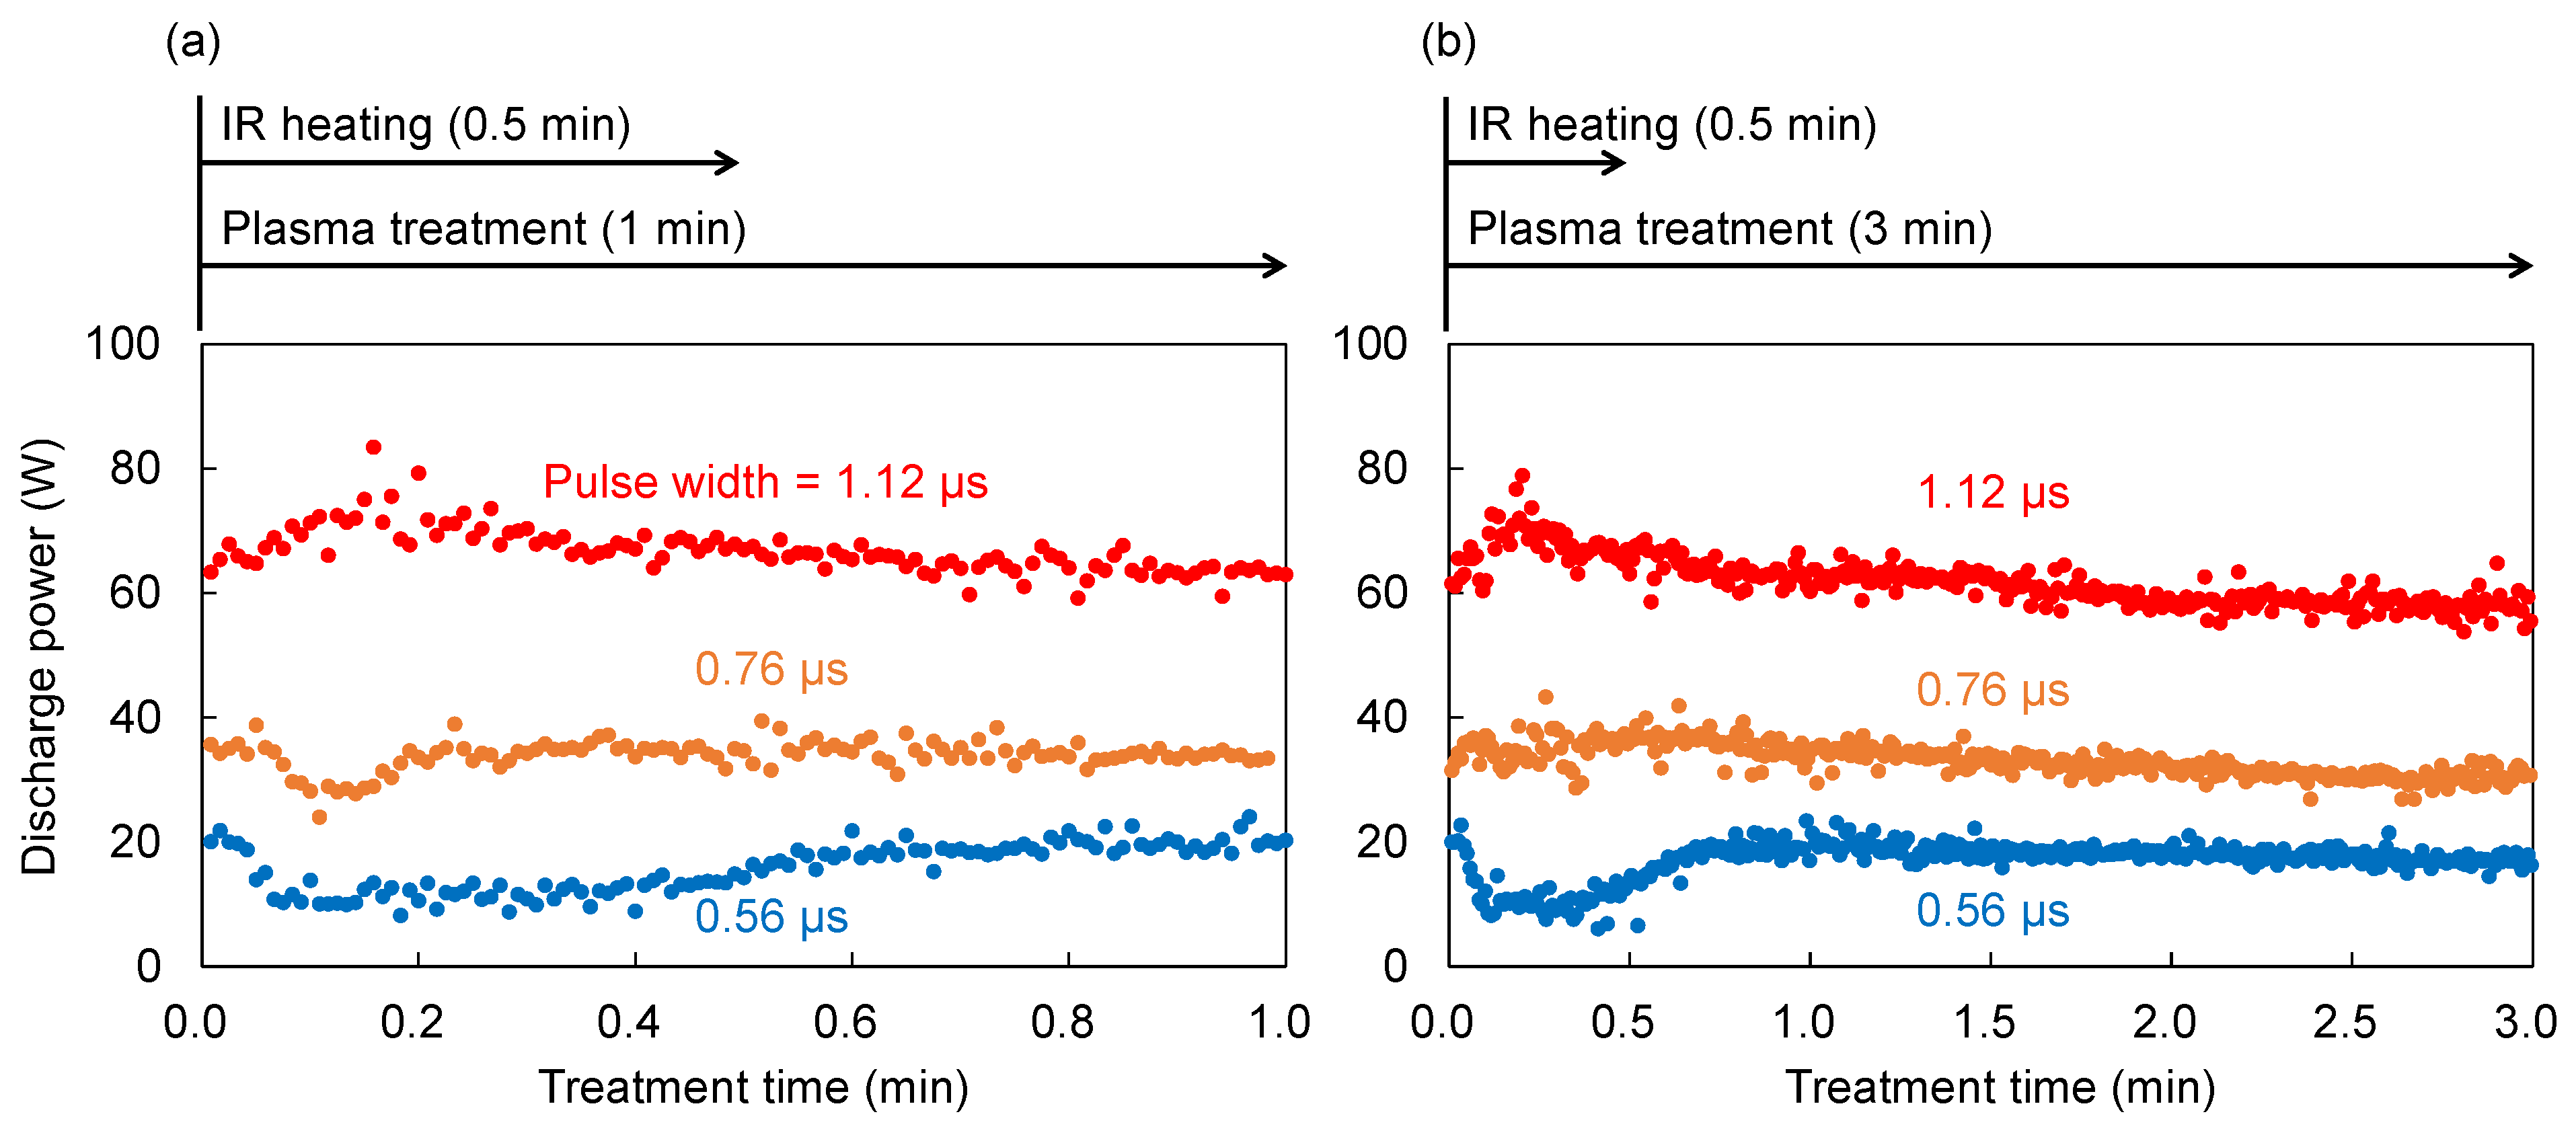
IR irradiation was continued for 30 s, which was sufficient to complete the pyrolysis of 0.1 g of cellulose, while the plasma discharge was sustained for either 1 or 3 min, meaning that IR heating and plasma treatment coexist during the first 30 s, followed by plasma treatment alone. Voltage and current waveforms across the electrodes were measured using a voltage probe (P6015A, Tektronix, Inc., Tokyo, Japan) and a current probe (Model 110, Pearson Electronics, Inc., Palo Alto, CA, USA), respectively. The discharge power was calculated as the cycle-averaged product of the instantaneous voltage and current and was recorded at one-second intervals. Representative voltage–current waveforms and the time profile of the discharge power during treatment are shown in
Figure A1 and
Figure A2 of
Appendix A, respectively. As described in
Appendix A, the discharge power increased with increasing pulse width settings. Although slight variations in power were observed, the average discharge powers corresponding to pulse width settings of 0.56, 0.76, and 1.12 µs and are referred to as 16 W, 34 W, and 64 W, respectively, throughout this paper.
After the DBD plasma treatment was stopped, the inner surfaces of the quartz test tube and the gas bag were rinsed with 10 mL and 20 mL of methanol, respectively, and the methanol-soluble products were separately collected. The test tube was then dried to a constant weight in an oven at 65 °C and weighed using an analytical balance. The weight of the methanol-insoluble fraction, including char from the cellulose and brown solid deposits on the inner wall, was determined by subtracting the test tube’s pre-experimental weight.
2.3. Analytical Methods
The product gas in the gas bag was analyzed using micro-gas chromatography (micro-GC, Agilent 990, Agilent Technologies Inc., Santa Clara, CA, USA) under the following conditions after adding 10 mL of neon gas (Ne, purity: 99.9999%) as an internal standard: Channel 1: column, MS5 A 10 m; column temperature, 100 °C; and inlet pressure, 170 kPa. Channel 2: column, PoraPLOT Q 10 m; column temperature, 80 °C; and inlet pressure, 190 kPa. In all channels, Ar was used as the carrier gas and thermal conductivity detectors were used as the detector. Because there was air contamination in this micro-GC system, CO2 was slightly overestimated. Therefore, the CO2 in the contaminated air (approximately 400 ppm) was subtracted from the CO2 quantification results and reported. However, the effect of these corrections was small in all cases in this study.
The methanol-soluble fractions were analyzed using
1H nuclear magnetic resonance spectroscopy (
1H NMR, 400 MHz; AvanceCore, Bruker, Billerica, MA, USA). To convert any aldehydes into their corresponding oximes, 1 mg of hydroxylamine hydrochloride was added to a 3 mL aliquot of the methanol-soluble portion. This derivatization was performed because aldehydes can interfere with accurate quantification by forming adducts with sugar hydroxyl groups [
21]. After removing methanol using a rotary evaporator, 700 μL of dimethyl sulfoxide-d
6 (DMSO-d
6) containing maleic acid as an internal standard was added, and the sample was subjected to
1H NMR analysis.
3. Results and Discussion
3.1. Gas-Phase Fractions
Figure 2 shows the micro-GC chromatograms of the product gases obtained after IR heating (2 kW for 30 s) and DBD plasma treatment (average powers of 16 W, 34 W, or 64 W for 1 min) of cellulose. In channel 1, H
2, CH
4, and CO were detected along with the standard Ne gas. Due to the structural characteristics of the micro-GC system, some uncontrollable air contamination occurred during the analysis; therefore, the detected N
2 and O
2 originated from air contamination. As the ratio of detected N
2 to O
2 was always consistent with the atmospheric composition, it was concluded that no O
2 was generated from cellulose in this study. In channel 2, CO
2, unsaturated C
2–C
3 gases (C
2H
2, C
2H
4, and C
3H
6), and saturated C
2–C
3 gases (C
2H
6 and C
3H
8) were detected. Although it is known that cellulose produces some H
2O upon pyrolysis, the large H
2O peaks observed in channel 2 are mainly attributed to moisture in the ambient air, as well as residual water in the cellulose sample.
When IR heating was applied alone without DBD plasma treatment, the peak intensities of most product gases (H
2, CO, CO
2, CH
4, and C
2–C
3 hydrocarbons) were the lowest. Upon the addition of the DBD treatment, the peak intensities of the gases increased with discharge power, indicating that gasification was promoted by DBD plasma.
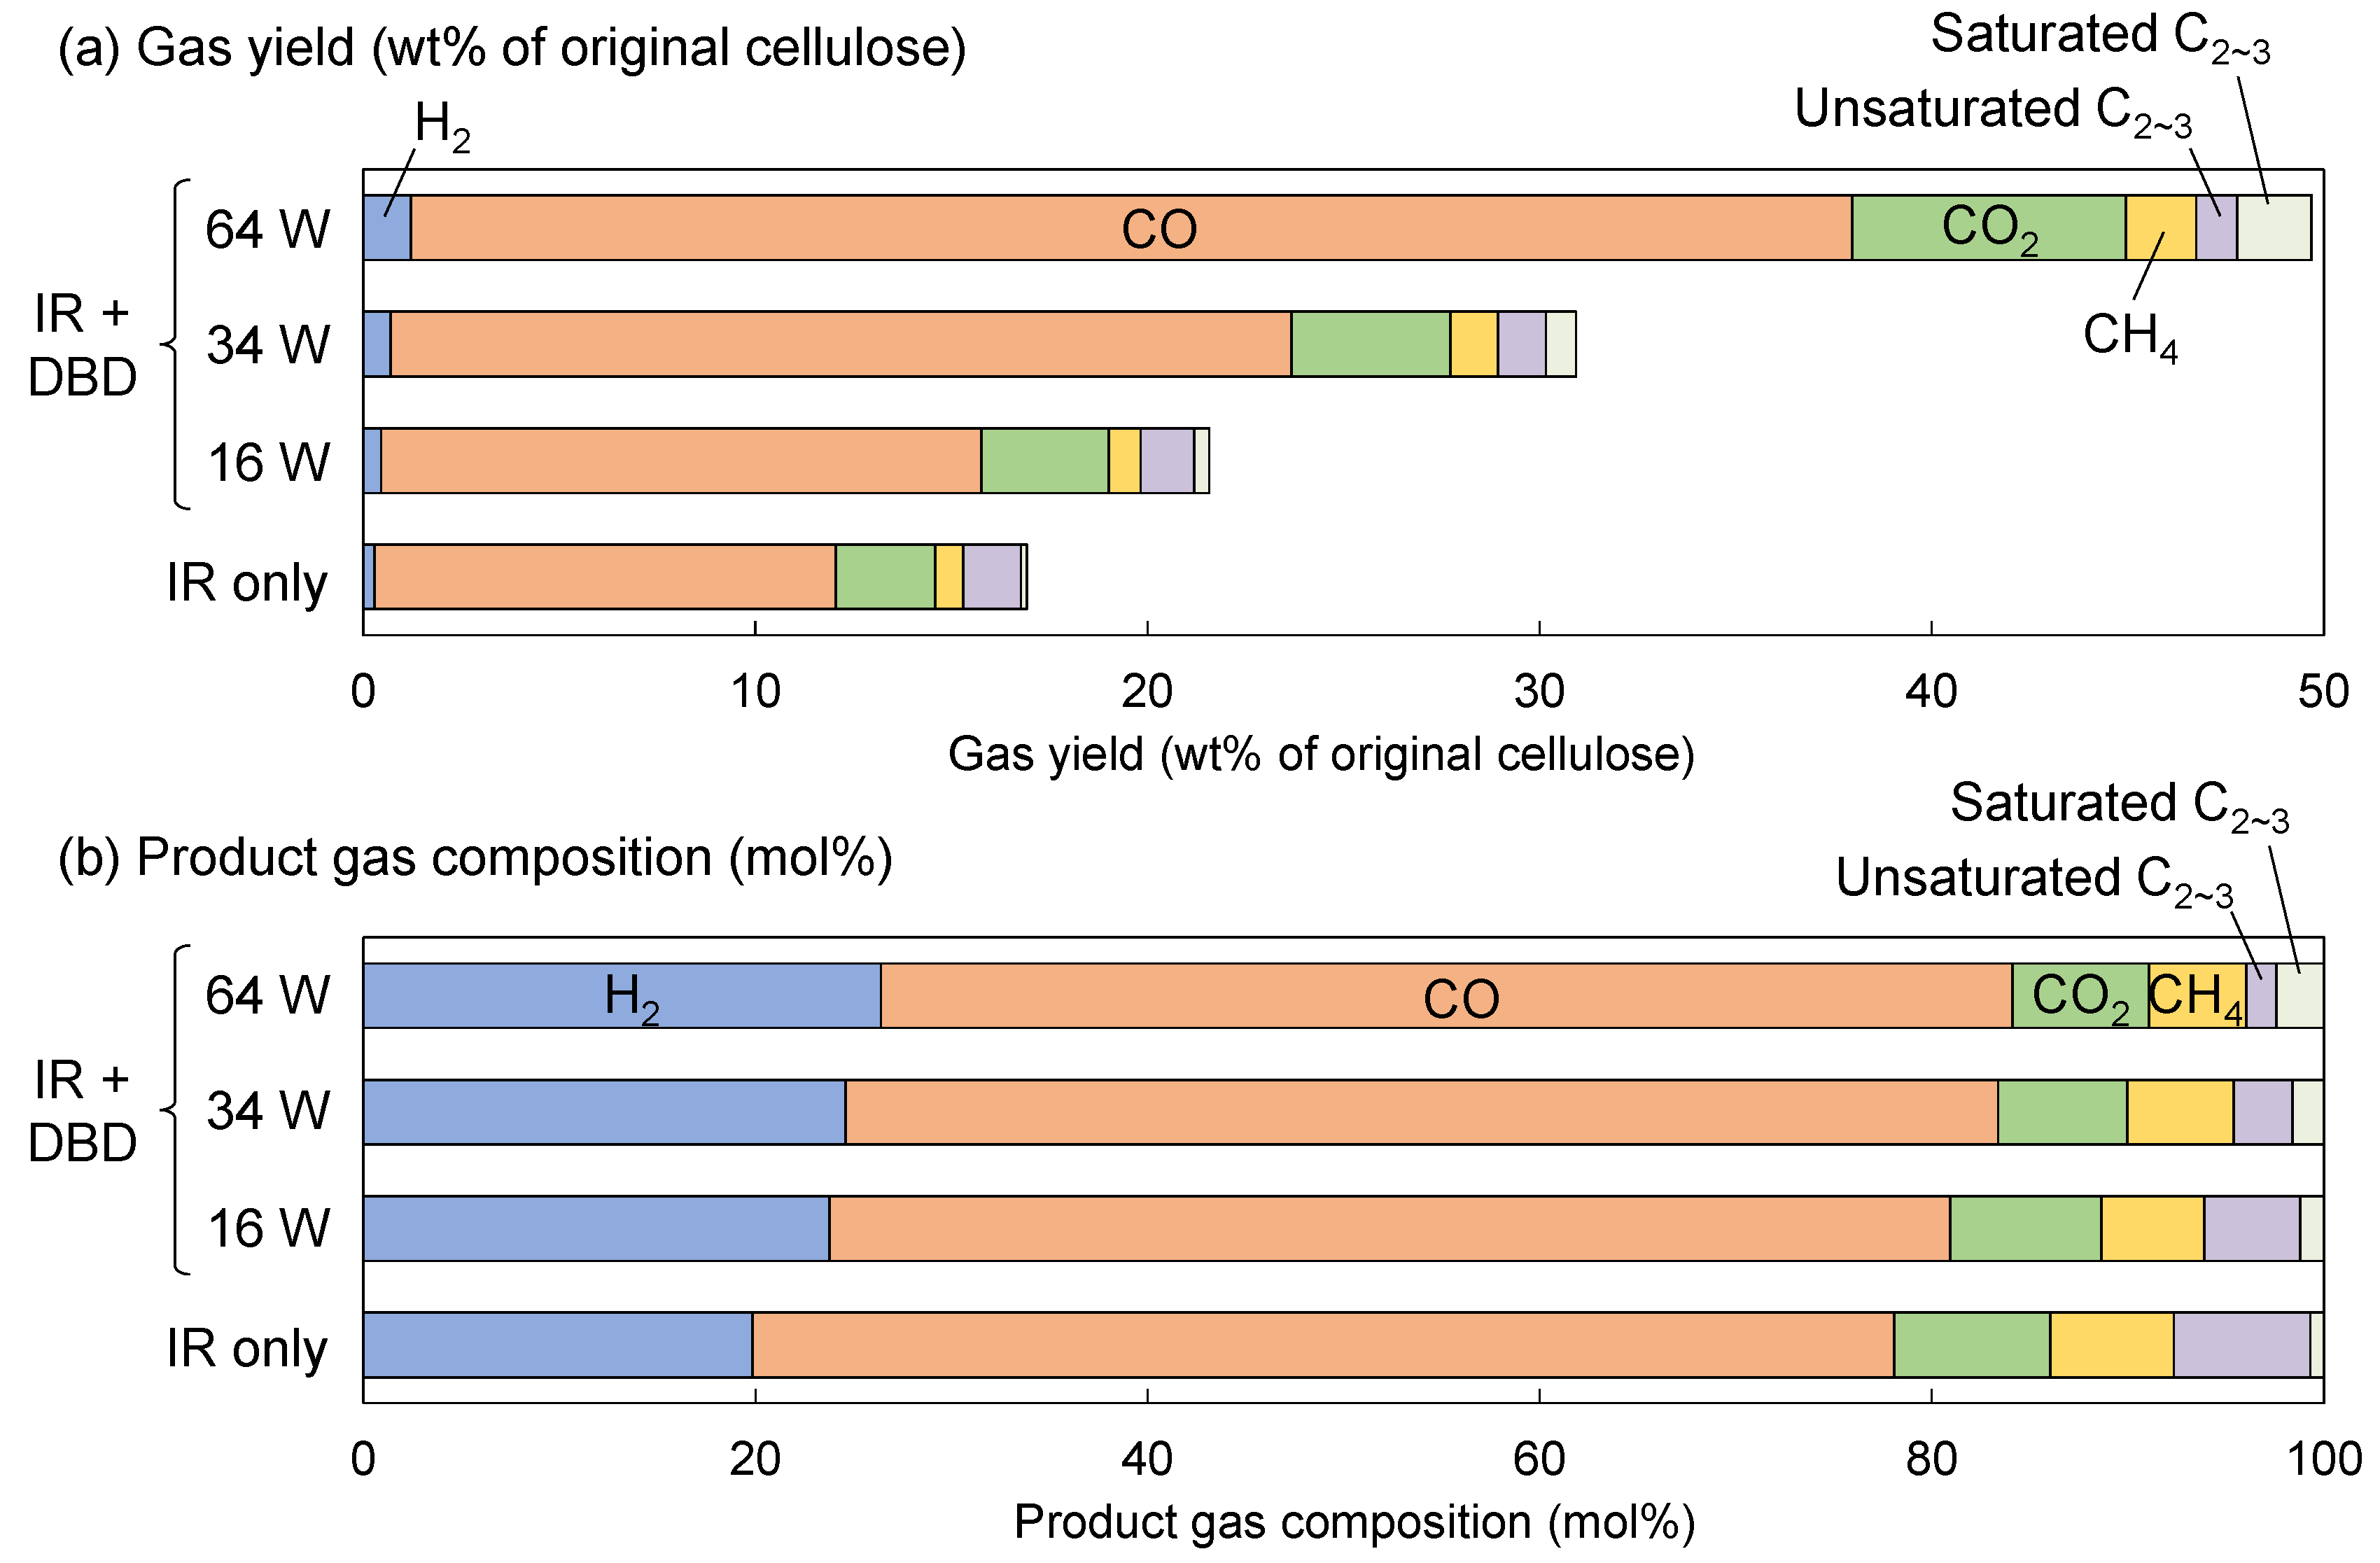
Figure 3 shows the gas yield and product gas composition quantified from the chromatograms. The weight-based yield of H
2 in
Figure 3a appears particularly low due to its small molecular weight. The total gas yield was 16.9 wt% when only IR heating was applied but increased with discharge power when DBD treatment was added, reaching 49.7 wt% at 64 W—approximately three times that of IR heating alone.
According to the mole-based product gas composition (
Figure 3b), the major components were H
2 and CO, followed by CO
2 and CH
4. In this graph, C
2 and C
3 hydrocarbons are grouped together, but C
2 gases were predominant, and C
3 gases were minor. Compared with the composition in the IR-only case, the relative amounts of CO, CO
2, and CH
4 remained unchanged with DBD treatment, while the proportion of H
2 tended to increase with discharge power. In addition, the proportion of unsaturated C
2–C
3 hydrocarbons decreased, whereas that of saturated C
2–C
3 hydrocarbons increased as discharge power increased. This trend implies that H radicals generated from H
2 in the plasma may have hydrogenated unsaturated hydrocarbons into saturated ones. To verify this, a mixture of Ar gas with 4% H
2 was used instead of pure Ar under the same IR heating and DBD plasma conditions. However, no change in the ratio of saturated to unsaturated C
2–C
3 hydrocarbons was observed. Therefore, it is likely that this behavior was not due to hydrogenation by H
2 in the plasma, but rather due to differences in decomposition mechanisms between thermal and plasma treatment. The detailed mechanism, however, remains unclear within the scope of this study.
Although only the case with a DBD plasma treatment time of 1 min was discussed here, similar behavior was observed for the 3 min treatment. However, as described in
Section 3.4, the total gas yield increased compared to the 1 min case.
3.2. Methanol-Soluble Fractions
Figure 4 shows the
1H-NMR spectra of the methanol-soluble products recovered from the quartz test tube and the gas bag. A singlet peak at 5.13 ppm corresponds to the H-1 proton of levoglucosan. Triplet peaks at 6.69 ppm and 7.30 ppm are attributable to the oxime derivative of glycolaldehyde, while doublet peaks at 6.42 ppm and 6.93 ppm are assigned to the oxime derivative of formaldehyde [
21]. Other minor signals observed in the 6–8 ppm region are derived from the oximes of other aldehydes. However, except for glycolaldehyde, these aldehydes were present only in trace amounts. These aldehydes are known to be gasification intermediates that are formed via the fragmentation of levoglucosan [
21].
When cellulose was treated using IR heating alone,
1H-NMR spectra showed prominent peaks of levoglucosan in both the quartz tube and the gas bag, while a small amount of glycolaldehyde was detected in the quartz tube. IR heating of cellulose produces mist-like levoglucosan with a high yield, and this mist tends to resist condensation even at relatively low temperatures well below its boiling point (385 °C [
22]). As a result, although some levoglucosan condenses on the inner wall of the quartz tube, a substantial fraction reaches the gas bag, as we have shown in a previous study [
18].
In contrast, when DBD plasma treatment (64 W for 1 min) was applied in combination, the mist-like products generated from cellulose were visually observed to be trapped and retained in the plasma region, even under Ar gas flow, with almost none reaching the gas bag. Indeed, the 1H-NMR spectra indicate the presence of levoglucosan in the quartz tube but almost none in the gas bag. During the 1 min DBD plasma treatment at 64 W, the mist that had accumulated in the plasma region gradually became thinner and eventually disappeared. This is considered to be due to either the gasification of levoglucosan in the plasma, its condensation on the inner wall of the quartz tube, or both.
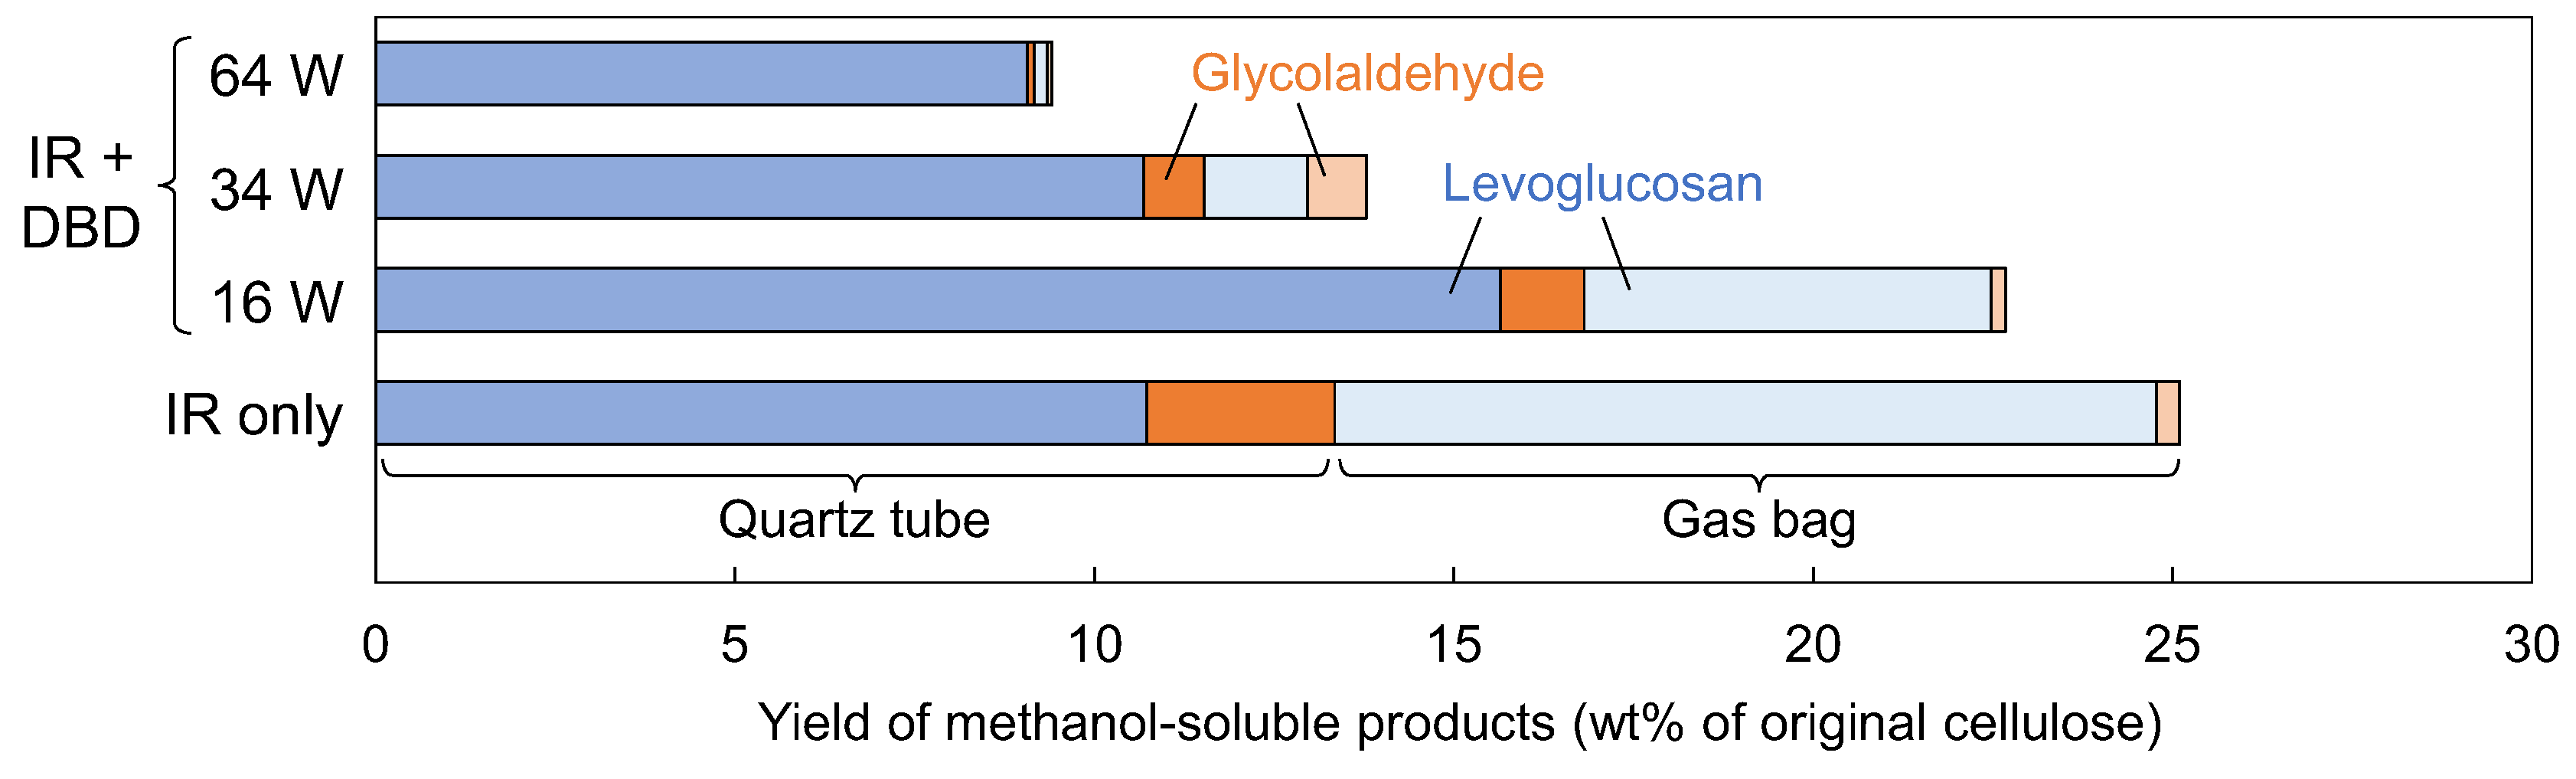
Figure 5 shows the yields (wt% of original cellulose) of levoglucosan and glycolaldehyde, as evaluated from the
1H-NMR spectra. The yields are separated into those recovered from the quartz tube and those from the gas bag. In the case of IR heating alone, approximately half of the levoglucosan condensed inside the quartz tube, while the remainder reached the gas bag. In contrast, when 16 W DBD plasma was applied, the amount of levoglucosan recovered from the quartz tube increased, while that reaching the gas bag decreased. As the discharge power increased, the amount of levoglucosan reaching the gas bag decreased further, and at 64 W, almost none was recovered from the gas bag. In addition, the total yield of levoglucosan decreased with increasing discharge power, indicating that levoglucosan underwent decomposition in the plasma.
The trapping of mist-like products in the DBD plasma region was probably due to the same principle as electrostatic precipitation (ESP) [
23]; that is, electrons were attached to the mist particles, which were then captured by the electric field. Such trapping may prolong the residence time of the mist within the plasma region and thereby facilitate gasification. In contrast, without the DBD plasma—when only IR heating was applied—such electrostatic trapping did not occur, and the mist-like products were largely transported to the gas bag, as shown in
Figure 5.
3.3. Methanol-Insoluble Fractions
Figure 6 shows the photographs of quartz test tubes after IR heating and DBD plasma treatment, followed by methanol rinsing and drying. When treated using IR heating alone (2 kW for 30 s), black char, which apparently originated from completely carbonized cellulose, remained at the bottom of the tube. This complete carbonization likely occurred because partially carbonized cellulose absorbs infrared radiation more effectively, leading to further heating and promoting progressive carbonization [
18].
When 1 min of DBD plasma treatment was applied in combination, no significant visual difference was observed at discharge powers of 16 W and 34 W compared to IR heating alone. However, at 64 W, brown solid deposits appeared slightly above the bottom of the tube. When the plasma treatment time was extended to 3 min, brown deposits were observed even at 16 W, and they spread further upward along the tube wall as the discharge power increased.
These brown deposits were insoluble in common solvents such as methanol, 2-propanol, acetone, tetrahydrofuran, and ethyl acetate and were therefore not subjected to chemical analysis, but their brown color suggests a low degree of carbonization. They showed no fluidity and did not resemble tar-like substances. Since the spread of the brown deposits became more prominent with longer plasma treatment time and higher discharge power, it is speculated that a portion of the levoglucosan underwent polymerization during repeated condensation and volatilization on the inner wall, resulting in the upward expansion of the deposits.
It should be noted that the black char and brown deposits strongly adhered to the tube wall, making it impossible to separate them quantitatively. Therefore, they were collectively evaluated as methanol-insoluble products.
3.4. Product Distributions
Figure 7 shows the distribution of the methanol-insoluble, methanol-soluble (levoglucosan and glycolaldehyde), and gaseous fractions. The yield of the methanol-soluble fraction is the combined yield from the quartz tube and the gas bag. In the case of IR heating alone, the methanol-insoluble, methanol-soluble, and gas fractions were 4.3 wt%, 23.5 wt%, and 16.9 wt%, respectively, indicating that a certain extent of gasification had already occurred during the IR heating stage. However, the total yield of them was only 44.7 wt%, and the remaining 55.3 wt% could not be identified within the analytical scope of this study. Although water generated from cellulose decomposition is not included in
Figure 7, it is unlikely to account for the entire missing fraction. No other gaseous products were detected via micro-GC analysis. In addition, since methanol was removed from the soluble fraction using a rotary evaporator before
1H-NMR analysis, it is possible that volatile products were lost during this step. However, even when the quartz tube and gas bag were rinsed with deuterated solvents (DMSO-d
6 or D
2O) and the rinsates were directly analyzed using
1H-NMR, no other significant products were detected. The authors have not yet resolved this material balance gap, which remains one of the challenges in cellulose pyrolysis. It is presumed that highly volatile intermediates, possibly lost during handling or analysis and mainly derived from levoglucosan, may be responsible for the missing mass. We hypothesize that such volatile intermediates, possibly present in the gas bag, are not well extracted by methanol and are not small enough in molecular weight to be detected using micro-GC.
When DBD plasma was applied, treatment at 16 W for 1 min led to a slight decrease in glycolaldehyde and a modest increase in gas yield, but the results were not significantly different from IR heating alone. In contrast, increasing the discharge power or extending the plasma treatment time to 3 min resulted in a pronounced decrease in both levoglucosan and glycolaldehyde, a slight increase in the methanol-insoluble fraction, and a substantial increase in gas yield. Under the conditions of 64 W for 3 min, levoglucosan and glycolaldehyde were almost completely eliminated, with the methanol-insoluble fraction reaching 14.0 wt% and the gas fraction reaching 72.6 wt%. This gas yield was more than four times that obtained with IR heating alone, indicating that DBD plasma significantly enhanced gasification. The increase in the methanol-insoluble fraction suggests that a portion of the levoglucosan underwent polymerization, while the rest was gasified. However, this large increase in gas yield cannot be explained solely by the gasification of levoglucosan and glycolaldehyde. As noted above, intermediates that were not detected but are presumed to be present in the system were also gasified in the plasma.
In conventional pyrolytic gasification, the non-reducing sugar levoglucosan is relatively stable in the gas phase, and temperatures above 600 °C are generally required for its gasification [
4]. In this study, as estimated in
Appendix B, the gas temperatures in the plasma region were at most 118 °C, 171 °C, and 240 °C at discharge powers of 16, 34, and 64 W, respectively. These results suggest that even at the maximum power of 64 W, the temperature remained substantially lower than that required for the thermal gasification of levoglucosan.
Nevertheless, it was demonstrated that DBD plasma treatment enabled the gasification of levoglucosan under such low-temperature conditions. However, it remains unclear whether this enhancement is attributable to collisions with high-energy electrons, interactions with excited Ar species, or a combination of both.
Given the low-temperature environment in this study, it is presumed that a portion of levoglucosan (boiling point: 385 °C [
22]) condensed into the liquid phase and subsequently underwent polymerization [
4], resulting in an increase in the methanol-insoluble fraction. For more efficient gasification, it is desirable that levoglucosan remains in the gas phase; thus, maintaining the reactor at a somewhat higher temperature may be advantageous. This represents an issue to be addressed in future investigations.
In our previous study using glow discharge plasma [
19], the complete gasification of Whatman cellulose was achieved without tar or char formation over 92 h. The gas temperature was approximately 50 °C, and since no pyrolysis occurred, the gasification reaction proceeded slowly, being limited to the solid cellulose surface. In contrast, the key feature of the present study is the significant enhancement in the gasification rate by applying DBD plasma to the volatile products generated from cellulose pyrolysis. This accelerated gasification is likely due to the more effective interaction between plasma and volatile intermediates, rather than the limited interaction with solid surfaces.


