Abstract
A multiparametric study was conducted on a hydrogen (H2) production rig designed to process 0.25 Nm3·h−1 of syngas. The rig consists of two Pd-Ag membrane permeator units and two Pd-Ag membrane reactor units for the water–gas shift (WGS) reaction, enabling a detailed and comprehensive analysis of its performance. The aim was to find the optimal conditions to maximize hydrogen production by WGS and its separation in a pure stream by varying the temperature, pressure, and steam-to-CO ratio (S/CO). Two syngas mixtures obtained from an updraft gasifier using different gasification agents (air–steam and oxy–steam) were used to investigate the effect of gas composition. The performance of the rig was investigated under nine combinations of temperature, pressure, and S/CO in the respective ranges of 300–350 °C, 2–8 bar, and 1.1–2 mol·mol−1, as planned with the help of design of experiment (DOE) software. The three parameters positively affected performance, both in terms of capacity to separate a pure stream of H2, reported as moles permeated per unit of surface area and time, and in producing new H2 from WGS, reported as moles of H2 produced per volume of catalyst unit and time. The highest yields were obtained using syngas from oxy–steam gasification, which had the highest H2 concentration and was free of N2.
1. Introduction
According to the Copernicus climate bulletin, 2024 has been the warmest year in history since the pre-industrial age, with global surface air temperatures above 1.5 °C [1]. The World Energy Outlook 2024, released by the International Energy Agency (IEA), reports that global CO2 emissions have remained the same since 2023, set as 38 Gt·y−1 [2]. Strategies to mitigate the effects of climate change include the decarbonization of many industrial sectors. The pathway to net-zero emissions is exceptionally narrow; remaining on this trajectory necessitates the immediate and extensive deployment of clean and energy-efficient technologies [3]. Hydrogen plays a crucial role in global decarbonization efforts due to its potential for production from renewable sources and its flexibility in usage [4]. As a fuel, hydrogen offers several advantages, including zero-carbon emissions and high efficiency, with only water produced as a by-product during its combustion [5]. Its higher energy density compared to other fuels makes it a promising solution for a range of applications, including aviation, ground transportation, and fuel cell technologies [6].
One of the most effective technologies for hydrogen production from renewable resources is biomass gasification [7]. Gasification technologies can be classified depending on the gasification medium and reactor type. The gasification process can employ a variety of gasifying media, including air, oxygen, steam, and supercritical water [8]. The main product of gasification is syngas, a mixture of mainly hydrogen (H2), carbon monoxide (CO), carbon dioxide (CO2), and methane (CH4). The syngas produced by biomass gasification has a wide range of application, including electricity generation, hydrogen production, and biofuel production [9]. Given the high efficiencies in biomass valorization from an energy standpoint, gasification plays a significant role.
Among the potential applications of syngas, the hydrogen supply chain is of particular significance, given the growing international focus on utilizing this energy vector. Nevertheless, the syngas produced by gasification contains impurities that render it unsuitable for direct use in applications that require only hydrogen. In this regard, further investigation is required to ascertain the optimal operational parameters to maximize H2 yields in the gasification process.
Additionally, a purification method must be introduced to obtain pure H2. In this field, H2 separation and purification technologies have made notable advancements in recent years. For instance, the utilization of H2 in fuel cell technologies requires higher purity, especially in Proton Exchange Membrane Fuel Cells (PEMFCs), where the membrane can be poisoned by contaminants such as carbon monoxide (CO) and hydrogen sulphide (H2S) [10,11]. The most common methods of hydrogen purification are pressure swing adsorption (PSA), cryogenic separation, and membrane separation [12]. Despite its widespread use, PSA has inherent limitations in terms of purity and recovery of H2, particularly at elevated temperatures. Cryogenic separation offers potential energy efficiency advantages; nevertheless, it is not yet a mature technology [13]. Similarly, membrane separation is a technology nearing industrial-scale application and is gaining increasing success in processes requiring syngas purification [14]. Permeable selective membranes are a valid alternative to PSA and cryogenic separation due to their more simplex layout, high energy efficiency, and scalability [12,15]. A variety of membrane types have been developed, each exhibiting distinctive characteristics and suitability for specific applications. Membrane separation technologies and their integration in chemical reactors, in particular palladium (Pd) membranes, have been widely reported in numerous reviews [15,16,17]. The separation of H2 in Pd membranes leverages the dissociation of H2 molecules, their subsequent diffusion through the surface of the membrane, and the subsequent re-association of the molecules on the opposite surface. This phenomenon is described by the solution–diffusion mechanism and modelled by the Sieverts law [18], as reported in Equation (1):
where A is the membrane surface in m2, t is the membrane thickness in m, pressure is expressed in Pa, and is the membrane permeability in mol·s−1·m−1·Pa−0.5. Some limitations of using Pd in H2 separation have been addressed by introducing its alloys, such as Pd-Ag, Pd-Cu, and Pd-Au, which offer enhanced thermal stability, a wider working temperature range, higher permeabilities, and improved selectivity for other species [19,20]. The H2 separation mechanism can be used in chemical reactors to increase product yield via progressive selective removal of the reaction products with the aim of process intensification [21,22]. Membranes offer the advantage of enhancing conversion by shifting the equilibrium, as they enable both the chemical reaction and hydrogen separation to occur simultaneously within the same reactor [23]. In traditional reactors, H2 production and purification are carried out in two steps, and due to the constraints of thermodynamics, kinetics, and heat transfer, achieving high purification is challenging. In methanol steam reforming, Pd-based membrane reactors are used to combine the reaction process with the selective separation of hydrogen in a single operation, overcoming thermodynamic and kinetic limitations of traditional reactors [24]. Similarly, other process use this effect, like ethanol steam reforming [25], methane steam reforming [26], ammonia decomposition [27,28], and the water–gas shift (WGS) reaction [29,30]. WGS is a reversible, exothermic reaction, as reported in Equation (2). It is used on industrial scales to increase the hydrogen yield from the methane steam reforming process. It is also used to upgrade syngas [31,32].
The aim of this study is to assess the performance of an H2 production system that incorporates a Pd-Ag membrane permeation unit, followed by a Pd-Ag membrane reactor unit, via a multiparametric analysis. Two biomass syngas mixtures obtained by different gasification methods were tested in multiple combinations of temperature, pressure, and S/CO to assess the impact of each parameter on the yields and to find the optimal operating conditions.
2. Materials and Methods
H2 permeation and WGS reaction tests were carried out on a rig located in the ENEA Trisaia Research Center in Rotondella (MT). A picture is shown in Figure 1, and a schematic representation of the test plant is in Figure 2. It consists of two lines, in each of which there is one Pd–Ag membrane permeator and one Pd–Ag membrane reactor filled with a catalyst for WGS. The rig has the ability to operate with permeators and reactors either in a tandem configuration or individually. The rig is designed to threat 0.25 Nm3·h−1 of syngas. The mixture is currently prepared with cylinders of H2, CO, CO2, CH4, and N2 with purity above 99.99%. The gases are sent to a mixer and to an electrical heater to reach the desired concentrations and temperature. Then, the mixture enters the membrane permeators and, after mixing with superheated steam, is sent to the membrane reactors.
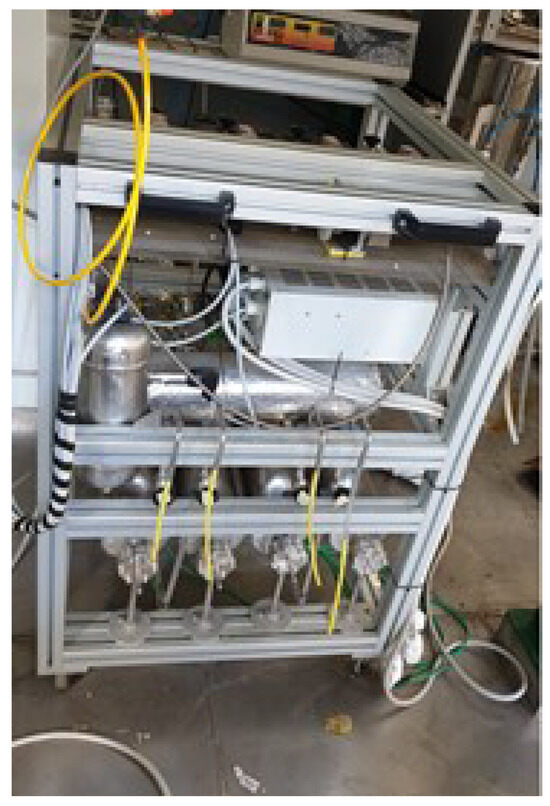
Figure 1.
Picture of the used rig.
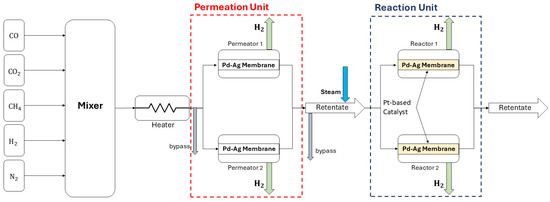
Figure 2.
Schematic representation of the used rig.
2.1. Description of the Plant and Test Procedures
Five thermal mass flow controllers and a pressure controller modulate the composition and the pressure of the feed gases. Four thermocouples placed inside membrane permeators and reactors measure the temperature used for control and regulation by electrical heaters in each unit. Superheated steam is produced by a heating track and pressurized via a N2 tank connected to a solenoid valve that opens when the pressure inside the tank is below a threshold value. Flowmeters are installed on each side of the permeator to measure permeated H2. At various points on the rig and on the retentate side of each unit, there are sampling points for online gas-chromatographic (GC) analysis.
At the core of the rig are the membrane permeation and membrane reactor units, the dimensions of which are reported in Table 1. They consist of an AISI 304L tube with a wall thickness of 1.5 mm and an external diameter of 25 mm, equipped with insulation and a heating system. Inside the tubes, self-supported Pd-Ag membranes are installed, fabricated by a metal cold rolling process and jointed by diffusion welding [33]. The permeable tubes manufactured by the patented treatment showed no defects in the junction (micro-holes and cracks), ensuring the total selectivity to hydrogen [34]. The heated gas is fed from the membrane lumen, and the hydrogen permeates selectively through the membrane toward the cloak, assisted by a void pump that maintains a pressure of 104 Pa in the permeate chamber. The interior of the membrane reactor houses the Pt catalyst supported on cylindrical pellets of ZrO2 with a size of 1.5 mm × 1.5 mm. The load of Pt on the pellet is 1% wt.

Table 1.
Dimensions of permeation and reaction units.
The test started by flowing N2 into the plant at 4 bar, followed by the gradual heating of membrane units, with steps of 50 °C up to 300 °C. Then, the Pd-Ag membranes were activated, feeding 10 g·h−1 of H2. In both permeation and reaction units, the integrity of the membranes and their hydrogen selectivity were verified using leak tests. These tests involved pressurizing the membrane with nitrogen and confirming, through GC analysis, the absence of any nitrogen flux in the permeate stream. The syngas mixture was prepared with the support of GC analysis to verify the concentrations, and the test began. At each experimental point, six to eight measurements of the retentate composition were performed at intervals of 10 min; the values were then averaged for data analysis. Correspondingly, measurements of pressure, temperature, mass flows, and permeate volumetric flow were recorded. More details about the test plant and experimental procedures are reported elsewhere [30].
2.2. Description of Tests
Permeation and reaction tests were carried out on syngas mixtures whose compositions were obtained from lignin gasification on a pilot scale updraft gasifier able to threat 20–30 kg·h−1 of biomass [35]. The two syngas, whose composition are reported in Table 2, were tested in permeation and reaction units in a tandem configuration. The syngas obtained with air-steam gasification was used for series a, while that obtained with oxy–steam gasification was used for series b [35].
Table 2.
Syngas composition and molar flow rates in mol·h−1 [35].
The tests were carried out under different combinations of temperature, pressure, and S/CO to investigate the rig’s performance with different syngas mixtures. Table 3 reports the ten experimental points obtained from the Design of Experiment (DOE). The temperature and pressure were investigated in ranges of 300 °C to 350 °C and 4 bar to 8 bar, respectively, and the S/CO ranged between 1 and 2. A proportion of 10% of steam was added to avoid sub-stoichiometric conditions. The central composite design of the DOE required duplication of the central point, so the 9 conditions became 10 points. The gas hourly space velocity (GHSV) was 3000 h−1. It was calculated based on the total volume of the reactor units and feed syngas mix.
Table 3.
DOE followed in experimental tests.
The results are analysed and presented considering single units or the whole process according to the cases. Microsoft Excel was used for data analysis, and MATLAB R2023b was used for data processing and the creation of 3D plots. The H2 production by the permeators and membrane reactors and the performance of the process are evaluated using different parameters. The permeated H2 molar flow rate is presented according to its origin (from the permeation unit or reaction unit in terms) of molar flow rate and molar flow rate per permeation surface unit. Moreover, the total H2 produced by the WGS is also presented in terms of H2 produced per unit of catalyst volume. The CO conversion ratio, as reported in Equation (3), measures the efficiency of WGS reaction conversion in the membrane reactor. It is expressed by the fraction of converted CO with respect to the CO in the stream feeding the reactor.
where is the molar flow rate of CO in the feed stream and is the molar flow rate of CO at the exit of the membrane reactor.
3. Results
The composition of the two syngas mixtures tested in the plant are reported in Table 2. They had different concentrations of the reactants, so different behaviours towards hydrogen permeation and CO conversion ratio were expected. Table 4 reports the H2 molar flow rates according to the origin (from the permeation unit or from the reaction unit) and the H2 produced in the reaction unit considering the WGS reaction. Series a and series b shared the best conditions for H2 permeation, which were those of point 9 in the DOE (Table 3), which corresponded to the highest pressure, temperature, and S/CO. The highest permeated flow rate of H2 was obtained in series b because of the highest starting H2 concentration (37.3% vol.) that favoured H2 separation in the permeation unit. In the reaction unit, the mixture with the highest permeated H2 was series b according to the higher partial pressure of H2. This finding was confirmed by analysing the H2 produced in the WGS reaction, which was higher for series b.
Table 4.
H2 molar flow rates in mol·h−1. P stands for permeation unit, R for reaction Unit, and WGS for the H2 produced during the WGS reaction in the reaction unit.
Figure 3a,b show the productivity of the plant in terms of H2 separated per surface unit and time in mol·h−1·m−2 in the permeation unit and reaction unit in both series. In the case of series a, the H2 molar flow rate permeated per surface unit was, on average, 15% of the H2 permeated in the reaction unit. In series b, it was 21%. While the difference in performance between the two series can be explained by the high H2 content in series b, the significant difference in H2 separation performance between the permeation and reaction units within each series is not straightforward. The production of new H2 in the reactor cannot explain this large difference. On the other hand, it has been reported in the literature that H2 permeation across Pd-Ag is sensitive to CO poisoning, as there is a higher coverage of CO and fewer available sites for H2 adsorption [36,37]. The reduction in CO concentration by WGS in the reactor was found to be pivotal in making available more surface area for H2 adsorption and permeation. The comparison of the total H2 flow rate shown in Figure 3c exhibits higher values for series b, confirming the impact of the highest H2 partial pressure on the performance of the whole rig in separating pure H2. In both series, the best conditions resulted those of point 9. The adopted configuration enabled to separate in the best combination of temperature, pressure, and S/CO 43 mol·m−2·h−1 of H2 for series b and 34 mol·m−2·h−1 for series a, respectively. These findings are encouraging for the scaling up of the membrane technology [38]. The productivity of H2 in the reaction unit is reported in Figure 3d as H2 moles per unit of time and volume of catalyst (mol·h−1·dm−3). Series b showed the highest performances—in particular, at points 9 and 7—while series a showed the highest values at points 9 and 4. All of these points correspond to the highest S/CO.
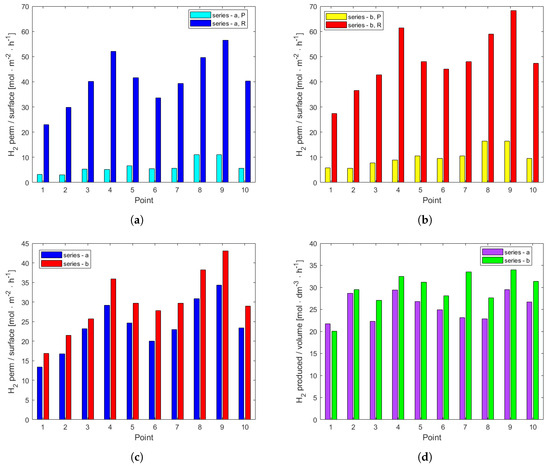
Figure 3.
(a) Permeation of H2 per unit of surface and time divided per permeation unit (P) and reaction unit (R) for series a. (b) Permeation of H2 per unit of surface and time divided per permeation unit (P) and reaction unit (R) for series b. (c) Overall H2 molar flow rate permeated per unit of surface and time. (d) H2 produced in the reaction unit per unit of catalyst volume and time.
The CO conversion ratio for both tests is reported in Table 5, followed by a parametric analysis to determine the effects of temperature, pressure, and S/CO, as shown in Figure 4. Series a is characterized by the highest CO conversion ratio because of the highest CO/H2 ratio in the feeding. The conditions under which the highest CO conversion was achieved are those of point 9 for series a and series b, with conversions 0.984 and 0.972, respectively. The dominant parameter affecting WGS was the S/CO, as can be highlighted by the CO conversion ratio at points characterized by the highest values of this parameter (points 2, 4, 7, and 9), while the lower CO conversion ratio at point 1 corresponded to lower values of S/CO (0.725 for series a and 0.574 for series b). Temperature and pressure exhibited a positive effect on the CO conversion ratio, in agreement with the Sieverts law and permeability kinetics. On the other hand, a negative effect of temperature was expected based on considerations of the thermodynamics of the WGS. The combination of the two opposite trends resulted in a maximum at 325 °C for both mixtures (Figure 4a).
Table 5.
CO conversion ratio of the two tested series.
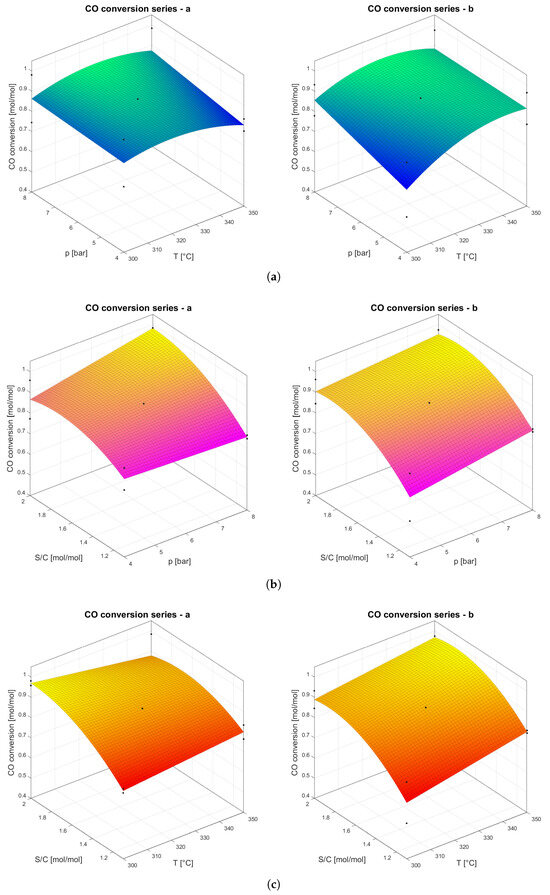
Figure 4.
Impact analysis of temperature, pressure, and S/CO for series a and series b. Black dots are the experimental data. (a) CO conversion ratio versus temperature and pressure. (b) CO conversion ratio versus pressure and S/CO. (c) CO conversion ratio versus temperature and S/CO.
This finding represents a significant improvement over previous work, which utilized a six-point DOE applied to three parameters. That method generated only planes in 3D space, highlighting solely positive or negative dependencies, with minima and maxima constrained to the extremes of the investigated ranges [30]. By employing a 10-point DOE in this study, we achieved a more refined analysis, enabling the interpolation of experimental data using second-order polynomials. This approach allowed us to identify maxima within the experimental range, providing more precise and insightful results. Pressure had a positive but limited effect on the CO conversion ratio, as shown in Figure 4b, confirming that it does not affect the thermodynamics of the WGS, influencing only H2 permeation through membranes.
Compared to PSA, Pd membranes offer distinct advantages and limitations in hydrogen separation. Pd membranes achieve higher hydrogen purity, often reaching 99.999 %, due to their selective solution–diffusion mechanism. This level of purity is particularly challenging for PSA systems to achieve, especially when the feed gas contains a mix of contaminants. PSA technology excels in hydrogen recovery efficiency, typically providing a recovery rate of 70–95 %. However, PSA systems require multiple adsorbent beds and complex pressure equalization steps, leading to higher operational complexity [39]. In contrast, Pd membranes are simpler in operation and more compact, although their hydrogen recovery rates depend on factors such as pressure and temperature. Pd membranes operate effectively in elevated temperature ranges (350–500 °C), aligning well with processes like steam methane reforming or water gas shift reactions [23]. PSA systems, while operating at ambient or slightly elevated temperatures, rely on rapid pressure changes, making them energy-intensive and less efficient in scenarios requiring high hydrogen purity. Moreover, PSA is more tolerant of feed gas impurities like sulphur compounds and carbon dioxide compared to Pd membranes, which suffer performance losses in the presence of contaminants [40]. This difference often makes PSA systems the choice for large-scale, high-throughput applications, while Pd membranes are favoured for scenarios demanding the highest hydrogen purity with moderate throughput [41].
4. Conclusions
Two biomass gasification-derived syngas mixtures were tested in an H2 production rig composed of two self-supported Pd-Ag membrane permeators and two self-supported Pd-Ag membrane reactors filled with Pt-based catalyst to carry out the WGS reaction. The performance of the plant was investigated at nine different experimental points in the ranges of 300–350 °C, 4–8 bar, and 1.1–2 mol·mol−1 of the S/CO ratio. The amount of H2 separated and produced per unit of membrane surface and catalyst volume was measured. The advancement of the WGS reaction was evaluated by the CO conversion ratio, and the best conditions were assessed through an impact analysis.
The performance of the rig was higher using syngas from oxy–steam gasification, in terms of both the flow of permeated pure hydrogen and newly produced H2 from the WGS, which reached values of 59 mol·m−2·h−1 in the reaction section and 34 mol·dm−3·h−1. The difference can be explained by the higher H2 concentration, the absence of N2, and the lower CO/H2 ratio in the syngas from oxy-gasification. The best conditions for H2 separation were identified at the extreme of the investigated ranges, namely 350 °C, 8 bar, and an S/CO of 2. As regards the WGS, the analysis of the impacts of temperature, pressure, and S/CO on the CO conversion ratio indicated a maximum at 325 °C, confirming the coexistence of two opposite effects: the exothermicity of the WGS, which implies higher conversion ratios at lower temperatures, and H2 separation via Pd-based membranes, which is favoured by increasing temperatures. The permeation of H2 in the reaction unit were one order of magnitude higher than those measured in the permeation unit. The effect of newly produced H2 in the reactor is not sufficient to explain this significant difference. Instead, it can be attributed to the strong competitive effect of CO adsorption on the membrane surface, which hinders H2 permeation across Pd-Ag membranes. The results confirmed the effectiveness of using membrane reactors for H2 synthesis by WGS and for its separation as a pure stream. Clear indications of the advantages of using syngas from oxy–steam gasification were obtained. The preliminary permeation step does not significantly improve the performance of the whole process because of to the poisoning effect of CO that limits the permeation potential of the membrane, which is, instead, better leveraged in the membrane reactor. While PSA is currently the standard technique for H2 separation, for large-scale, high-throughput applications this study confirms the superior performance of Pd membrane technology, particularly in terms of purity of the hydrogen stream and process intensification. Furthermore, its unique ability to improve conversion yields through the selective removal of products offers a significant competitive advantage. This capability is driving research efforts to achieve a substantial reduction in capital expenditure (CAPEX), which remains the main obstacle to the broader adoption of this technology.
Author Contributions
Conceptualization, N.C., L.C. and F.Z.; methodology, F.Z. and G.D.Z.; software, G.D.Z. and C.F.; validation, N.C., L.C., F.Z. and L.F.; formal analysis, C.F. and G.D.Z.; investigation, G.D.Z., C.F. and F.Z.; resources, N.C., L.C. and F.Z.; funding acquisition, N.C. and F.Z.; data curation, G.D.Z., C.F. and F.Z.; writing—original draft preparation, G.D.Z. and C.F.; writing—review and editing, N.C., L.C., F.Z. and L.F.; visualization, G.D.Z. and C.F.; supervision, N.C. and F.Z.; project administration, N.C., L.C. and F.Z. All authors have read and agreed to the published version of the manuscript.
Funding
This work was funded by the Italian Ministry of the Environment and Energy Security, program agreement MiTE-ENEA, PNRR—Hydrogen Research—Mission M2-C4—Investment 3.5: Research and development on hydrogen.
Data Availability Statement
No additional data was created.
Acknowledgments
Carlo Limonti is gratefully acknowledged for assistance in language revision.
Conflicts of Interest
The authors declare no conflicts of interest.
Abbreviations
The following abbreviations are used in this manuscript:
| IEA | International Energy Agency |
| PEMFC | Proton Exchange Membrane Fuel Cell |
| PSA | Pressure Swing Adsorption |
| WGS | Water–Gas Shift |
| GC | Gas-chromatographic |
| S/CO | Steam-to-CO ratio |
| DOE | Design Of Experiment |
| GHSV | Gas Hourly Space Velocity |
| CAPEX | CAPital EXpenditure |
References
- Copernicus Climate Change Service. Copernicus: 2024 Virtually Certain to be Warmest Year and First Year Above 1.5 °C. 2024. Available online: https://climate.copernicus.eu/copernicus-2024-virtually-certain-be-warmest-year-and-first-year-above-15degc (accessed on 27 November 2024).
- International Energy Agency. World Energy Outlook 2024. 2024. Available online: https://www.iea.org/reports/world-energy-outlook-2024 (accessed on 27 November 2024).
- International Energy Agency. Net Zero by 2050: A Roadmap for the Global Energy Sector. 2021. Available online: https://www.iea.org/reports/net-zero-by-2050 (accessed on 27 November 2024).
- Ishaq, H.; Dincer, I.; Crawford, C. A review on hydrogen production and utilization: Challenges and opportunities. Int. J. Hydrogen Energy 2022, 47, 26238–26264. [Google Scholar] [CrossRef]
- Rubinsin, N.J.; Karim, N.A.; Timmiati, S.N.; Lim, K.L.; Isahak, W.N.R.W.; Pudukudy, M. An overview of the enhanced biomass gasification for hydrogen production. Int. J. Hydrogen Energy 2024, 49, 1139–1164. [Google Scholar] [CrossRef]
- Baroutaji, A.; Wilberforce, T.; Ramadan, M.; Olabi, A.G. Comprehensive investigation on hydrogen and fuel cell technology in the aviation and aerospace sectors. Renew. Sustain. Energy Rev. 2019, 106, 31–40. [Google Scholar] [CrossRef]
- Rauch, R.; Kiros, Y.; Engvall, K.; Kantarelis, E.; Brito, P.; Nobre, C.; Santos, S.M.; Graefe, P.A. Hydrogen from Waste Gasification. Hydrogen 2024, 5, 70–101. [Google Scholar] [CrossRef]
- Mishra, S.; Upadhyay, R.K. Review on biomass gasification: Gasifiers, gasifying mediums, and operational parameters. Mater. Sci. Energy Technol. 2021, 4, 329–340. [Google Scholar] [CrossRef]
- AlNouss, A.; McKay, G.; Al-Ansari, T. A techno-economic-environmental study evaluating the potential of oxygen-steam biomass gasification for the generation of value-added products. Energy Convers. Manag. 2019, 196, 664–676. [Google Scholar] [CrossRef]
- Jamal, T.; Shafiullah, G.; Dawood, F.; Kaur, A.; Arif, M.T.; Pugazhendhi, R.; Elavarasan, R.M.; Ahmed, S.F. Fuelling the future: An in-depth review of recent trends, challenges and opportunities of hydrogen fuel cell for a sustainable hydrogen economy. Energy Rep. 2023, 10, 2103–2127. [Google Scholar] [CrossRef]
- Fan, L.; Tu, Z.; Chan, S.H. Recent development of hydrogen and fuel cell technologies: A review. Energy Rep. 2021, 7, 8421–8446. [Google Scholar] [CrossRef]
- Naquash, A.; Qyyum, M.A.; Chaniago, Y.D.; Riaz, A.; Yehia, F.; Lim, H.; Lee, M. Separation and purification of syngas-derived hydrogen: A comparative evaluation of membrane- and cryogenic-assisted approaches. Chemosphere 2023, 313, 137420. [Google Scholar] [CrossRef] [PubMed]
- Naquash, A.; Haider, J.; Qyyum, M.A.; Islam, M.; Min, S.; Lee, S.; Lim, H.; Lee, M. Hydrogen enrichment by CO2 anti-sublimation integrated with triple mixed refrigerant-based liquid hydrogen production process. J. Clean. Prod. 2022, 341, 130745. [Google Scholar] [CrossRef]
- Iulianelli, A.; Drioli, E. Membrane engineering: Latest advancements in gas separation and pre-treatment processes, petrochemical industry and refinery, and future perspectives in emerging applications. Fuel Process. Technol. 2020, 206, 106464. [Google Scholar] [CrossRef]
- Cerone, N.; Zito, G.D.; Florio, C.; Fabbiano, L.; Zimbardi, F. Recent Advancements in Pd-Based Membranes for Hydrogen Separation. Energies 2024, 17, 4095. [Google Scholar] [CrossRef]
- Król, A.; Gajec, M.; Holewa-Rataj, J.; Kukulska-Zając, E.; Rataj, M. Hydrogen Purification Technologies in the Context of Its Utilization. Energies 2024, 17, 3794. [Google Scholar] [CrossRef]
- Binazadeh, M.; Mamivand, S.; Sohrabi, R.; Taghvaei, H.; Iulianelli, A. Membrane reactors for hydrogen generation: From single stage to integrated systems. Int. J. Hydrogen Energy 2023, 48, 39225–39253. [Google Scholar] [CrossRef]
- Helmi, A. Sieverts’ Law. In Encyclopedia of Membranes; Drioli, E., Giorno, L., Eds.; Springer: Berlin/Heidelberg, Germany, 2015; pp. 1–2. [Google Scholar] [CrossRef]
- Habib, M.A.; Harale, A.; Paglieri, S.; Alrashed, F.S.; Al-Sayoud, A.; Rao, M.V.; Nemitallah, M.A.; Hossain, S.; Hussien, M.; Ali, A.; et al. Palladium-Alloy Membrane Reactors for Fuel Reforming and Hydrogen Production: A Review. Energy Fuels 2021, 35, 5558–5593. [Google Scholar] [CrossRef]
- Bosko, M.L.; Dalla Fontana, A.; Tarditi, A.; Cornaglia, L. Advances in hydrogen selective membranes based on palladium ternary alloys. Int. J. Hydrogen Energy 2021, 46, 15572–15594. [Google Scholar] [CrossRef]
- Lin, Y.S. Inorganic Membranes for Process Intensification: Challenges and Perspective. Ind. Eng. Chem. Res. 2019, 58, 5787–5796. [Google Scholar] [CrossRef]
- Khoiruddin, K.; Kadja, G.T.; Ismadji, S.; Wenten, I.G. Enhanced hydrogen production in membrane reactors: A novel approach. Int. J. Hydrogen Energy 2024, 83, 946–966. [Google Scholar] [CrossRef]
- Jokar, S.; Farokhnia, A.; Tavakolian, M.; Pejman, M.; Parvasi, P.; Javanmardi, J.; Zare, F.; Gonçalves, M.C.; Basile, A. The recent areas of applicability of palladium based membrane technologies for hydrogen production from methane and natural gas: A review. Int. J. Hydrogen Energy 2023, 48, 6451–6476. [Google Scholar] [CrossRef]
- Wang, C.; Weng, J.; Liao, M.; Luo, Q.; Luo, X.; Tian, Z.; Shu, R.; Chen, Y.; Du, Y. Configuration of coupling methanol steam reforming over Cu-based catalyst in a synthetic palladium membrane for one-step high purity hydrogen production. J. Energy Inst. 2023, 108, 101245. [Google Scholar] [CrossRef]
- Jia, H.; Xu, H.; Sheng, X.; Yang, X.; Shen, W.; Goldbach, A. High-temperature ethanol steam reforming in PdCu membrane reactor. J. Membr. Sci. 2020, 605, 118083. [Google Scholar] [CrossRef]
- Wu, H.C.; Rui, Z.; Lin, J.Y. Hydrogen production with carbon dioxide capture by dual-phase ceramic-carbonate membrane reactor via steam reforming of methane. J. Membr. Sci. 2020, 598, 117780. [Google Scholar] [CrossRef]
- Park, Y.; Cha, J.; Oh, H.T.; Lee, T.; Lee, S.H.; Park, M.G.; Jeong, H.; Kim, Y.; Sohn, H.; Nam, S.W.; et al. A catalytic composite membrane reactor system for hydrogen production from ammonia using steam as a sweep gas. J. Membr. Sci. 2020, 614, 118483. [Google Scholar] [CrossRef]
- Cechetto, V.; Di Felice, L.; Gutierrez Martinez, R.; Arratibel Plazaola, A.; Gallucci, F. Ultra-pure hydrogen production via ammonia decomposition in a catalytic membrane reactor. Int. J. Hydrogen Energy 2022, 47, 21220–21230. [Google Scholar] [CrossRef]
- Yoo, J.Y.; Lee, J.; Han, G.; Harale, A.; Katikaneni, S.; Paglieri, S.N.; Bae, J. On-site hydrogen production using heavy naphtha by maximizing the hydrogen output of a membrane reactor system. J. Power Sources 2021, 508, 230332. [Google Scholar] [CrossRef]
- Cerone, N.; Zimbardi, F.; Contuzzi, L.; Tosti, S.; Fabbiano, L.; Zito, G.D.; Carnevale, M.O.; Valerio, V. Pre-pilot scale study of hydrogen production from biomass syngas via water-gas shift in Pd–Ag catalytic membrane reactor and dedicated hydrogen permeation unit. Int. J. Hydrogen Energy 2024, 95, 1204–1214. [Google Scholar] [CrossRef]
- Baraj, E.; Ciahotný, K.; Hlinčík, T. The water gas shift reaction: Catalysts and reaction mechanism. Fuel 2021, 288, 119817. [Google Scholar] [CrossRef]
- Lee, Y.L.; Kim, K.J.; Hong, G.R.; Roh, H.S. Target-oriented water–gas shift reactions with customized reaction conditions and catalysts. Chem. Eng. J. 2023, 458, 141422. [Google Scholar] [CrossRef]
- Vadrucci, M.; Borgognoni, F.; Moriani, A.; Santucci, A.; Tosti, S. Hydrogen permeation through Pd–Ag membranes: Surface effects and Sieverts’ law. Int. J. Hydrogen Energy 2013, 38, 4144–4152. [Google Scholar] [CrossRef]
- Tosti, S.; Bettinali, L.; Lecci, D.; Violante, V.; Marini, F. Method of Diffusion Bonding Thin Foils Made of Metal Alloys Selectively Permeable to Hydrogen, Particularly Providing Membrane Devices, and Apparatus for Carrying out the Same. European Patent EP1184125A1, 11 July 2002. [Google Scholar]
- Cerone, N.; Zimbardi, F.; Contuzzi, L.; Prestipino, M.; Carnevale, M.O.; Valerio, V. Air-steam and oxy-steam gasification of hydrolytic residues from biorefinery. Fuel Process. Technol. 2017, 167, 451–461. [Google Scholar] [CrossRef]
- Sánchez, J.; Barreiro, M.; Maroño, M. Bench-scale study of separation of hydrogen from gasification gases using a palladium-based membrane reactor. Fuel 2014, 116, 894–903. [Google Scholar] [CrossRef]
- Easa, J.; Yan, C.; Schneider, W.F.; O’Brien, C.P. CO and C3H6 poisoning of hydrogen permeation across Pd77Ag23 alloy membranes: A comparative study with pure palladium. Chem. Eng. J. 2022, 430, 133080. [Google Scholar] [CrossRef]
- Narcisi, V.; Farina, L.; Santucci, A. On the Scalability of a Membrane Unit for Ultrapure Hydrogen Separation. Hydrogen 2024, 5, 149–162. [Google Scholar] [CrossRef]
- Wu, W.; Chen, S.; Niu, Z.; Zhang, D.; Tang, Z.; Li, W. A high-productivity PSA process configuration for H2 purification. Fuel 2024, 356, 129566. [Google Scholar] [CrossRef]
- Shabbani, H.J.K.; Othman, M.R.; Al-Janabi, S.K.; Barron, A.R.; Helwani, Z. H2 purification employing pressure swing adsorption process: Parametric and bibliometric review. Int. J. Hydrogen Energy 2024, 50, 674–699. [Google Scholar] [CrossRef]
- Amin, M.; Butt, A.S.; Ahmad, J.; Lee, C.; Azam, S.U.; Mannan, H.A.; Naveed, A.B.; Farooqi, Z.U.R.; Chung, E.; Iqbal, A. Issues and challenges in hydrogen separation technologies. Energy Rep. 2023, 9, 894–911. [Google Scholar] [CrossRef]
Disclaimer/Publisher’s Note: The statements, opinions and data contained in all publications are solely those of the individual author(s) and contributor(s) and not of MDPI and/or the editor(s). MDPI and/or the editor(s) disclaim responsibility for any injury to people or property resulting from any ideas, methods, instructions or products referred to in the content. |
© 2025 by the authors. Licensee MDPI, Basel, Switzerland. This article is an open access article distributed under the terms and conditions of the Creative Commons Attribution (CC BY) license (https://creativecommons.org/licenses/by/4.0/).