Article

Effect of Hydrogen Co-Firing with Natural Gas on Thermal Efficiency and CO2 Emissions in Gas Turbine Power Plant

by
Rizcky Rahadian Nugraha
1,2,*,
S. Silviana
1,3 and
Widayat Widayat
1,3
1
Master Program of Energy, School of Postgraduate Studies, Diponegoro University, Semarang 50241, Indonesia
2
Engineering Department, Cilegon Combined Cycle Power Plant, PLN Indonesia Power, Cilegon 42455, Indonesia
3
Department of Chemical Engineering, Faculty of Engineering, Diponegoro University, Semarang 50275, Indonesia
*
Author to whom correspondence should be addressed.
Hydrogen 2025, 6(1), 18; https://doi.org/10.3390/hydrogen6010018
Submission received: 9 March 2025 / Revised: 17 March 2025 / Accepted: 17 March 2025 / Published: 19 March 2025

Abstract

:
The Indonesian government has established an energy transition policy for decarbonization, including the target of utilizing hydrogen for power generation through a co-firing scheme. Several studies indicate that hydrogen co-firing in gas-fired power plants can reduce CO2 emissions while improving efficiency. This study develops a simulation model for hydrogen co-firing in an M701F gas turbine at the Cilegon power plant using Aspen HYSYS. The impact of different hydrogen volume fractions (5–30%) on thermal efficiency and CO2 emissions is analyzed under varying operational loads (100%, 75%, and 50%). The simulation results show an increase in thermal efficiency with each 5% increment in the hydrogen fraction, averaging 0.32% at 100% load, 0.34% at 75% load, and 0.37% at 50% load. The hourly CO2 emission rate decreased by an average of 2.16% across all operational load variations for every 5% increase in the hydrogen fraction. Meanwhile, the average reduction in CO2 emission intensity at the 100%, 75%, and 50% operational loads was 0.017, 0.019, and 0.023 kg CO2/kWh, respectively.

1. Introduction

The primary energy mix in Indonesia remains dominated by fossil energy, accounting for 87.70%, consisting of coal (42.38%), petroleum (31.40%), and natural gas (13.92%). In contrast, the contribution of New and Renewable Energy (NRE) remains relatively low at 12.30% [1]. The realization of NRE has declined by 1.1% compared to the previous year [2], which is inconsistent with the government’s policy targeting an optimal primary energy mix with a 23% share of NRE by 2025 and 31% by 2050 to achieve Net Zero Emissions (NZEs) by 2060 [3]. The high reliance on fossil energy results in significant greenhouse gas emissions. Greenhouse gases consist of carbon dioxide (CO2), methane (CH4), nitrous oxide (N2O), and fluorinated gases (F-gases) [4], which contribute to global warming when present in the atmosphere [5]. Since 1990, the energy sector has been the highest contributor to global greenhouse gas emissions, reaching 34% in 2019 [6]. Approximately 95% of total greenhouse gas emissions in the energy sector comprise CO2 generated from fossil fuel combustion [7]. In Indonesia, the electricity sector contributes the highest CO2 emissions, accounting for 43% of total national emissions [8]. This condition is attributed to power plants still relying on coal (67.21%), natural gas (15.96%), and petroleum (3.54%) [9]. Mitigation programs to reduce emissions include improving energy efficiency and transitioning to renewable energy [10]. In line with this, the Indonesian government has implemented policies to accelerate the development of renewable energy for electricity supply, particularly in coal-fired power plants [11]. One potential alternative energy source to replace coal in Indonesia is biomass [12]. Meanwhile, Indonesia Fuel Cell and Hydrogen Energy (IFHE) [13] aims to utilize hydrogen as a form of NRE in various sectors, including power generation. Hydrogen energy transition can be applied in gas-fired power plants through fuel switching (co-firing) using technological engineering [14].
Hydrogen is a clean and environmentally friendly energy source that can be co-fired with natural gas in gas turbine power plants [15]. Natural gas, primarily composed of methane [16], can be homogeneously blended with hydrogen without phase separation, providing combustion advantages [17]. Hydrogen’s calorific value is approximately 2.76 times higher than natural gas [18], varying depending on impurity levels [19] and production and transportation methods [20]. However, for application as a fuel in power generation, ISO 14687 requires hydrogen to meet a minimum purity of 99.90% [21]. Hydrogen has a lower molecular weight than natural gas but a higher calorific value, resulting in a higher energy density [22]. Consequently, less fuel is required to produce the same energy output, making hydrogen–natural gas co-firing beneficial for thermal efficiency improvement [23]. Nevertheless, hydrogen has a low specific heat capacity [24] and a lower minimum ignition energy, posing a risk of premature ignition during combustion [25]. Typically, the hydrogen co-firing ratio is limited due to gas turbine constraints [26] to mitigate flashback risks caused by hydrogen’s higher combustion velocity than natural gas [27], especially in premixed combustor type gas turbines [28].
Jeong et al. [15] conducted simulations of hydrogen co-firing with natural gas on Mitsubishi H-25, M501F, and M501JAC gas turbines using software. The results indicated that hydrogen co-firing could enhance the efficiency of a gas turbine power plant by 1.42% in open-cycle mode and 0.42% in combined-cycle mode under a constant turbine inlet temperature scenario of 1650 °C in the M501JAC gas turbine. This improvement is due to the increased hydrogen ratio, which raises the pressure ratio in the gas turbine, leading to higher power output. Mendoza Morales, Blondeau, and De Paepe [29] conducted a similar simulation under a constant turbine inlet temperature scenario, revealing that hydrogen co-firing could increase power output by 5.54% and efficiency by 2.26%. A simulation on the GE MS5002C gas turbine by Amrouche, Boudjemaa, and Bari [30] demonstrated that 60% hydrogen co-firing could enhance thermal efficiency by 2.9%. Ahmad, Darmanto, and Juangsa [14] simulated hydrogen co-firing on the Mitsubishi H-25 gas turbine under a constant turbine inlet temperature scenario, showing that every 5% increase in hydrogen fraction (on a calorific basis) reduces CO2 emissions by 6%, though an increase in NOx emissions accompanies it. NOx emissions typically occur at high combustion temperatures exceeding 1500 °C [31]. Babahammou, Merabet, and Miles [32] used Aspen HYSYS simulations on the GE 9FA gas turbine under a constant turbine outlet temperature scenario and found that a 20% hydrogen volume addition reduced fuel flow rate by 4.5% and CO2 emissions by 14%. Alikulov et al. [33] stated that Aspen HYSYS simulations showed hydrogen co-firing could significantly increase turbine power output and reduce CO2 emissions. CO2 emission reduction occurs because hydrogen combustion primarily produces water vapor [34], significantly decreasing released CO2 emissions [35], particularly for green hydrogen [36]. Park, Choi, and Choi [37] affirmed that hydrogen co-firing effectively reduces emissions, as demonstrated in simulations on Mitsubishi J-class gas turbines.
The Cilegon Gas Turbine Power Plant (GTPP) is one of Indonesia’s power plants using natural gas as its primary fuel. The Cilegon GTPP emits up to 1.9 million tons of CO2 annually, with an intensity of 0.67 kg CO2/kWh [38], exceeding the global average of 0.52 kg CO2/kWh [39]. In this context, hydrogen co-firing presents a potential solution for emission reduction, warranting comprehensive study. Previous studies have examined the simulation of hydrogen co-firing with natural gas for specific types of gas turbines. However, none have focused on the Mitsubishi M701F series gas turbine, as installed at the Cilegon GTPP. Additionally, prior simulation scenarios have been conducted under conditions of constant turbine inlet temperature and constant turbine exhaust temperature. In contrast, the approach with a constant excess air ratio has not yet been simulated. This research simulates hydrogen co-firing with natural gas in the Mitsubishi M701F gas turbine installed at the Cilegon GTPP, with a rated capacity of 238,500 kW. The simulation utilizes the Aspen HYSYS software, which is widely used for accurately modeling and simulating power generation processes [40]. The simulation considers hydrogen volume fractions up to 30% under constant excess air ratio conditions, with variations in operational load. The analysis of simulation results focuses on two aspects: the effect of the hydrogen co-firing ratio on cycle thermal efficiency and the effect on the emission rate and CO2 emission intensity.

2. Materials and Methods

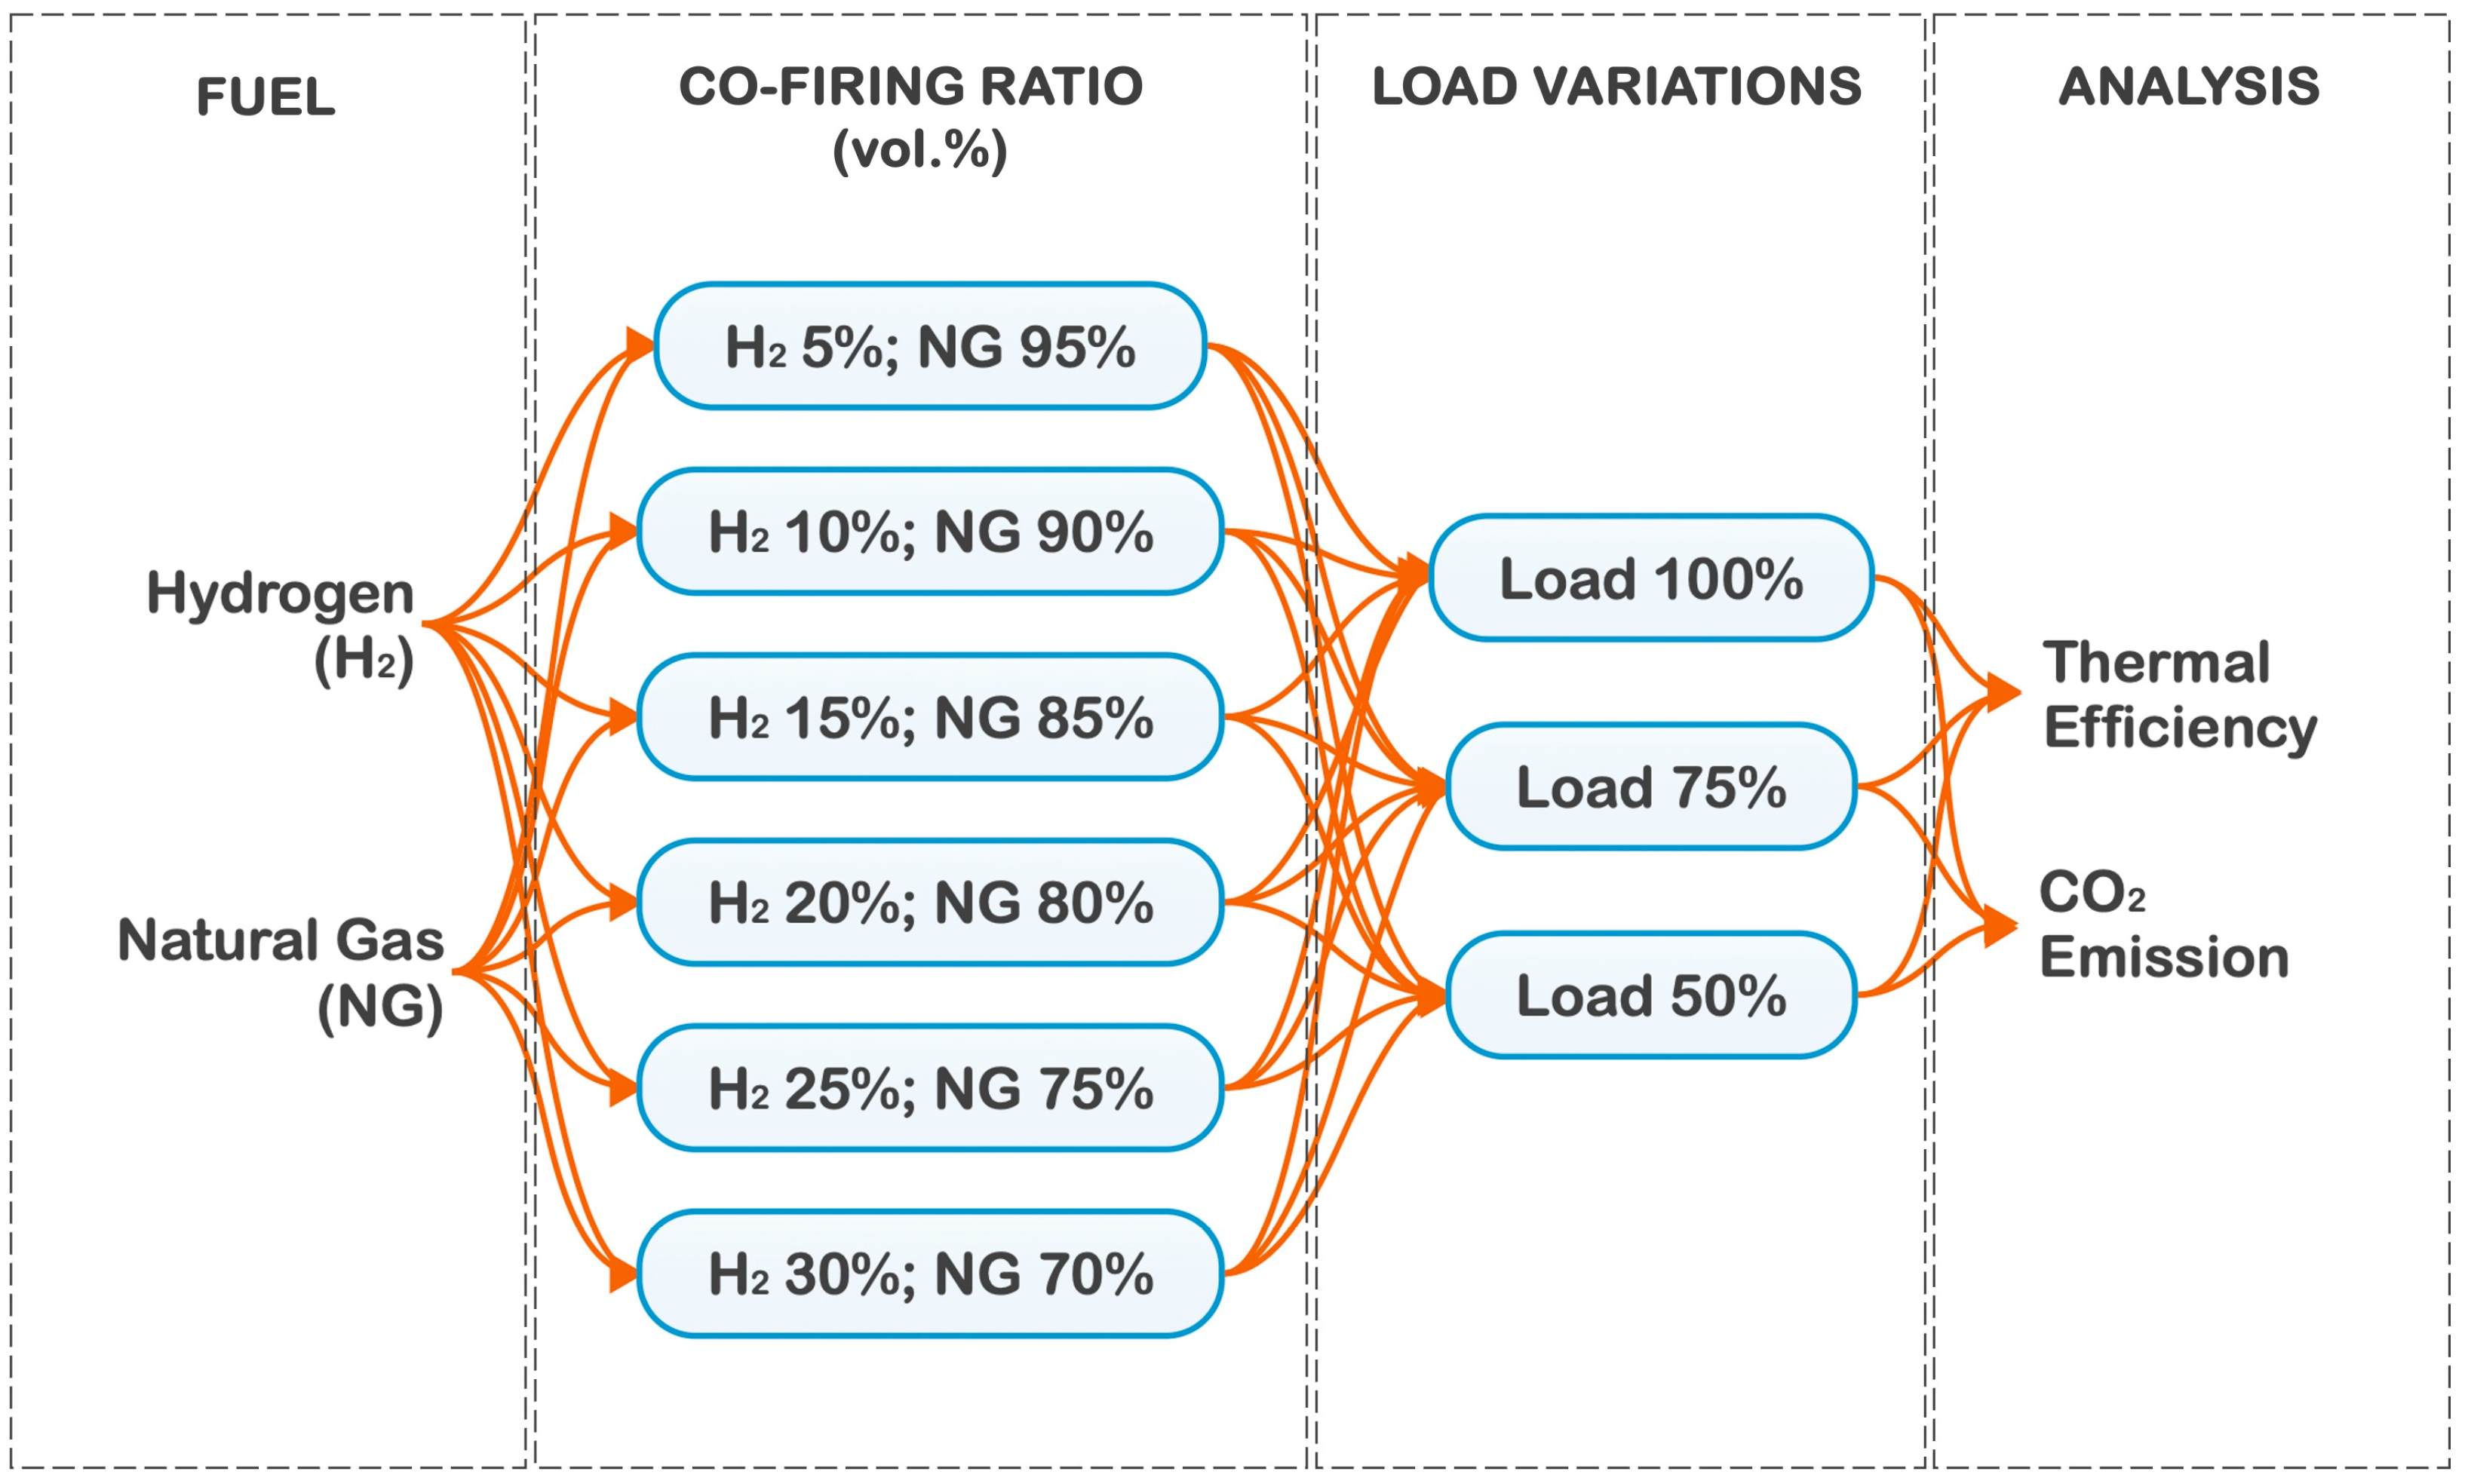
2.1. Case Description

This study involves a simulation of hydrogen co-firing with natural gas in an M701F gas turbine with a capacity of 238,500 kW using the Aspen HYSYS V12.1 software. The simulation is conducted for six variations of hydrogen volume fractions under a constant excess air ratio. The hydrogen fractions considered are 5%, 10%, 15%, 20%, 25%, and 30%, each simulated at three different operational load conditions: 100%, 75%, and 50%. The scope of the simulation analysis focuses on two key aspects: the effect of the hydrogen co-firing on cycle thermal efficiency and the effect of the hydrogen co-firing on CO2 emissions produced by the gas turbine, expressed in terms of emission rate and emission intensity. The detailed co-firing scenario is illustrated in Figure 1.

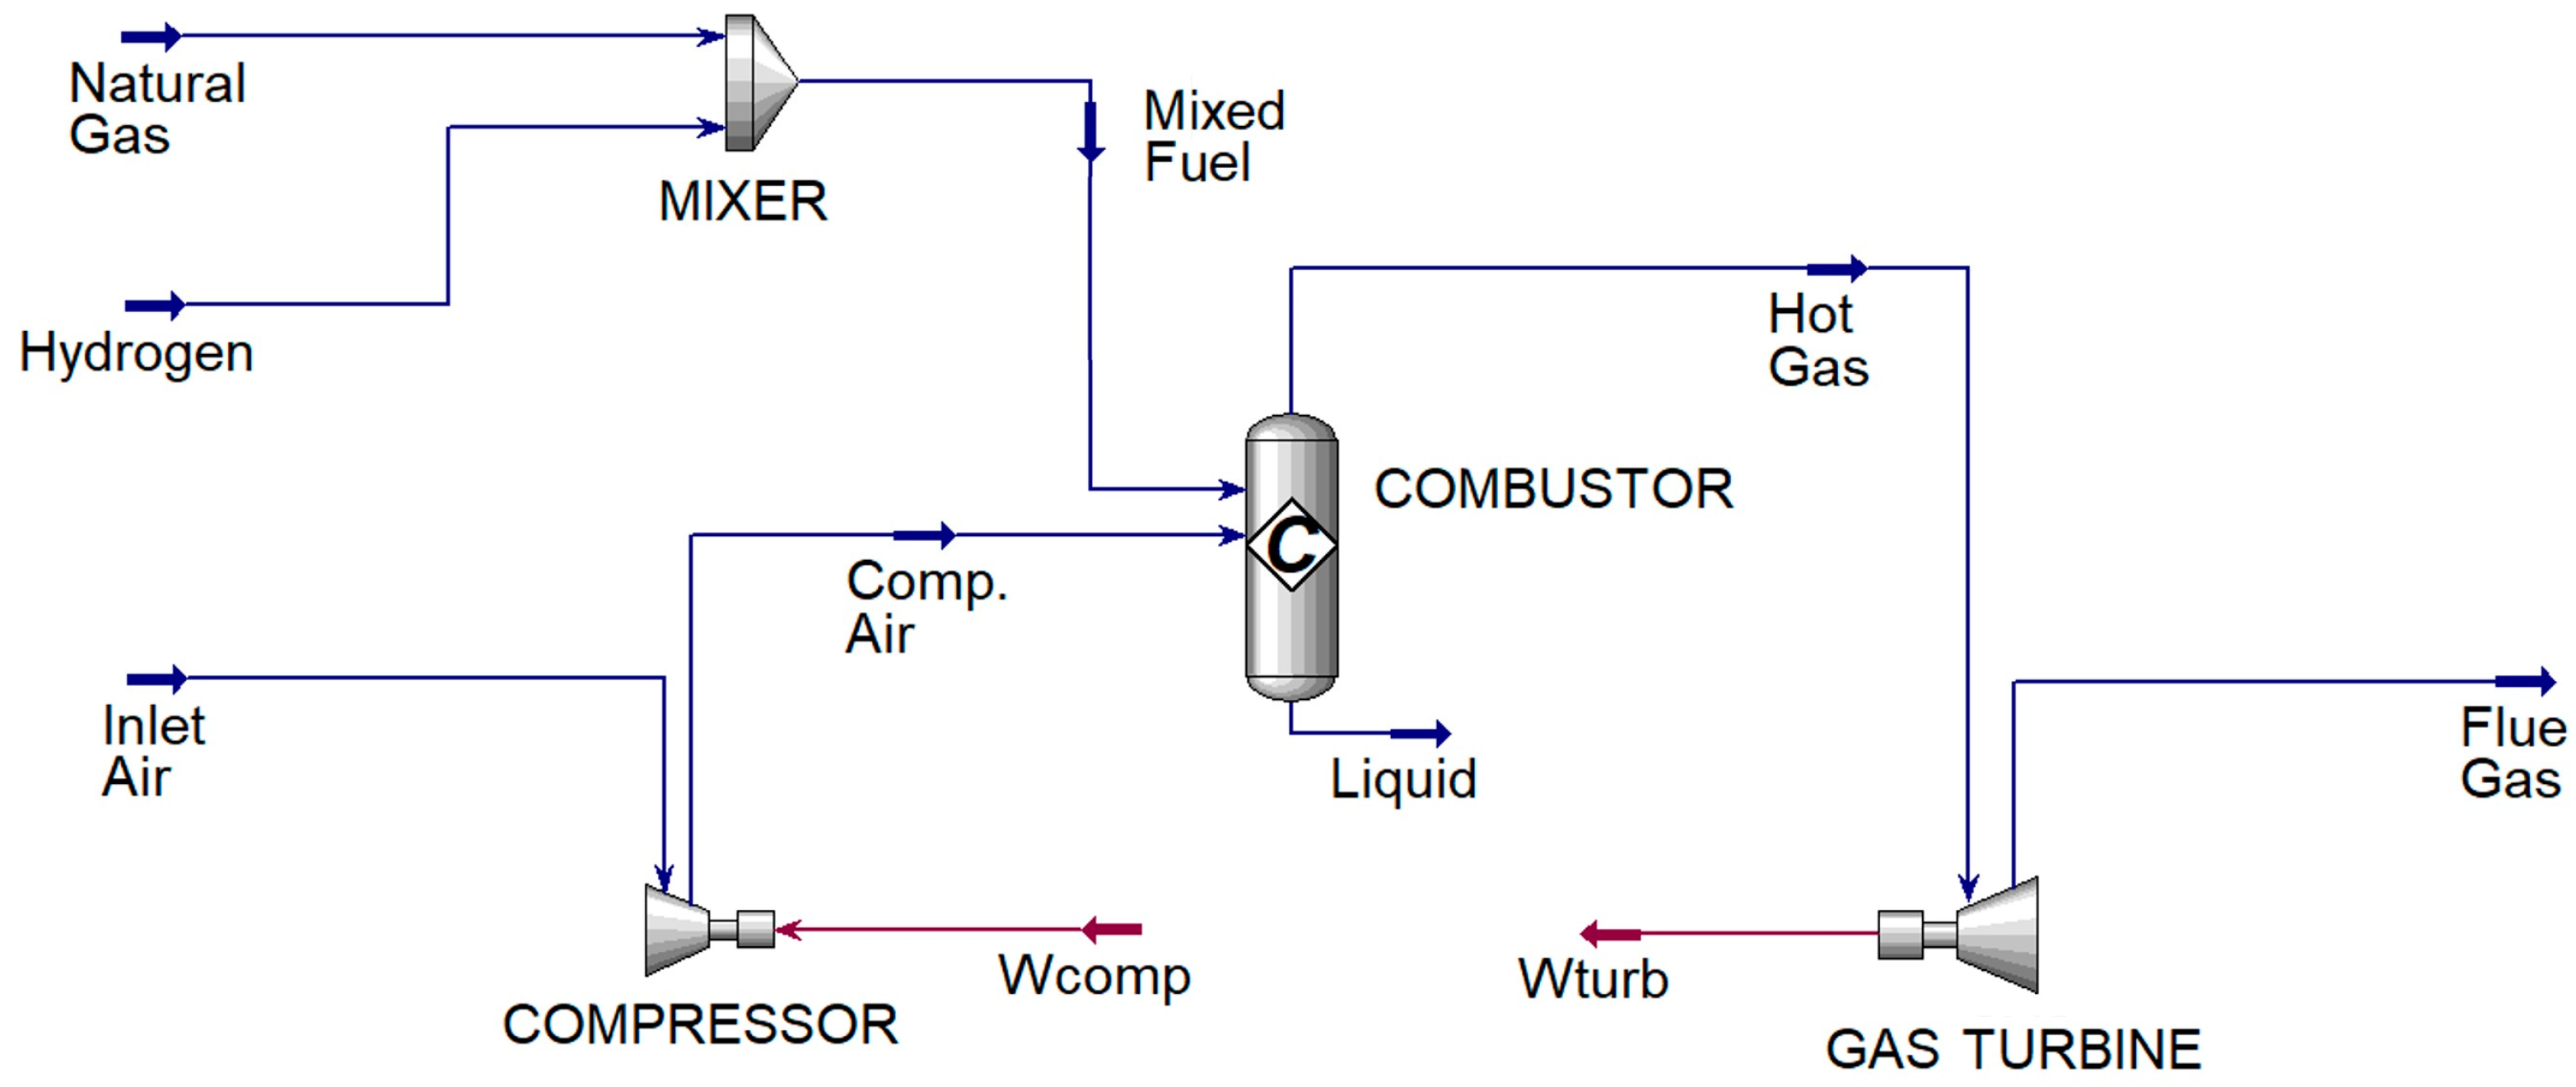
2.2. System Configuration

The gas turbine system configuration used in the modeling and simulation generally consists of key components, including a compressor, a combustor, a gas turbine, and material streams. In the hydrogen co-firing simulation with natural gas, a mixer is added to facilitate the blending of hydrogen and natural gas before entering the gas turbine combustor. The modeled gas turbine system operates in a cycle where inlet air enters the compressor, which is compressed into compressed air and then directed into the combustor. Natural gas and hydrogen from each supply terminal are fed into the mixer for blending and subsequently delivered into the combustor as a mixed fuel. Within the combustor, a combustion reaction occurs between the mixed fuel and compressed air, producing hot gas. The resulting hot gas is then directed into the turbine, generating turbine work, with a portion of the turbine’s output used to drive the compressor. Finally, the exhaust gas from the turbine expansion process is discharged from the system through the flue gas stream. The detailed system configuration is illustrated in Figure 2.

2.3. Software Modeling

This study begins by developing a base model of the gas turbine system in Aspen HYSYS, following the design configuration at 100%, 75%, and 50% operating loads, using natural gas as fuel. The input parameters are derived from the design data in the heat balance diagram, combined with actual operating data from the commissioning process. The base model is then validated by comparing the Aspen HYSYS simulation results with baseline data, where the maximum allowable deviation is 1%. The detailed parameters for developing the base model at each operating load are presented in Table 1.
The parameters presented in Table 1 correspond to the input parameters for the material stream. However, the modeling of component performance, including the compressor, combustor, and turbine, follows a different approach. The compressor operation is modeled using a performance curve, which is defined based on the inlet air flow, adiabatic head, and adiabatic efficiency for each operational load, as shown in Table 1. The combustor is modeled using a conversion reactor approach, where the combustion reactions are manually inputted according to predefined reaction equations. The reacting components in the combustor consist of natural gas and hydrogen mixed with air.
This study assumes complete combustion, with the detailed combustion reaction equations presented in Equations (1)–(8):
C H 4 + 2 O 2 C O 2 + 2 H 2 O
2 C 2 H 6 + 7 O 2 4 C O 2 + 6 H 2 O
C 3 H 8 + 5 O 2 3 C O 2 + 4 H 2 O
2 C 4 H 10 + 13 O 2 8 C O 2 + 10 H 2
C 5 H 12 + 8 O 2 5 C O 2 + 6 H 2 O
2 C 6 H 14 + 19 O 2 12 C O 2 + 14 H 2 O
C 7 H 16 + 11 O 2 7 C O 2 + 8 H 2 O
2 H 2 + O 2 2 H 2 O
where CH4 is methane, C2H6 is ethane, C3H8 is propane, C4H10 is butane, C5H12 is pentane, C6H14 is hexane, C7H16 is heptane, H2 is hydrogen, and O2 denotes oxygen as the reactants. Meanwhile, CO2 and H2O represent carbon dioxide and water as the reaction products. The composition of the mole fraction for each component above is provided in Table 2.
The inlet air composition in Table 2 is based on the general composition of atmospheric air, which primarily consists of nitrogen and oxygen, neglecting other components with percentages below 1%. The natural gas composition is based on the power plant’s design data to achieve an LHV value of 43,377 kJ/kg [41]. In contrast, the hydrogen composition follows the ISO 14687 standard for fuel purity in industrial applications (power generation or heat energy source) [21].
Since data on turbine isentropic efficiency are unavailable, turbine work is treated as a dependent variable influenced by the turbine inlet temperature (TIT) and turbine exhaust temperature (TET). The TET value is kept constant according to the heat balance diagram design for each operating load. In contrast, the TIT value adjusts to the combustion gas temperature, which depends on the mass flow rate of air and fuel as well as the fuel’s lower heating value (LHV).
In simulations, it is essential to define the operating conditions accurately. In this case, the simulation assumes a steady-state condition [42], where mechanical losses and other system losses are neglected. To predict fluid properties such as specific internal energy, enthalpy, and entropy based on pressure, volume, and temperature relationships, an equation of state (EoS) is required for accurate thermodynamic process predictions [43]. This study employs the Peng–Robinson equation of state, which is widely used in various applications and provides accurate results across a broad operating range [44,45].

2.4. Co-Firing Parameter

The hydrogen co-firing simulation was conducted on the validated base model by varying several parameters, including the flow rates of natural gas, hydrogen, and air. The co-firing ratio was determined on a volumetric basis, requiring the calculation of the lower heating value (LHV) of the hydrogen–natural gas fuel mixture using Equation (9):
L H V m i x = 1 C F R × L H V N G + [ C F R × L H V H 2 ]
where LHVmix represents the lower heating value of the fuel mixture (volume-based), CFR denotes the co-firing ratio, and LHVNG and LHVH2 represent the lower heating value of natural gas and hydrogen, respectively (volume-based). Next, the volumetric flow rates of the fuel mixture and the individual fuel components were determined using Equations (10)–(12):
V ˙ f u e l . m i x = Q i n . c c L H V m i x
V ˙ f u e l . H 2 = C F R × V ˙ f u e l . m i x
V ˙ f u e l . N G = ( 1 C F R ) × V ˙ f u e l . m i x
where Qin.cc denotes the heat input in the combustor, and V ˙ f u e l . m i x , V ˙ f u e l . H 2 , and V ˙ f u e l . N G   represent the volumetric flow rates of the fuel mixture, hydrogen fuel, and natural gas fuel, respectively. Since Aspen HYSYS requires input in mass flow rate units, the calculated volumetric flow rate of the fuel must be converted into the mass flow rate based on the density of each gas under standard conditions: 0.717 kg/Nm3 for natural gas and 0.089 kg/Nm3 for hydrogen [17,18,22]. The air mass flow rate was calculated based on the total combustion air required to oxidize all fuel components according to stoichiometric conditions for complete combustion, with the addition of a constant excess air ratio. The excess air ratio was determined using Equations (13)–(15) [22]:
λ = A F R a c A F R s t
A F R a c = m a m f a c
A F R s t = m a m f s t
where λ represents the excess air ratio, AFRac is the actual air-fuel ratio, AFRst is the stoichiometric air-fuel ratio, m a denotes the air mass, and m f  represents the fuel mass. The modeled hydrogen conditions in this study were adjusted to meet the manufacturer’s specifications, with a supply pressure of 185 bar (±5 bar) and a temperature range of 30–35 °C.

2.5. Thermodynamic Analysis

The gas turbine system operates based on the Brayton cycle, which consists of four processes: isentropic compression in the compressor, isobaric heat addition in the combustor, isentropic expansion in the turbine, and isobaric heat rejection. Thermodynamic analysis for evaluating the performance and efficiency of each component, as well as the overall Brayton cycle, can be conducted using Equations (16)–(21) [46].
The compressor work is as follows:
W c o m p = m ˙ a i r ( h 2 h 1 )
where m ˙ a i r denotes the air mass flow rate, and h2 and h1 represent the enthalpy of air exiting and entering the compressor, respectively.
The heat input to the combustor is as follows:
Q i n . c c = m ˙ f u e l × L H V f u e l
where m ˙ f u e l   represents the fuel mass flow rate, and LHVfuel denotes the lower heating value of the fuel.
The turbine work is as follows:
W t u r b = m ˙ a i r + m ˙ f u e l ( h 3 h 4 )
where h3 and h4 represent the enthalpy of gas entering and exiting the turbine, respectively.
The heat rejected from the system is as follows:
Q o u t = m ˙ a i r + m ˙ f u e l   ( h 4 h 1 )
The total Brayton cycle analysis is as follows:
W c y c l e = W t u r b W c o m p
η c y c l e = W c y c l e Q i n . c c
where Wcycle denotes the total cycle work, and ηcycle represents the cycle thermal efficiency.

2.6. Emission Analysis

The CO2 emission analysis is based on the mass of CO2 generated from combustion and released from the system through the flue gas stream over a 1 h process under steady-state condition. The emission analysis is conducted using two different units, as follows:
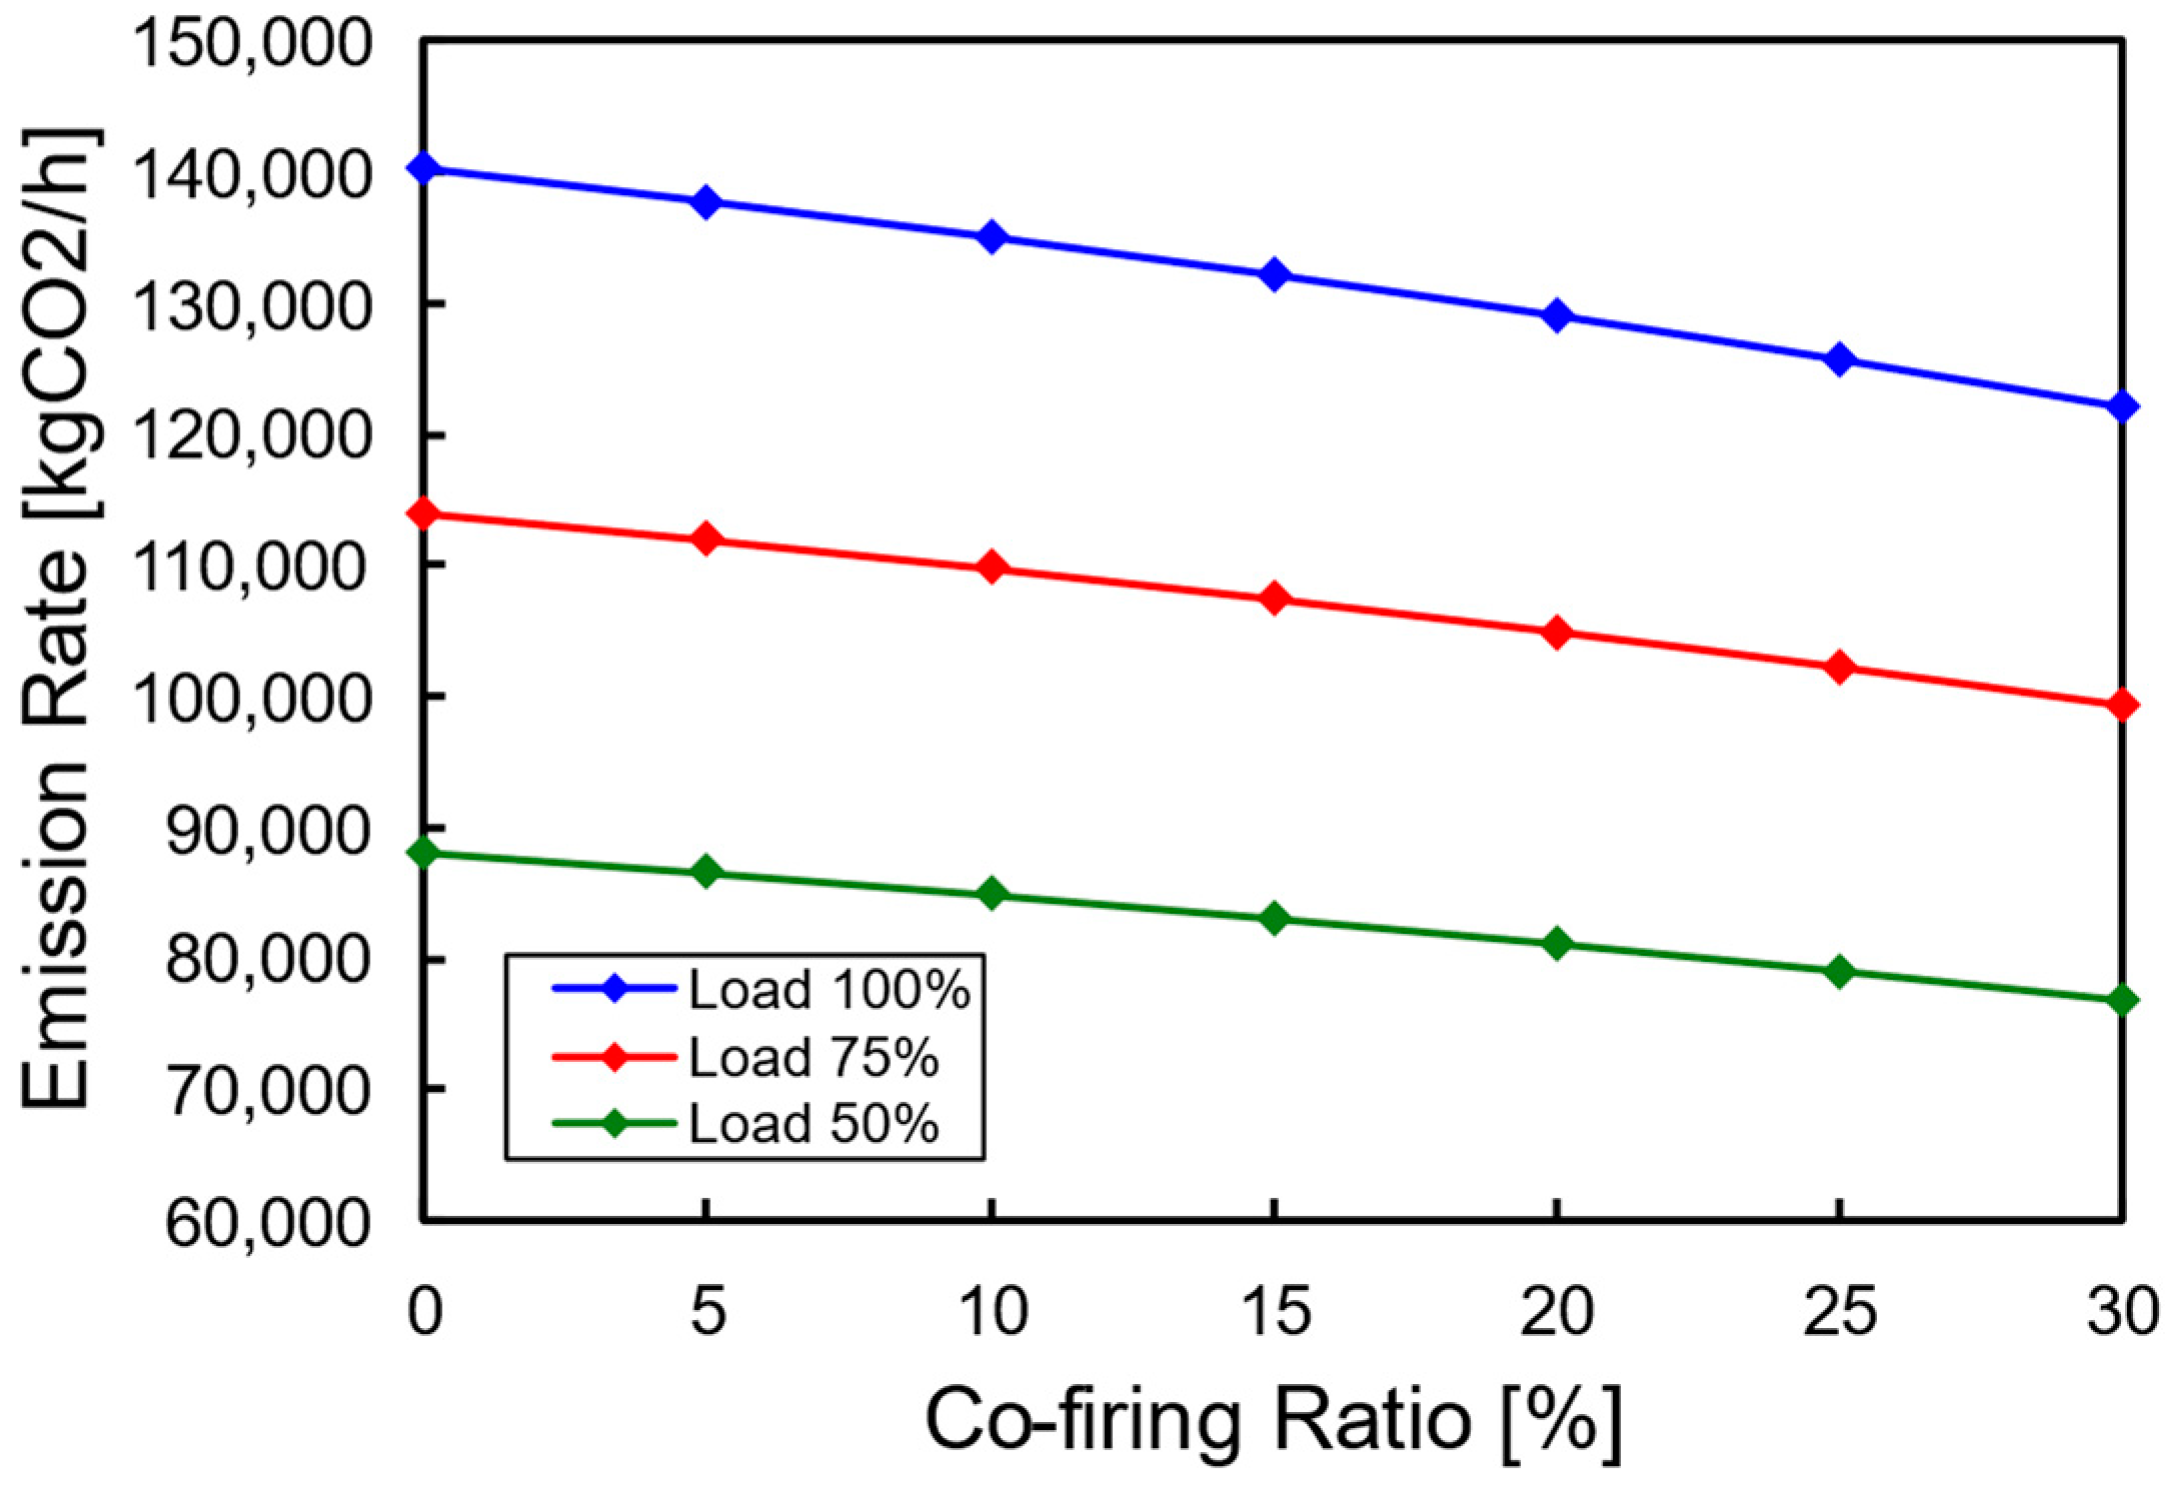
  • The emission rate, which represents the total amount of CO2 emissions released over a specific period, is expressed in kg CO2/h.
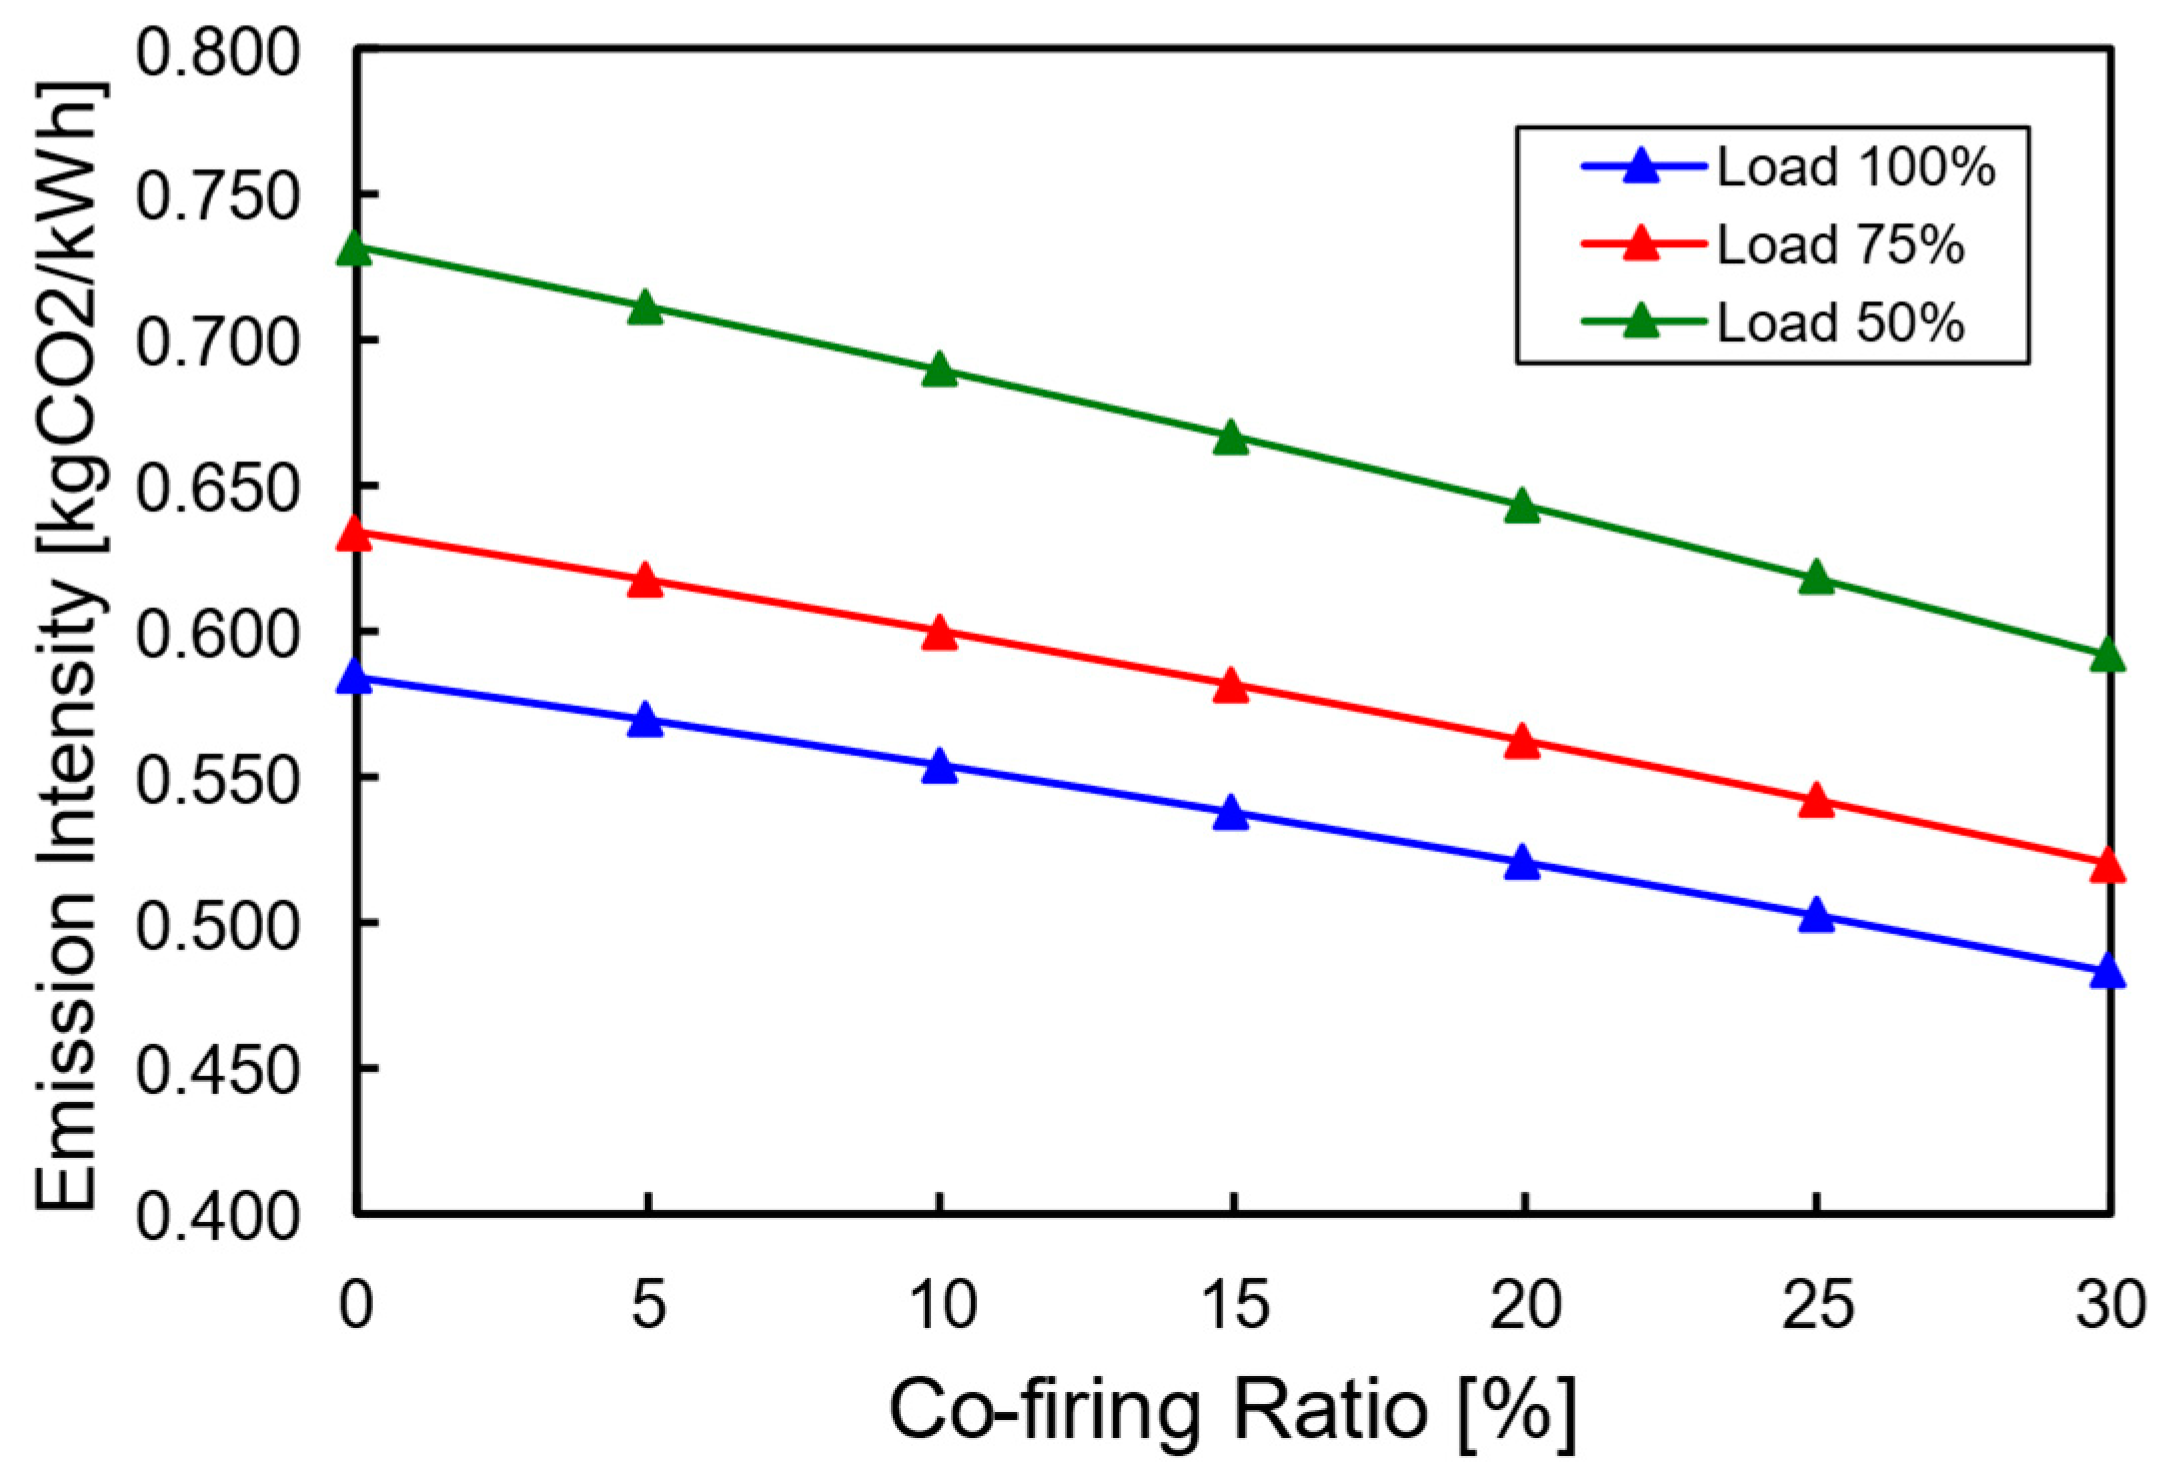
  • The emission intensity, which indicates the amount of CO2 emissions per unit of electrical energy produced, is expressed in kg CO2/kWh.

3. Results and Discussion

3.1. Model Validation

The developed base model for the 100%, 75%, and 50% load conditions successfully converged, yielding cycle output work values of 240,003 kW, 179,842 kW, and 120,390 kW, respectively, as shown in Table 3. This result indicates that all mass and energy balance equations were numerically solved within an acceptable error margin. The values obtained for each stream remained stable, without iterative loops or error warnings in the simulation status. During the validation phase, the highest deviation was observed in the total cycle work parameter, with values of 0.630% at 100% load, 0.583% at 75% load, and 0.998% at 50% load. Across all validation results, the deviation values for all parameters remained below 1% from the baseline, signifying that the simulation model is sufficiently accurate [47]. Consequently, the base model is deemed suitable for use in hydrogen co-firing simulations with variations in input parameters.

3.2. Co-Firing Simulation Results

Details of the simulation parameters of hydrogen co-firing results on each material stream are shown in Table 4, encompassing all variations in co-firing ratios and operational loads. Meanwhile, the parameters related to compressor work, turbine work, cycle work, cycle efficiency, and CO2 emissions resulting from the material stream processes are sequentially illustrated through graphs in Figure 3, Figure 4, Figure 5, Figure 6, Figure 7 and Figure 8.

3.2.1. Effect of Hydrogen Co-Firing on the Compressor

The work required by the compressor to compress air, according to the thermodynamic equations, is influenced by the mass flow rate of the air as well as the enthalpy of the air entering and exiting the compressor. In gaseous fluids, such as air, enthalpy is highly dependent on the working temperature of the fluid [48]. As shown in Table 4, increasing the hydrogen co-firing ratio under a constant excess air ratio scenario decreases the mass flow rate of air entering the compressor. This reduction occurs across all operational load variations (100%, 75%, and 50%) with different percentages. Among the three load variations, the highest air mass flow decrease is observed at 100% operational load, averaging 13,171 kg/h. At 75% load, the average decrease in air mass flow rate is 11,736 kg/h, while at 50% load, the lowest reduction is recorded at 9887 kg/h. This decrease in air mass flow rate correlates with a decrease in mixed fuel flow, where the air required to fulfil the combustion reaction is reduced.
A lower air mass flow rate during the compression process generates less heat, leading to a reduction in the temperature of the air exiting the compressor [29]. This trend aligns with the simulation results, which indicate a direct correlation between the decrease in air mass flow and the reduction in compressor outlet temperature. At 100% operational load, the average reduction in compressor outlet temperature is 1.78 °C, the highest among the three load variations. The average reductions for the 75% and 50% operational loads are 1.28 °C and 0.97 °C, respectively. With the inlet air temperature maintained constant, the decrease in outlet air temperature results in a lower temperature differential and reduces the enthalpy differential. Consequently, the overall decrease in air mass flow rate and temperature/enthalpy differential reduces the work required by the compressor [49].
Figure 3 illustrates the effect of the hydrogen co-firing on compressor work across different operational load variations. As shown in Figure 3a,b, the compressor work decreases as the co-firing ratio increases and is observed in all load variations. The most significant reduction in compressor work occurs at 100% operational load, averaging 2768 kW or approximately 1.03%. At a 30% co-firing ratio, the reduction in compressor work reaches up to 16,610 kW, corresponding to 6.17%. This reduction is attributed to the highest observed decreases in air mass flow rate and temperature differential within this operational range. At 75% load, the average reduction in compressor work is 2070 kW (0.93%), with a maximum reduction of 12,417 kW (5.60%) at a 30% co-firing ratio. The lowest decrease in compressor work occurs at 50% load due to a less significant reduction in air mass flow rate and temperature differential, which is only 6 °C, whereas at 100% load, it can reach up to 10° C. The average reduction in compressor work at this load level is 1505 kW (0.87%), while the maximum reduction at a 30% co-firing ratio reaches 9027 kW (5.24%). These simulation results suggest that a lower air mass flow rate leads to a decrease in compressor work [50].

3.2.2. Effect of Hydrogen Co-Firing on the Turbine

According to the thermodynamic equations, the work produced by a gas turbine is influenced by the mass flow rate of the combustion gases [48] and the enthalpy of the gases entering and exiting the turbine. The combustion gas flow is closely related to the calorific value of the fuel, meaning that any change in calorific value will result in an adjustment of the mass flow rate to maintain the same energy output [49]. Table 4 indicates that increasing the co-firing ratio while maintaining a constant excess air ratio leads to a reduction in the combustion gas flow. This condition occurs because, in a co-firing scenario, a higher hydrogen fraction reduces the total fuel input due to the higher calorific value of hydrogen [37]. This reduction in fuel demand is directly linked to the amount of air required for the combustion reaction, as a lower fuel quantity necessitates less combustion air [51].
The decrease in combustion gas flow is observed across all operational load variations, with the most significant reduction occurring at 100% load, averaging 13,920 kg/h. This trend results from the simultaneous reductions in air mass flow rate and mixed fuel flow, which exhibit the highest decreases at this load range. At 75% load, the average combustion gas flow decrease is 12,345 kg/h, while at 50% load, the lowest decrease is recorded at 10,357 kg/h.
Changes in air and fuel mass flow rates, as well as the calorific value of the fuel, affect the combustion gas temperature. Simulation results indicate that a higher co-firing ratio leads to an increase in combustion gas temperature [30]. The dominant factor contributing to this temperature rise is the increased calorific value of the mixed fuel, which exhibits an average increase of 649 kJ/kg across all operational load variations. The most significant increase in combustion gas temperature occurs at 50% load, where the combustion gas flow experiences the lowest decrease among all load conditions. The average temperature rise at this load is 2.84 °C. In contrast, at 100% load, where the reduction in combustion gas flow is highest, the increase in combustion temperature is less significant, reaching 2.62 °C. At 75% load, the average increase in combustion gas temperature is 2.80 °C. This rise in combustion gas temperature leads to an increase in turbine inlet enthalpy. With the turbine outlet temperature maintained constant, the increase in turbine inlet enthalpy results in a higher enthalpy difference. Consequently, in this simulation scenario, the enthalpy difference increases in correlation with the co-firing ratio [29].
The variations in combustion gas flow and temperature significantly influence the work output of the turbine, as shown in Figure 4. Figure 4 shows that, at 50% load, the turbine work output increases by an average of 23 kW, corresponding to 0.01%. At a 30% co-firing ratio, this increase reaches 139 kW, representing 0.05%. This increase is attributed to the relatively small decrease in combustion gas flow, combined with the highest observed temperature rise, which enhances the final turbine work output. A higher increase in turbine inlet temperature leads to higher turbine work output [29].
At 75% and 100% load, however, turbine work does not increase but instead decreases. The most significant decrease occurs at 100% load due to the highest decrease in combustion gas flow [14]. Additionally, at this load level, the temperature increase is insufficient to compensate for the decreased mass flow rate, resulting in lower turbine work output. At a 30% co-firing ratio, the decrease in turbine work reaches 3935 kW, corresponding to 0.77%, with an average of 656 kW or 0.13%. At 75% load, the average decrease in turbine work is 243 kW (0.06%), while at a 30% co-firing ratio, the decrease reaches 1455 kW, corresponding to 0.36%. The change in turbine work must be compared with the change in compressor work to determine the impact of the hydrogen co-firing on the total cycle work.

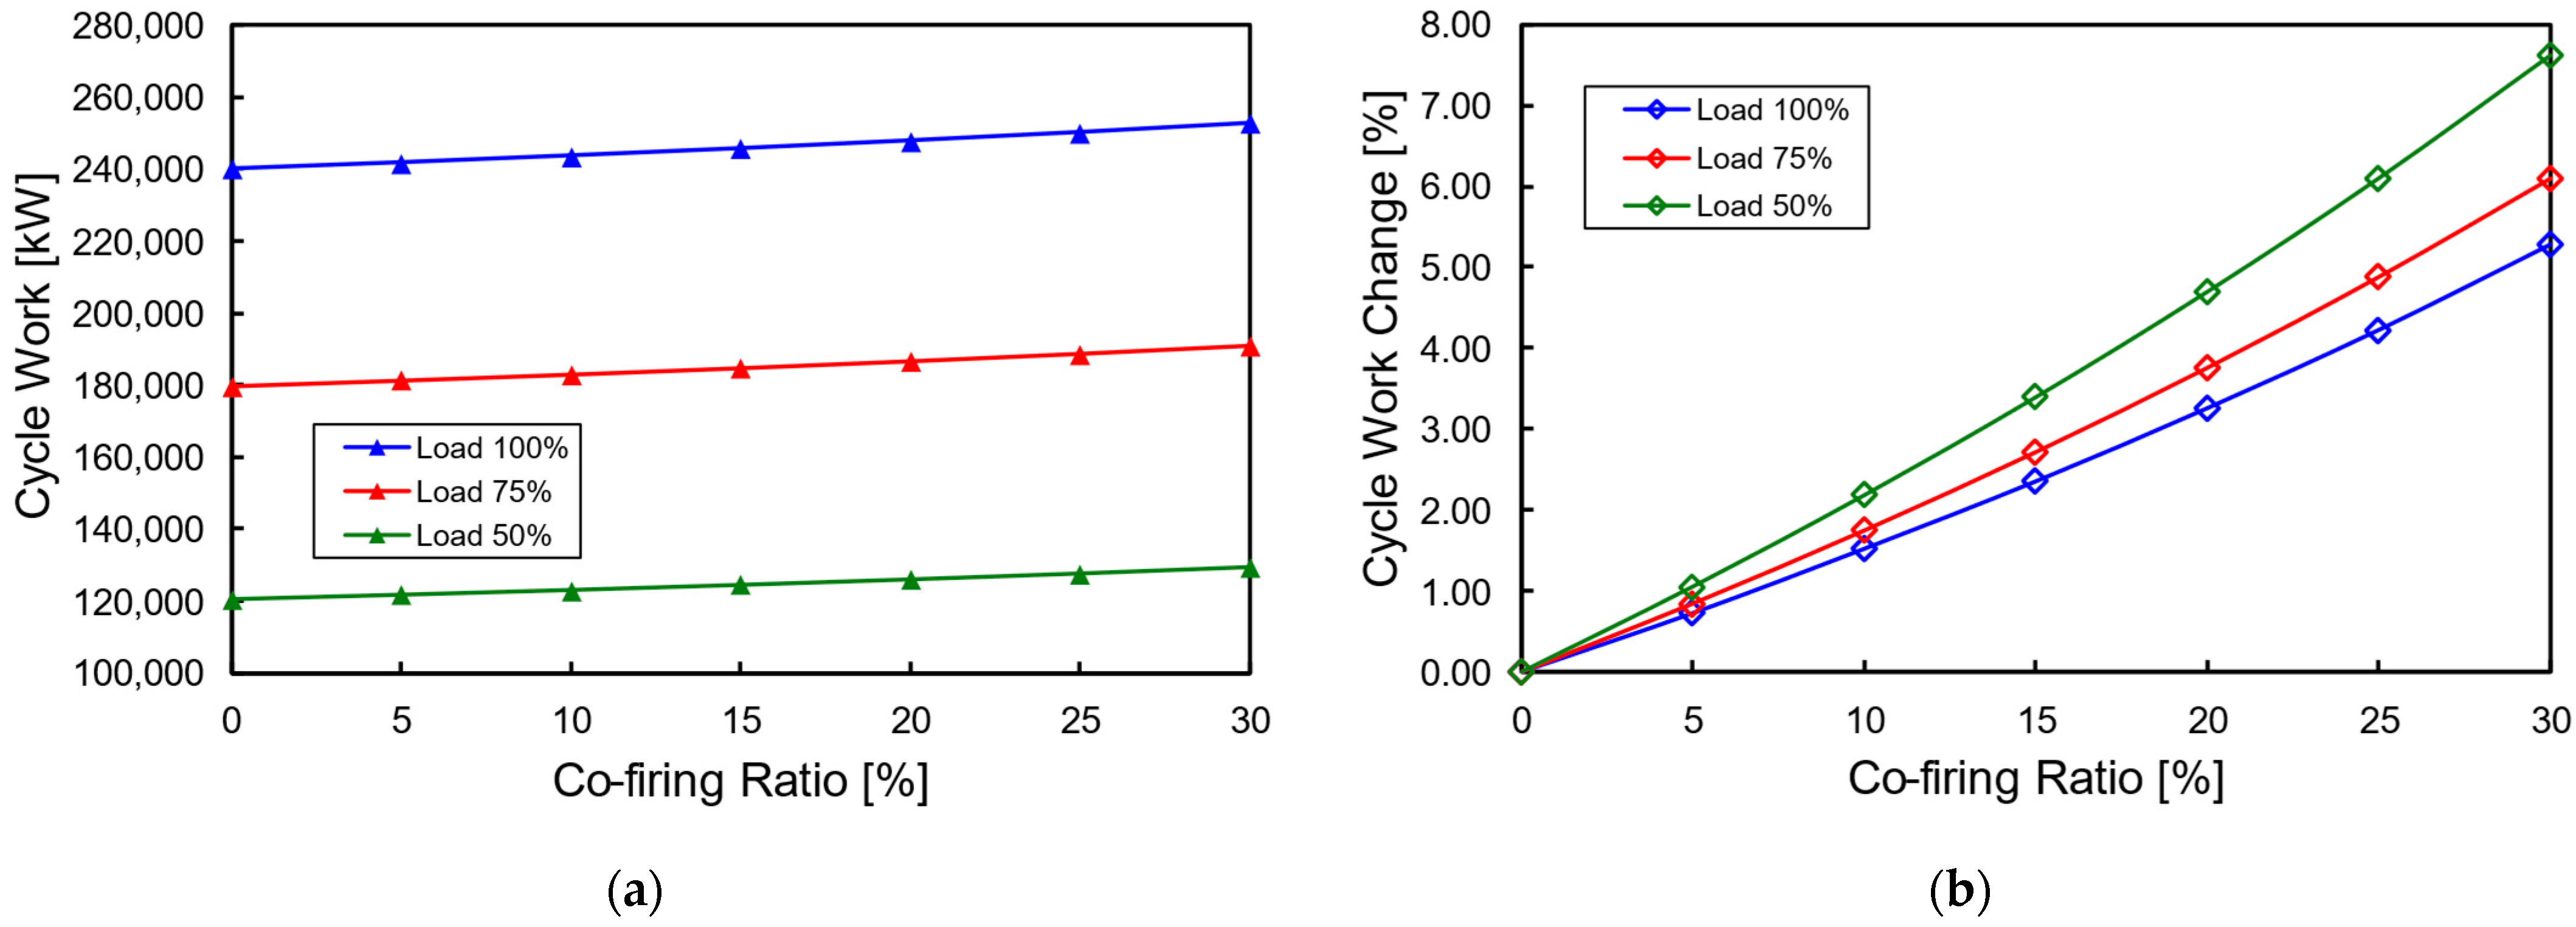
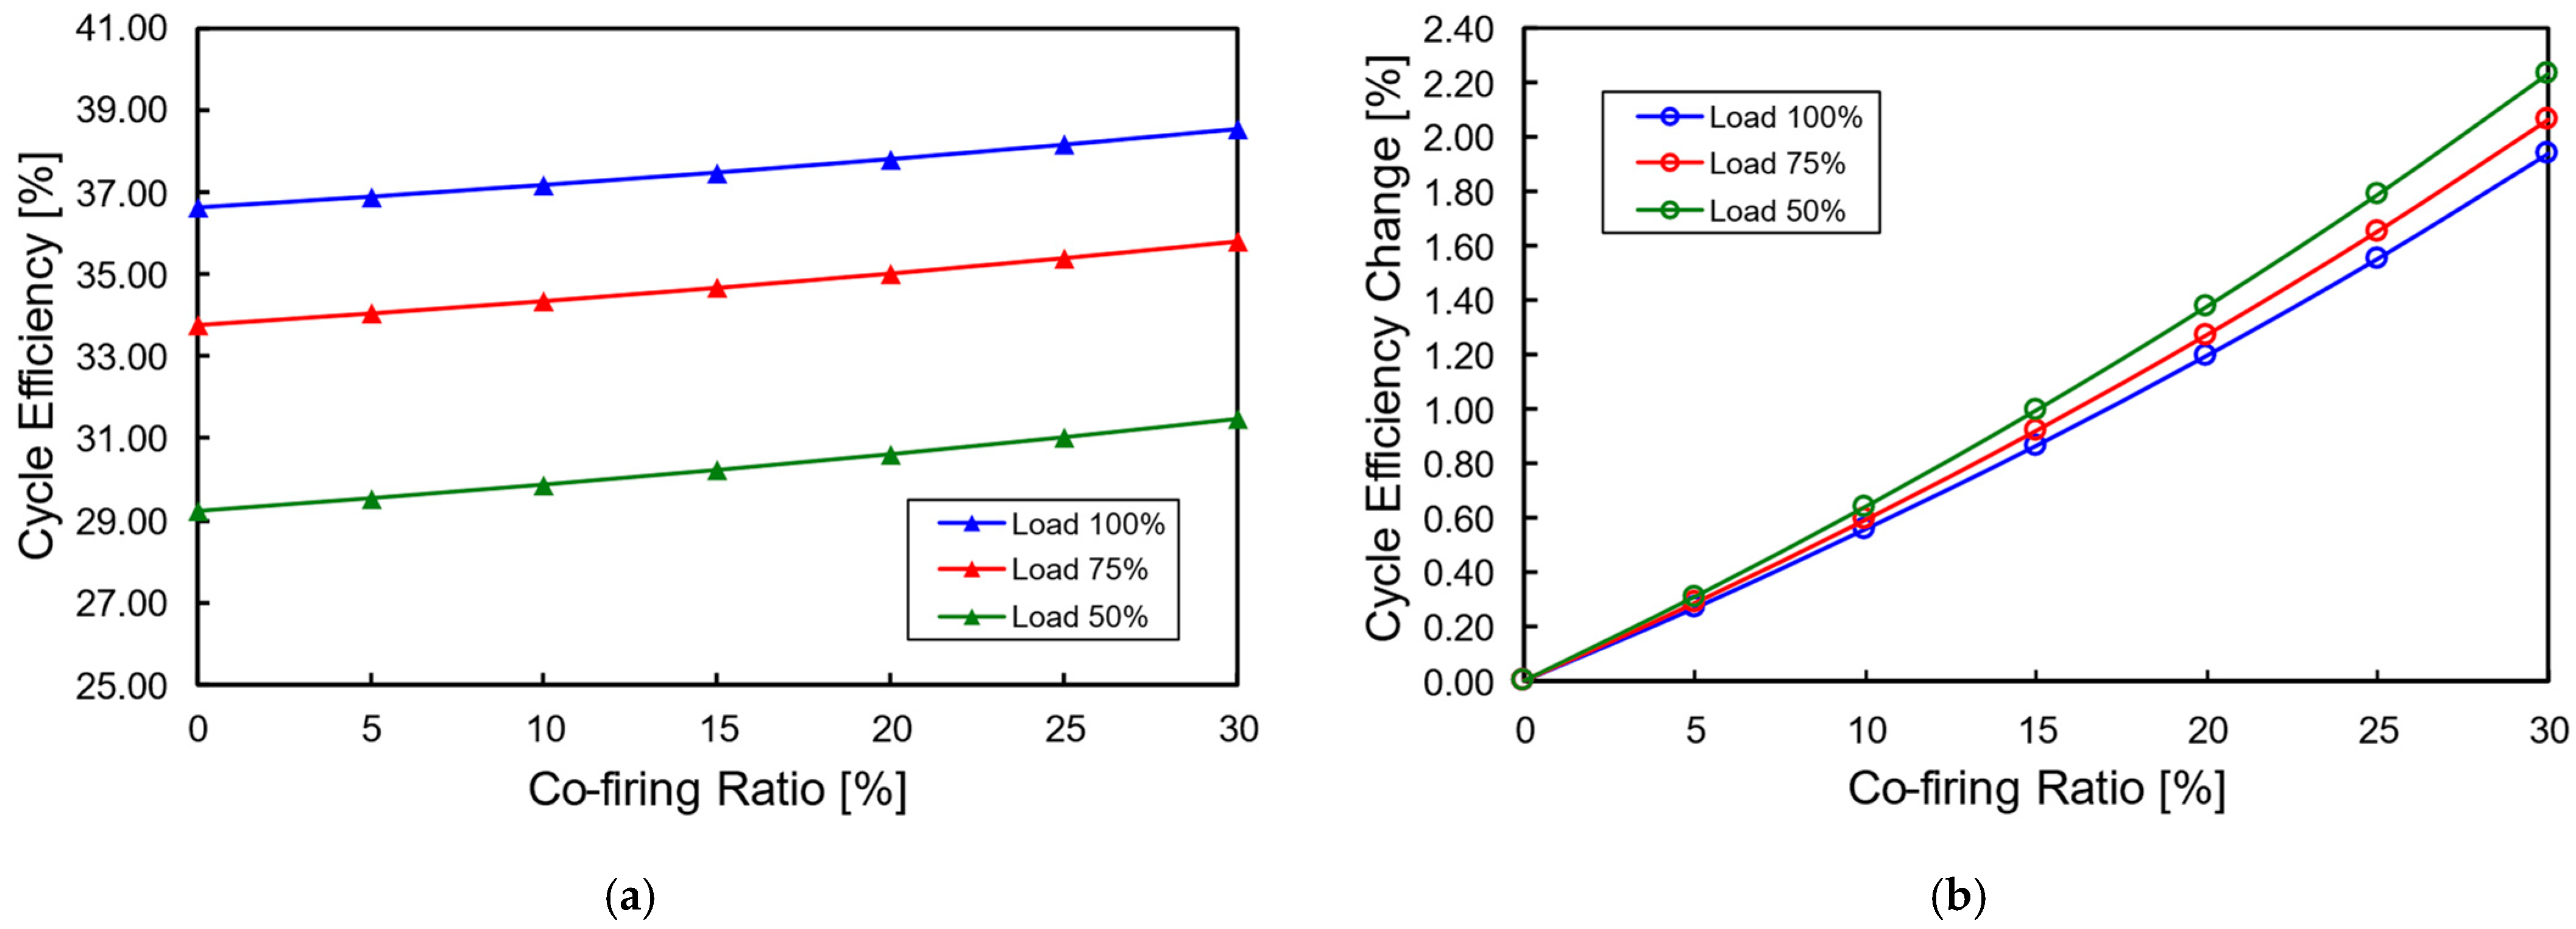
3.2.3. Effect of Hydrogen Co-Firing on the Cycle

The work of the compressor and turbine are critical variables influencing the final work output of the Brayton cycle. According to the thermodynamic equations, the total work of the Brayton cycle is defined as the net work produced by the turbine after deducting the work required by the compressor [51]. Meanwhile, the thermal efficiency of the Brayton cycle is determined by the total cycle work and the heat input to the combustor, which depends on the mass flow rate and the calorific value of the fuel [52]. Increasing the proportion of hydrogen in the fuel mixture raises the overall calorific value due to hydrogen’s higher energy content compared to natural gas [53]. In the hydrogen co-firing scenario, the mass flow rate of the fuel is adjusted to maintain a relatively constant heat input to the combustor. Consequently, the increase in the calorific value of the mixed fuel is directly proportional to the reduction in the mass flow rate of the mixed fuel, ensuring that the heat input to the combustor remains constant across all co-firing ratios. Table 4 indicates that the heat input to the combustor remains relatively constant with increasing hydrogen fractions, recorded at 655 MW for 100% load, 532 MW for 75% load, and 411 MW for 50% load. Therefore, in this simulation, cycle thermal efficiency is only influenced by the total cycle work, as the heat input to the combustion chamber remains unchanged.
Figure 5 illustrates the variation in total cycle work at different operating loads based on hydrogen co-firing simulations. As depicted in Figure 5a, the total cycle work increases across all operating load variations. Figure 5b reveals that the 50% load operation exhibits the highest percentage increase in total cycle work, reaching 7.61%, corresponding to an increase of 9166 kW at a 30% co-firing ratio. On average, the total cycle work increases by 1.27%, equivalent to 1528 kW. This increase is achieved because, at this load range, the turbine work increases due to the compensation of mass flow rate variations by the rise in combustion temperature. This trend contrasts with other operating loads, where the turbine work decreases, resulting in a less significant increase in the total cycle work. At 100% load, the total cycle work exhibits the lowest percentage increase, averaging 0.88%, or approximately 2112 kW. The maximum increase at a 30% co-firing ratio is 5.28%, corresponding to a cycle work increase of 12,675 kW. This lower percentage increase is attributed to the most significant decrease in turbine work at 100% load due to the significant decrease in combustion gas flow. At 75% load, the average increase in total cycle work is 1.02%, equivalent to 1827 kW, while at a 30% co-firing ratio, the total cycle work rises by 6.10%, amounting to 10,962 kW.
The increase in total cycle work is directly proportional to the improvement in cycle thermal efficiency, as a higher total cycle work is generated while maintaining the same heat input [30]. Figure 6 illustrates the changes in cycle thermal efficiency at different operating loads based on hydrogen co-firing simulations. Figure 6a indicates that the cycle thermal efficiency improves across all load variations. The highest efficiency is achieved at 100% load, which gradually decreases as the system operates at lower loads [48].
Figure 6b demonstrates that the efficiency improvement pattern aligns with the increase in cycle work. The 50% load operation yields the highest percentage increase in efficiency, averaging 0.37% and reaching 2.23% at a 30% co-firing ratio. At 75% load, the average efficiency improvement is 0.34%, with a maximum increase of 2.06% at a 30% co-firing ratio. The 100% load operation exhibits the lowest efficiency increase, averaging 0.32%, with a maximum improvement of 1.94% at a 30% co-firing ratio. These simulation results indicate that thermal efficiency improvements are most pronounced when the increase in total cycle work is substantial. Therefore, it can be concluded that the enhancement of cycle thermal efficiency is directly correlated with the increase in total cycle work [29].
Compared to other co-firing scenarios, the observed cycle efficiency improvement is relatively significant. Actual hydrogen co-firing testing was conducted on a Mitsubishi M501G gas turbine with a capacity of 267,500 kW under a scenario where the cycle work was maintained constant, as reported by Harper et al. [54]. The test results indicated a cycle efficiency increase of 0.3% at hydrogen fractions of 20% by volume, achieved through a 4.3% reduction in the total fuel mass flow rate. In contrast, based on the simulations conducted in this study, the efficiency improvement at a 20% co-firing ratio for a 100% load condition is 1.20% under a scenario where the heat input to the combustor is kept constant.

3.2.4. Effect of Hydrogen Co-Firing on CO2 Emission

The CO2 emission rate is influenced by the amount of hydrocarbon fuel reacted over a given period, which in this case is natural gas. A lower hydrocarbon fuel reaction results in a lower emission rate [30]. Meanwhile, the emission intensity is affected by both the amount of hydrocarbon fuel reacted and the amount of energy produced [55], making it a ratio between input and output. Using the same amount of hydrocarbon fuel while producing a higher energy output will lead to a decrease in emission intensity and vice versa. Figure 7 illustrates the effect of hydrogen co-firing on the CO2 emission rate.
As observed in Figure 7, the emission rate decreases across all operating load variations. This decrease is due to the reduction in the mass flow rate of natural gas fuel reacted in the process with each increase in the co-firing ratio, as shown in Table 4. The highest reduction in emission rate occurs at 100% load, reaching 18,146 kg CO2/h at a 30% co-firing ratio, with an average reduction of 3024 kg CO2/h. At 75% load, the average emission rate reduction is 2458 kg CO2/h, with a maximum reduction of 14,751 kg CO2/h at a 30% co-firing ratio. The lowest reduction in emission rate is observed at 50% load, averaging 1900 kg CO2/h, with a maximum decrease of 11,402 kg CO2/h at a 30% co-firing ratio. These findings indicate that CO2 emissions vary depending on the amount of fossil fuel used [33].
In percentage terms, all operating loads exhibit the same reduction in emission rate, which is 12.94% at a 30% co-firing ratio, with an average decrease of 2.16% for every 5% increment in the hydrogen fraction. This finding is consistent with the direct testing conducted on a Mitsubishi M501G gas turbine with a capacity of 267,500 kW, as reported by Harper et al. [54]. Their experimental results indicate that co-firing hydrogen with a hydrogen fraction of 20% by volume can reduce CO2 emission rates by 7%. In contrast, the simulation results in this study show that at a hydrogen fraction of 20%, the achieved reduction in emission rate is 7.98%. The effect is associated with the substitution of CO2 emissions with H2O emissions when using hydrogen. As CO2 levels in the flue gas decrease, the concentrations of other components, specifically oxygen and water, increase [56].
Figure 8 presents the effect of hydrogen co-firing on the CO2 emission intensity, which follows a different trend compared to the emission rate reduction. The highest reduction in emission intensity occurs at 50% load, where the emission intensity decreases by 0.140 kg CO2/kWh at a 30% co-firing ratio, with an average reduction of 0.023 kg CO2/kWh. This reduction is due to the significant increase in total cycle work and thermal efficiency at 50% load while the heat input to the combustor remains relatively constant. At 75% load, the average reduction in emission intensity is 0.019 kg CO2/kWh, with a maximum decrease of 0.114 kg CO2/kWh at a 30% co-firing ratio.
The 100% load operation exhibits the lowest reduction in emission intensity among all load conditions despite having the highest reduction in emission rate. This condition occurs because the increase in total cycle work and thermal efficiency at 100% load is not as significant as in the other load conditions, resulting in a less pronounced change in the ratio between fuel input and cycle work output. The maximum reduction in emission intensity at a 30% co-firing ratio is 0.101 kg CO2/kWh, with an average reduction of 0.017 kg CO2/kWh. The average percentage reductions in emission intensity at the 100%, 75%, and 50% load conditions are 2.88%, 2.99%, and 3.18%, respectively.

4. Conclusions

The simulation of hydrogen co-firing with natural gas in a Mitsubishi M701F gas turbine with a capacity of 238,500 kW was conducted using Aspen HYSYS software. The process was simulated under steady-state conditions for 1 h for each scenario with a constant excess air ratio at turbine inlet temperatures ranging from 1073 to 1282 °C. The co-firing ratios were 5%, 10%, 15%, 20%, 25%, and 30%, with each ratio evaluated under three different operating loads: 100%, 75%, and 50%. The analysis of the simulation results focused on two key aspects: the effect of hydrogen co-firing on the cycle thermal efficiency and the CO2 emissions produced.
The gas turbine system modeling in Aspen HYSYS resulted in fully convergent models, with maximum deviation values of 0.630%, 0.583%, and 0.998% for operating loads of 100%, 75%, and 50%, respectively. The simulation model accurately represents the system conditions, demonstrating a deviation value of less than 1%.
The simulation results indicate an increase in thermal efficiency with each 5% increment in the hydrogen fraction. The average efficiency increase was 0.32% at 100% operating load, 0.34% at 75% operating load, and 0.37% at 50% operating load. The maximum efficiency improvements at a 30% co-firing ratio reached 1.94%, 2.06%, and 2.23% for the 100%, 75%, and 50% operating loads, respectively.
The CO2 emission rate decreased by 2.16% for every 5% increase in the hydrogen fraction across all operating load variations. Meanwhile, the average reductions in CO2 emission intensity at the 100%, 75%, and 50% operating loads were 0.017, 0.019, and 0.023 kg CO2/kWh, respectively.

Author Contributions

Conceptualization, R.R.N.; methodology, R.R.N., S.S. and W.W.; software, R.R.N.; validation, S.S. and W.W.; formal analysis, R.R.N., S.S. and W.W.; data curation, R.R.N.; writing—original draft preparation, R.R.N.; writing—review and editing, R.R.N., S.S. and W.W.; visualization, R.R.N.; supervision, S.S. and W.W. All authors have read and agreed to the published version of the manuscript.

Funding

This research received no external funding.

Data Availability Statement

The data presented in this study are available on request from the corresponding author.

Acknowledgments

The authors respectfully express gratitude to the Professors of Diponegoro University for their guidance and supervision in this research.

Conflicts of Interest

The authors declare no conflicts of interest.

References

  1. MEMR. Handbook of Energy & Economy Statistics of Indonesia 2022; Ministry of Energy and Mineral Resources Republic of Indonesia: Jakarta, Indonesia, 2023. [Google Scholar]
  2. IESR. Indonesia Energy Transition Outlook 2023: Tracking Progress of Energy Transition in Indonesia: Pursuing Energy Security in the Time of Transition; Institute for Essential Services Reform (IESR): Jakarta, Indonesia, 2022. [Google Scholar]
  3. Siregar, Y.I. Pathways Towards Net-Zero Emissions in Indonesia’s Energy Sector. Energy 2024, 308, 133014. [Google Scholar] [CrossRef]
  4. Bilgili, M.; Tumse, S.; Nar, S. Comprehensive Overview on the Present State and Evolution of Global Warming, Climate Change, Greenhouse Gasses and Renewable Energy. Arab. J. Sci. Eng. 2024, 49, 14503–14531. [Google Scholar] [CrossRef]
  5. Filonchyk, M.; Peterson, M.P.; Zhang, L.; Hurynovich, V.; He, Y. Greenhouse Gases Emissions and Global Climate Change: Examining the Influence of CO2, CH4, and N2O. Sci. Total Environ. 2024, 935, 173359. [Google Scholar] [CrossRef] [PubMed]
  6. Lamb, W.F.; Wiedmann, T.; Pongratz, J.; Andrew, R.; Crippa, M.; Olivier, J.G.J.; Wiedenhofer, D.; Mattioli, G.; Al Khourdajie, A.; House, J.; et al. A Review of Trends and Drivers of Greenhouse Gas Emissions by Sector from 1990 to 2018. Environ. Res. Lett. 2021, 16, 073005. [Google Scholar] [CrossRef]
  7. IPCC. 2006 IPCC Guidelines for National Greenhouse Gas Inventories; Eggleston, S., Buendia, L., Miwa, K., Ngara, T., Tanabe, K., Eds.; Institute for Global Environmental Strategies (IGES): Hayama, Japan, 2006; ISBN 4-88788-032-4. [Google Scholar]
  8. IESR. Climate Transparency Report 2022: Comparing G20 Climate Action; Institute for Essential Service Reform (IESR): Jakarta, Indonesia, 2022. [Google Scholar]
  9. MEMR. Electricity Statistics 2022, 36th ed.; Ministry of Energy and Mineral Resources Republic of Indonesia: Jakarta, Indonesia, 2023; ISBN 2829-0992. [Google Scholar]
  10. Karmellos, M.; Kopidou, D.; Diakoulaki, D. A Decomposition Analysis of the Driving Factors of CO2 (Carbon Dioxide) Emissions from the Power Sector in the European Union Countries. Energy 2016, 94, 680–692. [Google Scholar] [CrossRef]
  11. Wijayanto, T.; Hakam, D.F.; Kemala, P.N. Vision for Indonesia’s 2050 Power Generation: Scenarios of Hydrogen Integration, Nuclear Energy Prospects, and Coal Phase-Out Impact. Sustain. Futur. 2025, 9, 100438. [Google Scholar] [CrossRef]
  12. Febijanto, I.; Nadirah, N.; Rosmeika; Nugroho, A.S.; Guardi, A.; Yanuar, A.I.; Bahua, H.; Herdioso, R.; Sihombing, A.L.S.M.; Susila, I.M.A.D.; et al. Life Cycle Greenhouse Gas Emissions Assessment: Converting an Early Retirement Coal-Fired Power Plant to a Biomass Power Plant. Renew. Energy Focus 2024, 51, 100643. [Google Scholar] [CrossRef]
  13. IFHE; BRIN. Indonesia Hidrogen Roadmap; Indonesia Fuel Cell and Hydrogen Energy (IFHE): Banten, Indonesia; dan Badan Riset dan Inovasi Nasional (BRIN): Jakarta, Indonesia, 2023. [Google Scholar]
  14. Ahmad, A.H.; Darmanto, P.S.; Juangsa, F.B. Thermodynamic Study on Decarbonization of Combined Cycle Power Plant. J. Eng. Technol. Sci. 2023, 55, 613–626. [Google Scholar] [CrossRef]
  15. Jeong, J.H.; Park, H.S.; Park, Y.K.; Kim, T.S. Analysis of the Influence of Hydrogen Co-Firing on the Operation and Performance of the Gas Turbine and Combined Cycle. Case Stud. Therm. Eng. 2024, 54, 104061. [Google Scholar] [CrossRef]
  16. Speight, J.G. Natural Gas: A Basic Handbook, 2nd ed.; Gulf Professional Publishing: Cambridge, MA, USA, 2019; ISBN 978-0-12-809570-6. [Google Scholar]
  17. Boretti, A. Phased Transition from Methane to Hydrogen in Internal Combustion Engines: Utilizing Hythane and Direct Injection Jet Ignition for Enhanced Efficiency and Reduced Emissions. Int. J. Hydrogen Energy 2024, 80, 1255–1265. [Google Scholar] [CrossRef]
  18. Ihsan Shahid, M.; Rao, A.; Farhan, M.; Liu, Y.; Ahmad Salam, H.; Chen, T.; Ma, F. Hydrogen Production Techniques and Use of Hydrogen in Internal Combustion Engine: A Comprehensive Review. Fuel 2024, 378, 132769. [Google Scholar] [CrossRef]
  19. Le, O.; Loubar, K. Natural Gas: Physical Properties and Combustion Features. In Natural Gas; IntechOpen: London, UK, 2010. [Google Scholar] [CrossRef]
  20. Algayyim, S.J.M.; Saleh, K.; Wandel, A.P.; Fattah, I.M.R.; Yusaf, T.; Alrazen, H.A. Influence of Natural Gas and Hydrogen Properties on Internal Combustion Engine Performance, Combustion, and Emissions: A Review. Fuel 2024, 362, 130844. [Google Scholar] [CrossRef]
  21. Dawood, F.; Anda, M.; Shafiullah, G.M. Hydrogen Production for Energy: An Overview. Int. J. Hydrogen Energy 2020, 45, 3847–3869. [Google Scholar] [CrossRef]
  22. Mehra, R.K.; Duan, H.; Juknelevičius, R.; Ma, F.; Li, J. Progress in Hydrogen Enriched Compressed Natural Gas (HCNG) Internal Combustion Engines—A Comprehensive Review. Renew. Sustain. Energy Rev. 2017, 80, 1458–1498. [Google Scholar] [CrossRef]
  23. Zhang, W.; Wang, Y.; Long, W.; Tian, H.; Dong, P. Numerical Investigation on Knock Intensity, Combustion, and Emissions of a Heavy-Duty Natural Gas Engine with Different Hydrogen Mixing Strategies. Int. J. Hydrogen Energy 2024, 62, 551–561. [Google Scholar] [CrossRef]
  24. Wang, J.; Ouyang, X.; Lei, C.; Peng, S.; Wang, Z.; Wang, J. Investigation on Adaptability of Physical Property State Equation Model for Hydrogen-Blended Natural Gas. Int. J. Hydrogen Energy 2024, 81, 1256–1277. [Google Scholar] [CrossRef]
  25. Jayaprabakar, J.; Arunkumar, T.; Rangasamy, G.; Parthipan, J.; Anish, M.; Varshini, G.; Kiran Kumar, B. Prospectus of Hydrogen Enrichment in Internal Combustion Engines: Methodological Insights on Its Production, Injection, Properties, Performance and Emissions. Fuel 2024, 363, 131034. [Google Scholar] [CrossRef]
  26. Xi, Z.; Lian, T.; Shi, X.; Liu, Z.; Han, S.; Yang, X.; Zhang, J.; Li, W.; Mei, B.; Li, Y. Co-Firing Hydrogen and Dimethyl Ether in a Gas Turbine Model Combustor: Influence of Hydrogen Content and Comparison with Methane. Int. J. Hydrogen Energy 2022, 47, 38432–38444. [Google Scholar] [CrossRef]
  27. Inoue, K.; Miyamoto, K.; Domen, S.; Tamura, I.; Kawakami, T.; Tanimura, S. Development of Hydrogen and Natural Gas Co-firing Gas Turbine. Mitsubishi Heavy Ind. Tech. Rev. 2018, 55, 1–6. [Google Scholar]
  28. Nose, M.; Kawakami, T.; Araki, H.; Senba, N.; Tanimura, S. Hydrogen-Fired Gas Turbine Targeting Realization of CO2-Free Society. Mitsubishi Heavy Ind. Tech. Rev. 2018, 55, 1–7. [Google Scholar]
  29. Mendoza Morales, M.J.; Blondeau, J.; De Paepe, W. Assessing the Impact of CH4/H2 Blends on the Thermodynamic Performance of Aero-Derivative Gas Turbine CHP Configurations. Int. J. Hydrogen Energy 2024, 67, 159–171. [Google Scholar] [CrossRef]
  30. Amrouche, F.; Boudjemaa, L.; Bari, O.K. Hydrogen-Natural Gas Blending for Enhanced Performance of the MS-5002C Gas Turbine in Southern Algeria. Int. J. Hydrogen Energy 2025, 106, 1144–1157. [Google Scholar] [CrossRef]
  31. Normann, F.; Andersson, K.; Leckner, B.; Johnsson, F. High-Temperature Reduction of Nitrogen Oxides in Oxy-Fuel Combustion. Fuel 2008, 87, 3579–3585. [Google Scholar] [CrossRef]
  32. Babahammou, H.R.; Merabet, A.; Miles, A. Technical Modelling and Simulation of Integrating Hydrogen from Solar Energy into a Gas Turbine Power Plant to Reduce Emissions. Int. J. Hydrogen Energy 2024, 59, 343–353. [Google Scholar] [CrossRef]
  33. Alikulov, K.; Aminov, Z.; Anh, L.H.; Tran Dang, X.; Kim, W. Effect of Ammonia and Hydrogen Blends on the Performance And Emissions of an Existing Gas Turbine Unit. Int. J. Hydrogen Energy 2024, 61, 432–443. [Google Scholar] [CrossRef]
  34. Himmelblau, D.M.; Riggs, J.B. Basic Principles and Calculations in Chemical Engineering, 9th ed.; Pearson Education, Inc.: Upper Saddle River, NJ, USA, 2023; ISBN ISBN-13: 978-0-13-732717-1. [Google Scholar]
  35. Abdin, Z. Bridging the Energy Future: The Role and Potential of Hydrogen Co-Firing with Natural Gas. J. Clean. Prod. 2024, 436, 140724. [Google Scholar] [CrossRef]
  36. Shiva Kumar, S.; Lim, H. An Overview of Water Electrolysis Technologies for Green Hydrogen Production. Energy Rep. 2022, 8, 13793–13813. [Google Scholar] [CrossRef]
  37. Park, Y.; Choi, M.; Choi, G. Thermodynamic Performance Study of Large-Scale Industrial Gas Turbine with Methane/Ammonia/Hydrogen Blended Fuels. Energy 2023, 282, 128731. [Google Scholar] [CrossRef]
  38. MEMR. Cilegon Combine Cycle Power Plant Greenhouse Gas Emission Report. Available online: https://apple-gatrik.esdm.go.id/tingkat-fasilitas/rekap-emisi (accessed on 17 January 2025).
  39. Ang, B.W.; Su, B. Carbon Emission Intensity in Electricity Production: A Global Analysis. Energy Policy 2016, 94, 56–63. [Google Scholar] [CrossRef]
  40. Liu, Z.; Karimi, I.A. Simulation and Optimization of a Combined Cycle Gas Turbine Power Plant for Part-Load Operation. Chem. Eng. Res. Des. 2018, 131, 29–40. [Google Scholar] [CrossRef]
  41. MHI PT PLN (Persero). Cilegon Combined Cycle Power Plant (740 MW) Design Manual; Mitsubishi Heavy Industries, Ltd.: Takasago, Japan, 2006. [Google Scholar]
  42. Liu, Z.; Karimi, I.A. Simulating Combined Cycle Gas Turbine Power Plants in Aspen HYSYS. Energy Convers. Manag. 2018, 171, 1213–1225. [Google Scholar] [CrossRef]
  43. Ghoderao, P.N.P.; Narayan, M.; Dalvi, V.H.; Byun, H.S. Patel-Teja Cubic Equation of State—A Review of Modifications and Applications till 2022. Fluid Phase Equilib. 2023, 567, 113707. [Google Scholar] [CrossRef]
  44. Lopez-Echeverry, J.S.; Reif-Acherman, S.; Araujo-Lopez, E. Peng-Robinson Equation of State: 40 Years Through Cubics. Fluid Phase Equilib. 2017, 447, 39–71. [Google Scholar] [CrossRef]
  45. Valderrama, J.O. The State of the Cubic Equations of State. Ind. Eng. Chem. Res. 2003, 42, 1603–1618. [Google Scholar] [CrossRef]
  46. Moran, M.J.; Shapiro, H.N.; Boettner, D.D.; Bailey, M.B. Fundamentals of Engineering Thermodynamics, 7th ed.; John Wiley & Sons, Inc.: Hoboken, NJ, USA, 2011; ISBN 13 978-0470-49590-2. [Google Scholar]
  47. Jiang, X.; Liu, Y.; Wei, M.; Cheng, X.; Wang, Z. A Thermodynamics-Informed Deep Learning Approach for Lightweight Modeling of Gas Turbine Performance. Eng. Appl. Artif. Intell. 2025, 143, 110022. [Google Scholar] [CrossRef]
  48. Cong, L.; Zhijun, S.; Yimin, L.; Zhongning, Z.; Lina, M. Experimental Study on the Performance of Micro Gas Turbines Under Different Intake Environments. Case Stud. Therm. Eng. 2024, 58, 104415. [Google Scholar] [CrossRef]
  49. Fatehi, M.; Campaldini, G.; Renzi, M. Micro Gas Turbine Fed by Ammonia with Steam Injection: Performance and Combustion Analysis. Appl. Therm. Eng. 2025, 264, 125428. [Google Scholar] [CrossRef]
  50. Kok, J.B.W.; Haselhoff, E.A. Thermodynamic Analysis of the Thermal And Exergetic Performance of a Mixed Gas-Steam Aero Derivative Gas Turbine Engine for Power Generation. Heliyon 2023, 9, e18927. [Google Scholar] [CrossRef]
  51. Alomar, O.R.; Ali, B.M.; Ali, O.M.; Mustafa, A.N. Impacts of Environmental Conditions on Thermal, Emissions and Economic Performance of Gas Turbine Using Different Types of Fuels: An Experimental Investigation. Results Eng. 2024, 24, 103402. [Google Scholar] [CrossRef]
  52. Hu, H.; Wang, T.; Ren, Y.; Zhang, F.; Zhang, B.; Li, J. A Case Study of Thermal Performance of Gas-Steam Combined Cycle with Gas Turbine Inlet Air Cooling And Condenser Deep Cooling. Case Stud. Therm. Eng. 2024, 60, 104747. [Google Scholar] [CrossRef]
  53. Akhtar, S.; Hui, Y.; Yu, J.; Yu, A. Heat Transfer Performance Analysis of Hydrogen-Ammonia Combustion in a Micro Gas Turbine for Sustainable Energy Solutions. Int. J. Hydrogen Energy 2025, 105, 619–631. [Google Scholar] [CrossRef]
  54. Harper, J.; Cloyd, S.; Pigon, T.; Thomas, B.; Wilson, J.; Johnson, E.; Noble, D.R. Hydrogen Co-Firing Demonstration at Georgia Power’s Plant McDonough: M501G Gas Turbine. In Education; Electric Power; Energy Storage; Fans and Blowers; American Society of Mechanical Engineers: New York, NY, USA, 2023; Volume 6, pp. 1–11. [Google Scholar]
  55. Munther, H.; Hassan, Q.; Mohammed, A.; Hanoon, T.M.; Algburi, S. Techno-Economic and Environmental Evaluation of Green Hydrogen Co-Firing in a 570 MWe Gas Turbine Combined Cycle Power Plant in Iraq. Unconv. Resour. 2025, 6, 100163. [Google Scholar] [CrossRef]
  56. Electric Power Research Institute (EPRI). Taking Gas Turbine Hydrogen Blending to the Next Level; EPRI: California, CA, USA, 2022. [Google Scholar]
Figure 1. Hydrogen co-firing scenario.
Hydrogen 06 00018 g001
Figure 2. Gas turbine system configuration.
Hydrogen 06 00018 g002
Figure 3. (a) The effect of hydrogen co-firing on compressor work; and (b) percentage change in compressor work based on load variations.
Hydrogen 06 00018 g003
Figure 4. (a) The effect of hydrogen co-firing on turbine work; and (b) percentage change in turbine work based on load variations.
Hydrogen 06 00018 g004
Figure 5. (a) The effect of hydrogen co-firing on cycle work; and (b) percentage change in cycle work based on load variations.
Hydrogen 06 00018 g005
Figure 6. (a) The effect of hydrogen co-firing on cycle efficiency; and (b) percentage change in cycle efficiency based on load variations.
Hydrogen 06 00018 g006
Figure 7. The effect of hydrogen co-firing on CO2 emission rate.
Hydrogen 06 00018 g007
Figure 8. The effect of hydrogen co-firing on CO2 emission intensity.
Hydrogen 06 00018 g008
Table 1. Design and operation data.
ParametersLoad
100%75%50%
Inlet air temperature [°C]303030
Inlet air pressure [bar]1.013251.013251.01325
Inlet air mass flow [kg/h]2,188,0001,949,7201,642,430
Compressed air temperature [°C]448418389
Compressed air pressure [bar]15.8013.0010.40
Natural gas temperature [°C]200200200
Natural gas pressure [bar]434343
Natural gas mass flow [kg/h]54,40044,22034,180
Natural gas LHV [kJ/kg]43,37743,37743,377
Flue gas temperature [°C]610567556
Flue gas pressure [bar]1.018831.016871.01354
Cycle work [kW]238,500178,800119,200
Cycle efficiency [%]36.3933.5628.94
Compressor adiabatic head [m]36,88433,24429,312
Compressor adiabatic efficiency [%]81.8079.6976.17
Table 2. Composition of air and fuel.
ComponentComposition [%mol.]
Inlet AirNatural GasHydrogen
Oxygen (O2)21-0.10
Carbon dioxide (CO2)-5.00-
Nitrogen (N2)790.61-
Methane (CH4)-84.49-
Ethane (C2H6)-4.91-
Propane (C3H8)-2.88-
i-Butane (iC4)-0.79-
n-Butane (nC4)-0.60-
i-Pentane (iC5)-0.27-
n-Pentane (nC5)-0.17-
Hexane (C6)-0.15-
Heptane plus (C7+)-0.12-
Hydrogen (H2)--99.90
Table 3. Base model validation.
Load 100%
ParametersReferenceSimulationDev. [%]
Inlet air temperature [°C]30300.000
Inlet air pressure [bar]1.013251.013250.000
Inlet air mass flow [kg/h]2,188,0002,188,0000.000
Compressed air temperature [°C]448.00448.220.049
Compressed air pressure [bar]15.8015.800.000
Natural gas temperature [°C]2002000.000
Natural gas pressure [bar]43430.000
Natural gas mass flow [kg/h]54,40054,4000.000
Natural gas LHV [kJ/kg]43,37743,3850.018
Flue gas temperature [°C]6106100.000
Flue gas pressure [bar]1.018841.018840.000
Flue gas mass flow [kg/h]2,242,4002,242,3910.000
Cycle work [kW]238,500240,0030.630
Cycle efficiency [%]36.3936.610.612
Load 75%
ParametersReferenceSimulationDev. [%]
Inlet air temperature [°C]30300.000
Inlet air pressure [bar]1.013251.013250.000
Inlet air mass flow [kg/h]1,949,7201,949,7200.000
Compressed air temperature [°C]418.00418.070.016
Compressed air pressure [bar]13.0013.000.000
Natural gas temperature [°C]2002000.000
Natural gas pressure [bar]43430.000
Natural gas mass flow [kg/h]44,22044,2200.000
Natural gas LHV [kJ/kg]43,37743,3850.018
Flue gas temperature [°C]5675670.000
Flue gas pressure [bar]1.016881.016880.000
Flue gas mass flow [kg/h]1,993,9401,993,9330.000
Cycle work [kW]178,800179,8420.583
Cycle efficiency [%]33.5633.750.564
Load 50%
ParametersReferenceSimulationDev. [%]
Inlet air temperature [°C]30300.000
Inlet air pressure [bar]1.013251.013250.000
Inlet air mass flow [kg/h]1,642,4301,642,4300.000
Compressed air temperature [°C]389.00388.80−0.050
Compressed air pressure [bar]10.4010.39−0.096
Natural gas temperature [°C]2002000.000
Natural gas pressure [bar]43430.000
Natural gas mass flow [kg/h]34,18034,1800.000
Natural gas LHV [kJ/kg]43,37743,3850.018
Flue gas temperature [°C]5565560.000
Flue gas pressure [bar]1.013541.013540.000
Flue gas mass flow [kg/h]1,676,6101,676,6040.000
Cycle work [kW]119,200120,3900.998
Cycle efficiency [%]28.9429.230.980
Table 4. Hydrogen co-firing simulation results on material streams.
Load 100%
Co-firing Ratio [vol.%]051015202530
Natural gas mass flow [kg/h]54,40053,42552,38251,26350,06048,76447,362
Hydrogen mass flow [kg/h]03527301134156920372544
Mixed fuel mass flow [kg/h]54,40053,77753,11252,39751,62950,80149,906
Mixed fuel LHV [kJ/kg]43,38543,88544,43645,03945,70846,45047,281
Mixed fuel heat input [kW]655,596655,561655,573655,534655,514655,472655,451
Excess air ratio2.342.342.342.342.342.342.34
Inlet air mass flow [kg/h]2,188,0002,177,0532,165,3412,152,7802,139,2762,124,7182,108,976
Inlet air temperature [°C]30303030303030
Compressed air temperature [°C]448447445443442440438
Hot gas mass flow [kg/h]2,242,3912,230,8212,218,4442,205,1682,190,8962,175,5102,158,873
Hot gas temperature [°C]1266126812711273127612791282
Flue gas mass flow [kg/h]2,242,3912,230,8212,218,4442,205,1682,190,8962,175,5102,158,873
Flue gas temperature [°C]610610610610610610610
Load 75%
Co-firing Ratio [vol.%]051015202530
Natural gas mass flow [kg/h]44,22043,42742,58041,67040,69239,63838,499
Hydrogen mass flow [kg/h]0286593922127516562068
Mixed fuel mass flow [kg/h]44,22043,71443,17342,59241,96841,29540,567
Mixed fuel LHV [kJ/kg]43,38543,88644,43545,03945,70746,45047,282
Mixed fuel heat input [kW]532,912532,896532,879532,861532,841532,820532,797
Excess air ratio2.562.562.562.562.562.562.56
Inlet air mass flow [kg/h]1,949,7201,939,9651,929,5281,918,3361,906,3021,893,3291,879,302
Inlet air temperature [°C]30303030303030
Compressed air temperature [°C]418417416415413412410
Hot gas mass flow [kg/h]1,993,9331,983,6721,972,6941,960,9211,948,2631,934,6171,919,862
Hot gas temperature [°C]1158116011631165116811711175
Flue gas mass flow [kg/h]1,993,9331,983,6721,972,6941,960,9211,948,2631,934,6171,919,862
Flue gas temperature [°C]567567567567567567567
Load 50%
Co-firing Ratio [vol.%]051015202530
Natural gas mass flow [kg/h]34,18033,56732,91232,20931,45330,63929,758
Hydrogen mass flow [kg/h]022145871298612801599
Mixed fuel mass flow [kg/h]34,18033,78933,37032,92232,43931,91931,356
Mixed fuel LHV [kJ/kg]43,38543,88644,43545,03945,70746,45047,282
Mixed fuel heat input [kW]411,916411,904411,891411,877411,861411,845411,827
Excess air ratio2.792.792.792.792.792.792.79
Inlet air mass flow [kg/h]1,642,4301,634,2131,625,4211,615,9921,605,8551,594,9271,583,111
Inlet air temperature [°C]30303030303030
Compressed air temperature [°C]389388387386385384383
Hot gas mass flow [kg/h]1,676,6041,667,9961,658,7861,648,9081,638,2891,626,8401,614,462
Hot gas temperature [°C]1073107610781081108410871090
Flue gas mass flow [kg/h]1,676,6041,667,9961,658,7861,648,9081,638,2891,626,8401,614,462
Flue gas temperature [°C]556556556556556556556
Disclaimer/Publisher’s Note: The statements, opinions and data contained in all publications are solely those of the individual author(s) and contributor(s) and not of MDPI and/or the editor(s). MDPI and/or the editor(s) disclaim responsibility for any injury to people or property resulting from any ideas, methods, instructions or products referred to in the content.

