1. Introduction
As the mobility sector advances toward defossilization, sustainability in aviation has taken on an ever more critical role. The aviation industry is responsible for approximately 1 Gt of CO
2 emissions annually, accounting for roughly 10% of total transport-related greenhouse gas emissions [
1]. In order to curtail CO
2 emissions, novel propulsion technologies are essential. Beyond sustainable aviation fuels (SAFs), renewable hydrogen (H
2) stands out as a renewable-based, carbon-free solution offering high gravimetric energy density and favorable combustion properties [
2].
Hydrogen can be produced with high efficiency, achieving energy efficiencies of up to 85% [
3]. Similarly, some bio-based SAFs can be produced with relatively high efficiency. For example, Hydroprocessed Esters and Fatty Acids (HEFA) exhibit an overall energy efficiency of up to 90%, measured as the ratio of energy output flow to energy input flow in watt per watt (W/W) [
4]. However, it is important to note that feedstock availability and production capacity are key limitations for bio-based SAFs [
5].
In contrast, synthetic SAFs, such as those produced via the Fischer–Tropsch process, typically have lower production efficiencies, also referred to as the SAF yield. This metric, defined as the ratio of grams of fuel output to grams of input feedstock (g/g), reaches only up to 21% in this case [
6].
General aviation commonly relies on internal combustion engines (ICE) thanks to their robustness, cost-effectiveness, and high thermal efficiency at high loads. In this context, hydrogen (H
2) represents a promising alternative fuel with relatively low purity requirements in ICE compared to fuel cells, making it a viable solution for reducing aviation-related carbon emissions [
2].
H
2 mixture formation can be achieved through port fuel injection (PFI) or direct injection (DI). PFI facilitates cost-efficient implementation, low injection pressures, and homogeneous mixture preparation but compromises volumetric efficiency and is susceptible to backfire. In contrast, DI mitigates these drawbacks by injecting hydrogen directly into the combustion chamber, yet it requires high-pressure injection systems and increased system complexity [
2].
A particularly promising ignition strategy is dual-fuel combustion, in which a small fraction of pilot fuel (e.g., Kerosene Jet-A1) auto-ignites under compression, subsequently initiating combustion of the H
2-air mixture. This approach enables flexible operation on conventional aviation fuels, facilitates the retrofitting of existing ICEs, and contributes to substantial CO
2 emission reductions. Moreover, it allows for the integration of sustainable aviation fuels (SAF), which is a further step towards carbon neutrality. However, the maximum feasible H
2 energy share is often constrained by abnormal combustion, necessitating advanced control and optimization strategies to ensure stable operation [
2].
Abnormal combustion is a combustion process in which a flame front may be started by hot combustion-chamber surfaces either prior to or after (spark) ignition, or a process in which some part of the charge spontaneously ignites, rapidly releasing its chemical energy, according to Heywood [
7]. Generally, this can be categorized into several phenomena. However, in the following, only knocking and preignition are discussed, as these are the most relevant for the investigations.
1.1. Abnormal Combustion
1.1.1. Knocking
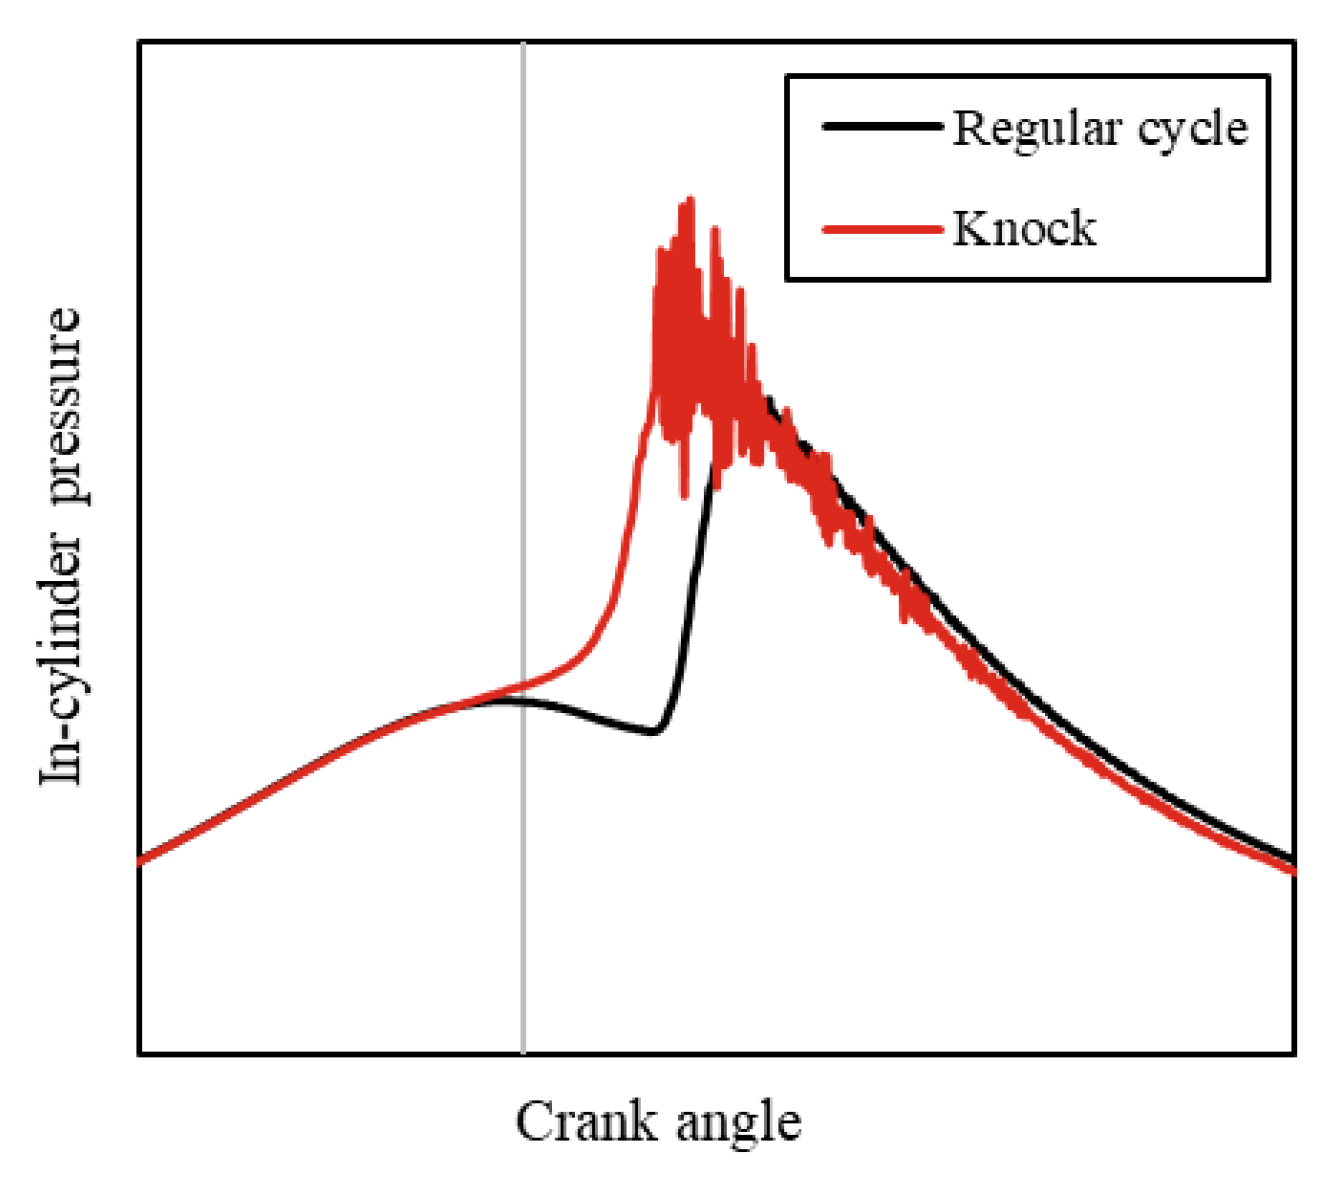
When knocking occurs, the end-gas (unburned air–fuel mixture in front of the flame front) is heated up by the pressure and temperature front until the mixture auto-ignites. The fast heat release leads to pressure waves that interfere and reflect, which is visible as a high-frequency pressure signal during the expansion stroke [
7,
8].
Figure 1 illustrates a knocking cycle in comparison to a regular cycle. During the investigations, knocking only occurred at low load induced by preignitions.
1.1.2. Preignitions
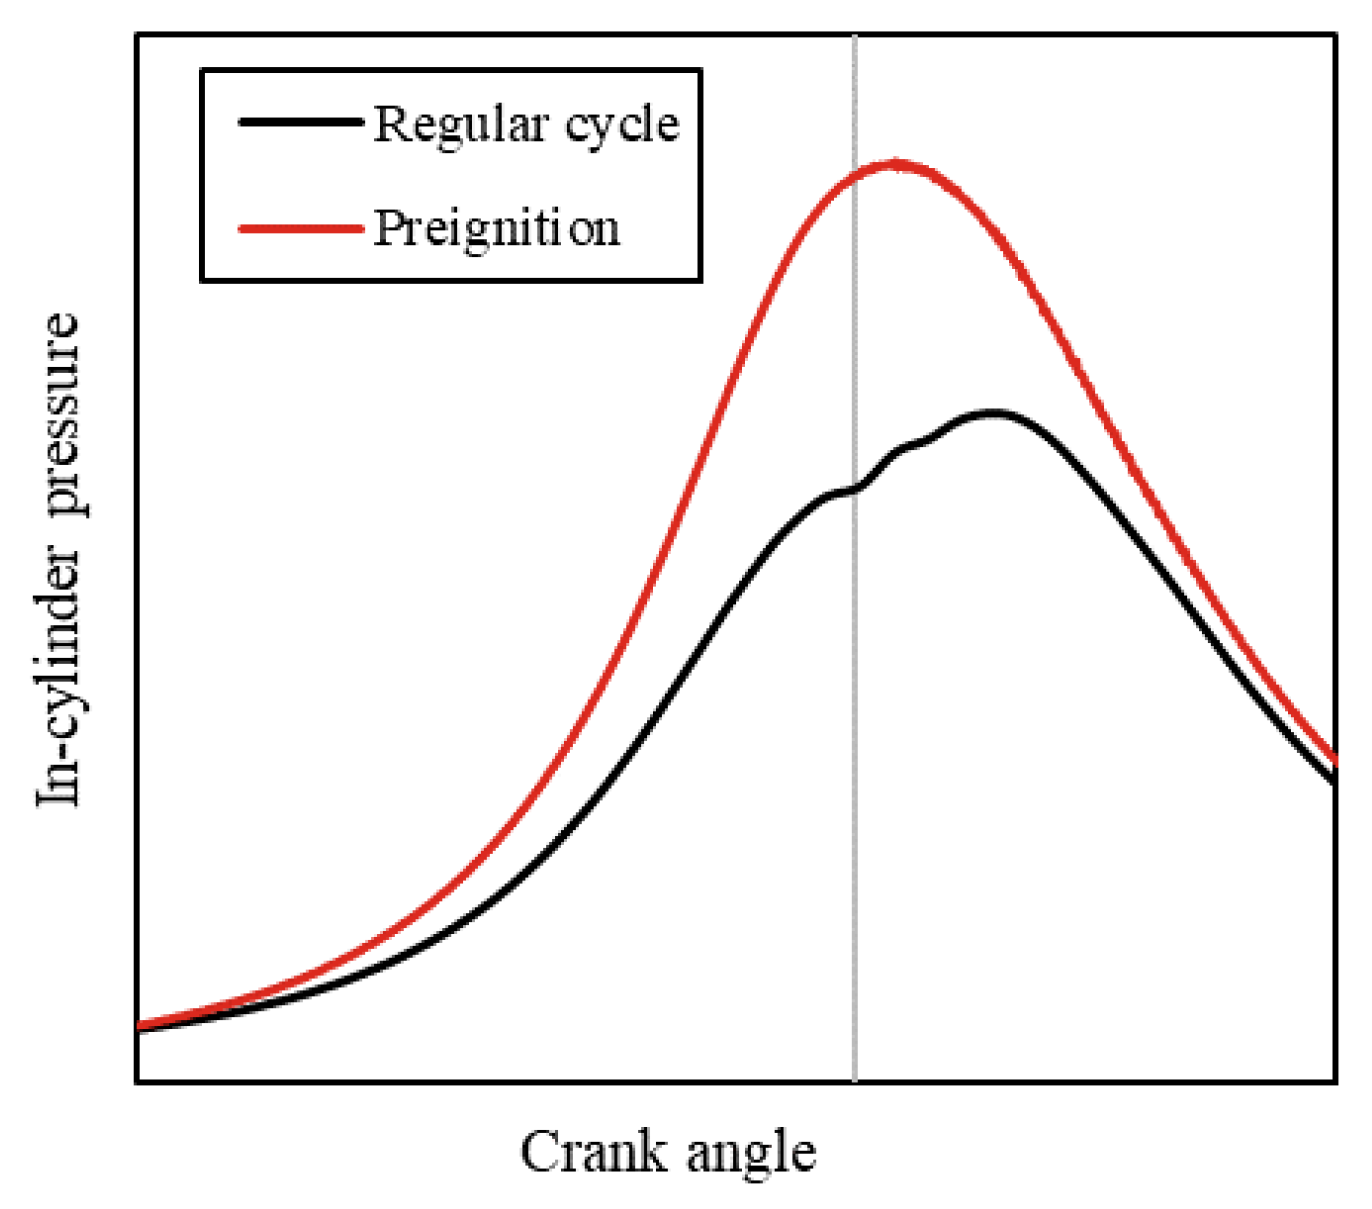
Local ignitions occur sporadically with no externally detectable history. The pressure curve resembles combustion with early ignition timing. Potential triggers are mixture inhomogeneities, deposits detaching from the cylinder wall, and oil droplets or particles that ignite the mixture [
7,
8]. An example of a preignition cycle compared to a regular cycle is shown in
Figure 2. Within the research, spontaneous preignitions happened both at low and high load when reaching a critical hydrogen energy share. However, at low load, these were not considered harmful, as they did not lead to critical pressure in the cylinder. On the other hand, at high load, this increase in pressure level is indeed critical.
By considering these abnormal combustion phenomena, the maximum achievable shares of hydrogen energy can ultimately be defined for each operating point. These limitations are to be addressed through various strategies, which will be explained in the following.
1.2. Counter-Measures
In the following section, the two selected strategies (water injection and increasing air–fuel ratio) for reducing pre-ignition tendency will be briefly discussed.
Another strategy that is commonly employed in such scenarios is exhaust gas recirculation (EGR). Although this method was considered during the study, it is not discussed in this paper due to experimental limitations.
1.2.1. Water Injection (WI)
The injection of water into the intake manifold leads to two effects that reduce abnormal combustion. Firstly, the energy required to vaporize the injected water is taken from the intake air, which leads to a reduction in the charge temperature. Secondly, due to the high specific heat capacity of water, the in-cylinder temperature is reduced. The lower the temperatures in the combustion chamber, the lower the tendency of preignitions.
Chintala et al. states in their study that they were able to increase the hydrogen energy share from 20% up to 39% with water injection at 1500 RPM and 100% load [
9] or even up to 90% with water injection and reduced compression ratio [
10]. Serrano et al. showed that water injection could increase the hydrogen energy share from 29% to 45% at 2000 RPM and 80 Nm [
11].
1.2.2. Increasing AFR by Raising Boost Pressure
Increasing boost pressure, thus increasing the air–fuel ratio (AFR), also has some considerable effects on the combustion. Firstly, with further dilution of the air–fuel mixture, the heat capacity is increased, which leads to lower combustion temperatures. Still, increased boost pressure also results in higher compression pressures and, hence, an overall higher temperature in the combustion chamber. In this manner, negative findings were reported, e.g., Nagalingam et al. [
12] and Berckmüller et al. [
13].
Secondly, but more importantly, higher AFR causes an increase in the minimum ignition energy required to ignite hydrogen. Seykens et al. showed that higher AFR is necessary at higher loads to suppress knocking [
14]. Li et al. also concluded that a higher air–fuel ratio leads to lower knock tendency [
15].
Thirdly, higher AFR decreases the soot formation of hydrocarbon combustion which promotes particle-induced preignitions [
8].
As Golisano et al. [
16] showed, the near-stoichiometric operation is unsuited for the means of knocking and NO
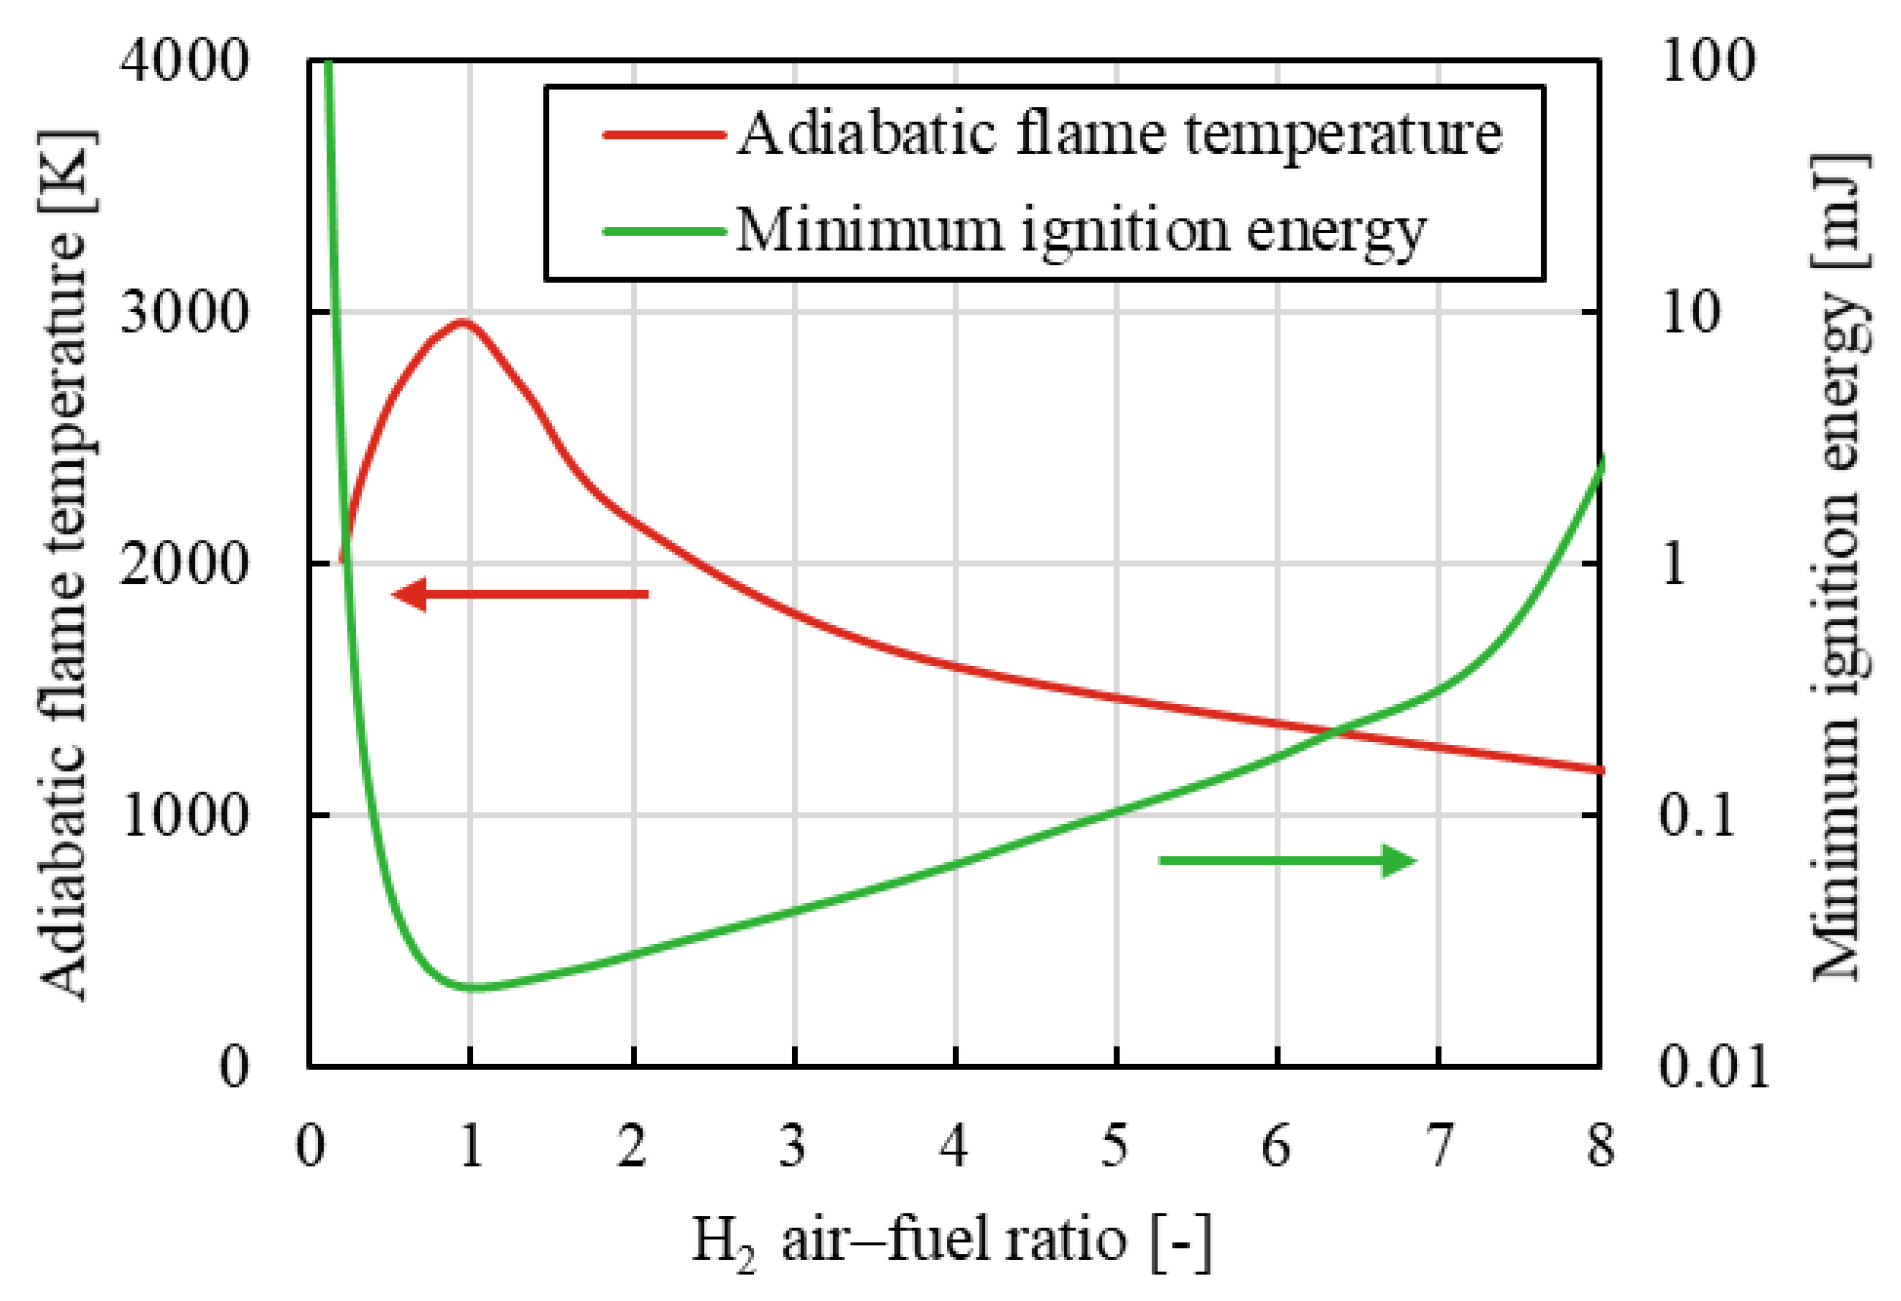
x emissions. The preferred operation range in this respect is between an AFR of 2 and 2.3. However, it should be noted that such high AFRs, especially in the high-load range, are often not feasible due to mechanical limits (e.g., cylinder peak pressure and intake manifold pressure) and charging system limits.
The correlation can be explained on the basis of the properties of hydrogen.
Figure 3 illustrates the adiabatic flame temperature [
17] and the minimum ignition energy [
3] of hydrogen as a function of AFR. It can be observed that both the global maximum of the adiabatic flame temperature and the global minimum of the minimum ignition energy are in the range of AFR = 1, which consequently leads to high thermal NO
x formation and an increased tendency towards preignition or knocking. The aim should be to operate as leanly as possible in this regard.
Although numerous studies have been carried out on these topics, there are only a few that show and analyze the influence on dual-fuel H2 combustion. In particular, there has not yet been a comparison and evaluation of several strategies in this form. In addition, there is a general lack of studies of high load points in relation to dual-fuel H2 combustion in the literature.
To address the presented challenges and fill the identified research gap, the objective of this study is to experimentally and numerically analyze the effects of water injection and boost pressure variation on hydrogen–kerosene dual-fuel combustion, with the goal of increasing the maximum achievable hydrogen energy share, while ensuring stable engine operation.
Section 1 and
Section 2 build upon and expand the investigations presented in [
2], as the results are derived from the same research project.
3. Results
This Section presents the experimental results of the investigations, focusing on cylinder pressure, heat release rates, kerosene injection signals, and cumulative heat release rates. Additionally, key combustion characteristics, emission levels, and indicated efficiency are analyzed and discussed. The findings are subdivided into separate subsections on the strategies undertaken to increase the hydrogen energy share. These include water injection and leaner operation by increasing the boost pressure. Finally, the results regarding the maximum hydrogen energy share are then summarized.
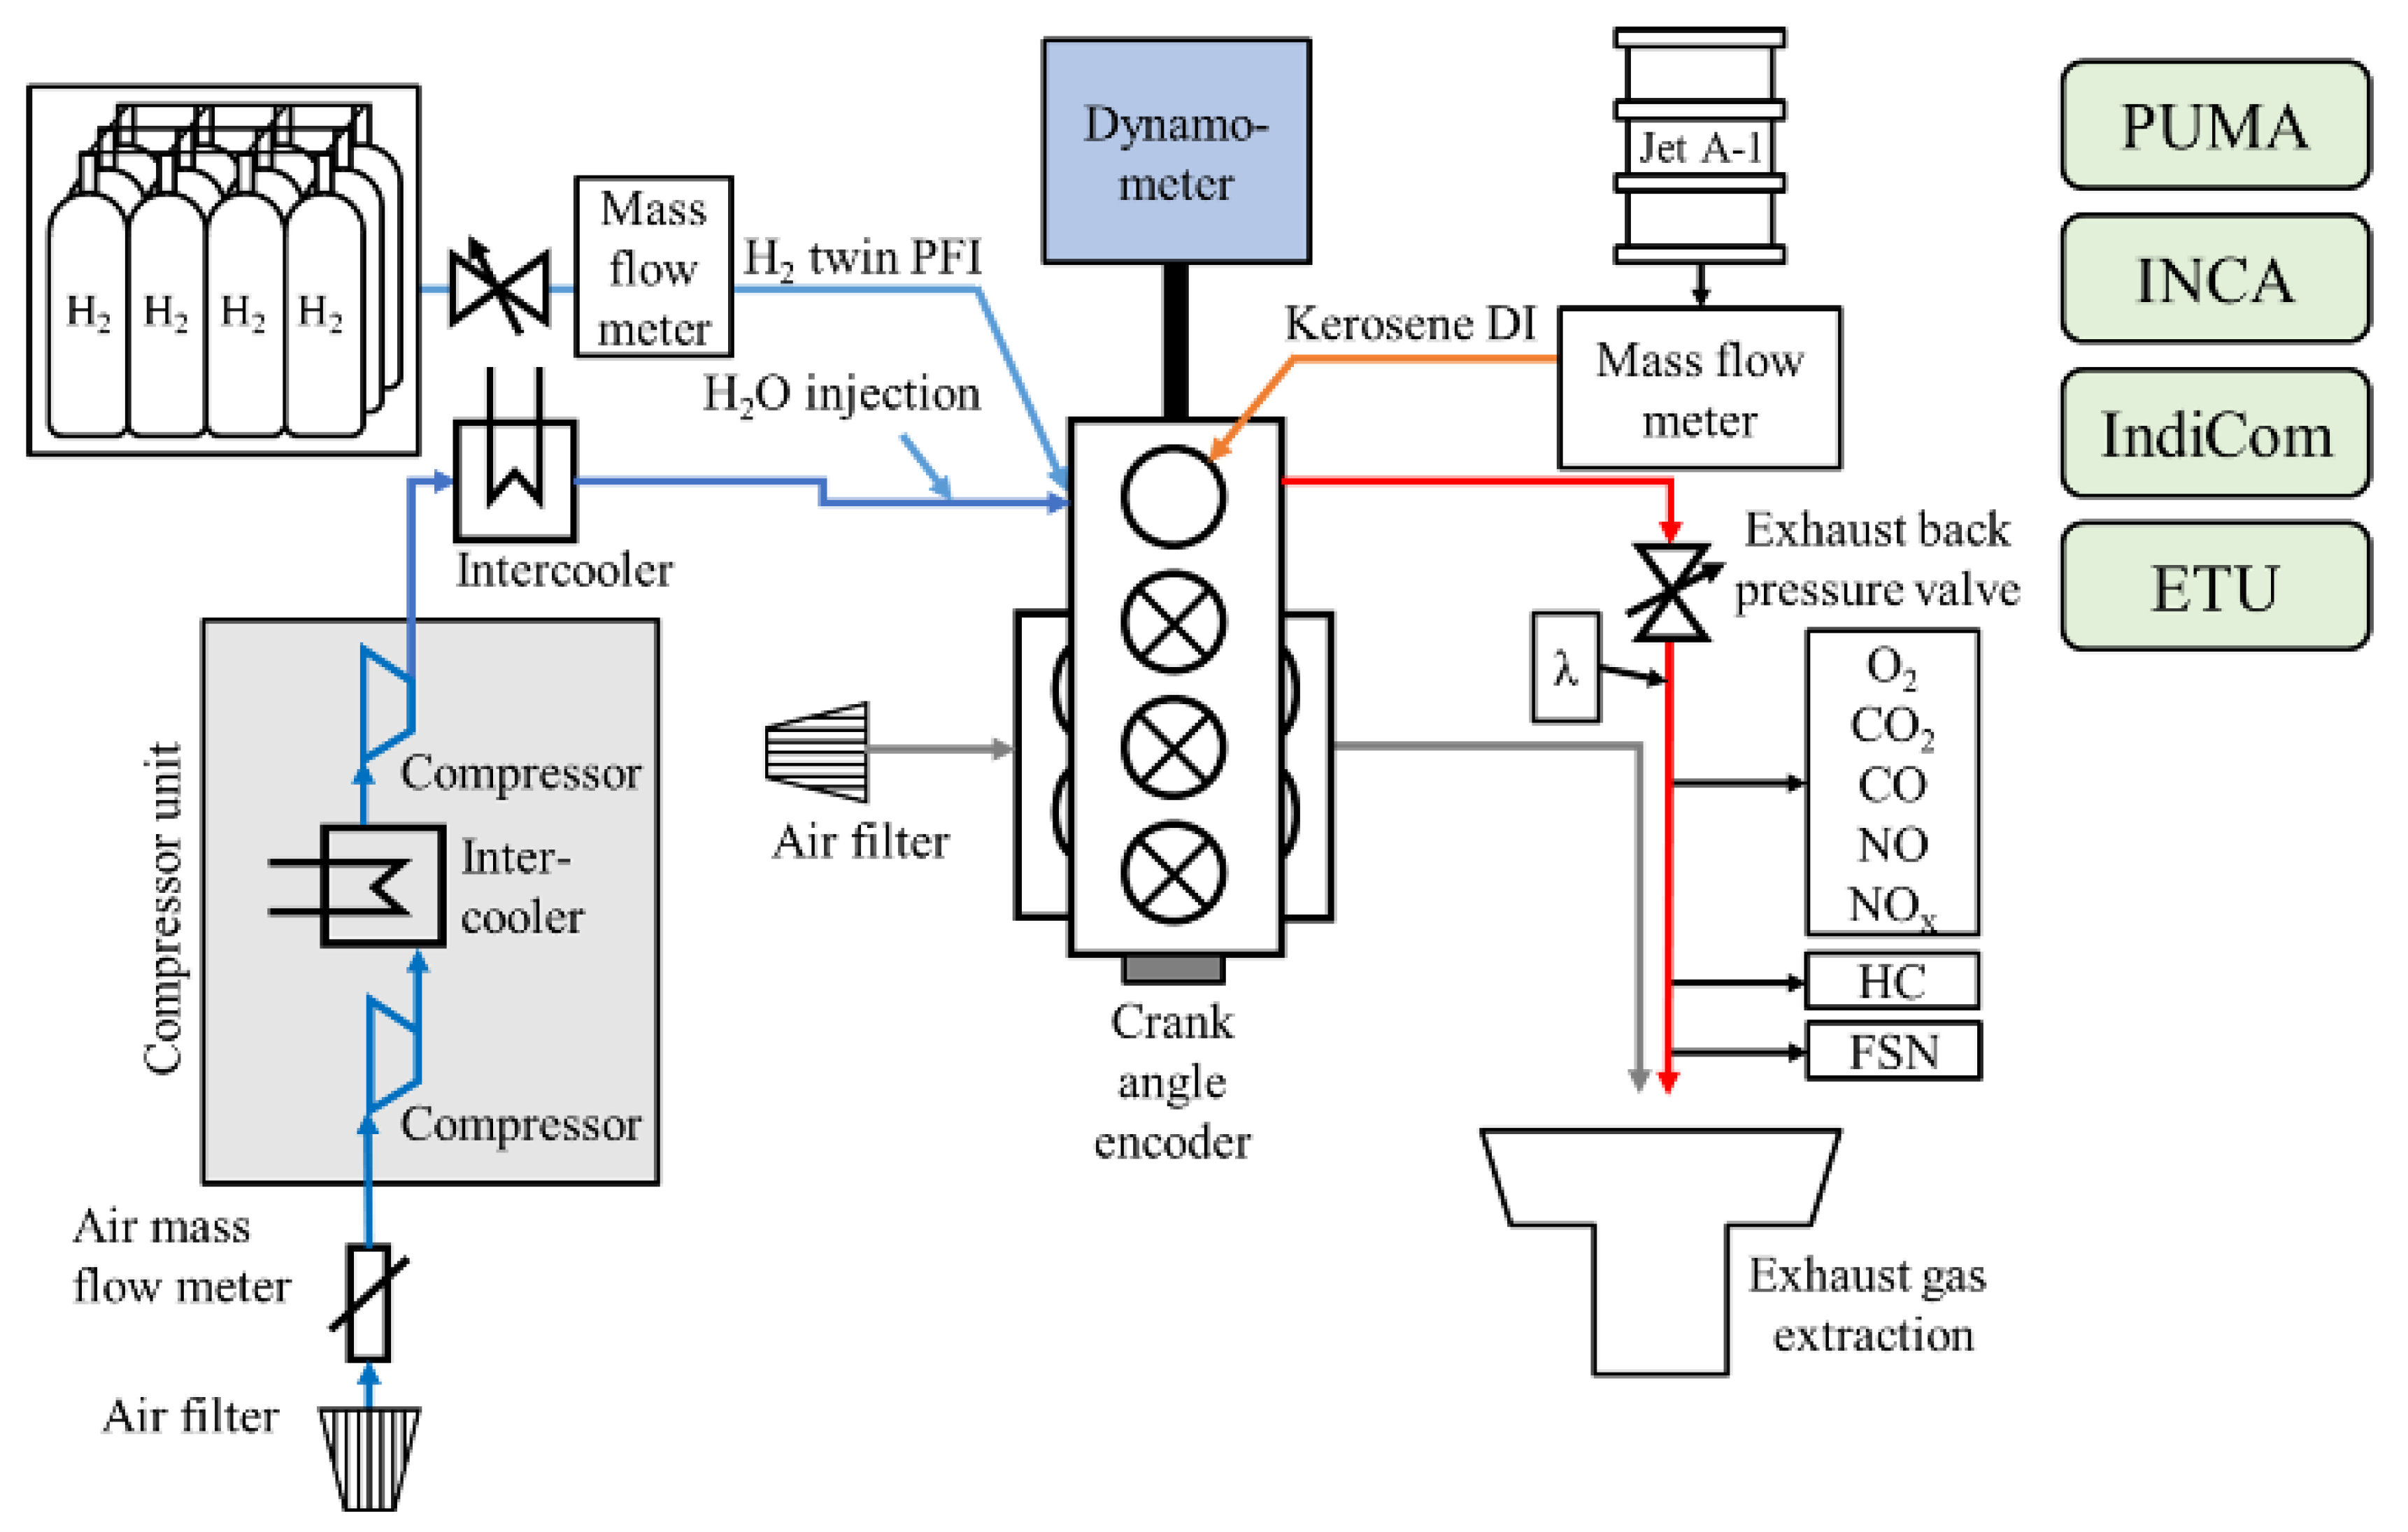
For all investigations shown, the kerosene pre-injections were deactivated and only the kerosene main-injection was used as an ignition-trigger for the hydrogen–air mixture.
For improved comparability, the indicated mean effective pressure (IMEP) and the combustion phasing (MFB50%) were maintained constant across all variations within a given operating point.
All measurements were recorded for one minute, respectively, for 200 cycles and then averaged. The ignition delay was calculated as the time between the start of injection (SOI), determined from the kerosene injector signal, and the start of combustion (SOC), which is the crank angle position of the zero crossing from the negative to the positive range of the heat release. The combustion duration describes the time interval between the conversion from SOC to 90% (MFB90%) of the total energy. The heat release rate is calculated using the measured cylinder pressure, according to Hohenberg’s “rapid heat release law” [
21].
All diagrams shown in this Section are standardized, which means there are only relative, and no absolute values are displayed. In terms of emissions, the measured exhaust concentrations (ppm) were converted into specific mass emissions (g/kWh) using the method described by Brettschneider [
22].
3.1. Water Injection (WI)
The first implemented strategy to reduce in-cylinder temperatures and thus pre-ignition or knocking tendencies covers the injection of distilled water into the intake manifold. The SWC was varied by 100 g/kWh increments for all shown operating points until a noticeable increase in the measured blowby volume flow rate was detected, which can be attributed to increased water content in the engine oil. The maximum SWC is therefore 300 g/kWh for OP1 and slightly less for OP2 at 200 g/kWh.
3.1.1. Low-Load Operating Point (OP1)
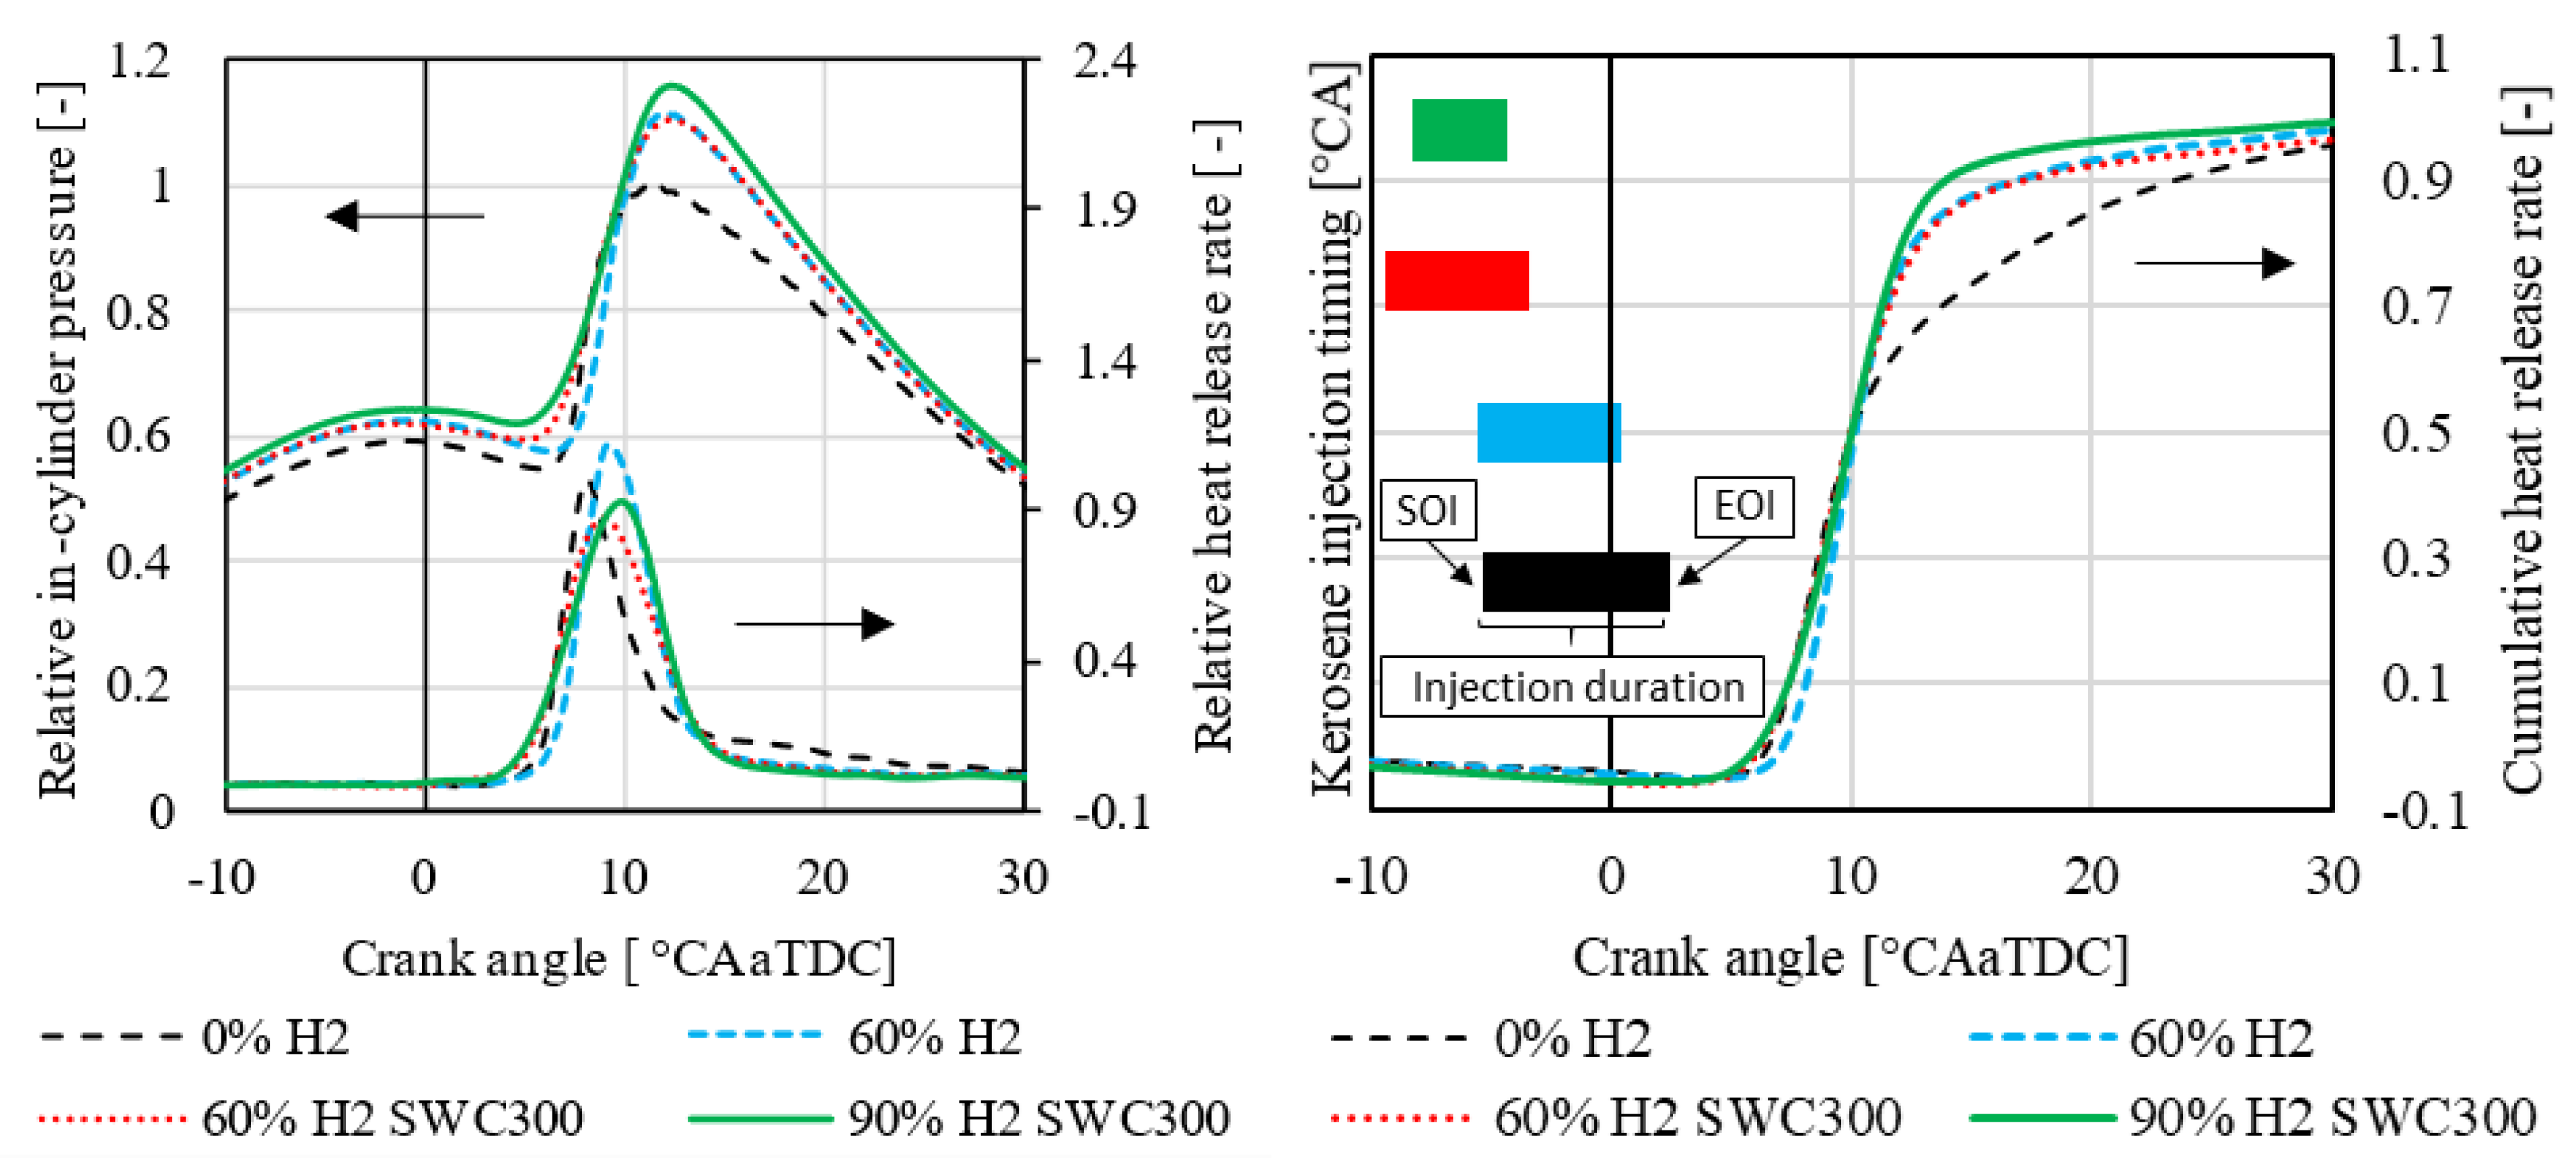
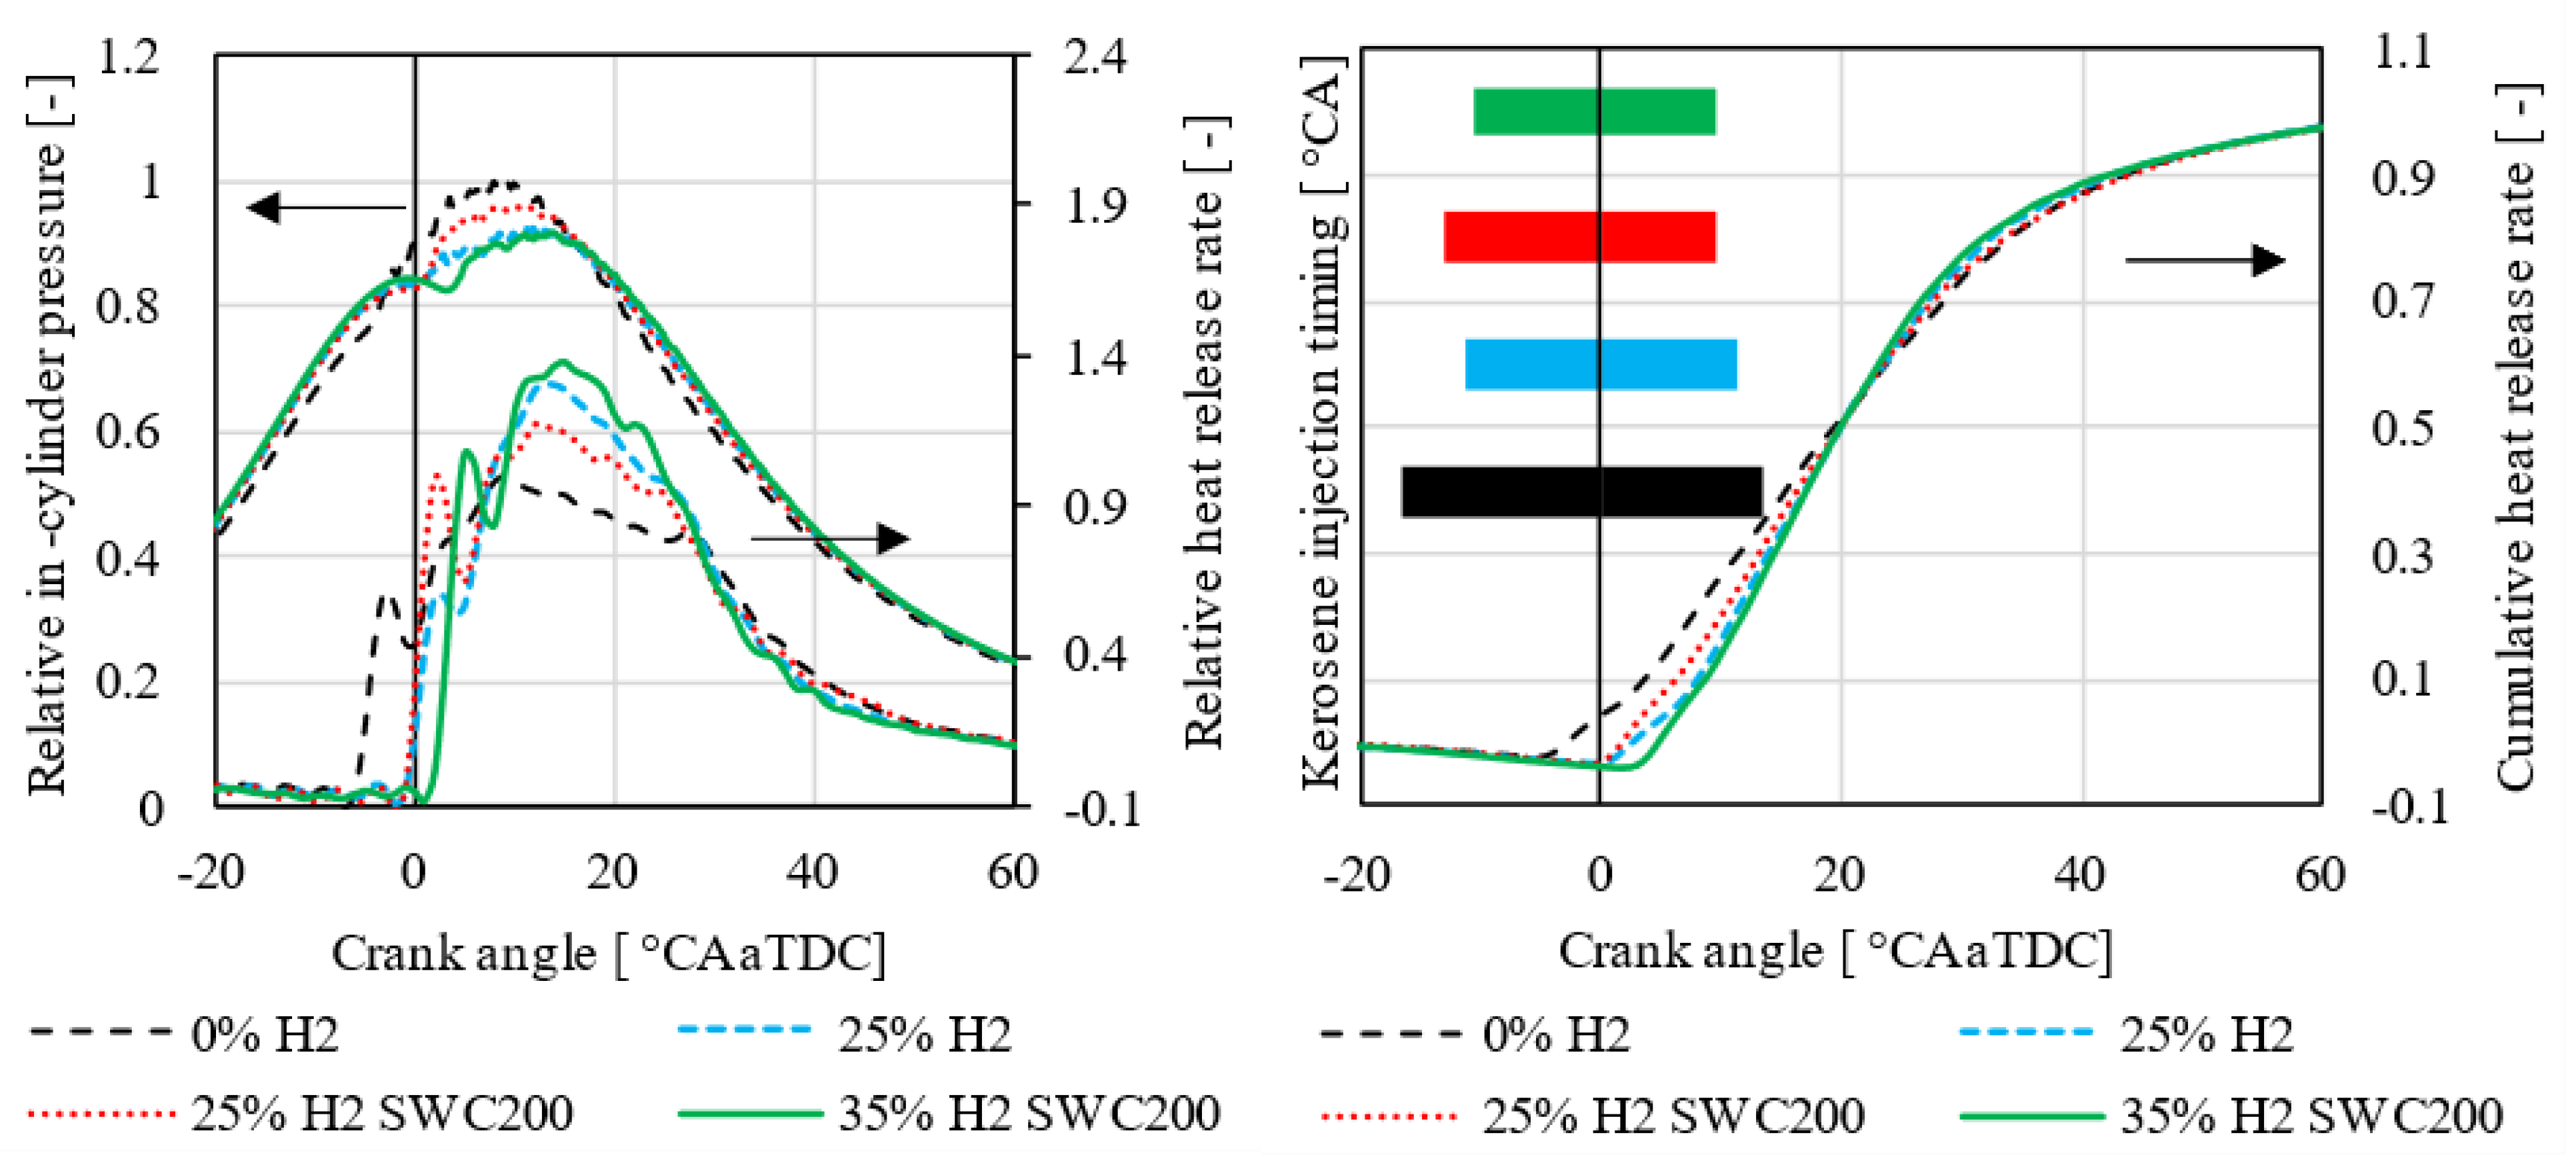
Figure 6 (left) shows the relative in-cylinder pressure and heat release rate for OP1 in the kerosene-only operation (0% H
2), with maximum hydrogen energy share without water injection (60% H
2), the same hydrogen energy share with water injection (60% H
2 SWC300), and maximum hydrogen energy share enabled by water injection (90% H
2 SWC 300). Higher hydrogen shares lead to increased in-cylinder pressure and peak combustion pressure, primarily due to elevated intake manifold pressure from high-pressure port fuel injection and the fast combustion characteristics of hydrogen. Water injection reduces the peak heat release due to the lowered temperatures, although the peak in-cylinder pressure is not altered significantly.
Figure 6 (right) illustrates the cumulative heat release rate and the kerosene injection timing, showing the start of injection (SOI), the injection duration and the end of injection (EOI). With the increasing hydrogen share, the kerosene injection timing is advanced due to prolonged ignition delay. At 90% H
2 SWC300, however, SOI shifts slightly later, indicating that hydrogen’s high reactivity compensates for ignition delay at extreme shares. The cumulative heat release rate exhibits a steep gradient associated with hydrogen combustion, which favorably impacts the overall combustion duration.
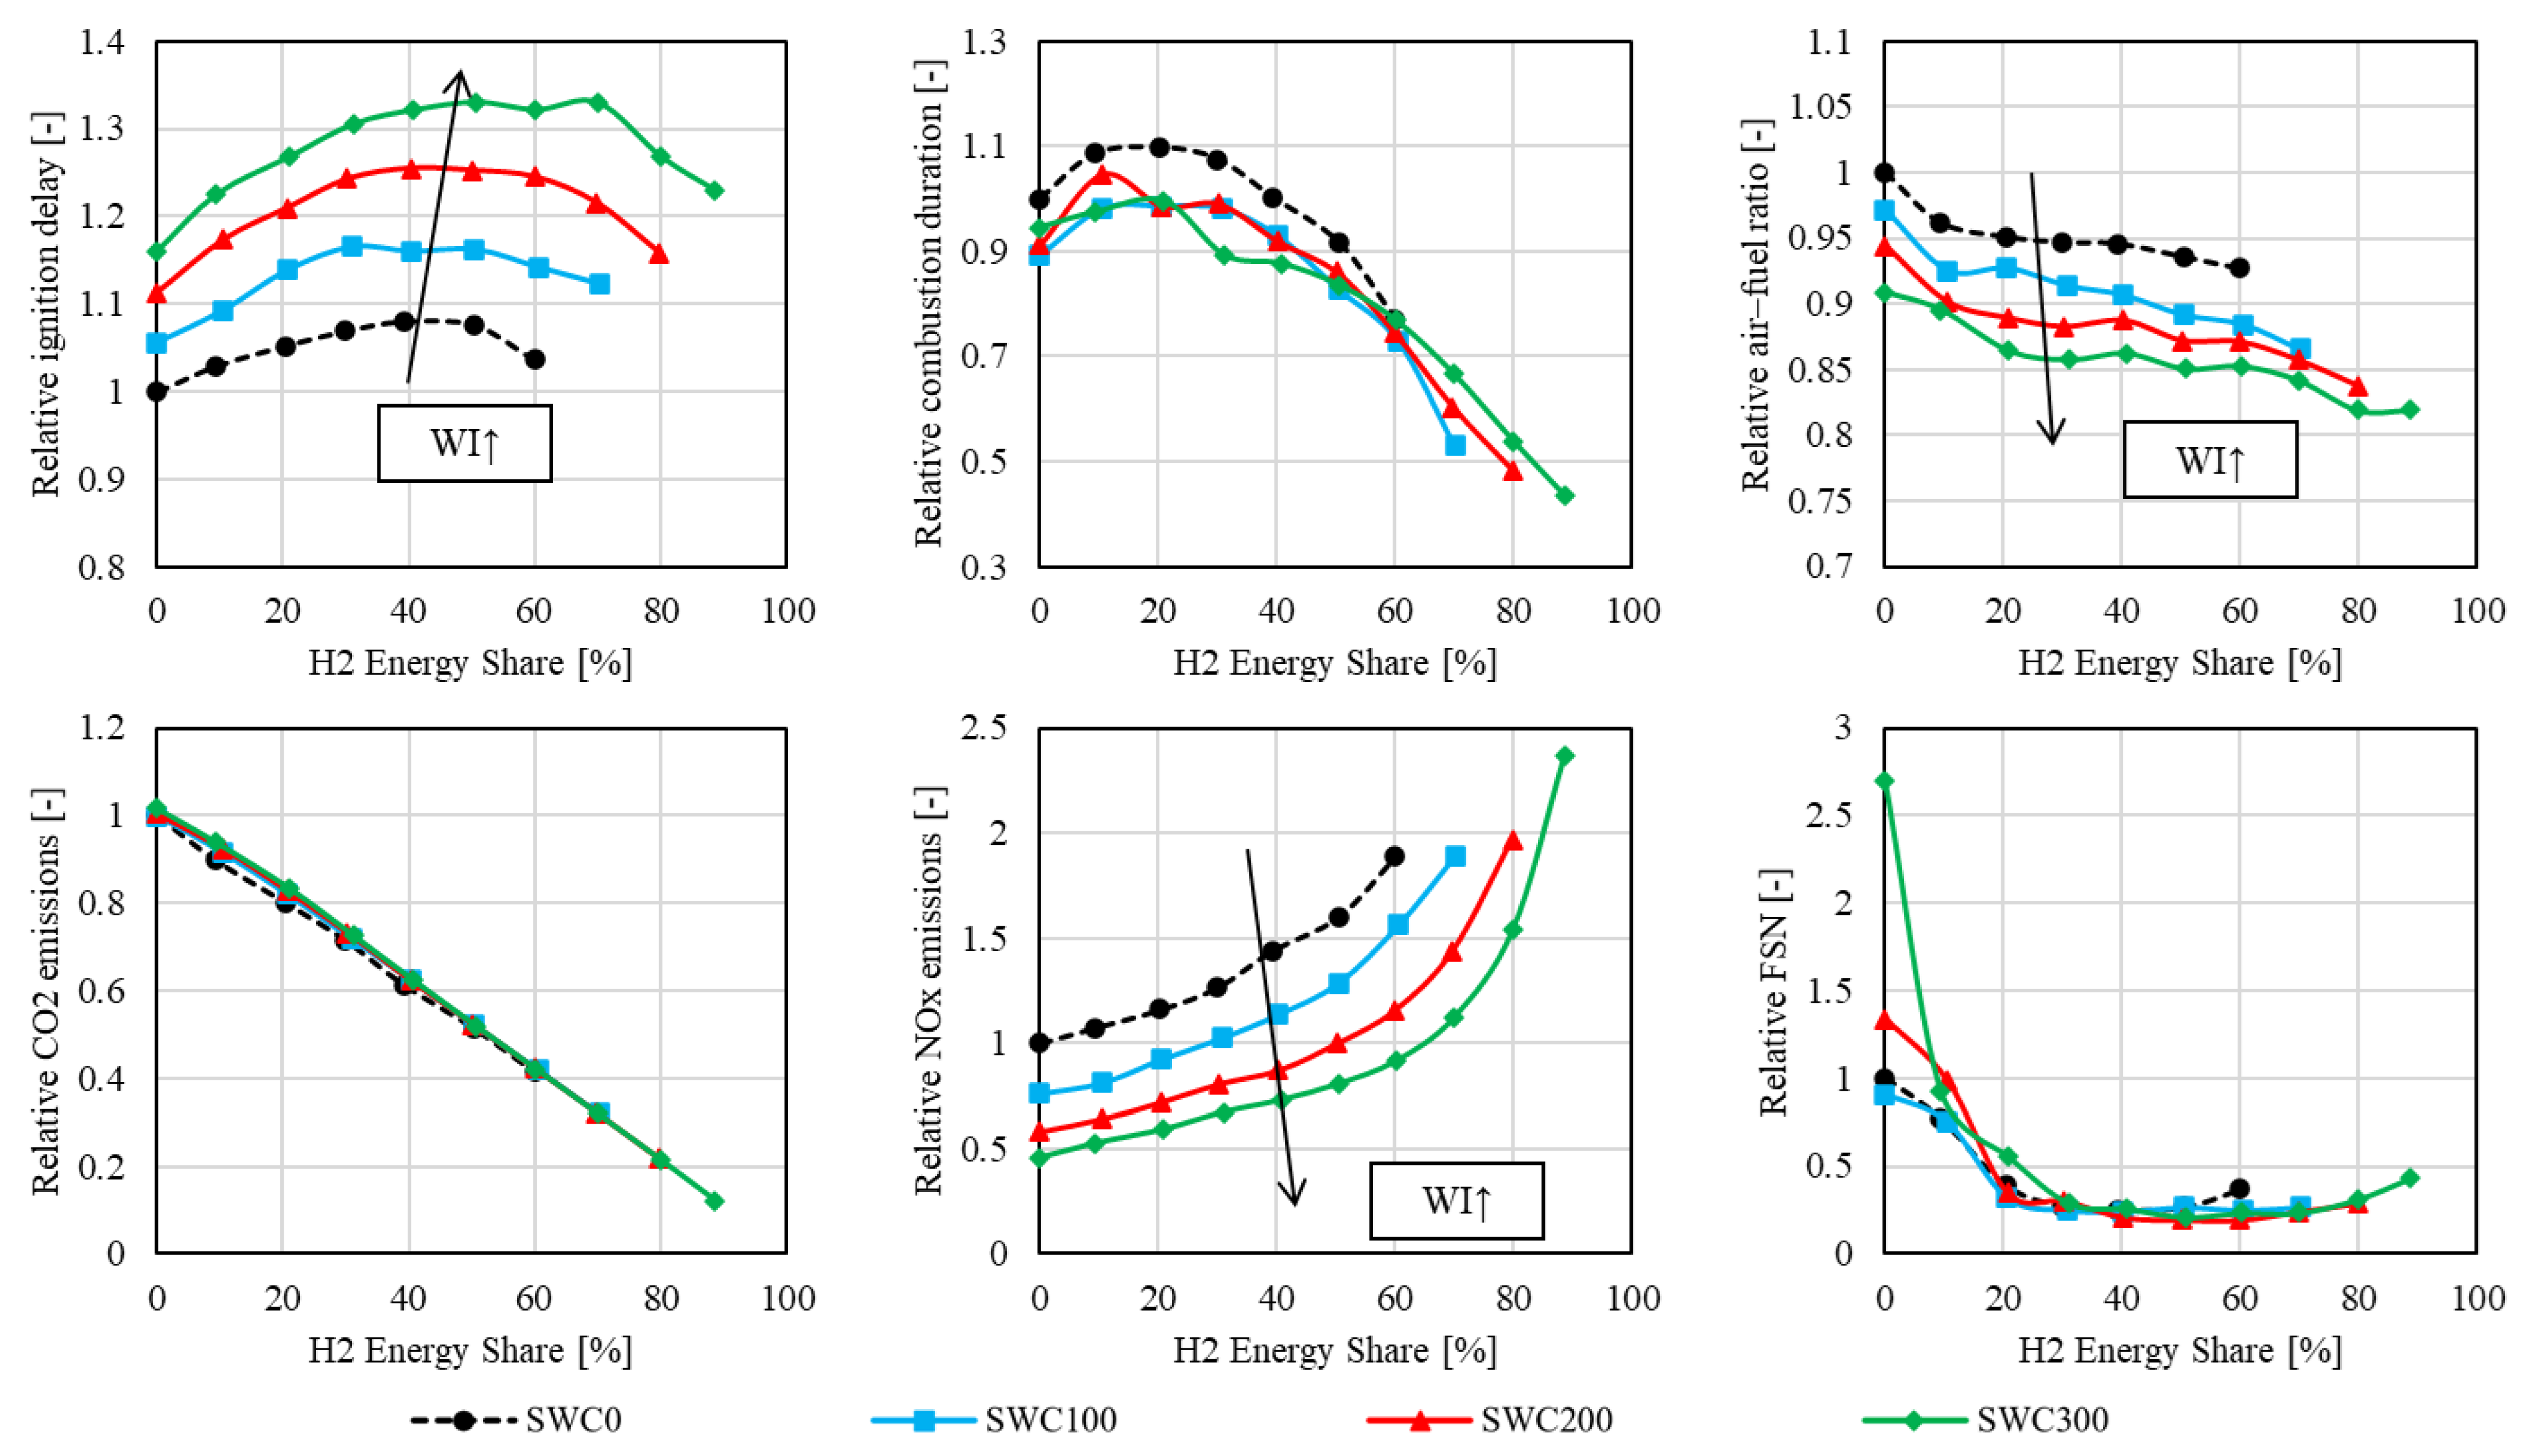
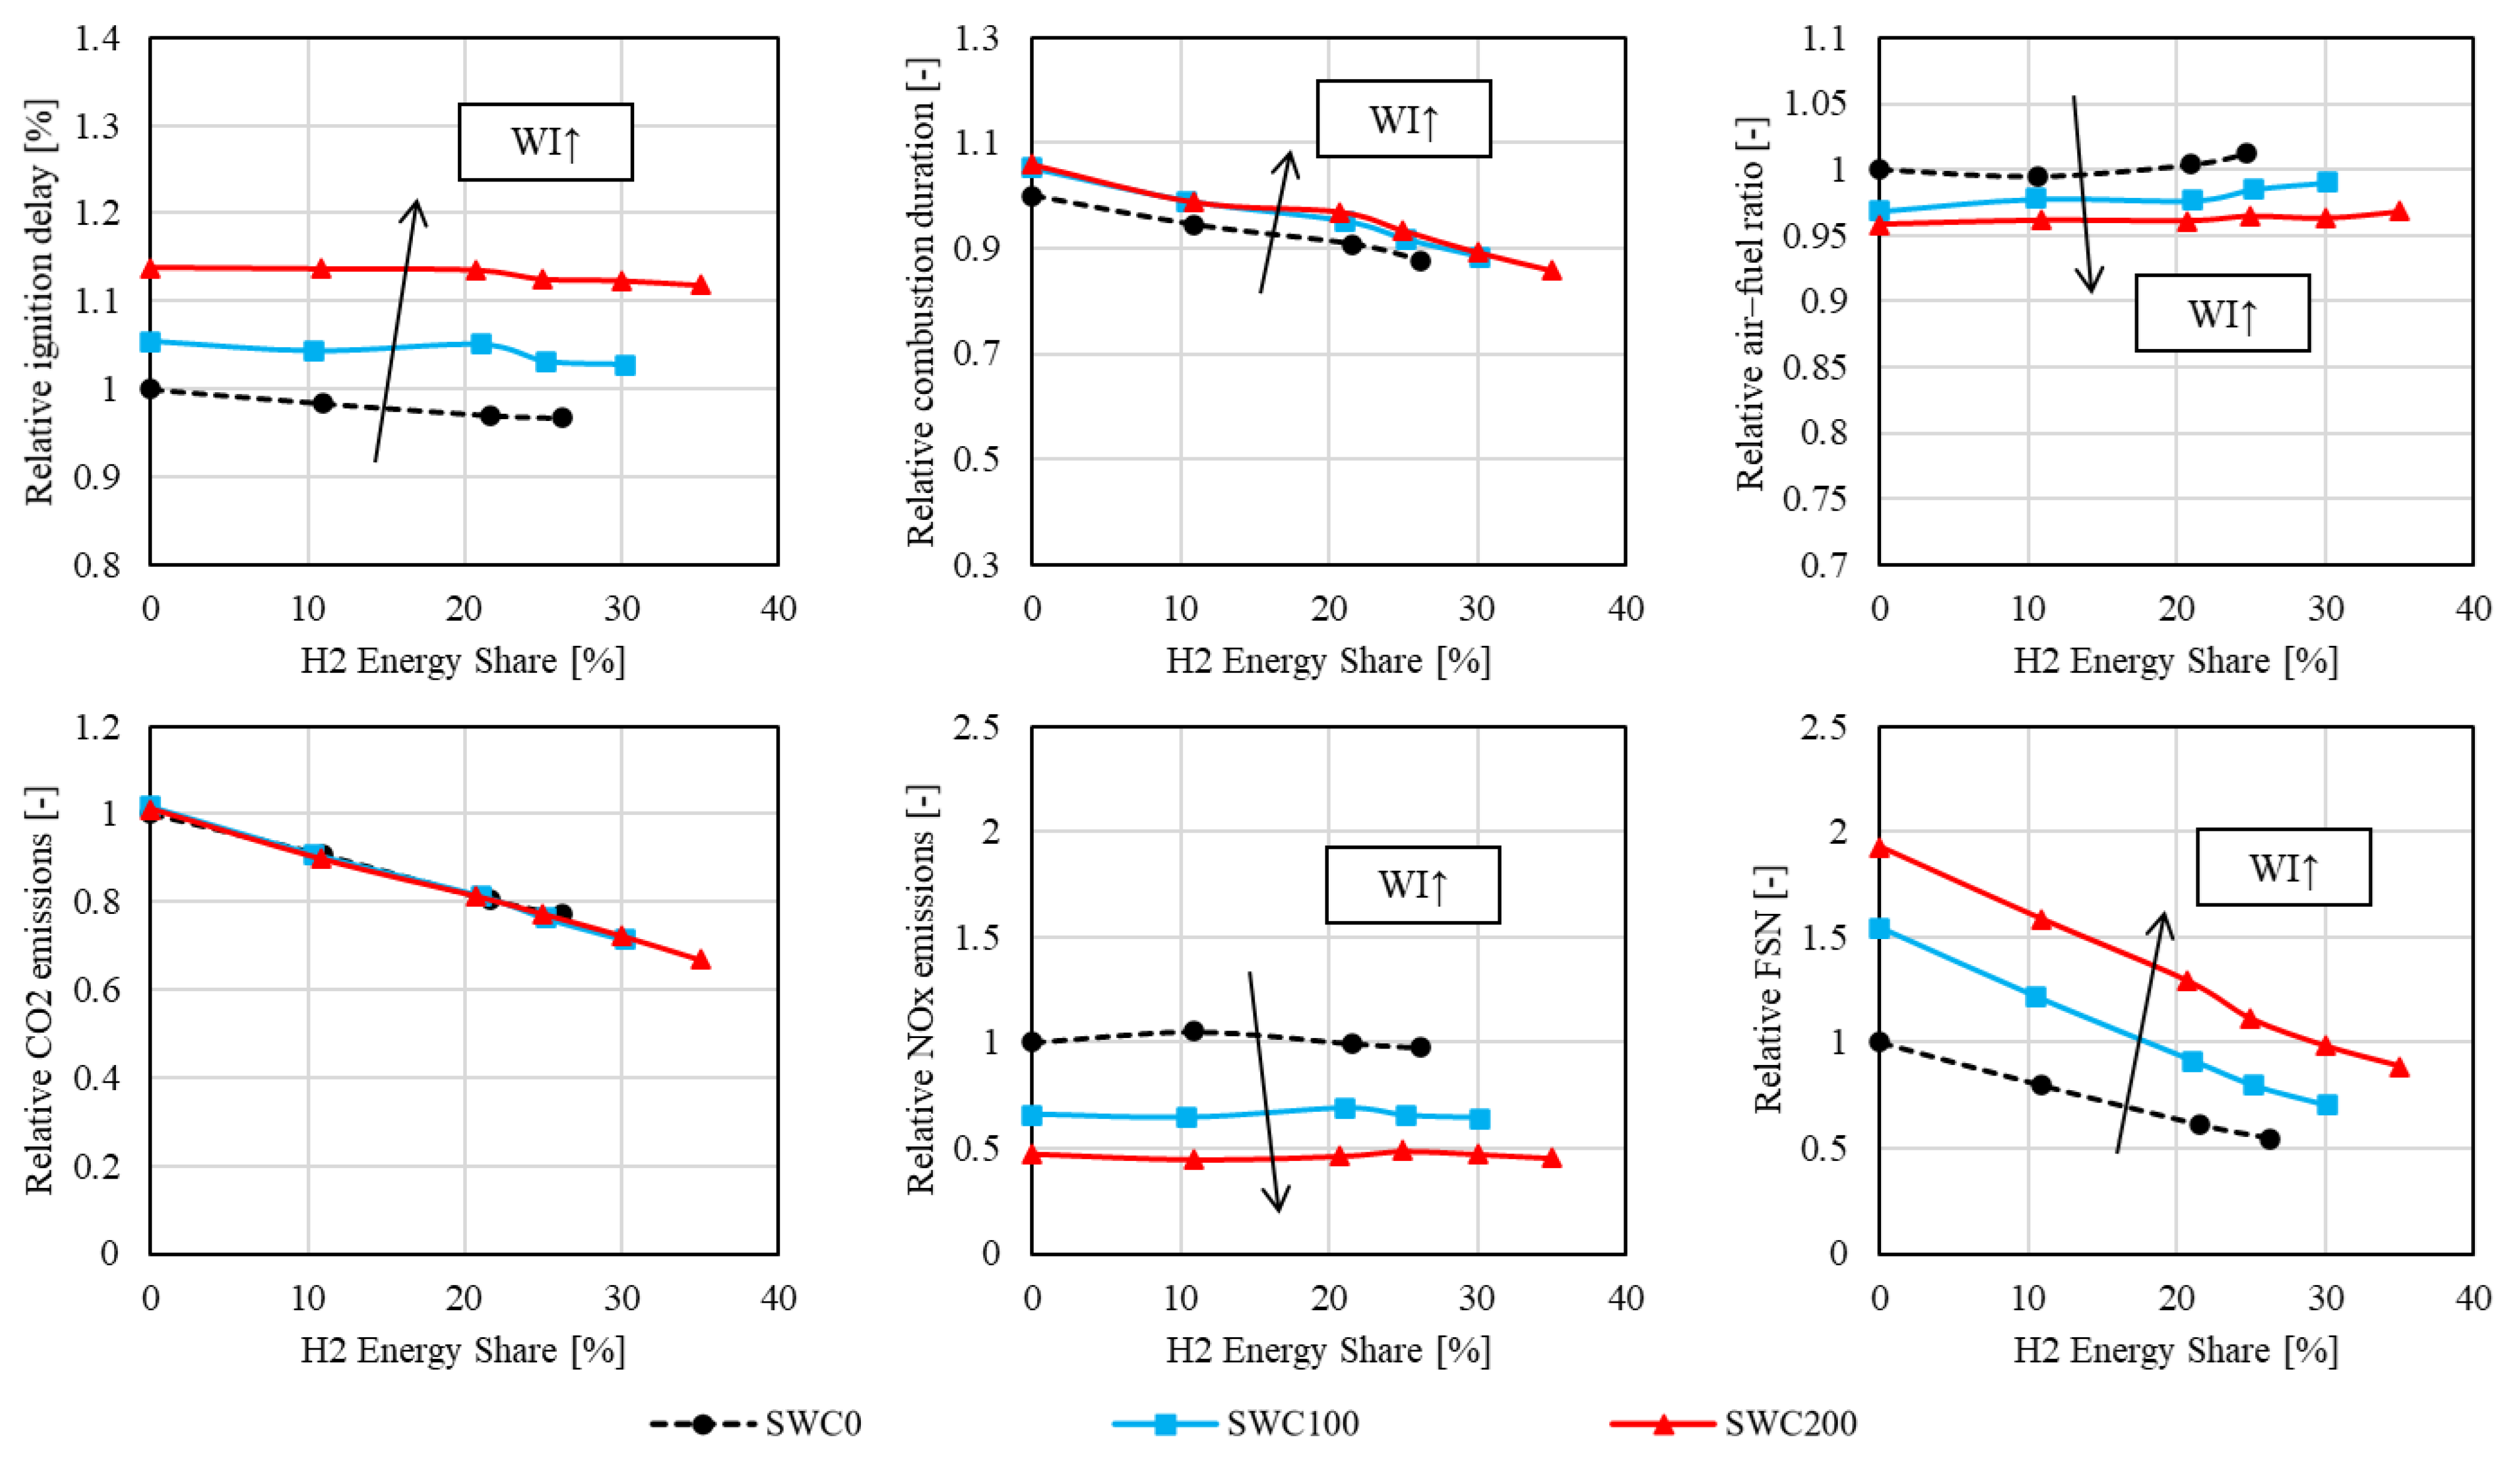
Figure 7 illustrates the effect of hydrogen and water injection on combustion characteristics and emissions. The ignition delay generally rises as hydrogen is added, due the altered heat capacity ratio and the reduced partial pressure of oxygen owing to the presence of gaseous fuel (H
2) [
23,
24]. At high hydrogen energy fractions, it is assumed that the high flammability of hydrogen becomes more significant, ultimately resulting in a reduced ignition delay. In general, water injection prolongs the ignition delay due to slowed down reaction rates associated with the lower temperatures.
As the H
2 content increases, the combustion duration naturally decreases. At approximately 20% H
2, a local maximum in combustion duration is observed, consistent with slow flame propagation in lean hydrogen–air mixtures [
25]. Above this threshold, hydrogen’s high laminar flame speed accelerates combustion. Water injection slightly decreases combustion duration by extended ignition delay, increasing premixed combustion. However, there is no clear influence of the SWC. The difference becomes more pronounced at high hydrogen energy shares, e.g., at 70% H
2, where increased water injection results in a noticeable extension of the combustion duration.
Hydrogen and water injection both lower the AFR due to air displacement and slightly lower efficiency. CO2 emissions decrease by up to 90% at the maximum H2 share but increase slightly with water injection due to minor efficiency losses.
As expected, NOx emissions are significantly reduced when using water injection. However, NOx emissions rise exponentially with the addition of hydrogen, driven by higher peak pressures and an adiabatic flame temperature. At 90% H2, even with water injection, the raw NOx emissions are significantly higher than in kerosene operation.
The filter smoke number (FSN) behaves according to the soot-NOx-tradeoff and the share of carbon-based fuel. As expected, in the pure kerosene operation, the FSN is at its peak, increasing with water injection. However, even a small hydrogen addition leads to a significant decrease in the FSN. Generally, the FSN is very low in this operating point and near the bottom detection limit of the measurement device.
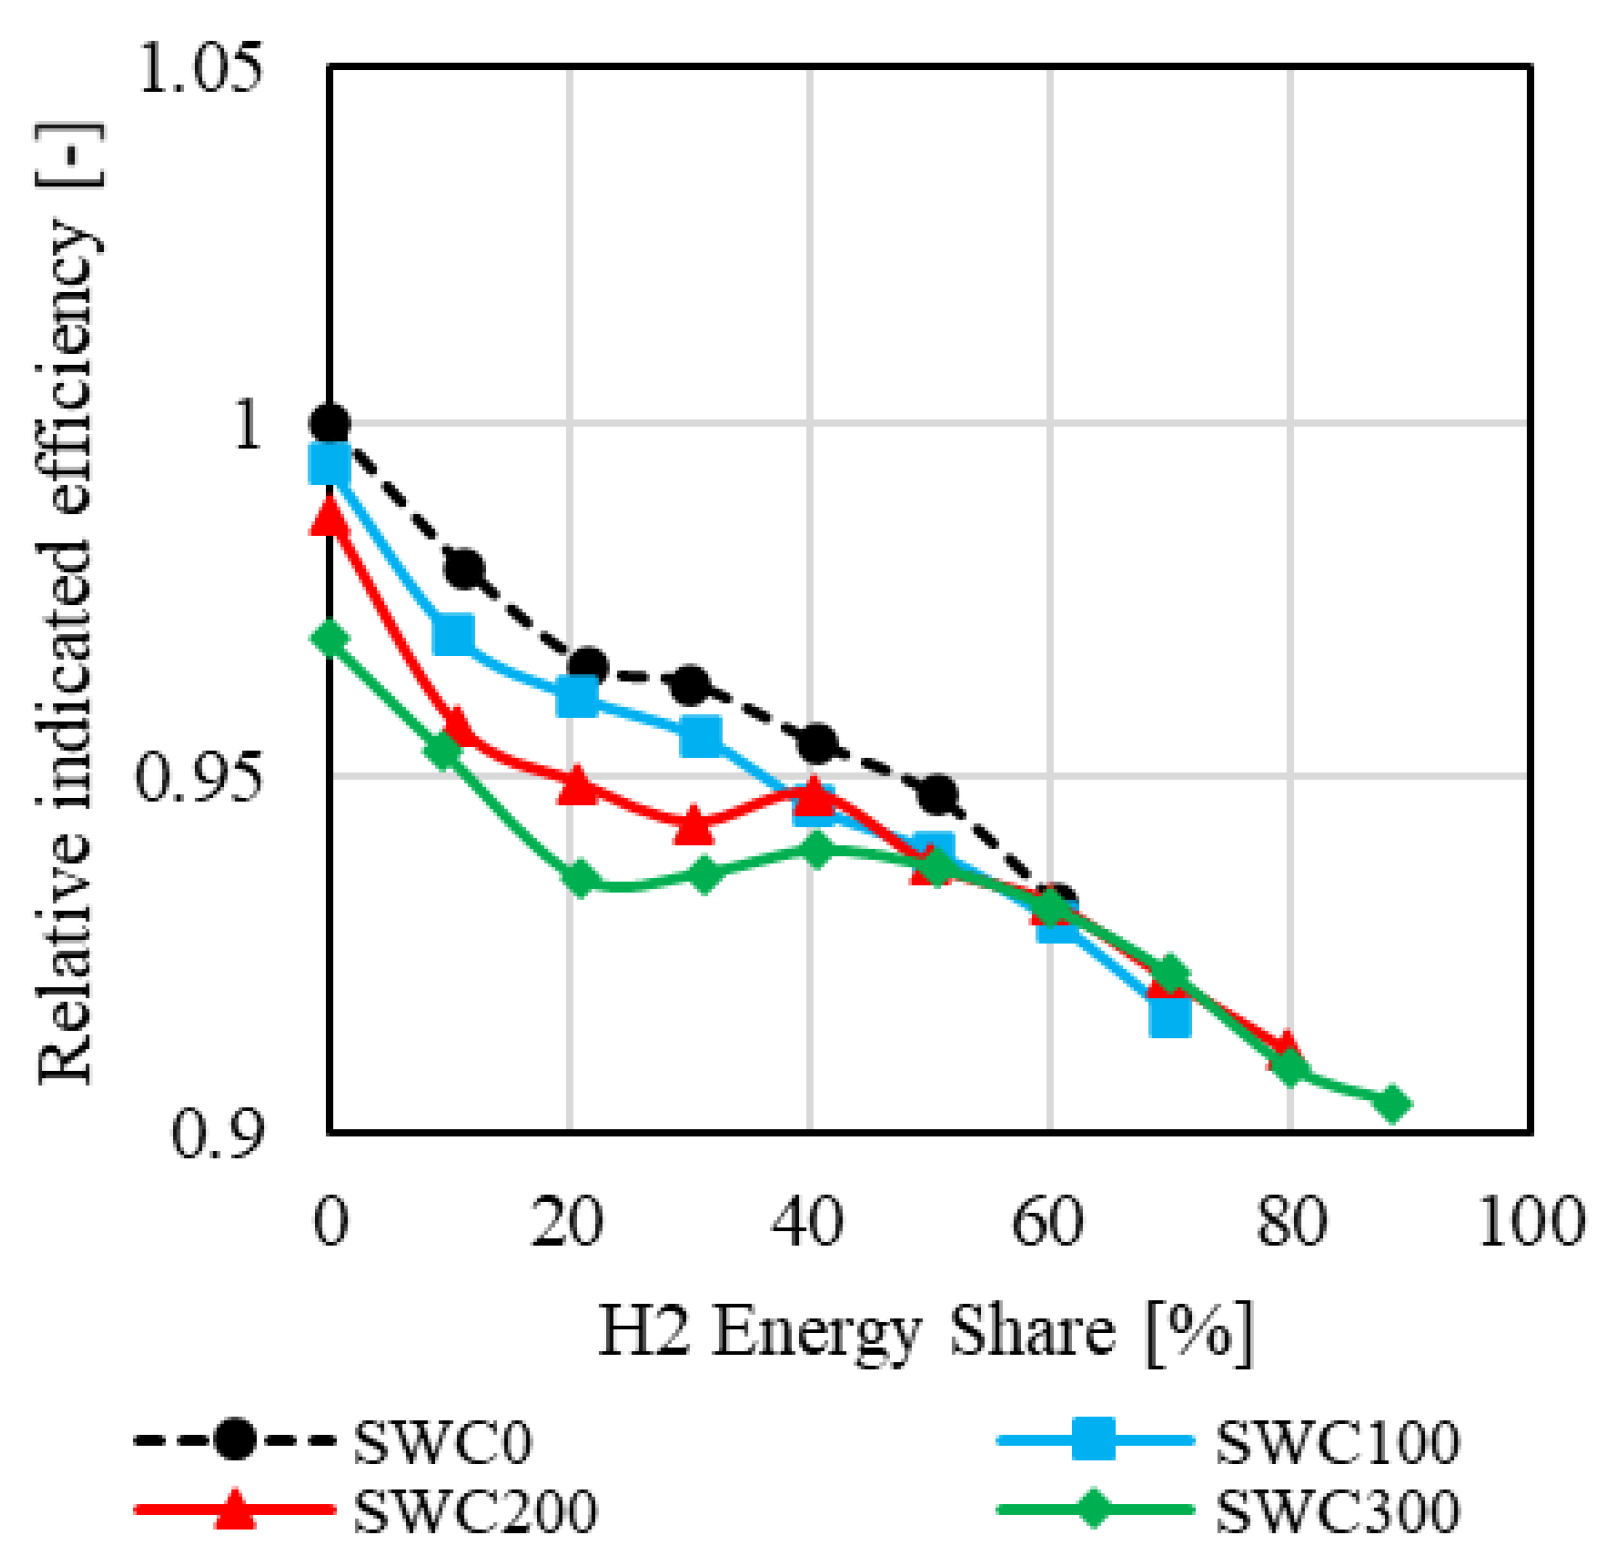
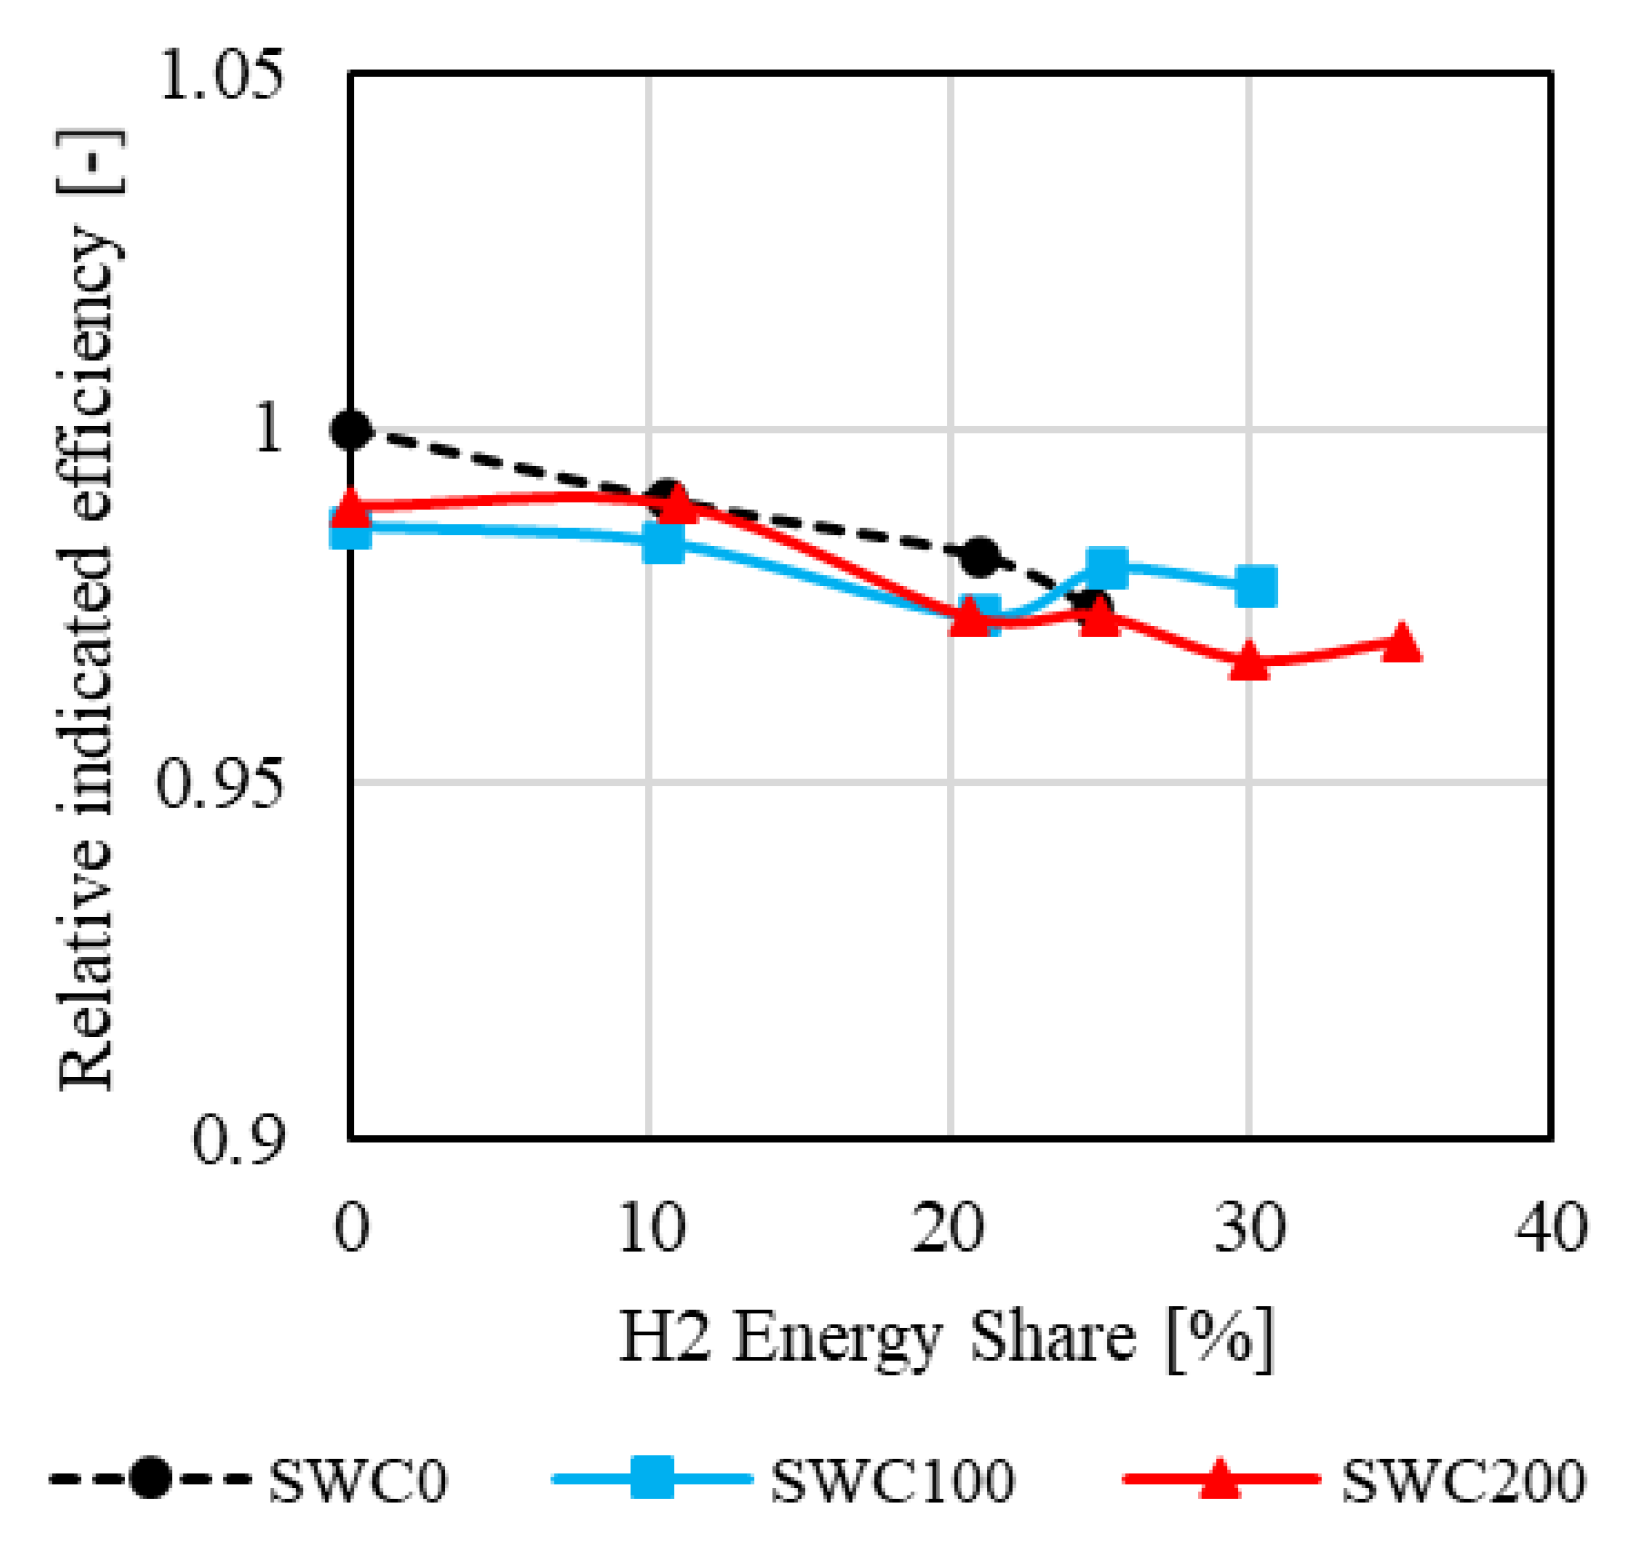
Figure 8 presents the relative indicated efficiency as a function of hydrogen energy share. It is apparent that efficiency decreases with increased H
2. Additionally, water injection negatively impacts efficiency, which is attributed to lower in-cylinder temperatures [
9]. The impact of hydrogen energy share and water injection on efficiency is further analyzed in
Section 4.
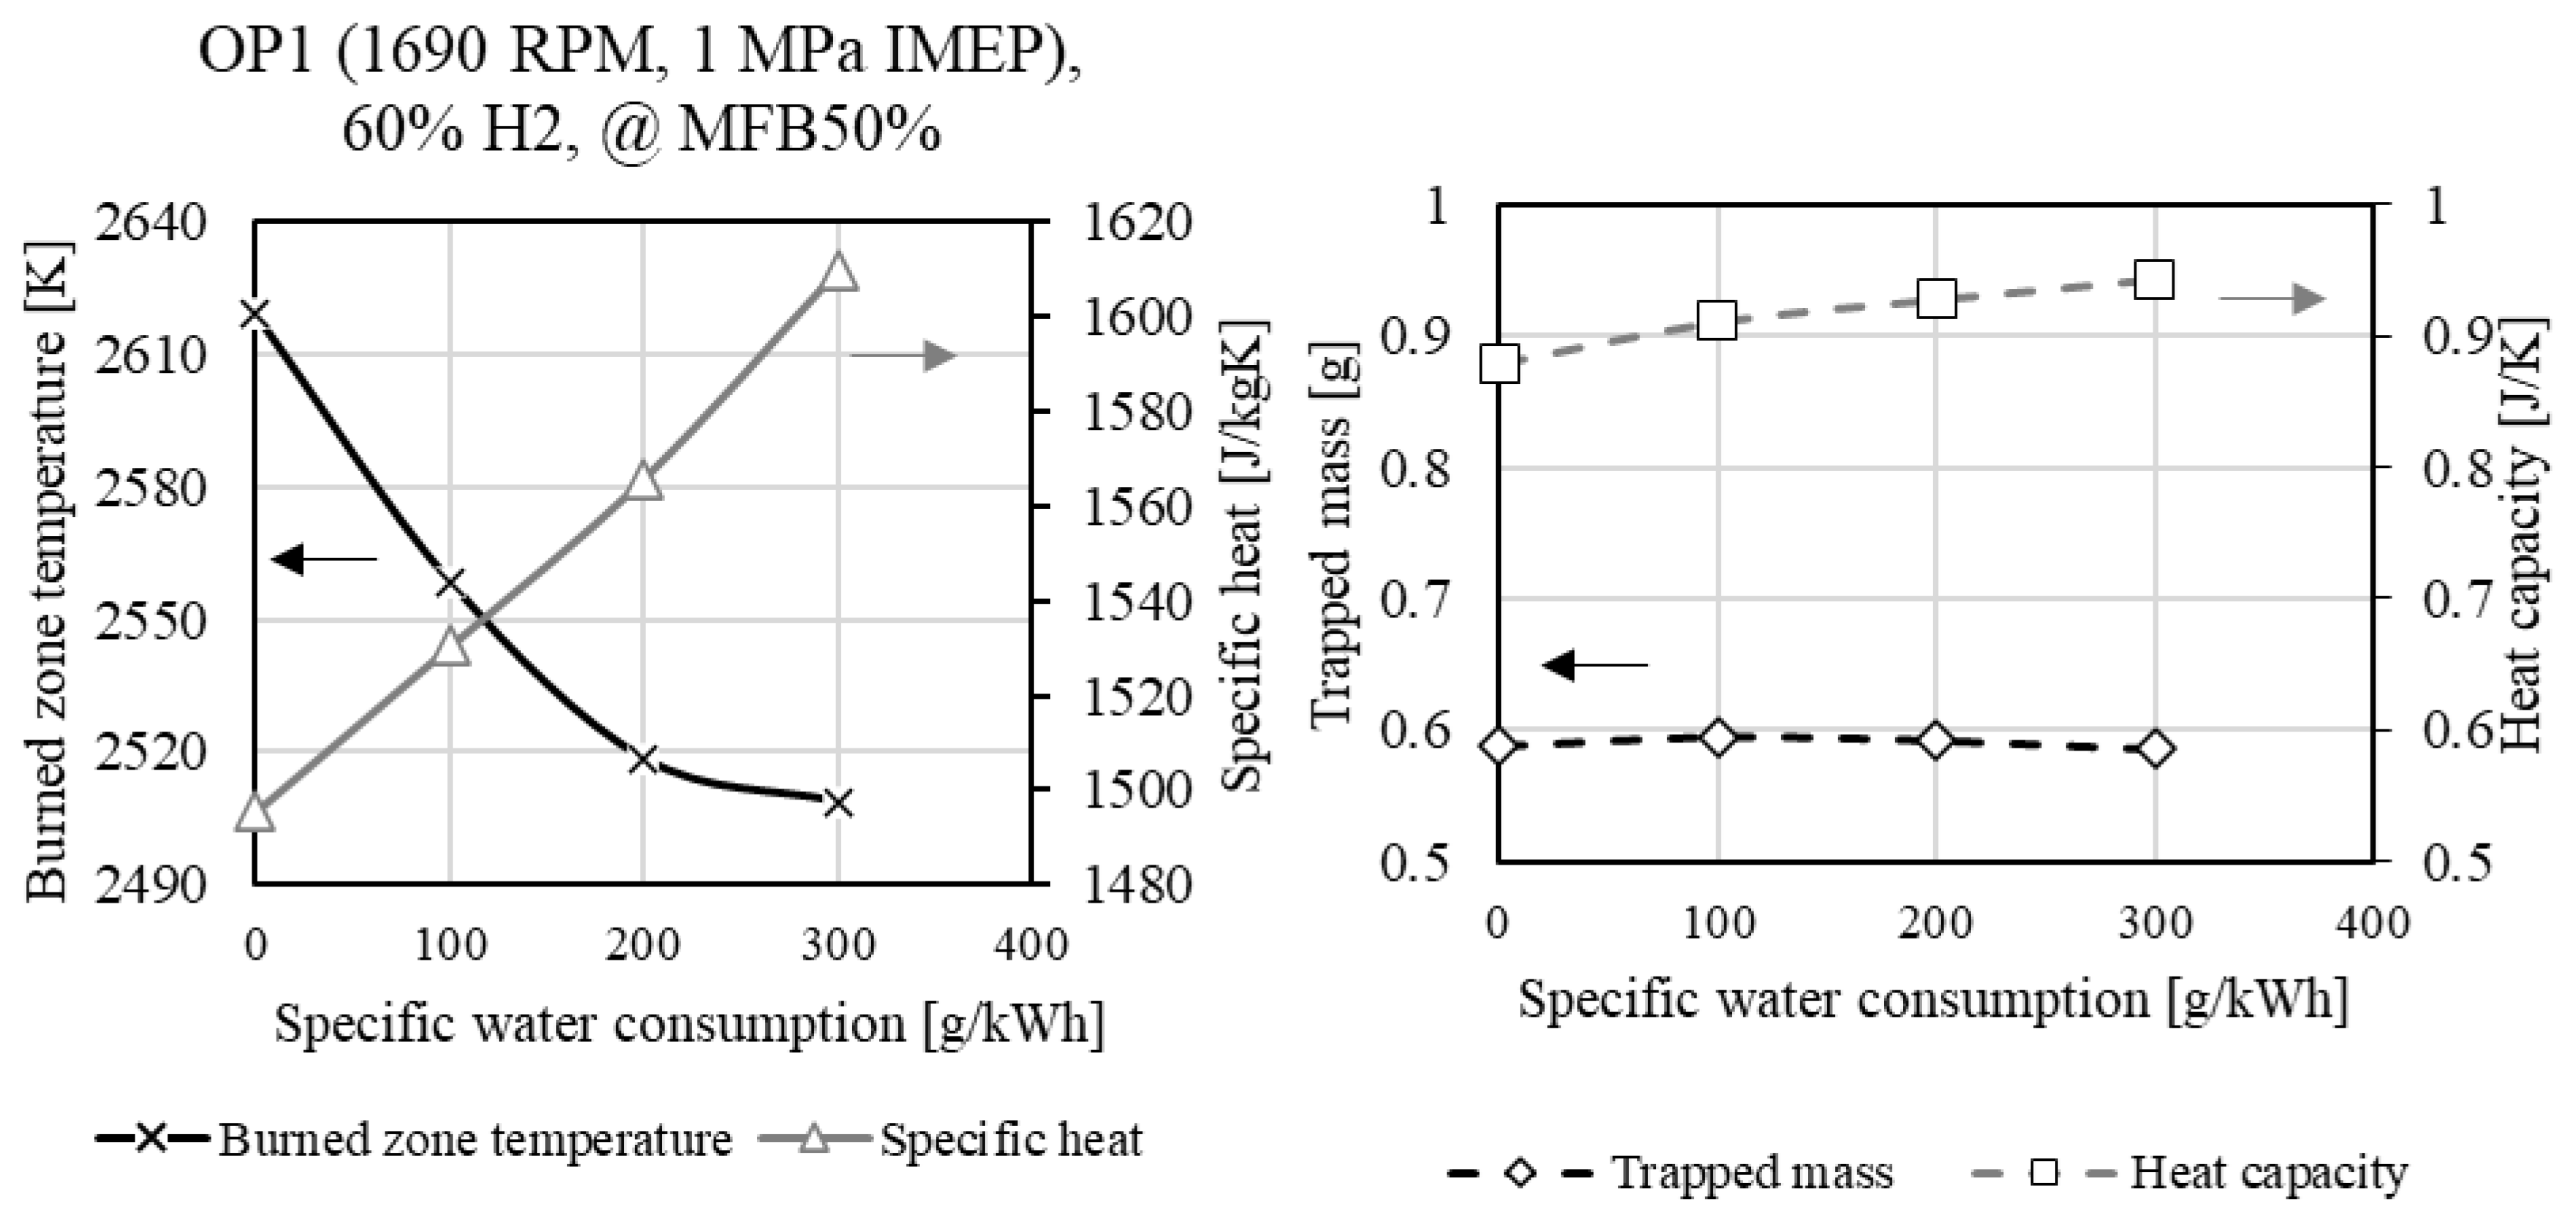
Figure 9 shows the simulated combustion parameters, including the burned zone temperature and specific heat (left), as well as the trapped mass and heat capacity (right), as a function of the specific water consumption. It is evident that as the SWC increases, the specific heat of the mixture rises noticeably. Combined with the lower charge temperature due to the enthalpy of vaporization of the injected water, this leads to a clear reduction in combustion temperatures. This also results in significantly reduced NO
x emissions when water injection is used, as seen in
Figure 7. Although the trapped mass remains almost constant in relation to the SWC, the total heat capacity of the charge ultimately increases, with the specific heat being the dominant factor in this case.
3.1.2. High-Load Operating Point (OP2)
Figure 10 (left) shows the in-cylinder pressure and heat release rate for OP2 under different conditions. Unlike OP1, increasing the hydrogen energy share significantly reduces the peak in-cylinder pressure, despite a higher compression pressure. In the pure kerosene operation, the long injection duration results in early heat release before TDC, leading to high pressures. The hydrogen addition shortens both the pilot injection duration and the combustion duration, thereby lowering the pressure while maintaining constant combustion phasing. Water injection slightly prolongs combustion, as seen in the heat release rate prior to TDC, increasing premixed combustion but reducing peak heat release, similar to OP1.
Figure 10 (right) depicts the cumulative heat release rate and the kerosene injection timing as functions of the crank angle. Higher hydrogen shares delay SOI, whereas water injection necessitates a slight advance to compensate for ignition delay. The rapid hydrogen combustion steepens the heat release curve, leading to a retarded SOC, while MFB90% remains largely unchanged.
Figure 11 presents combustion parameters and mass emissions of OP2 with water injection. Unlike OP1, ignition delay at OP2 decreases with hydrogen addition, likely due to the required retarded SOI at high loads. The higher pressures and temperatures at retarded SOI compensate for charge dilution effects, reducing ignition delay. As expected, water injection extends ignition delay due to charge cooling.
At high loads, combustion duration decreases as hydrogen replaces kerosene.
Figure 10 confirms higher peak heat release with hydrogen, leading to faster combustion due to hydrogen’s rapid flame propagation. Water injection, despite increasing the premixed fraction of kerosene, slows overall combustion due to lower reaction rates, suggesting thermal effects outweigh mixing effects in combustion duration.
In terms of the air–fuel ratio, at a high load, the increased kinetic energy of the air (higher RPM), and the higher boost pressure minimize air displacement effects from H2-PFI, affecting the AFR less than at OP1. The hydrogen’s higher calorific value per stoichiometric air requirement could be the dominant factor for the resulting AFR at this operating point. Additionally, water injection slightly lowers the AFR, reflecting its minor efficiency penalty.
The CO2 emissions can be reduced by 35% with a specific water consumption of 200 g/kWh and 35% hydrogen energy share. As previously discussed, the CO2 emissions are slightly higher with water injection due to the reduced efficiency.
At OP2, NOx formation behaves differently from OP1. While hydrogen’s high flame temperature and increased premixed combustion would typically elevate NOx, this effect is counterbalanced by lower in-cylinder pressures and temperatures, resulting in minimal NOx variation with hydrogen addition. Water injection remains effective in NOx reduction.
Finally, FSN decreases with hydrogen addition due to lower carbon content but rises with water injection, as lower temperatures favor soot formation—which align with the results presented in OP1.
Figure 12 displays the relative indicated efficiency as a function of the hydrogen energy share. At high loads, the efficiency is only marginally reduced with increasing hydrogen energy shares. Furthermore, the negative impact of water injection on efficiency is also minimal. It can be observed that at 35% H
2 SWC200, the efficiency is nearly 3% lower compared to the base operating point (0% H
2, SWC0). A detailed analysis of the efficiency is shown in
Section 4.
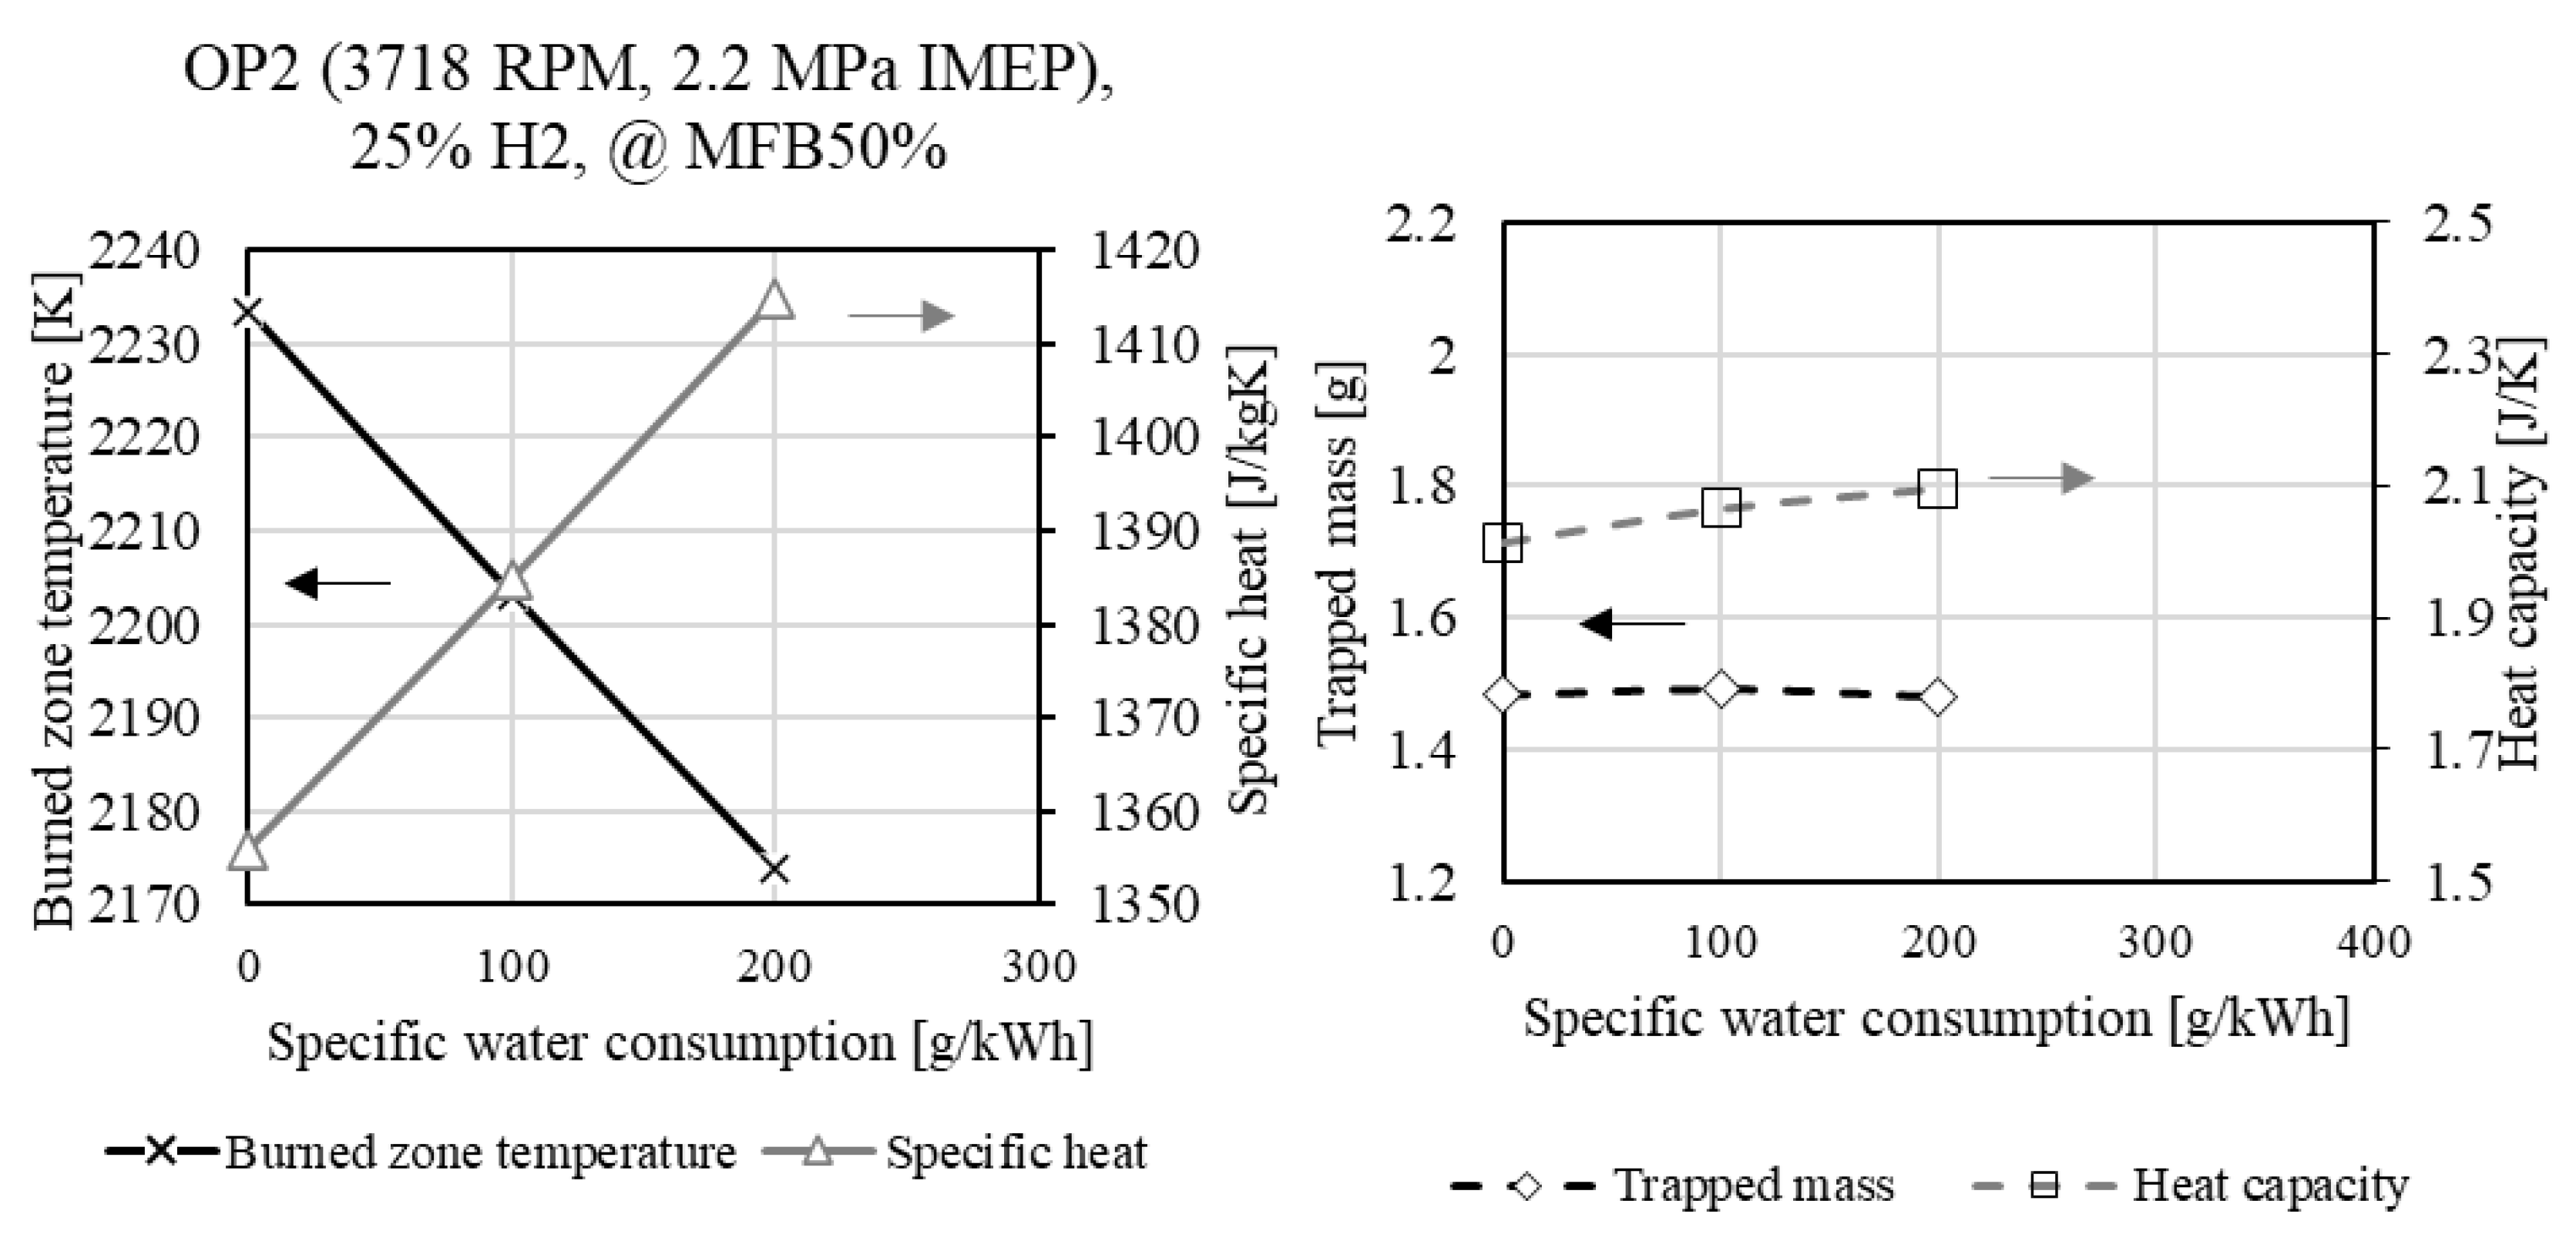
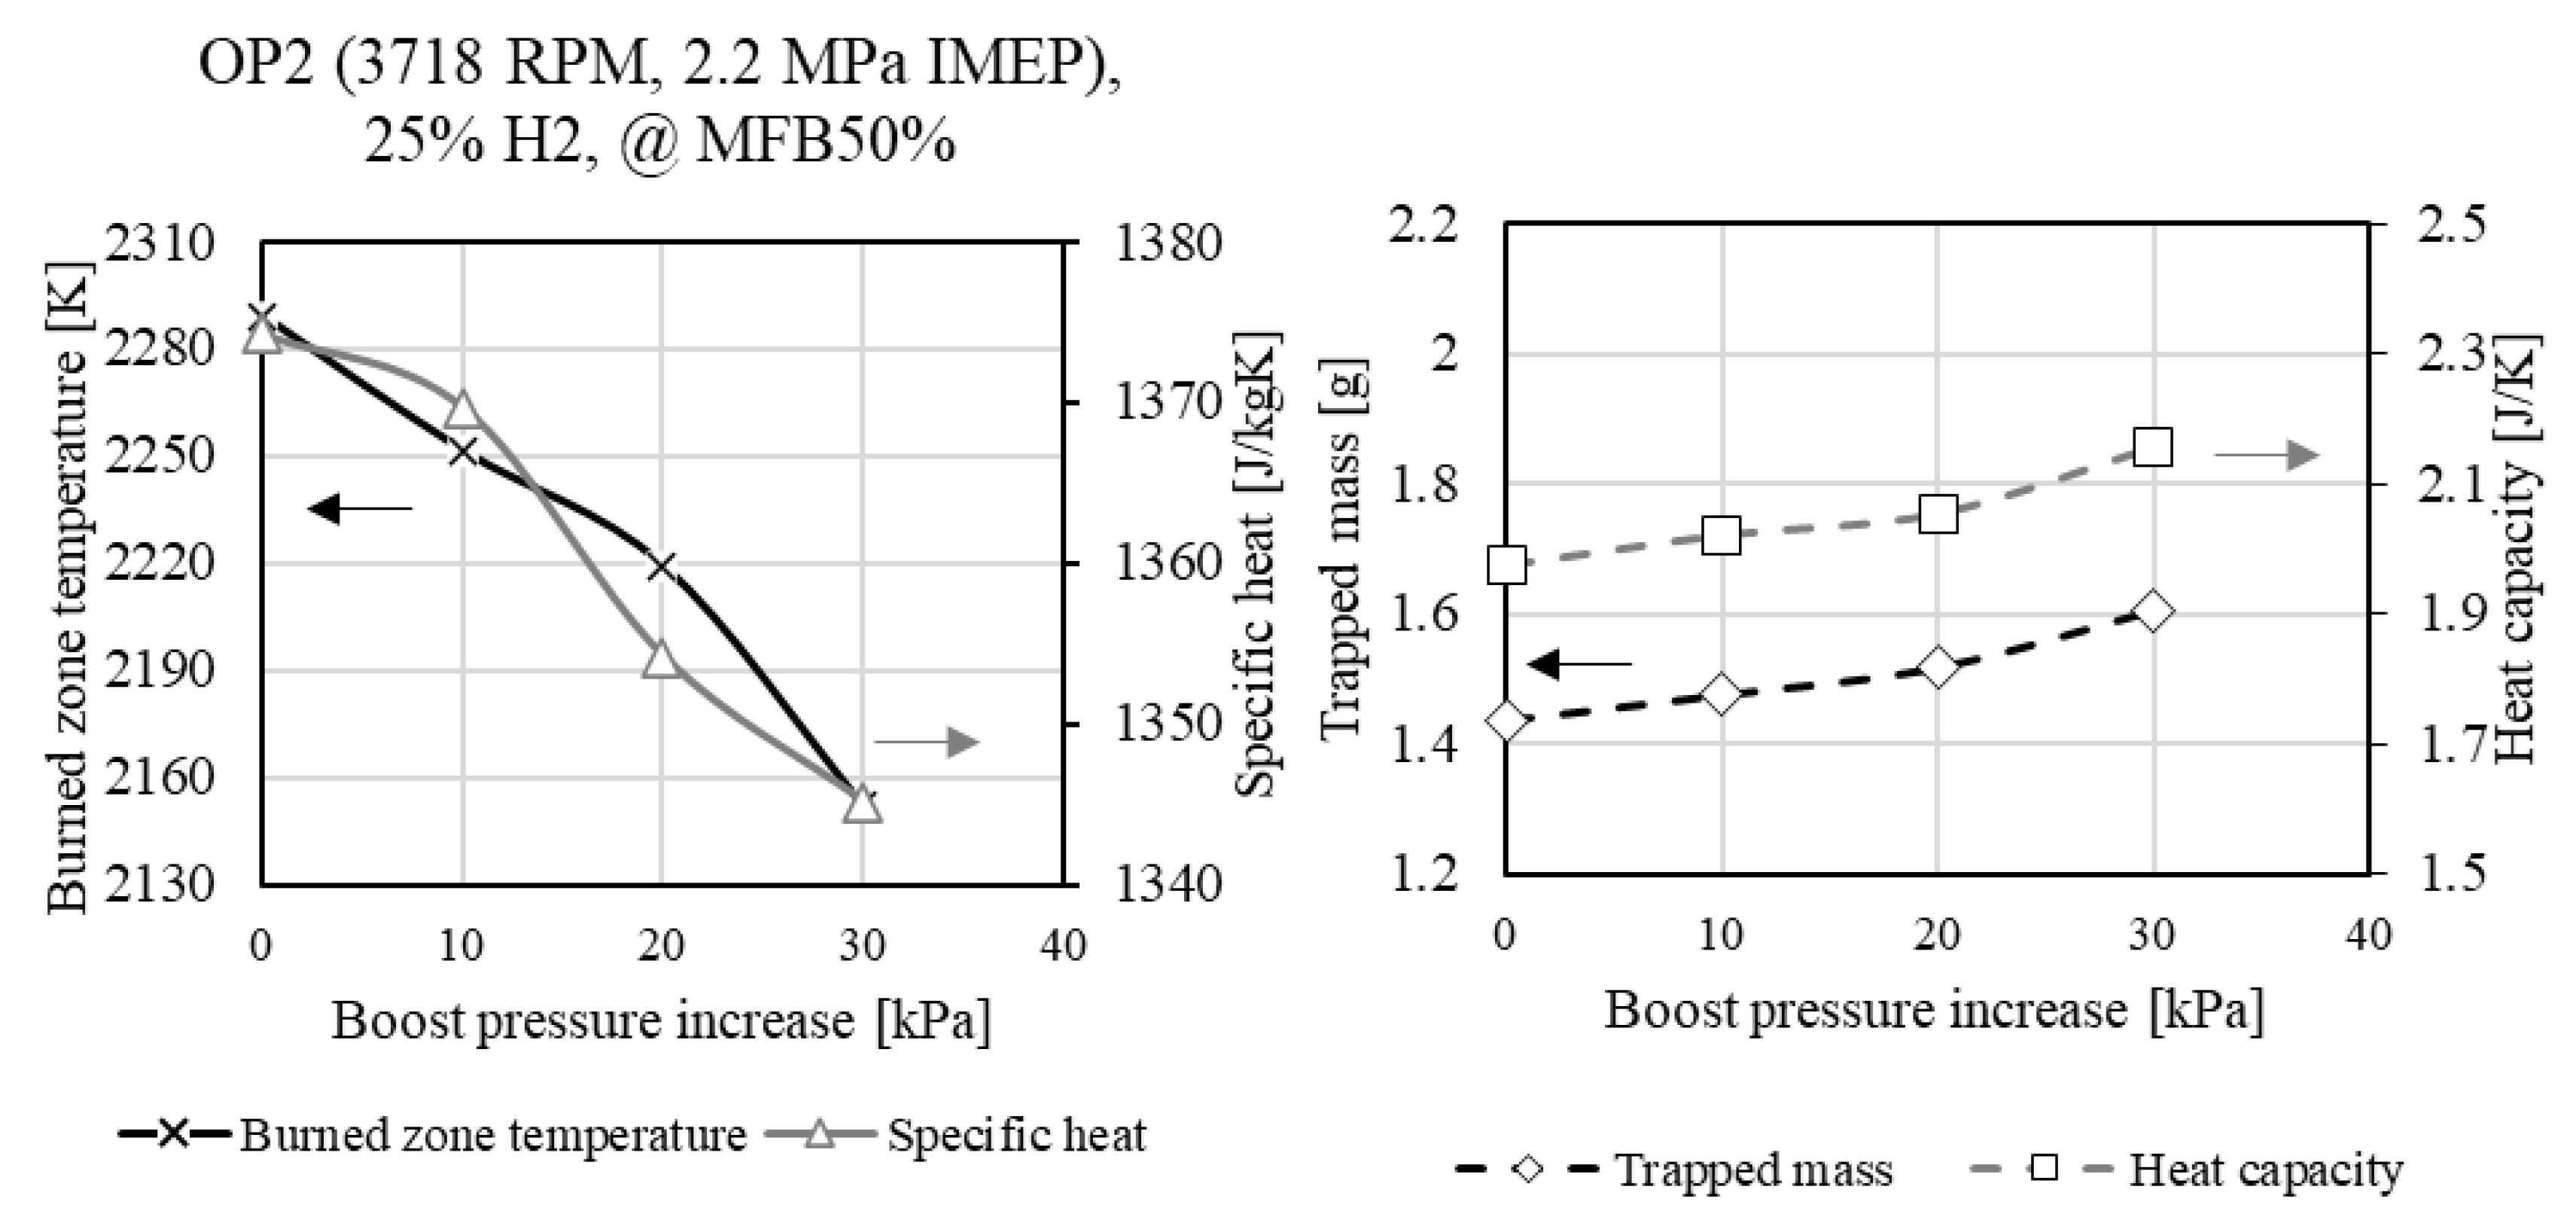
Figure 13 displays the simulated combustion parameters, consisting of the burned zone temperature and specific heat (left), as well as the trapped mass and heat capacity (right). Fundamentally, the trends are consistent with OP1, demonstrating that the burnt zone temperature can be significantly reduced with increasing SWC due to the increased heat capacity, whereby the dominant factor here is the increased specific heat capacity, with an otherwise almost constant trapped mass.
3.2. Boost Pressure
The second strategy to increase the hydrogen energy share was raising the boost pressure, thereby increasing the air–fuel ratio, which in turn raises the minimum ignition energy of hydrogen.
Boost pressure was increased by 10 kPa, 20 kPa, and 30 kPa for both operating points. Due to peak in-cylinder pressure constraints at OP2, the same boost increments as in OP1 were applied.
3.2.1. Low-Load Operating Point (OP1)
Figure 14 (left) illustrates the effect of increased boost pressure on in-cylinder pressure and heat release rate. Higher boost pressures lead to significantly higher pressures during compression and expansion, which reduces ignition delay by improving ignition conditions. This shift is reflected in the heat release rate, where an inflection point indicates a reduction in premixed combustion and an increase in diffusive combustion. The higher dilution further lowers in-cylinder temperatures, as seen in the reduced heat release peak. At 90% H
2 and +30 kPa boost pressure, the peak heat release rate decreases further, and the heat release profile broadens. In contrast to 90% H
2 with water injection, this is primarily due to the higher air–fuel ratio, which lowers laminar flame speed and hydrogen flame temperature. Despite a broader heat release profile, combustion duration remains nearly unchanged, indicating that the start and end of combustion are minimally affected.
Figure 14 (right) presents the cumulative heat release rate and kerosene injection timing. With increasing boost pressure, the SOI is slightly retarded due to maintaining constant combustion phasing. The shorter decay phase of the heat release rate at high hydrogen shares results in an earlier MFB90% at 90% H
2 with + 30 kPa boost pressure compared to 60% H
2, confirming a shorter combustion duration.
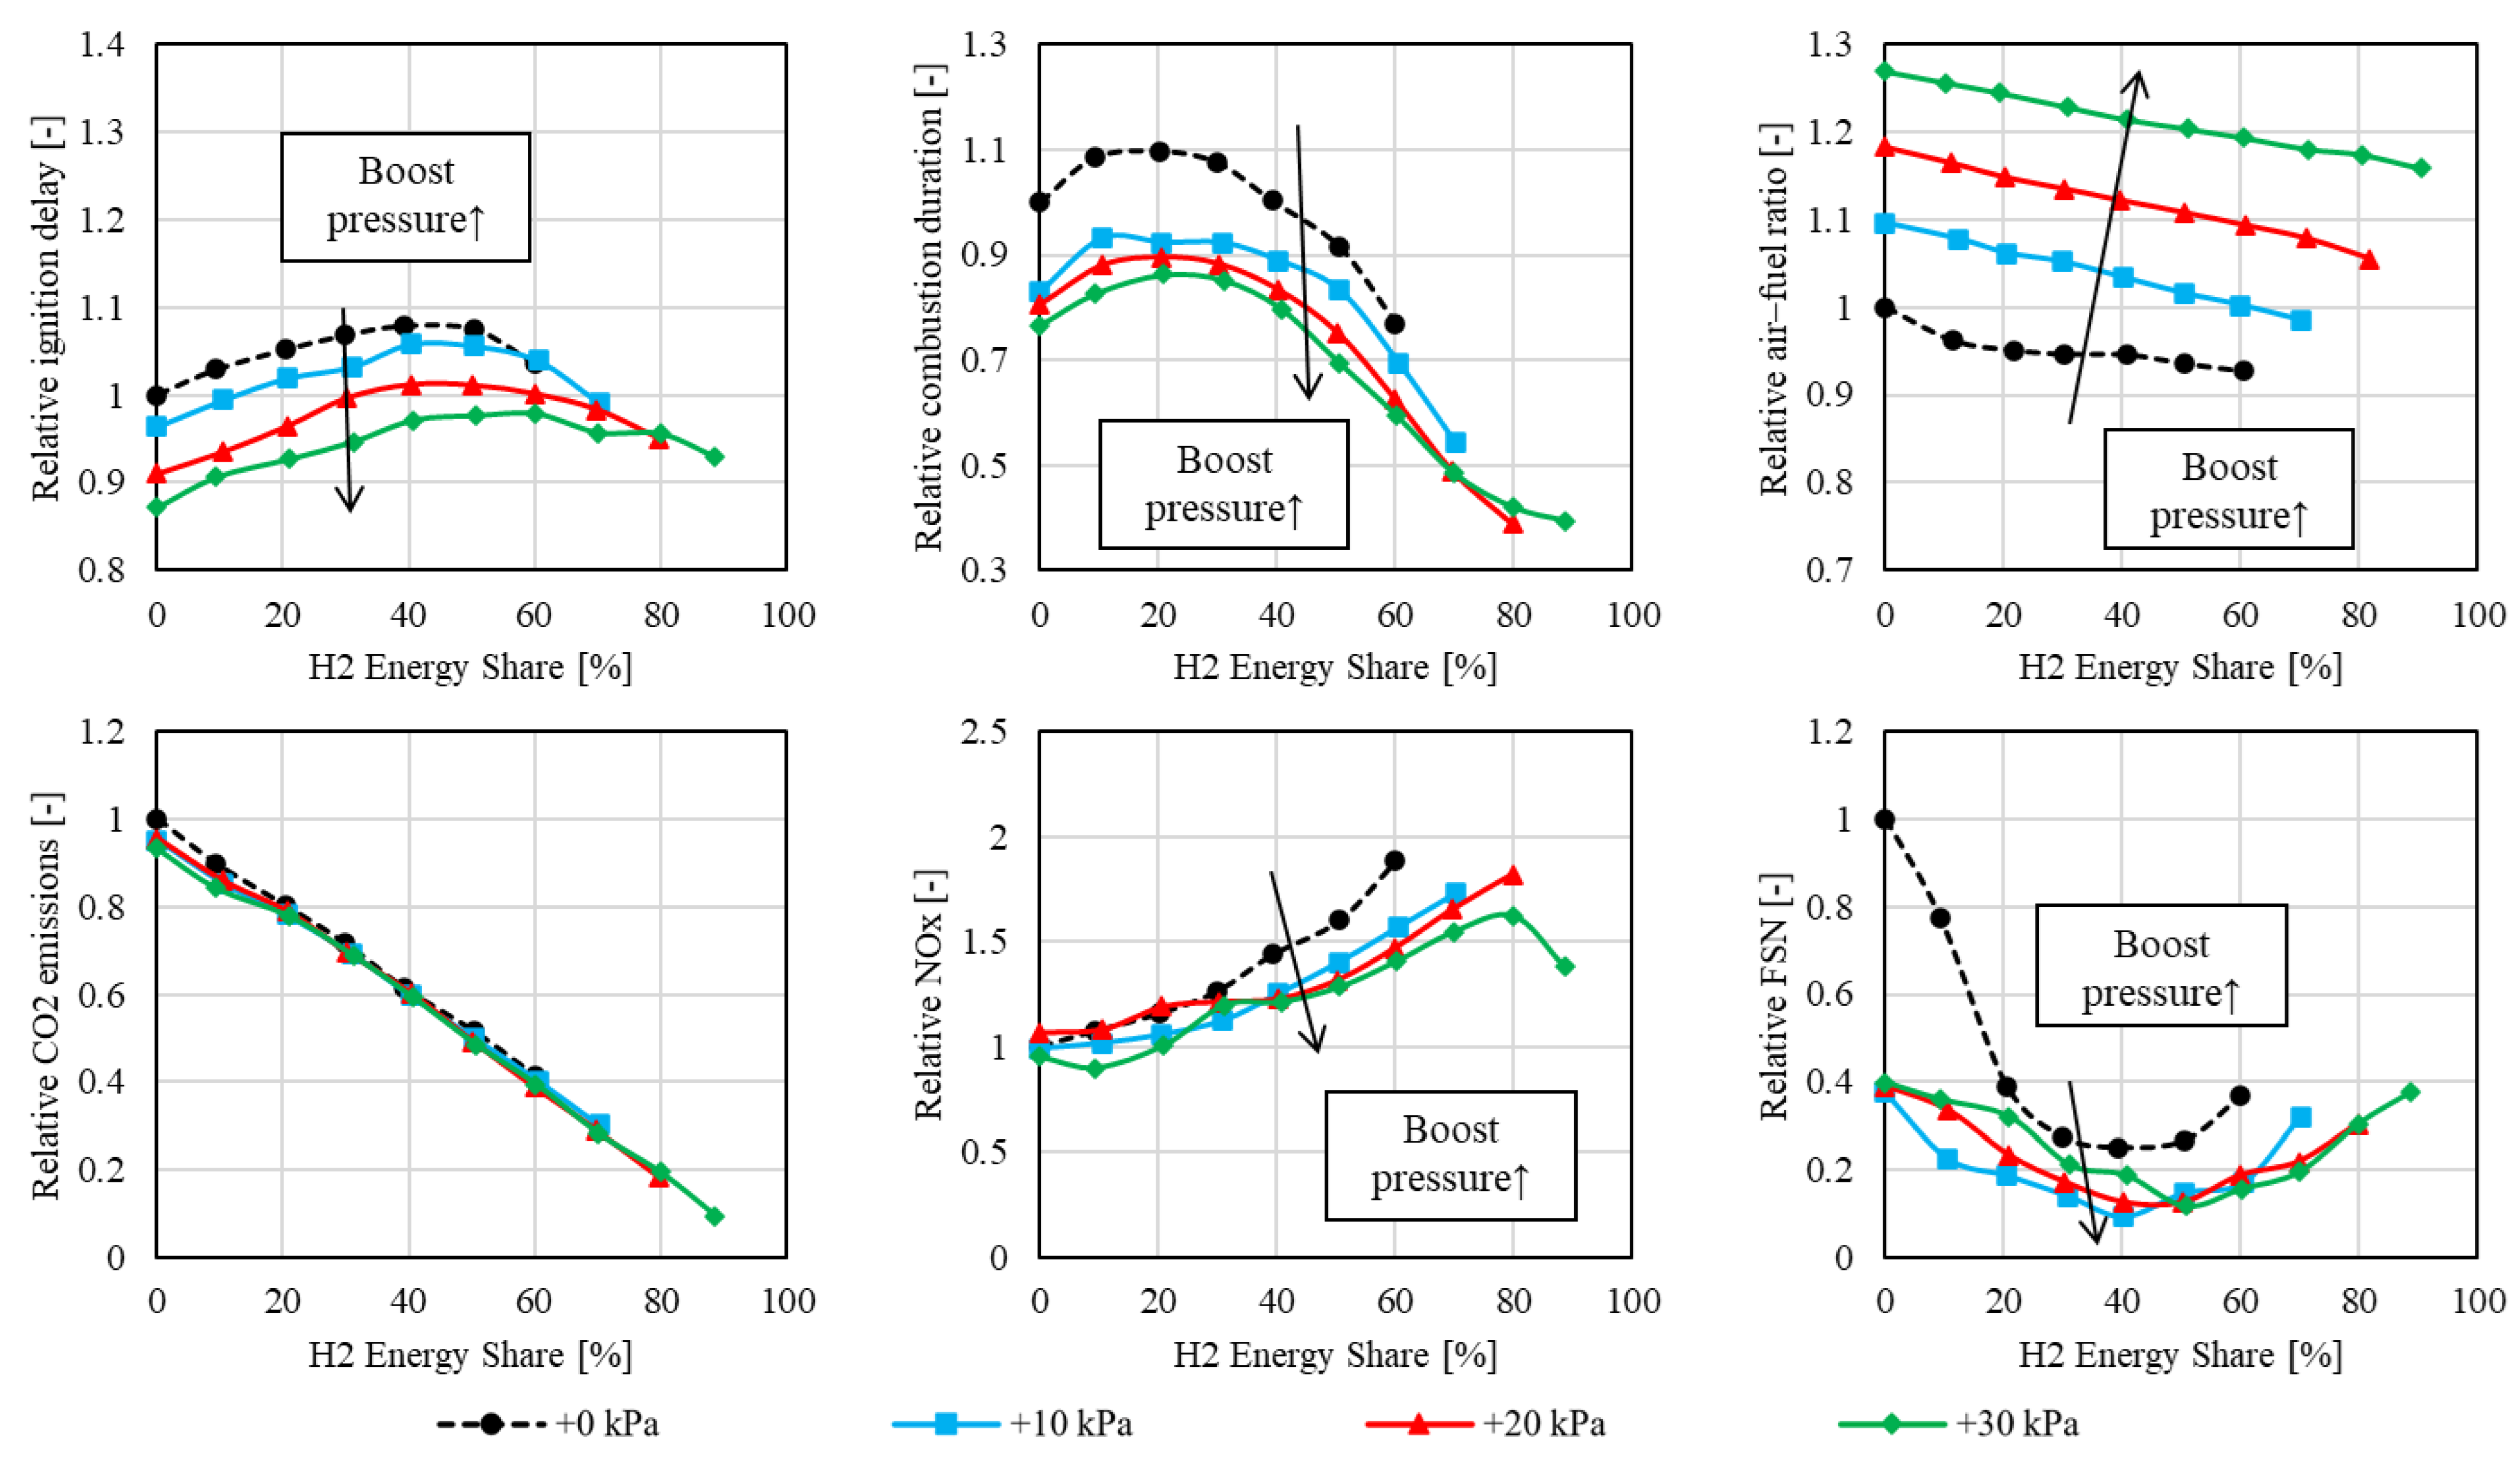
Figure 15 shows that ignition delay decreases with rising boost pressure due to higher in-cylinder pressure and temperature, which enhance reaction rates and ignition conditions. The reduced combustion duration leads to a retarded SOI, further increasing in-cylinder pressures at the start of injection, reinforcing the ignition delay reduction. This trend aligns with collision theory, where high pressures promote faster reaction rates [
23].
As expected, the air–fuel ratio is incrementally increased due to the higher charge air mass associated with rising boost pressure. The CO2 emissions are slightly lower with increased boost pressure due to the marginal increase in efficiency, thus lower fuel input is necessary. NOx emissions decrease despite higher combustion pressures and temperatures, as the dilution effect increases thermal mass, mitigating NOx formation. Simultaneously, the higher AFR reduces soot formation, leading to a significantly lower FSN. However, at this low-load operating point, FSN levels remain inherently low, regardless of hydrogen share and boost pressure.
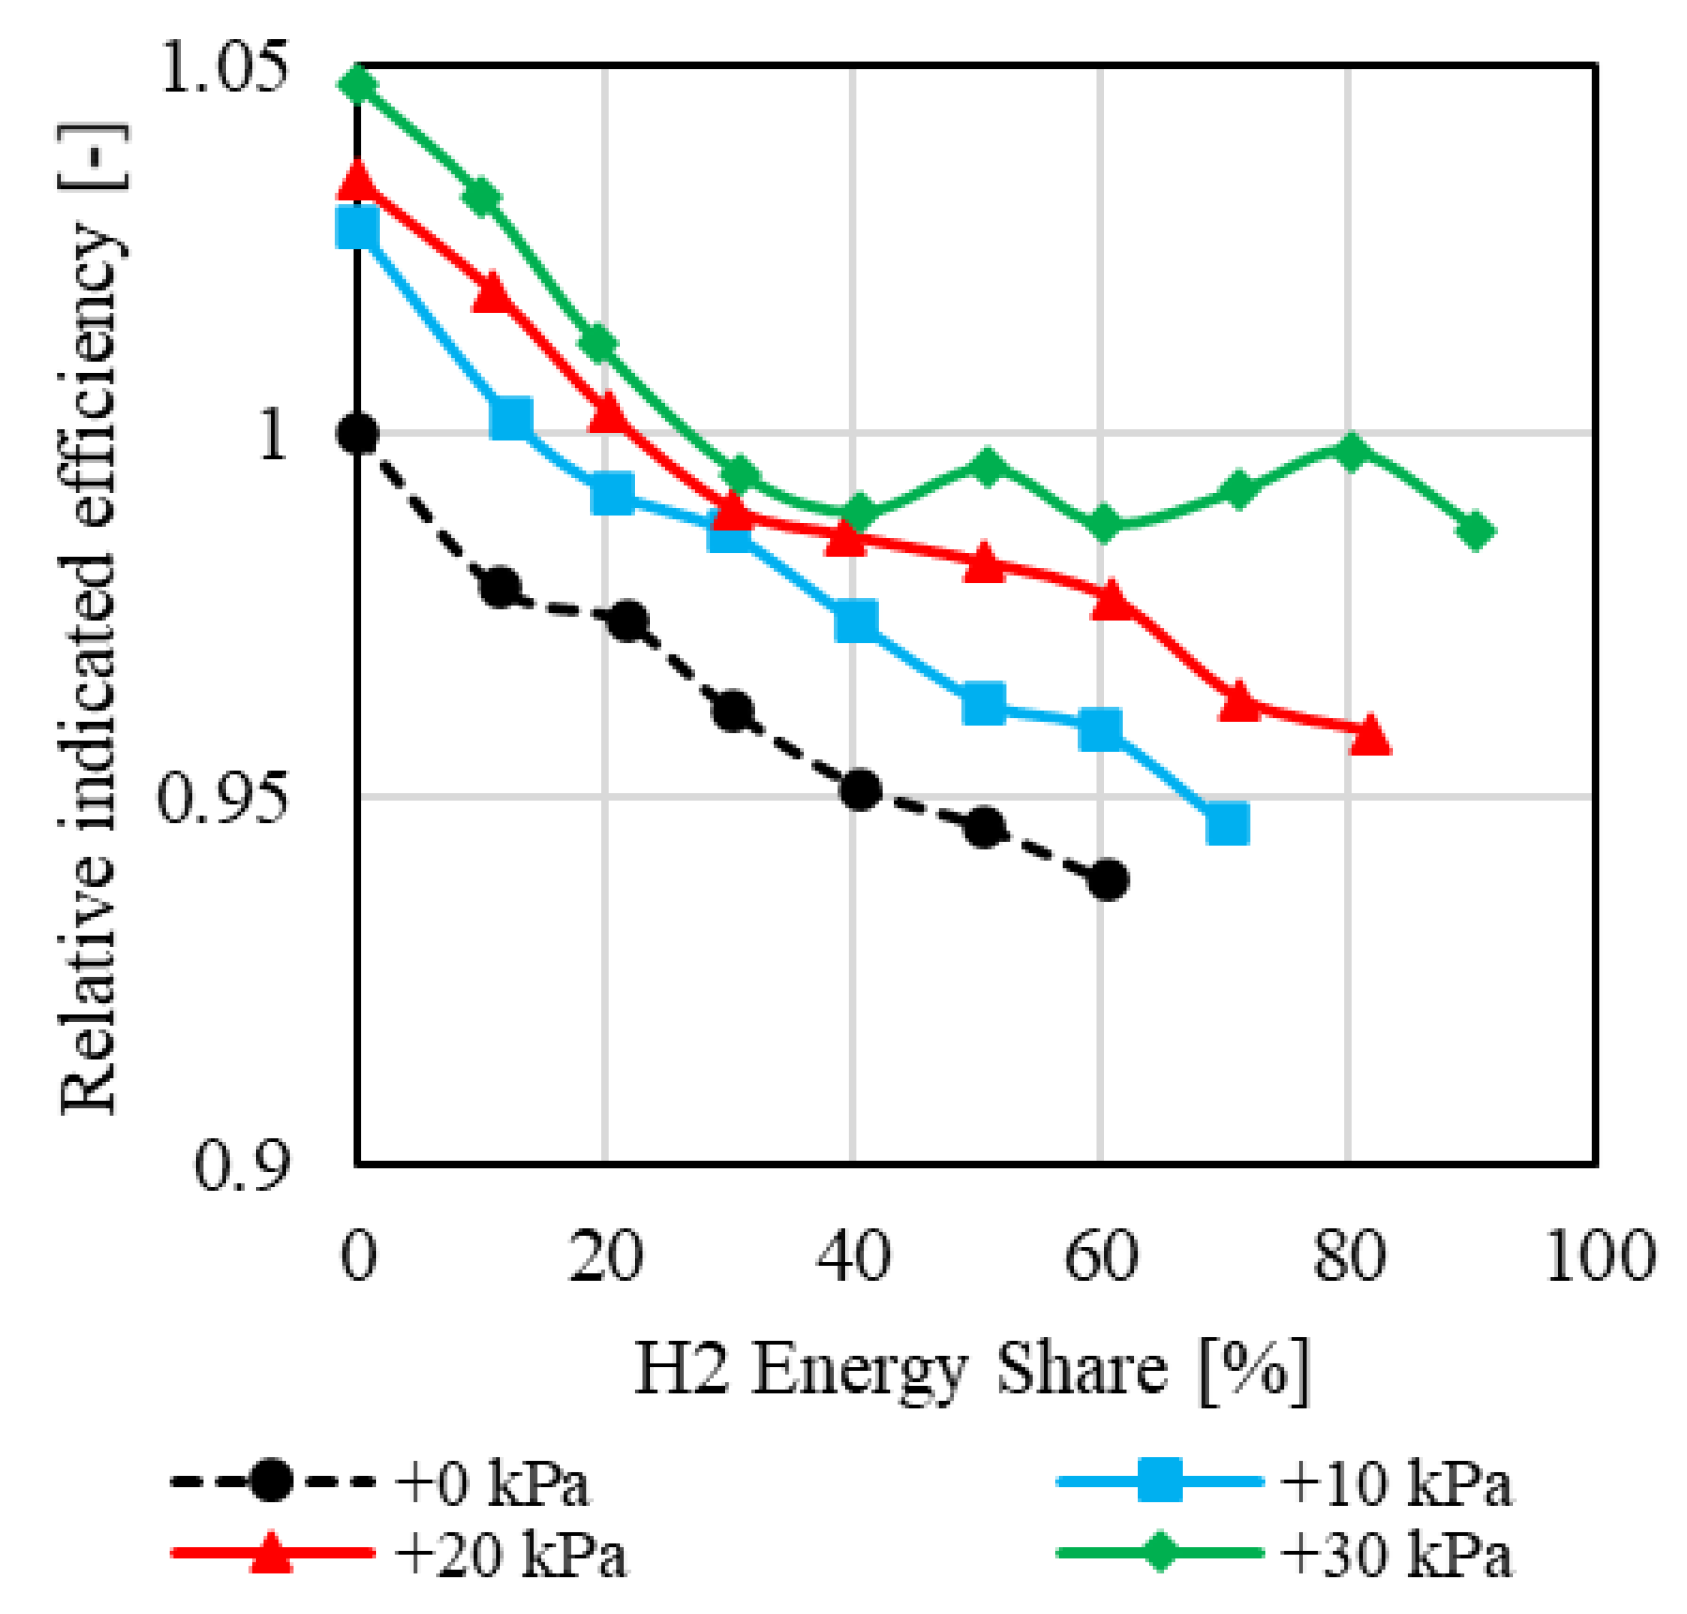
Figure 16 presents the indicated efficiency as a function of the hydrogen energy share across the investigated boost pressures. It is evident that higher boost pressures lead to increased efficiencies. However, even at 90% H2 with + 30 kPa boost pressure, the efficiency appears to be slightly lower than at the base operating point (0% H2, 0 kPa).
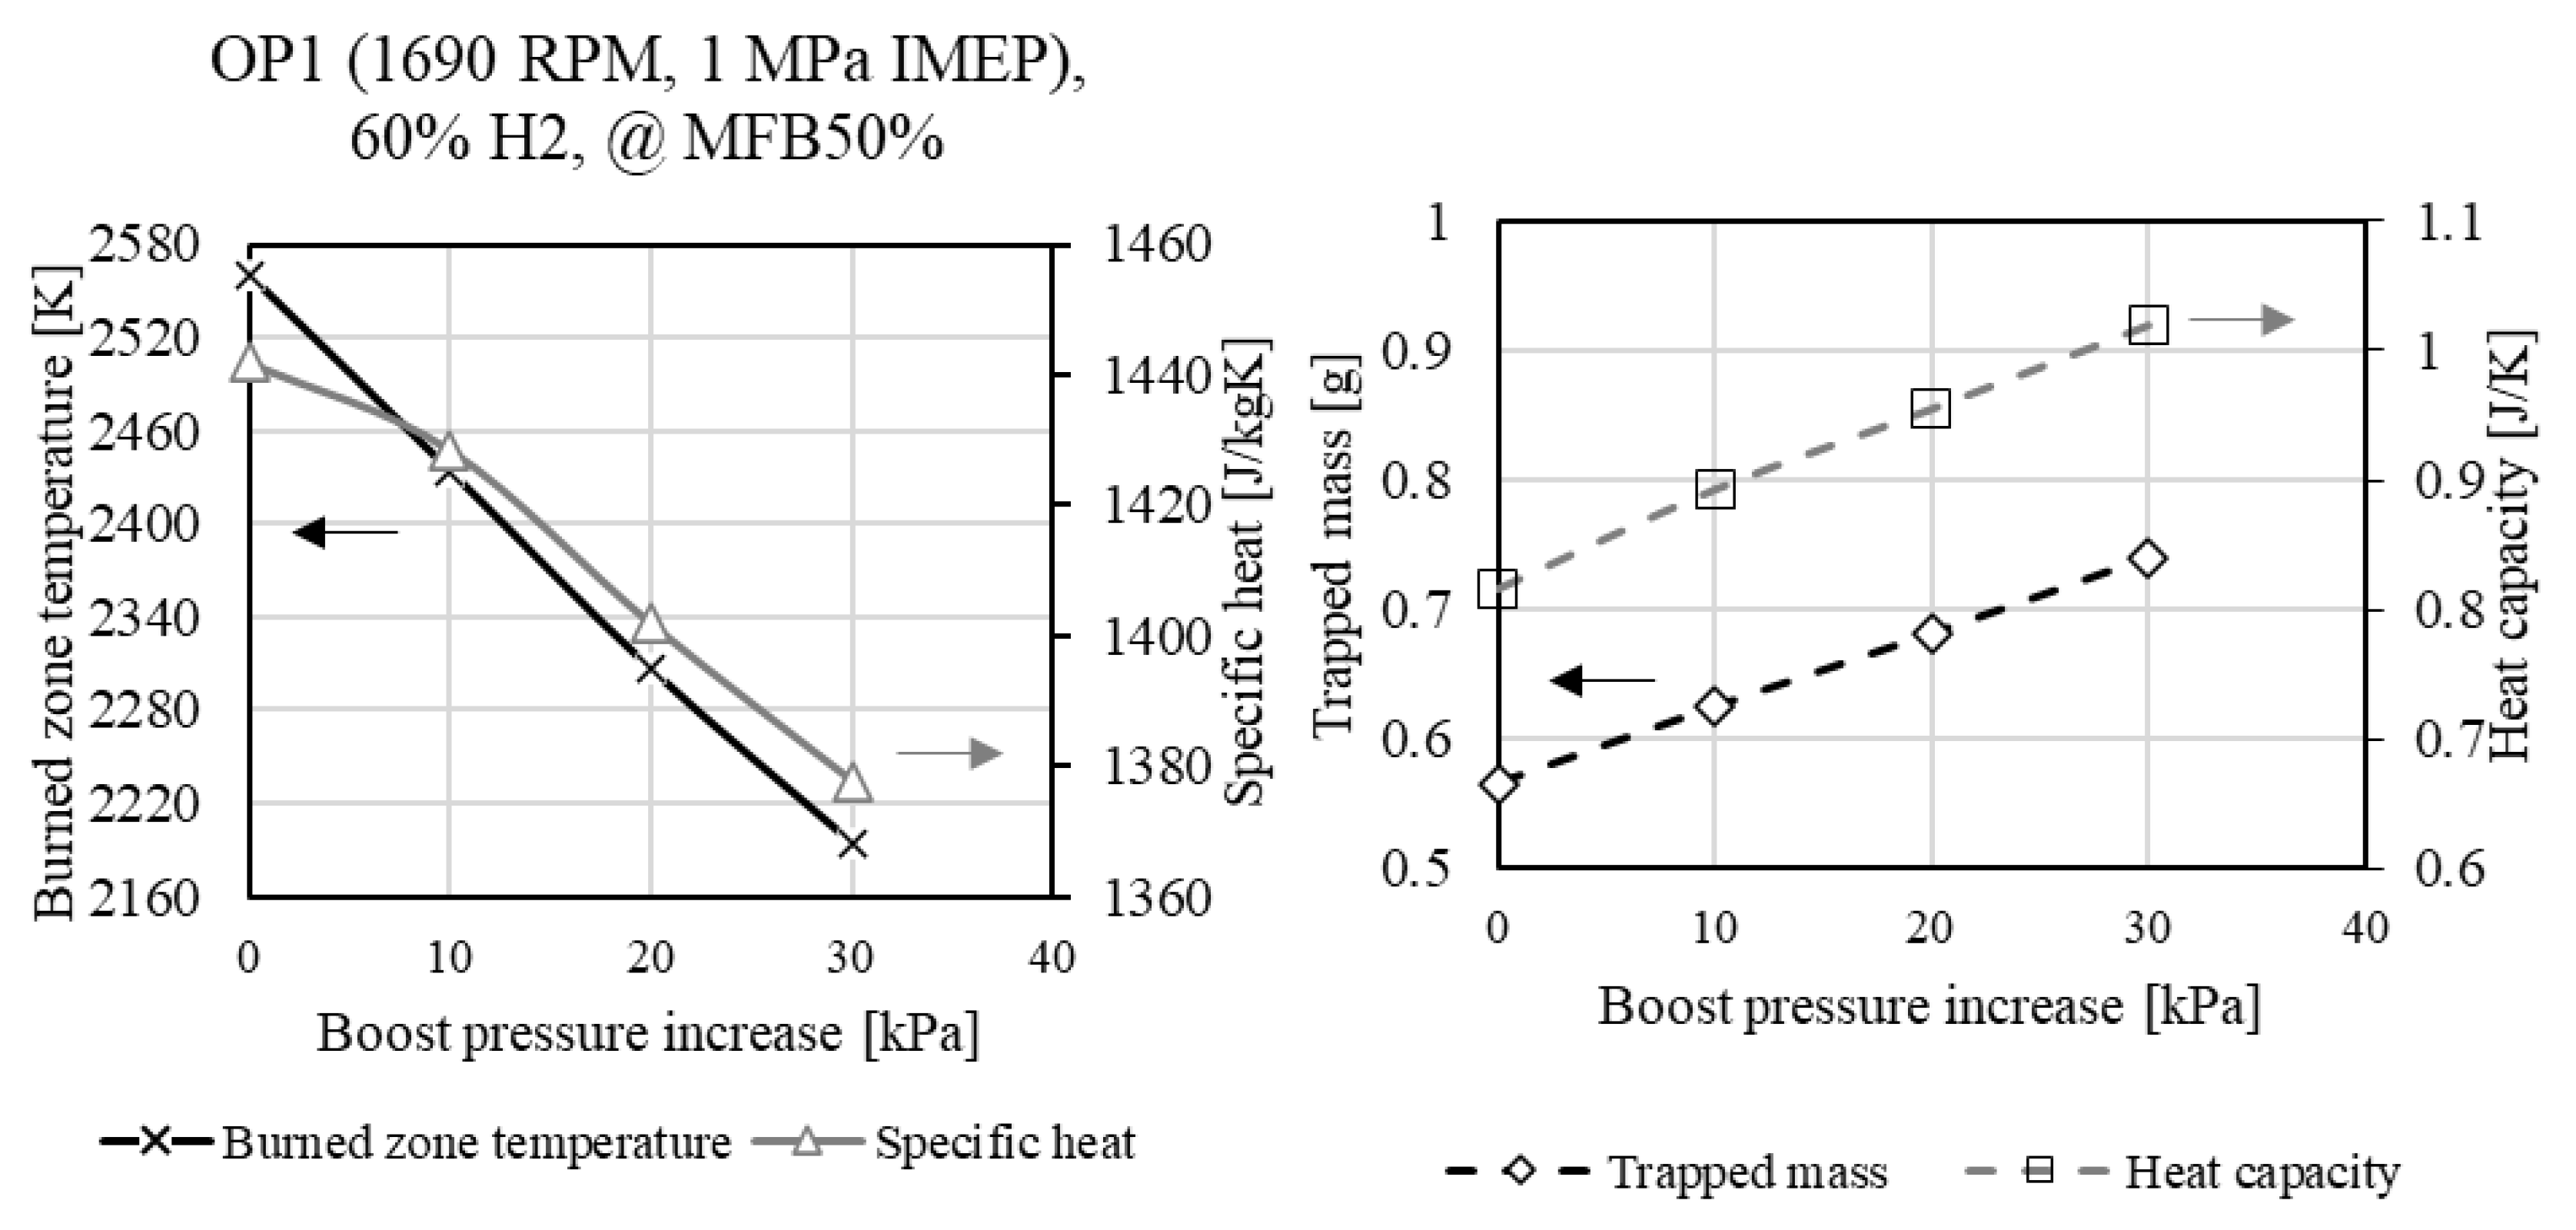
Figure 17 illustrates simulated combustion parameters, covering the burned zone temperature and specific heat (left), as well as the trapped mass and heat capacity (right). Unlike water injection, increasing boost pressure reduces specific heat, but the burned-zone temperature still decreases. This is explained by the increased trapped mass, which raises charge heat capacity despite lower specific heat, ultimately lowering combustion temperatures.
3.2.2. High-Load Operating Point (OP2)
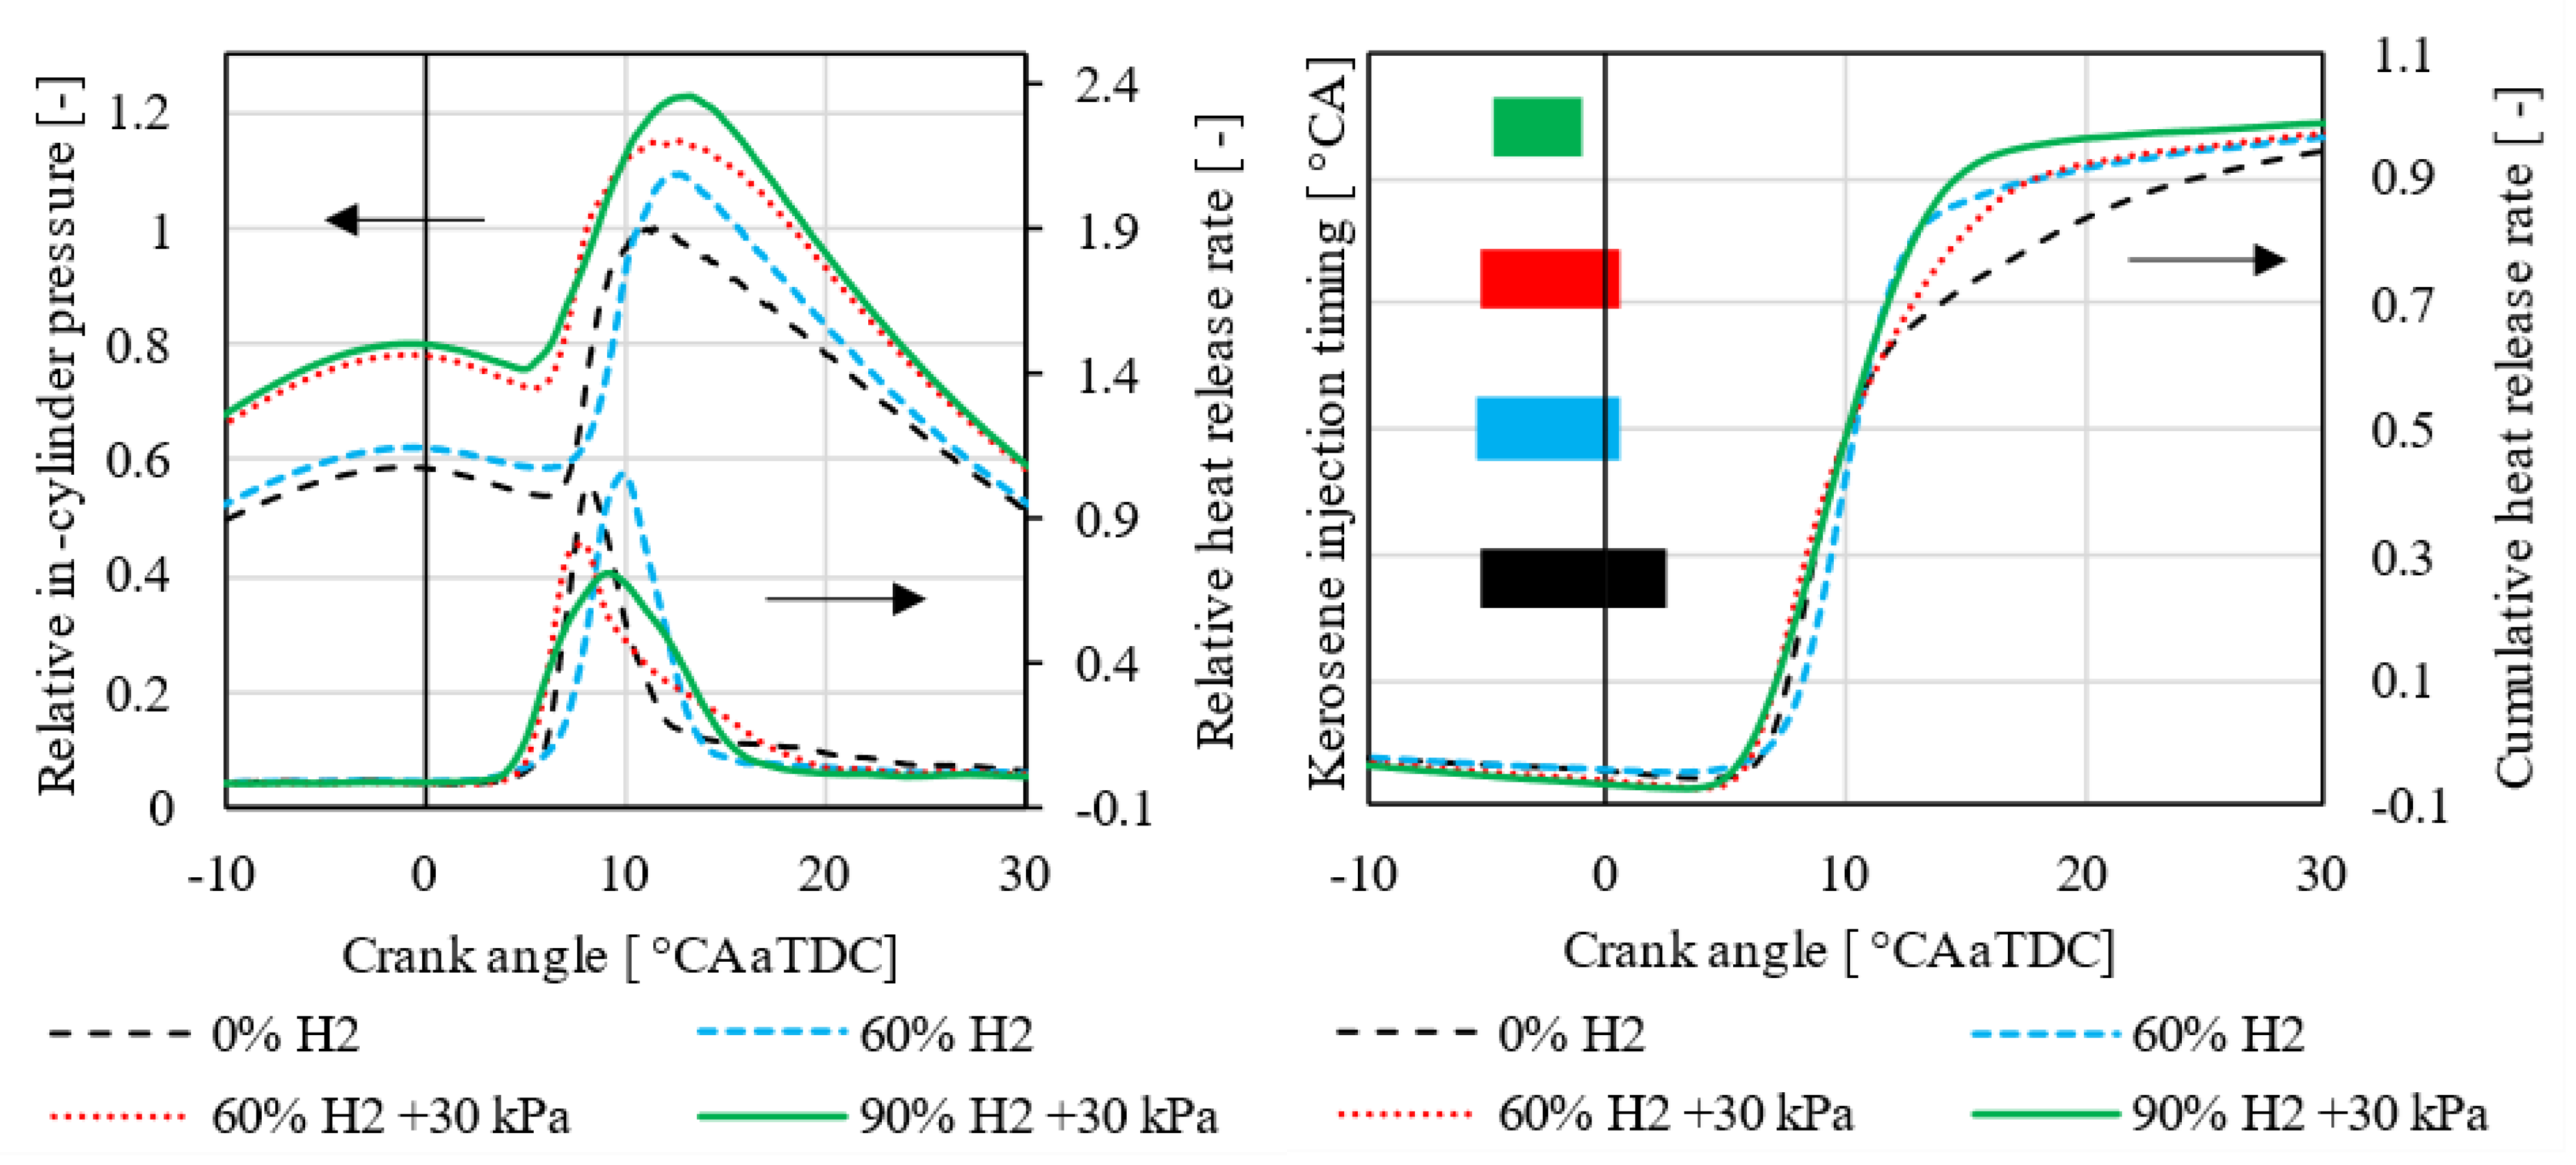
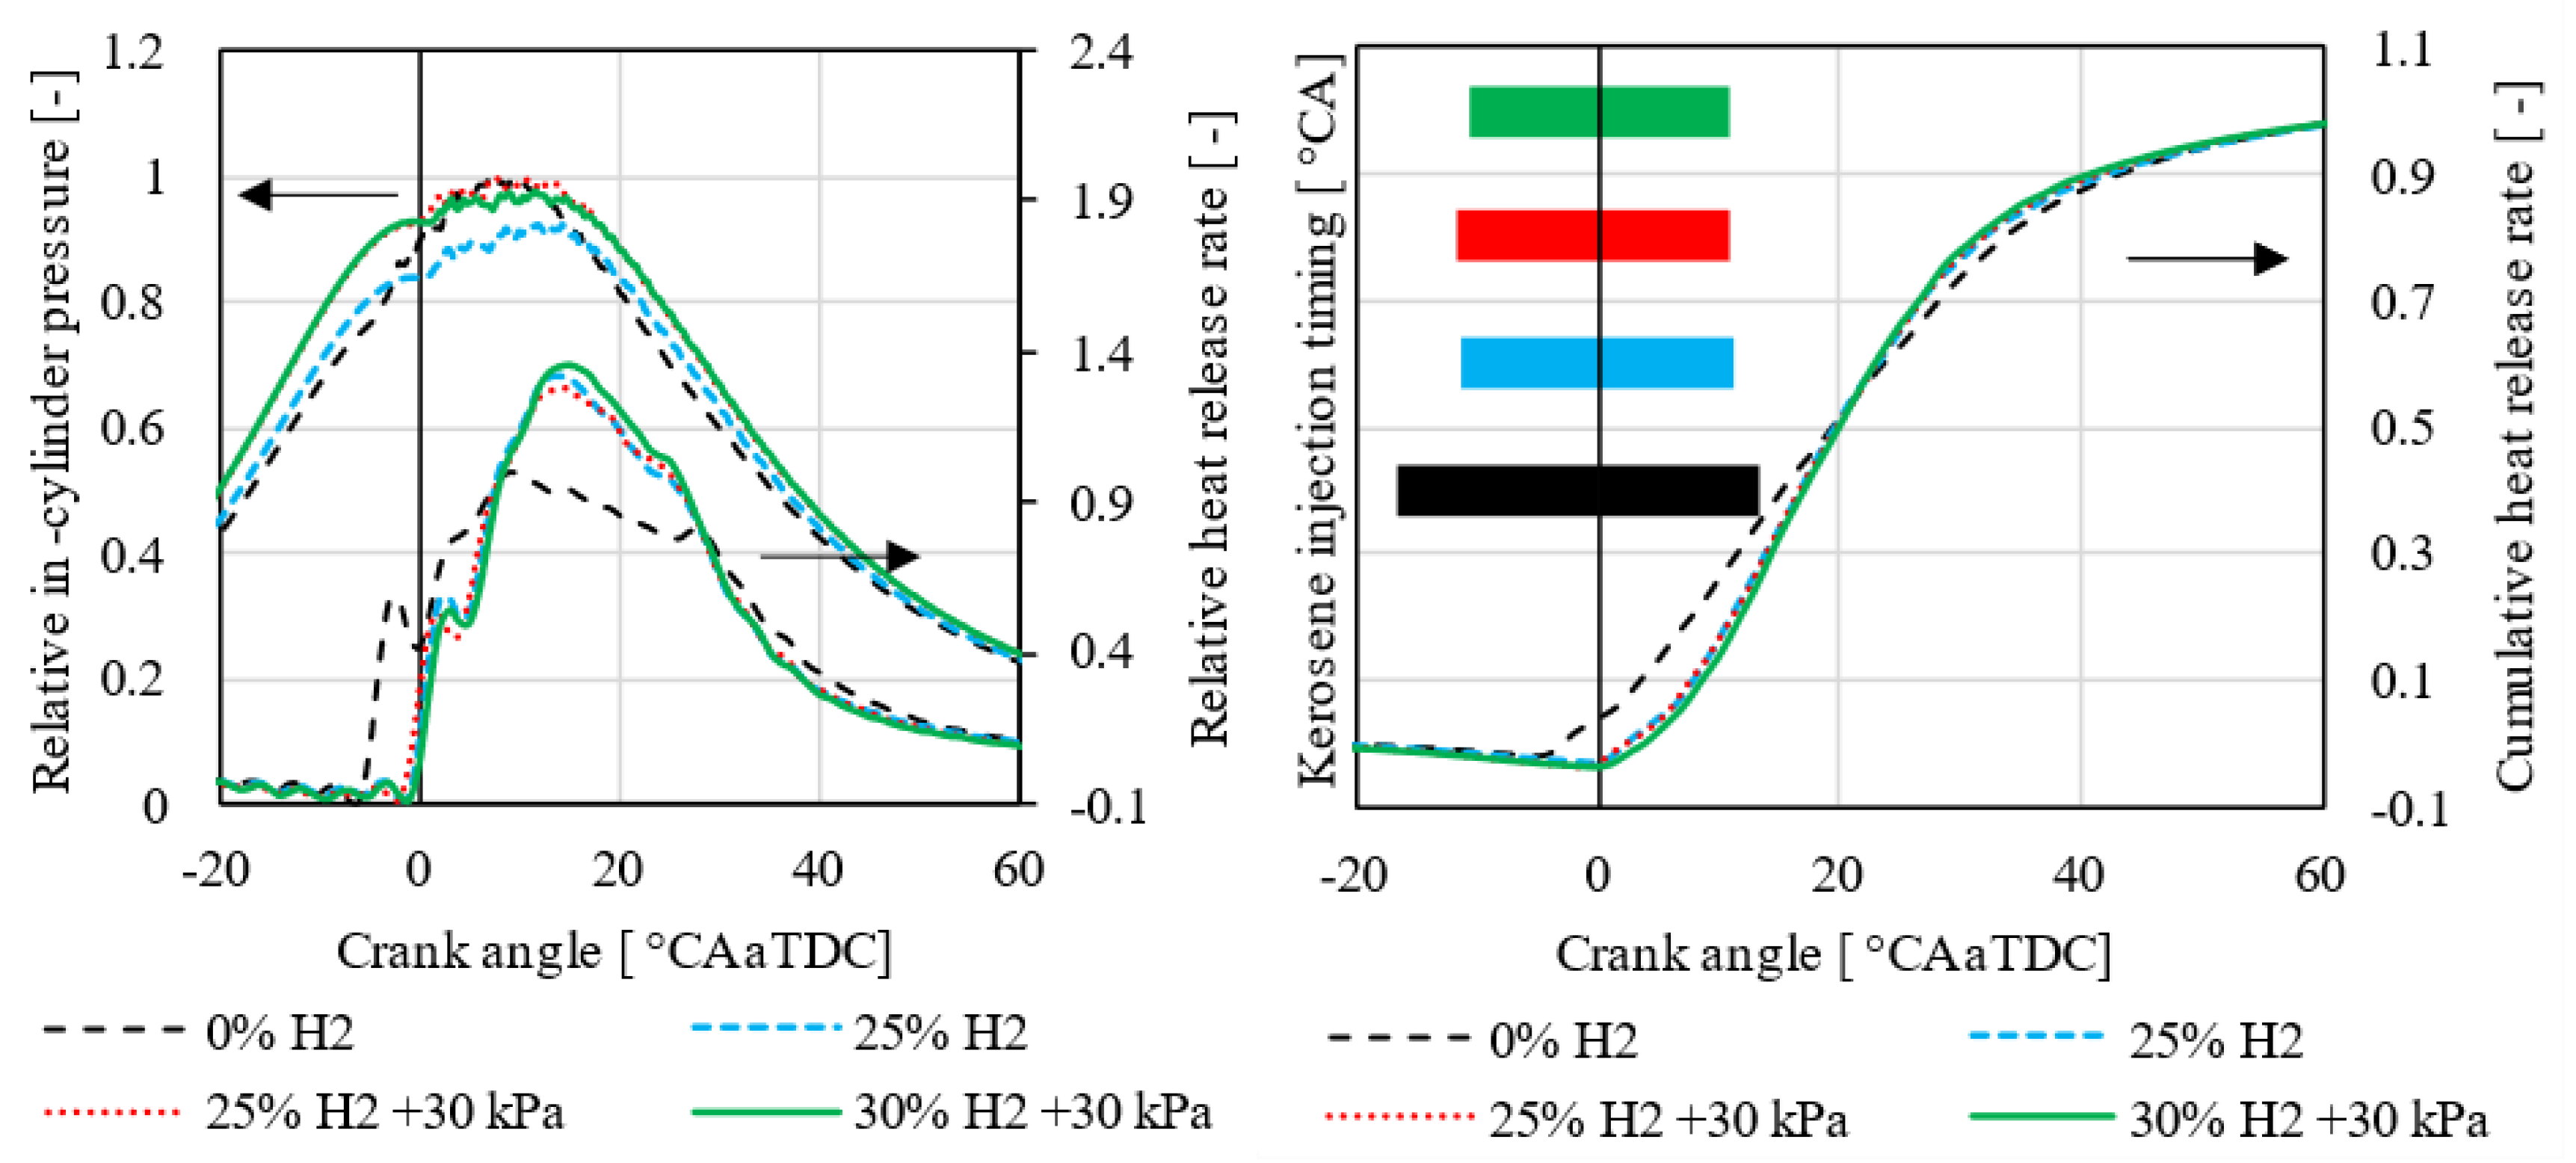
Figure 18 (left) shows the in-cylinder pressure and heat release rate of the boost pressure investigations at OP2. While the compression stroke pressure increases significantly, the peak pressure in the expansion stroke remains similar to the pure kerosene operation. Only at higher hydrogen shares does the peak pressure slightly decrease due to faster and retarded combustion. The heat release rate remains largely unaffected by boost pressure changes.
Figure 18 (right) presents the kerosene injection timing and the cumulative heat release rate. With hydrogen addition, SOI is significantly retarded, indicating a shorter ignition delay. The cumulative heat release profile steepens with a delayed SOC, while MFB90% remains unchanged, confirming that combustion duration is slightly shorter. Boost pressure does not significantly affect these parameters.
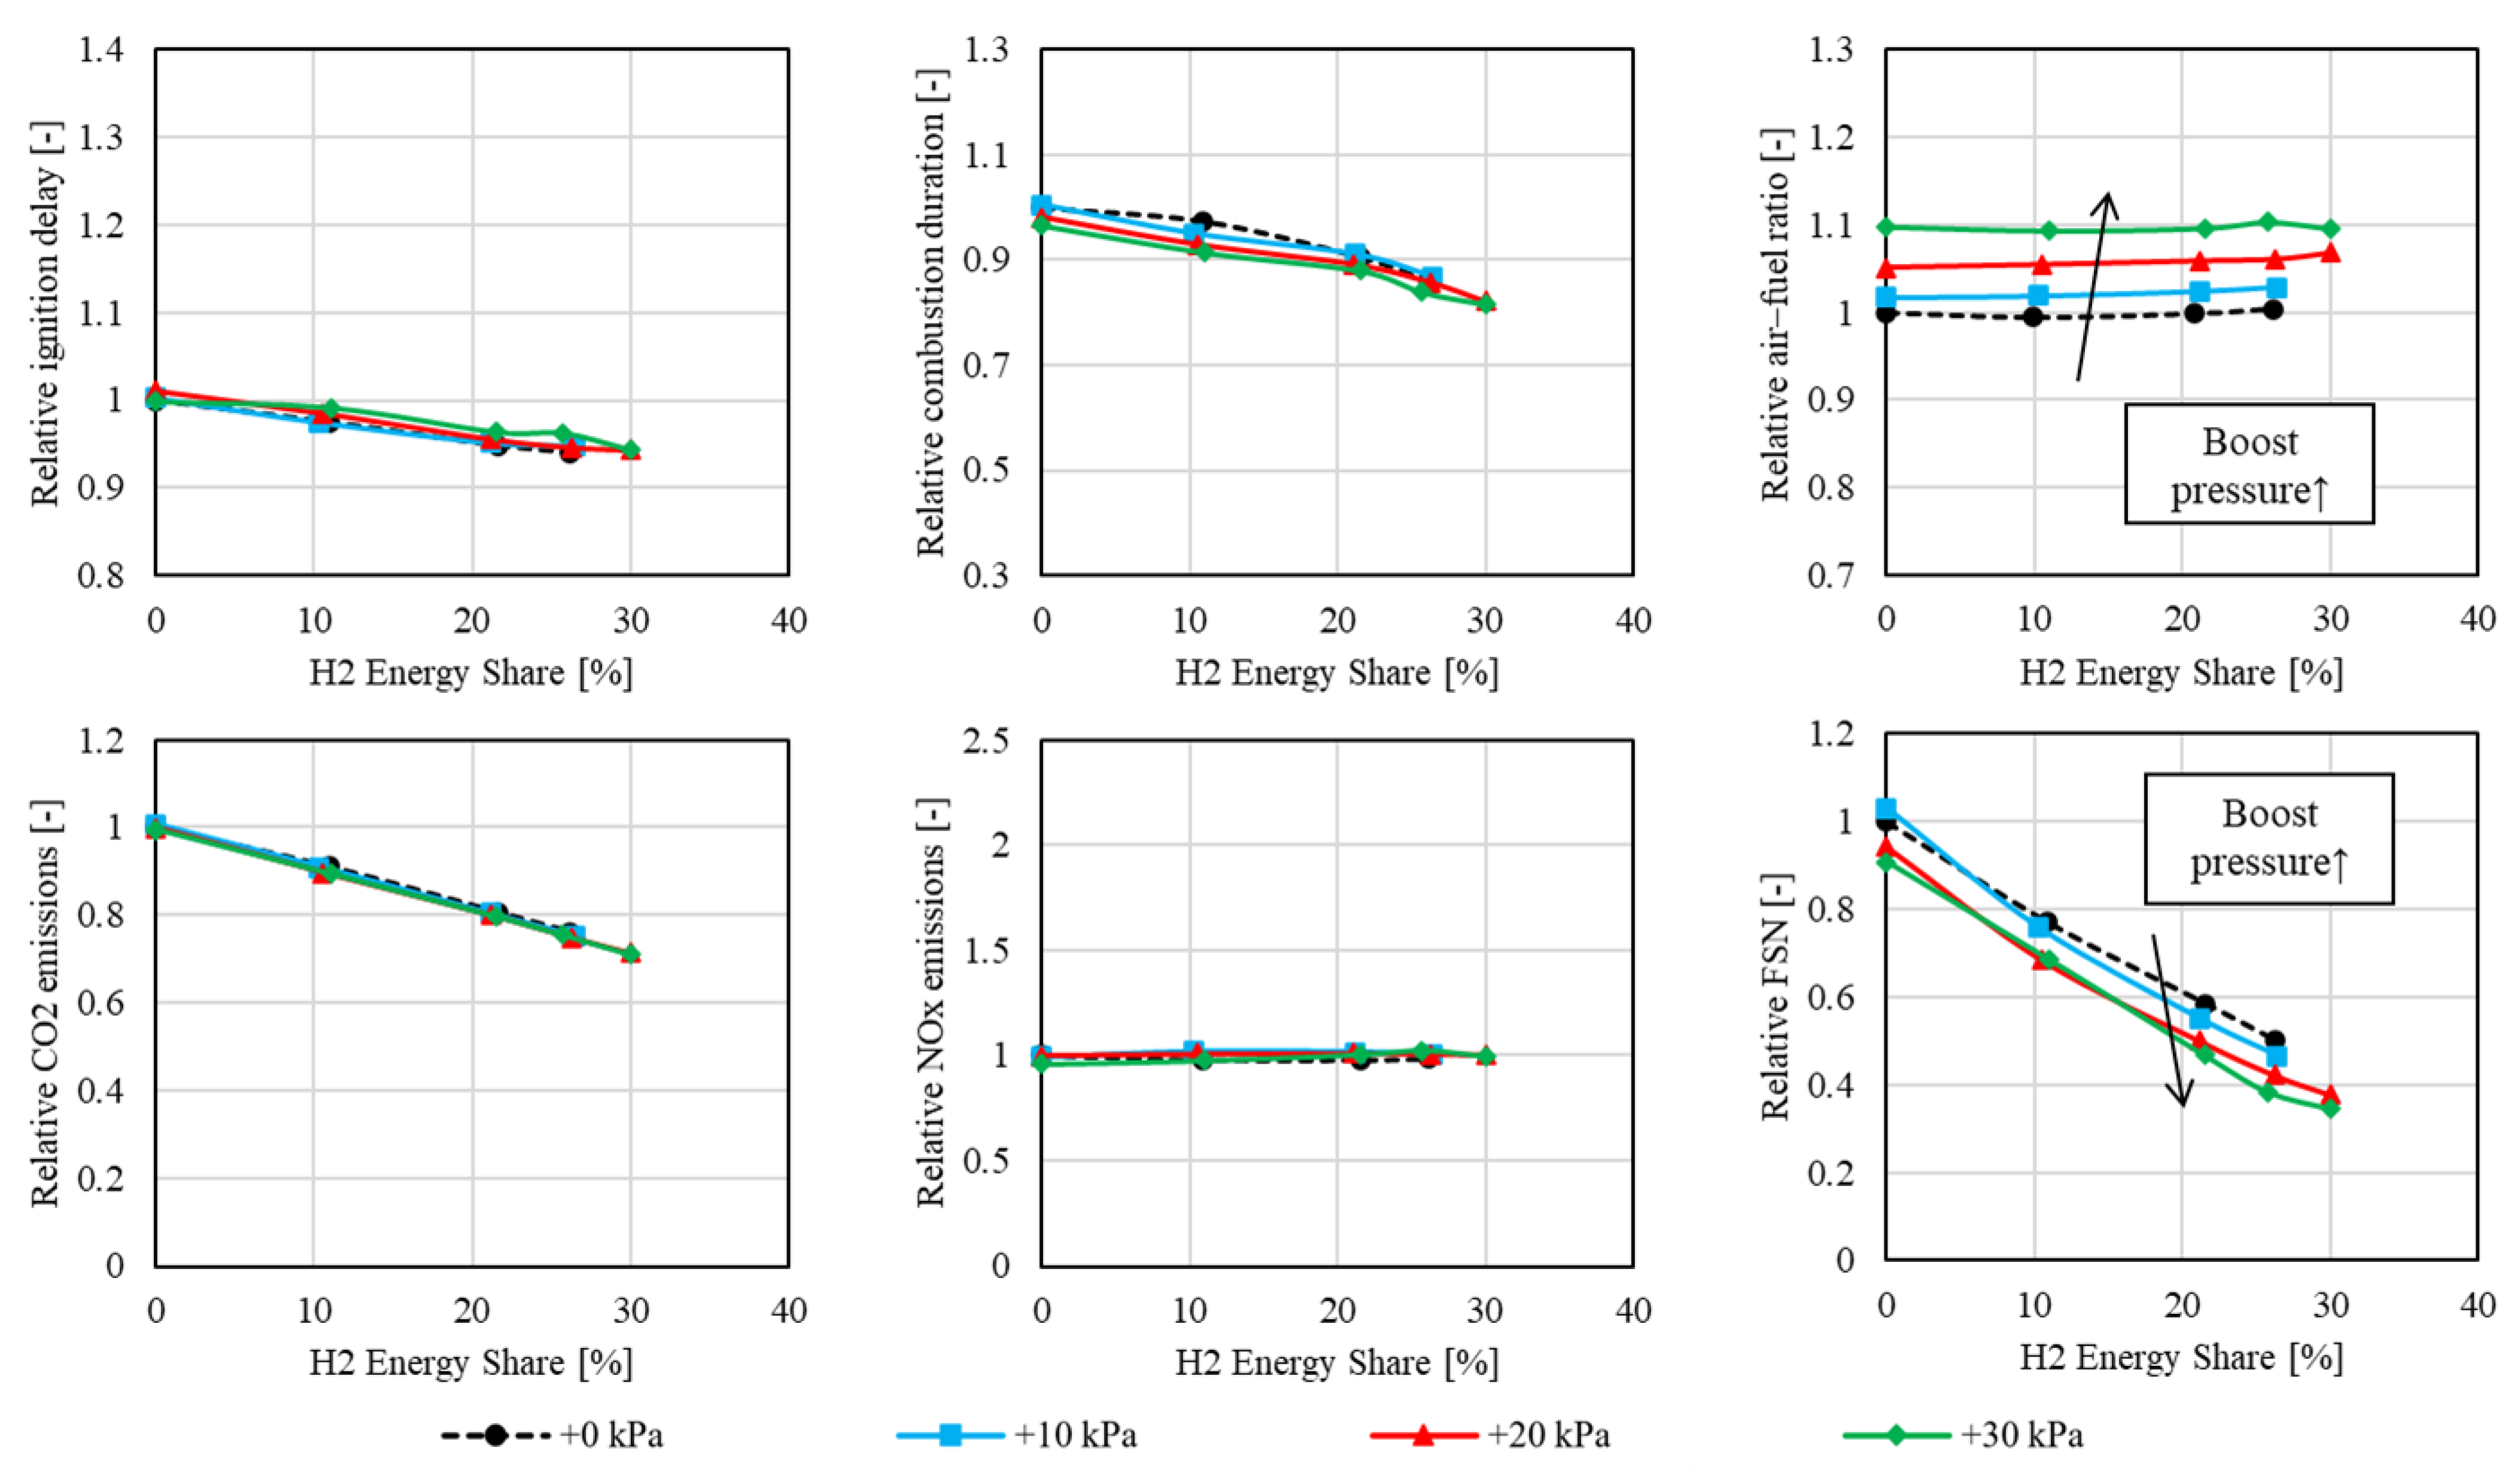
Figure 19 summarizes the combustion characteristics and emissions of OP2 with different boost pressures. Ignition delay remains nearly constant across different boost pressures, indicating that the absolute changes are insufficient to influence ignition timing, which can be attributed to the lower relative boost pressure increase compared to OP1. However, combustion duration benefits slightly from increased boost pressure, likely due to enhanced reaction rates driven by higher in-cylinder pressures and temperatures, as observed in OP1.
The air–fuel ratio increases by up to 10% with + 30 kPa boost pressure according to the higher air mass flow, which is less pronounced than at OP1. However, this adjustment raises the maximum feasible hydrogen share to 30%, as it increases hydrogen ignition energy and reduces soot formation, despite higher combustion pressures and temperatures. CO2 emissions decrease by 30%, corresponding to the H2 share with boost pressure but, unlike OP1, do not result in fuel economy benefits, as efficiency remains unchanged. Similarly, NOx emissions show no clear dependency on boost pressure or hydrogen energy share, as the relative change in boost pressure is considerably lower compared to OP1. Additionally, two likely counteracting effects need to be considered, as follows: higher in-cylinder temperatures increase NOx formation and additional dilution (higher thermal mass) lowers NOx emissions. These effects balance each other out, leading to minimal NOx variation. Finally, soot formation (FSN) is effectively reduced with increasing AFR, as leaner combustion minimizes local fuel-rich zones and therefore decreases soot-formation.
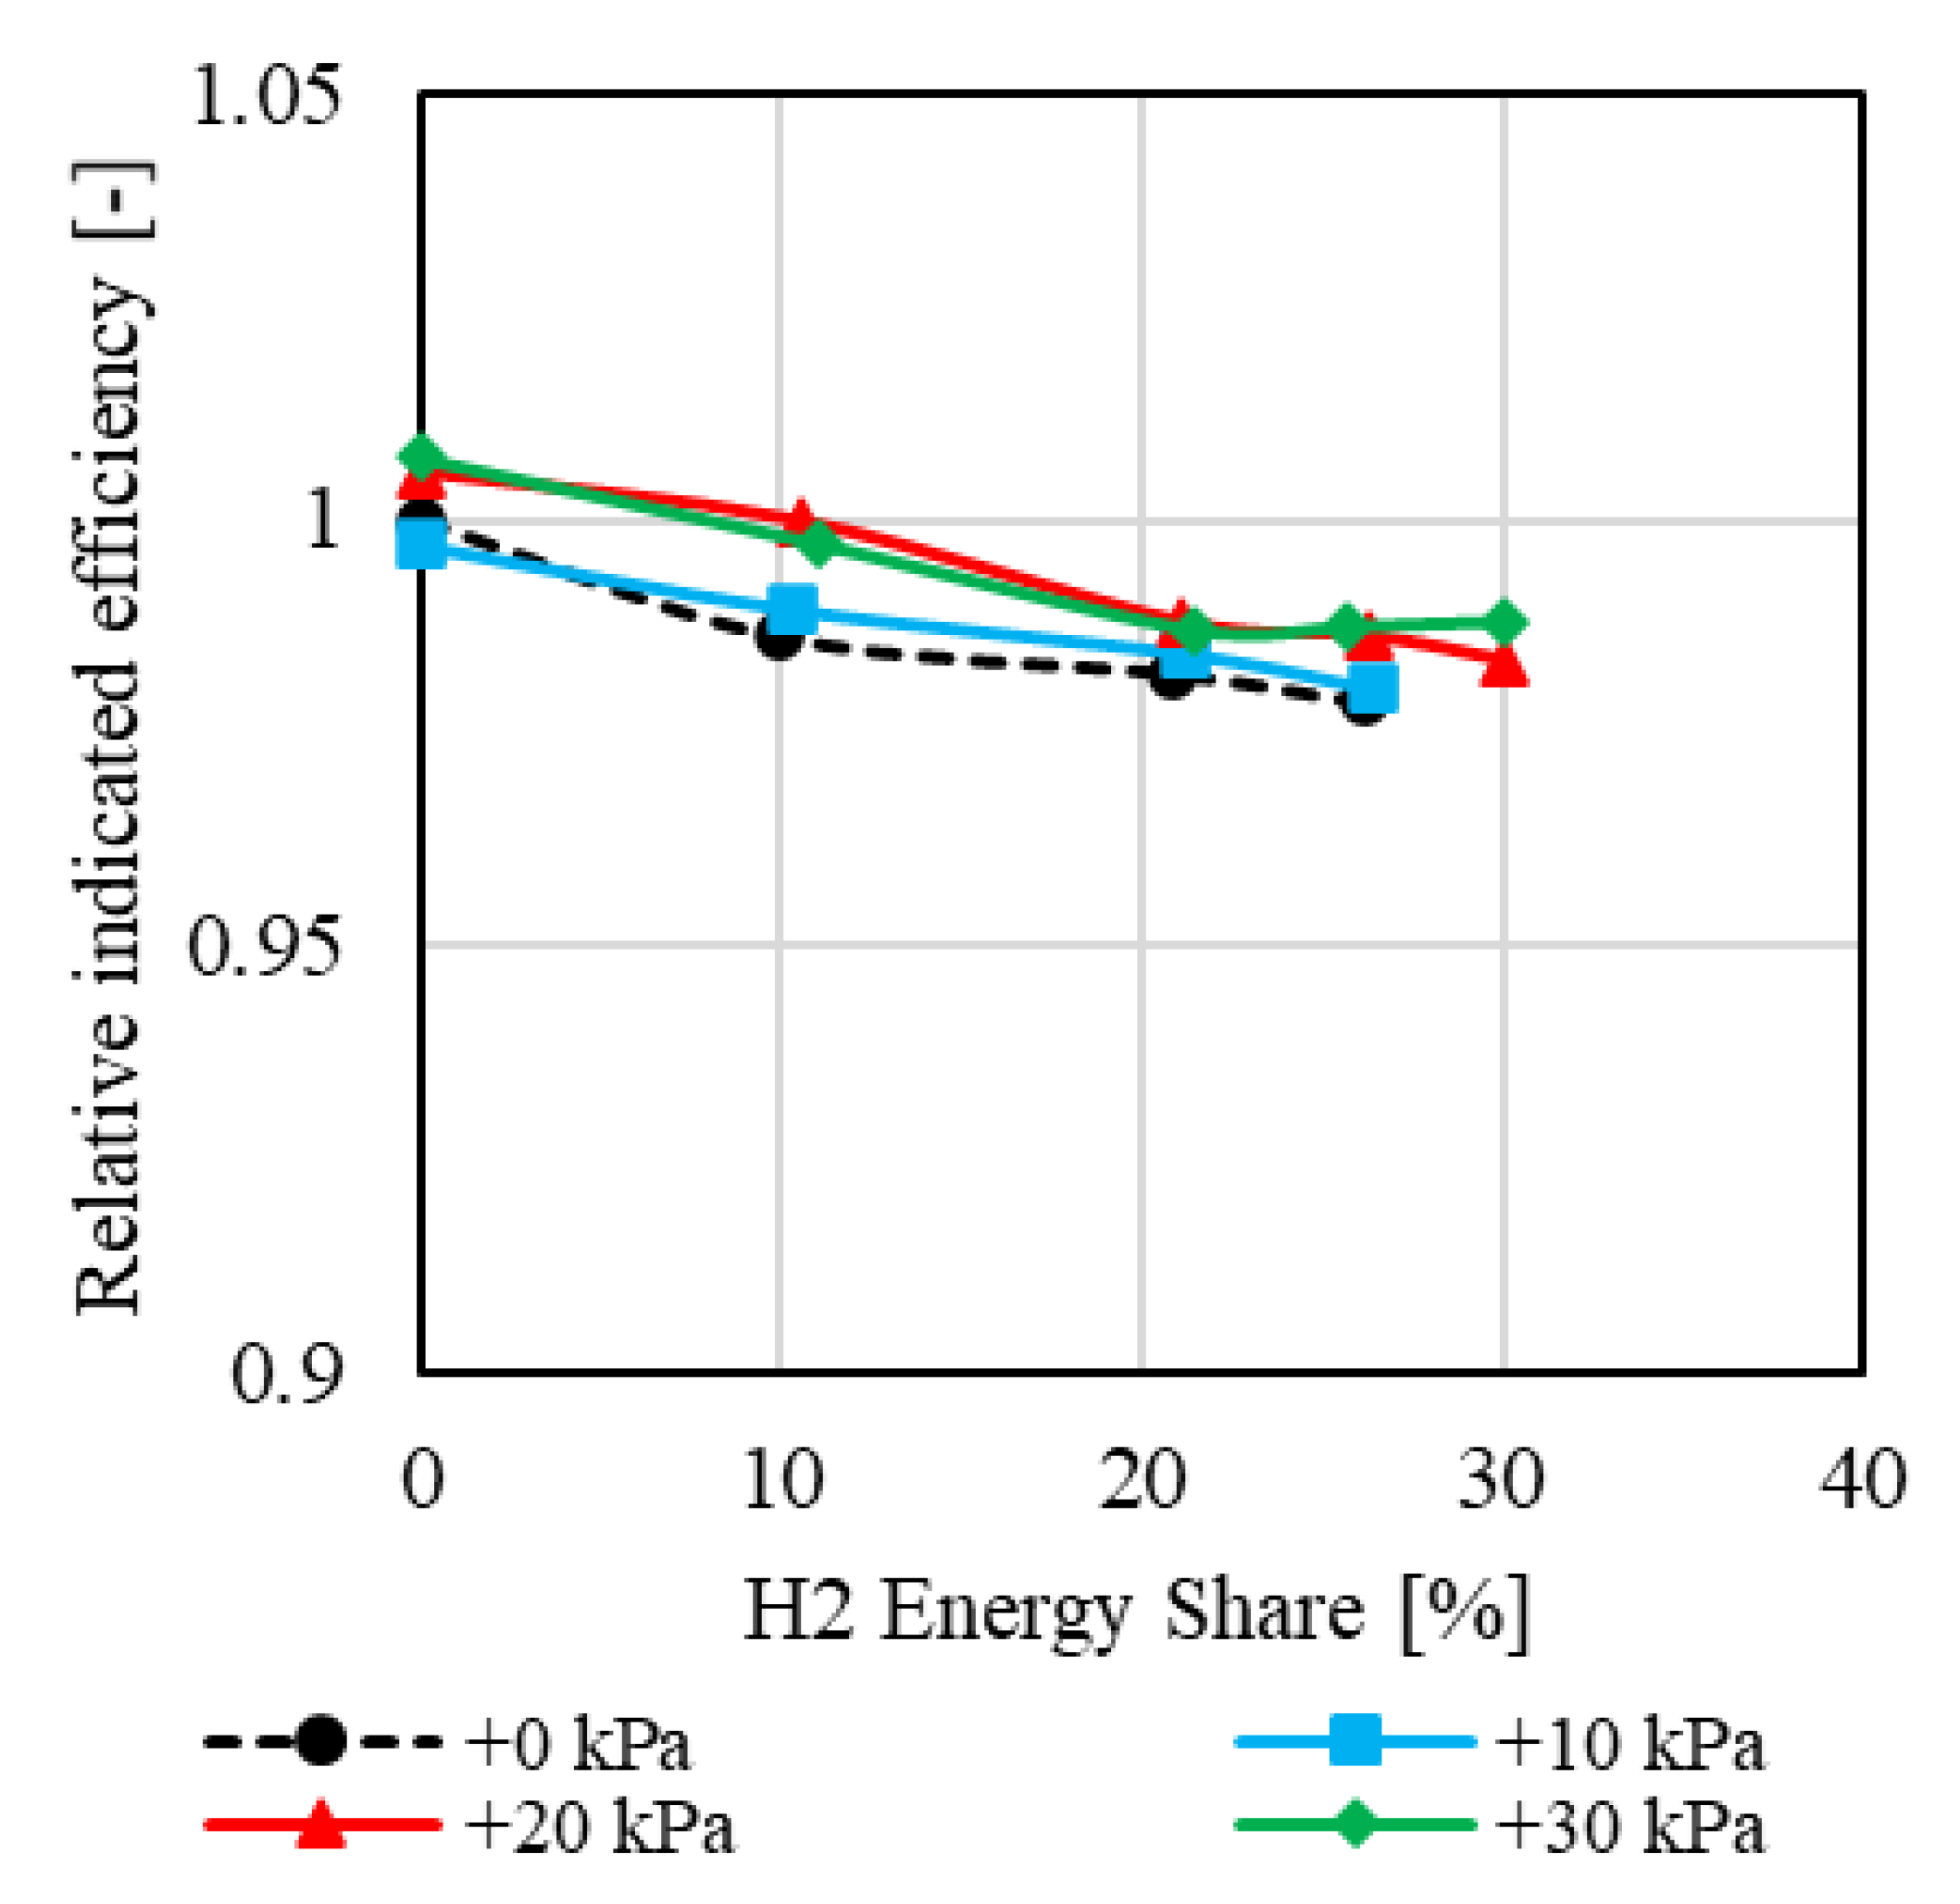
Figure 20 confirms that boost pressure improves efficiency, as observed at OP1, though the general trend of efficiency declines with increasing hydrogen share persists.
The simulated combustion parameters, including burned zone temperature and specific heat (left) as well as trapped mass and heat capacity (right), are presented in
Figure 21. Similarly to OP1, the specific heat decreases with higher boost pressures. The higher trapped mass ultimately leads to an increase in heat capacity and a significant reduction in temperatures in the combustion chamber.
3.3. Overview of the Results
The general influence of hydrogen addition on combustion characteristics varies depending on the operating point:
At low load (OP1), hydrogen addition increases ignition delay due to its dilution effect, while its high laminar flame speed leads to shorter combustion duration. The air–fuel ratio (AFR) decreases as hydrogen displaces intake air. Lastly, NOx emissions increase significantly, primarily due to elevated combustion temperatures associated with the high adiabatic flame temperature of hydrogen.
At high load (OP2), hydrogen addition has a slightly different effect. Ignition delay decreases slightly, likely due to the elevated pressure and temperature levels caused by retarded SOI for maintaining constant AI50%, which outweighs the dilution effects of hydrogen. Combustion duration is again significantly reduced, reflecting the faster combustion characteristics of hydrogen. Unlike at low load, AFR remains largely unchanged due to the influence of higher RPM and boost pressure at high load conditions. Finally, NOx emissions remain stable, as the reduction in peak in-cylinder pressures compensates for the higher combustion temperatures of hydrogen.
Generally, carbon-based emissions such as CO2 and FSN are significantly reduced with hydrogen addition due to its carbon-free combustion characteristics.
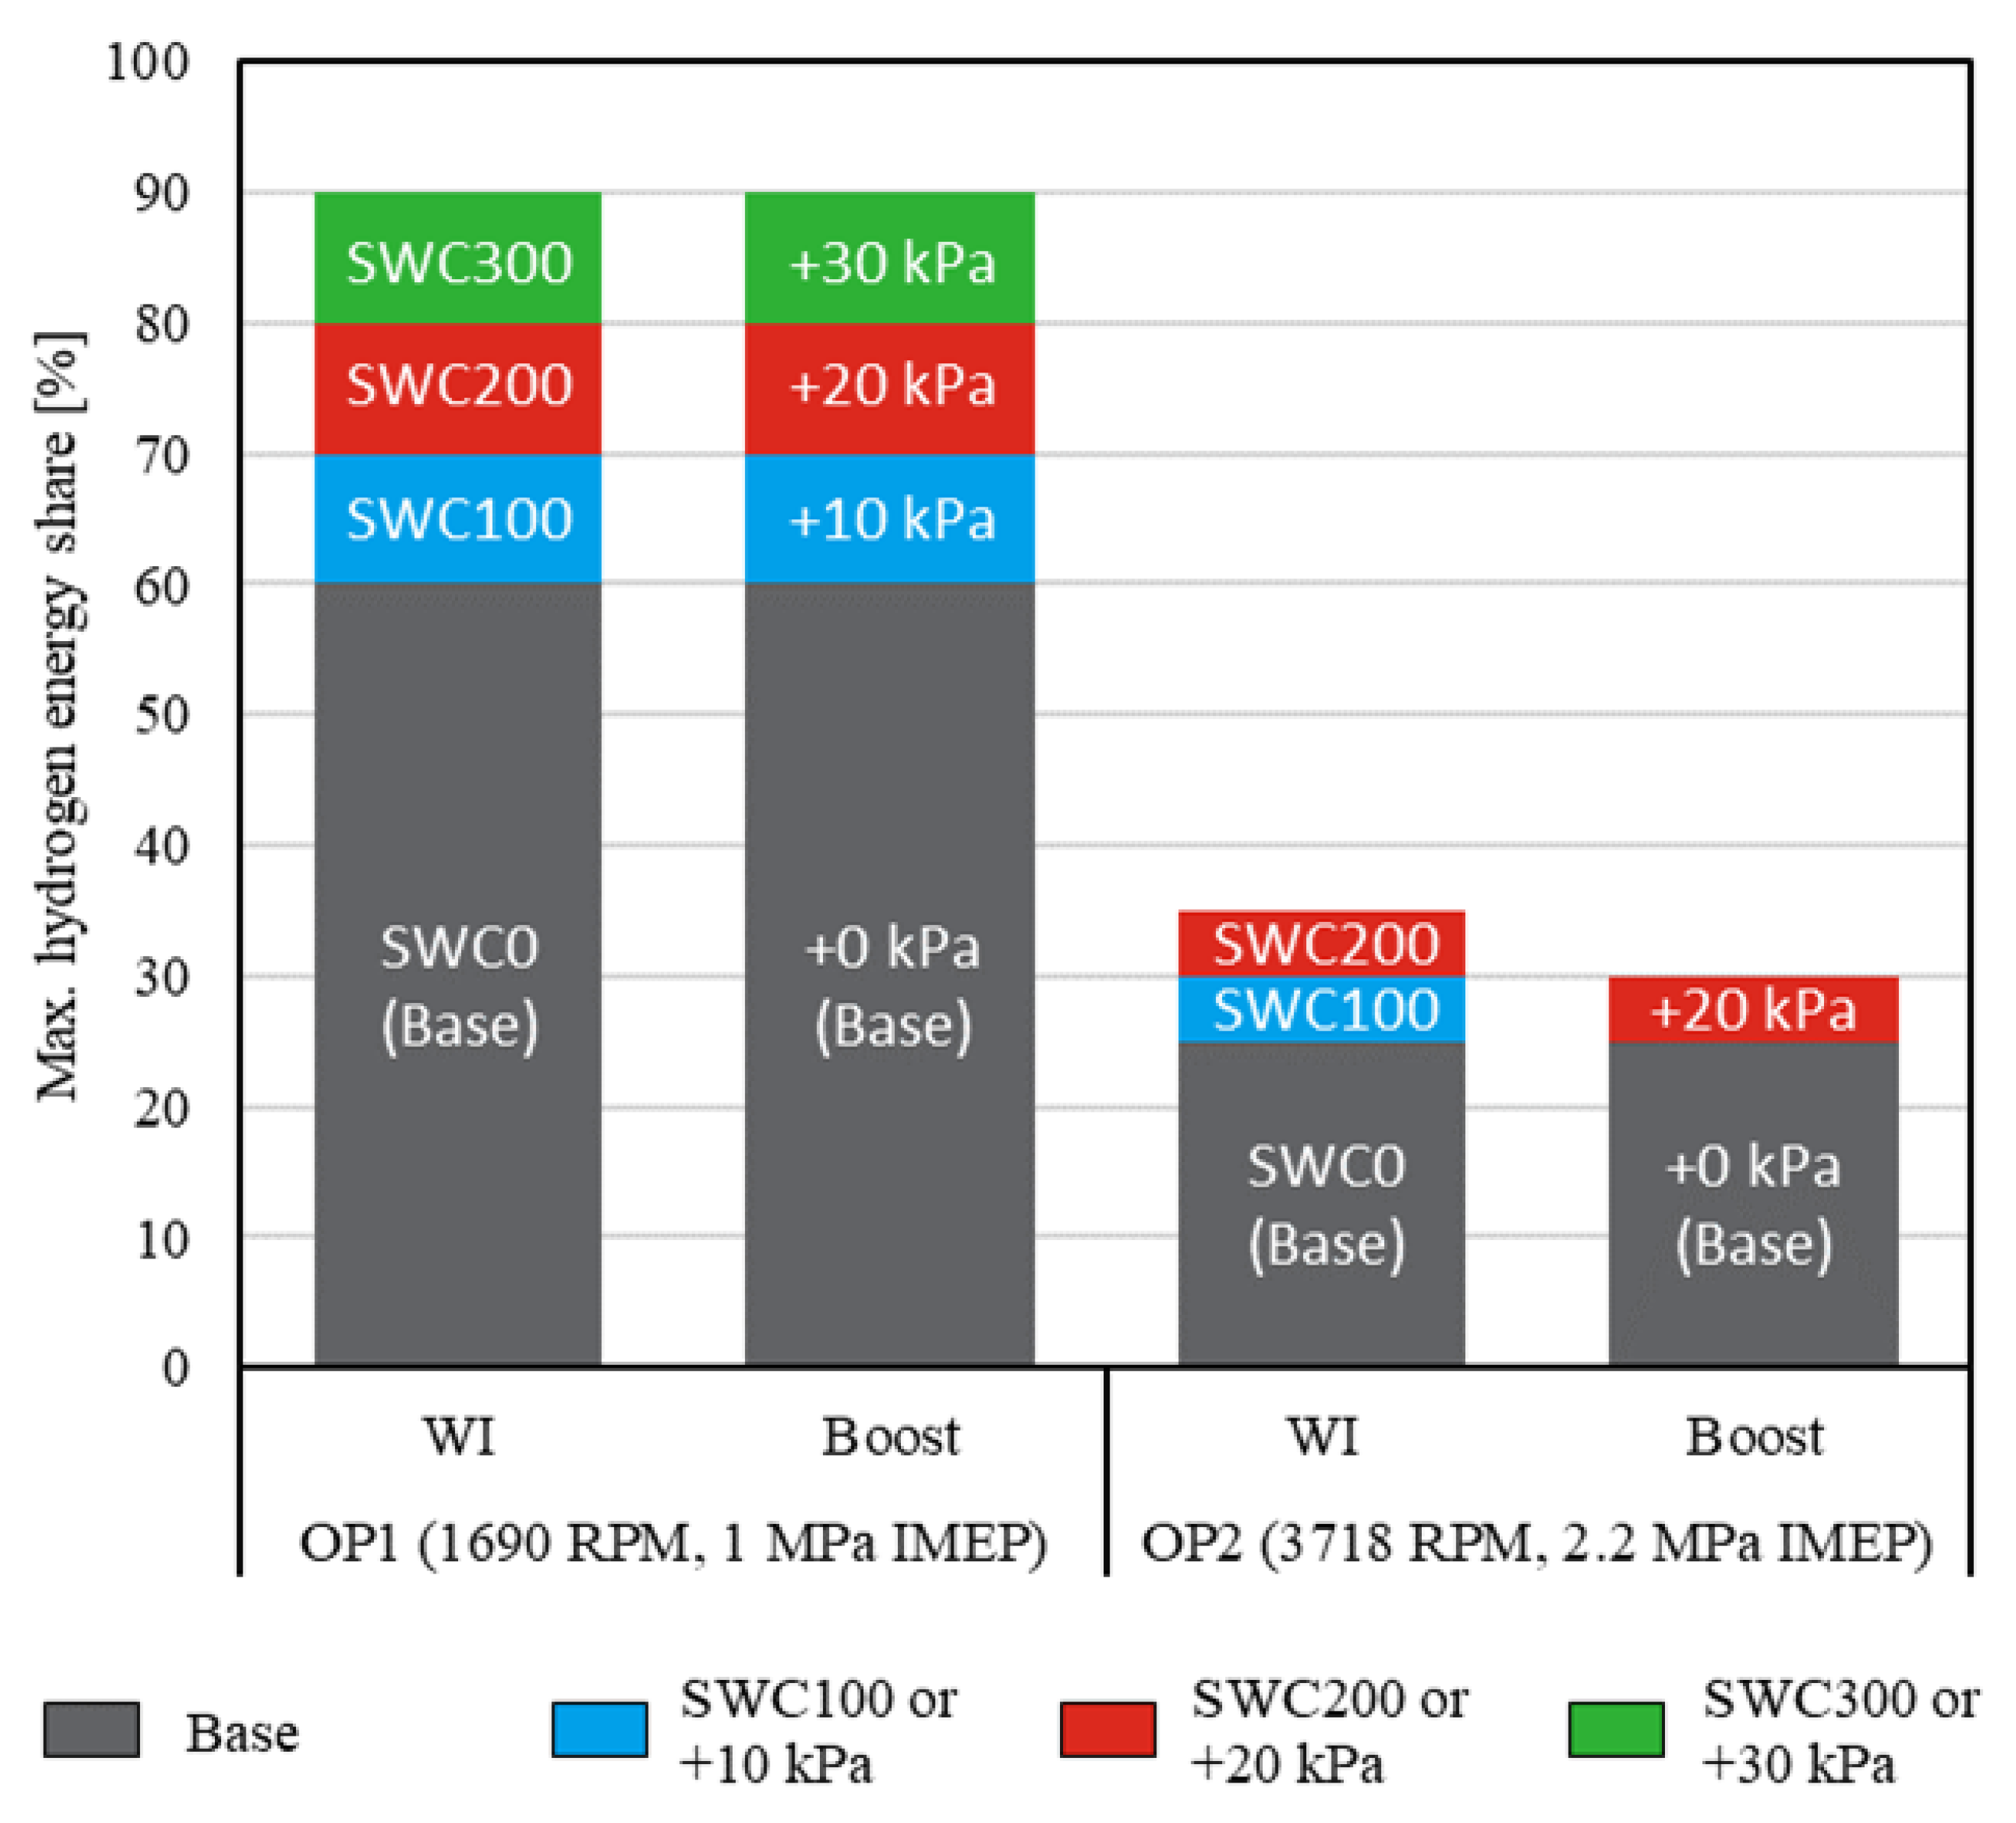
An overview and summary of the measurement results regarding the maximum achievable hydrogen energy share with the respective strategy and the amount of water and boost pressure increase is illustrated in
Figure 22.
At low load (OP1), water injection and raising boost pressure show a significant improvement in mitigating abnormal combustion. With these two methods, the desired 90% hydrogen energy share is possible without unwanted preignitions or knocking.
At high load (OP2), water injection shows the highest improvement of the investigated strategies. The hydrogen energy share could be increased from 25% up to 35%, which is a relative improvement of 40%. However, in absolute terms, the hydrogen energy share is still very low at this operating point. Also, the increase in boost pressure resulted in a slightly improved hydrogen energy share. This can be explained by the lower relative air mass flow and AFR increase, compared to OP1. Due to the limitations of maximum allowable in-cylinder pressures and the compression unit, higher boost pressures were not possible.
Overall, the investigated strategies showed very good results at low load. Nonetheless, the hydrogen energy shares at high load are not satisfactory and it is clear that other strategies have to be implemented in order raise the amount of H2 to an adequate level.
4. Efficiency Loss Analysis
The efficiency loss analyses were carried out using GT-Power software, as described in
Section 2.2. Based on experimental data, multiple simulations were conducted following the well-established methodology of Pischinger et al. [
26]. The resulting losses were determined by sequentially subtracting the individual contributions. The specific losses and their underlying mechanisms will be elaborated upon in the following, and are based on [
26,
27]. Starting from the ideal cycle efficiency (ideal Otto cycle), the following losses are sequentially subtracted in a predefined order, ultimately resulting in the indicated efficiency. The Otto cycle was selected because the focus is on a combustion process for hydrogen with a kerosene ignition jet. In addition, a uniform comparison basis for a spark ignition system needs to be created as the next development step.
In the context of engine performance analysis, fluid losses encompass the thermodynamic losses that arise due to two primary factors: the real fluid properties, which include pressure- and temperature-dependent caloric characteristics, and the actual composition of the intake gases, as opposed to pure air.
Unburned Fuel refers to the efficiency loss resulting from unburned fuels. It is noteworthy that both CO and HC emissions are particularly low across all operating points. At low H
2 energy shares, there is always a risk that the lean mixture will not burn completely. However, measurements showed a negligible concentration of hydrogen in the exhaust gas, which also correlates with experience from the literature [
28].
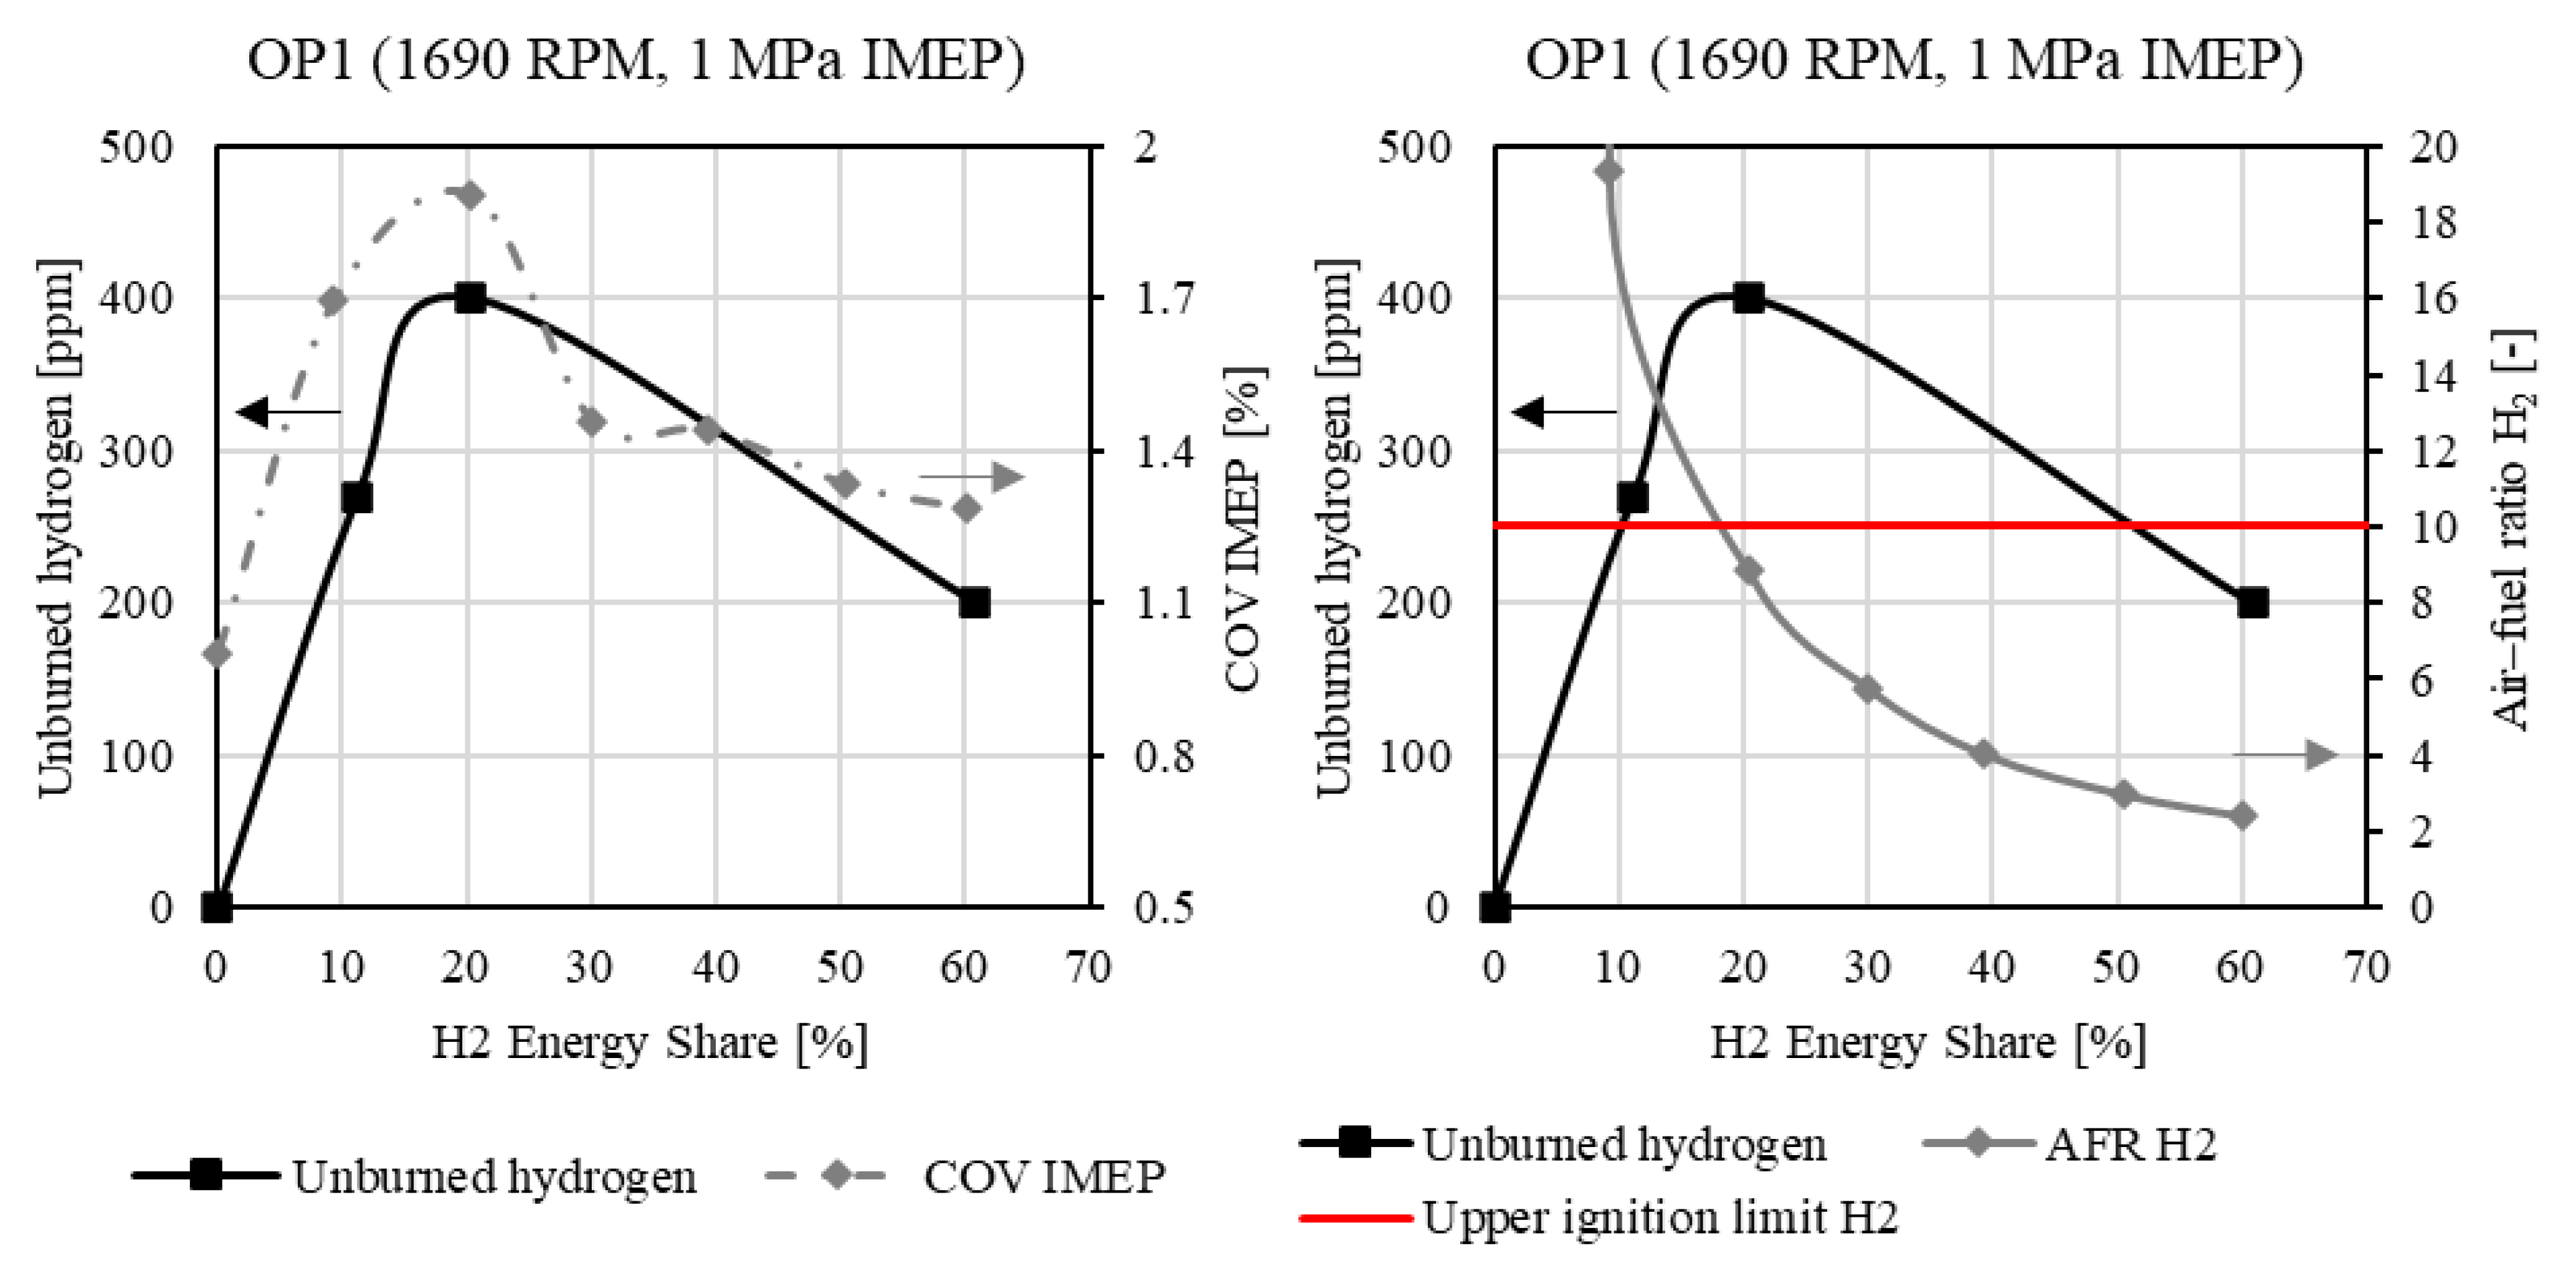
For the exemplary case of OP1, the unburned hydrogen in the exhaust was measured under dry conditions using gas chromatography coupled with mass spectrometry.
Figure 23 (left) illustrates the trend of the measured hydrogen concentration as a function of the H
2 energy share. The results confirm that the efficiency loss attributable to unburned hydrogen is insignificant, consistent with the findings reported in the aforementioned literature. Additionally, the coefficient of variation (COV) of the indicated mean effective pressure (IMEP) is plotted, showing a strong correlation with the unburned hydrogen concentration. As can be seen, COV
IMEP is generally low, which indicates stable combustion behavior, as is also confirmed by the low H
2 concentration. There is a slight increase in the concentration of unburned hydrogen and of COV
IMEP of up to 20% hydrogen energy share. This due to the fact that the hydrogen–fuel–air ratio falls below the upper ignition limit of hydrogen (λ = 10), see
Figure 23, right. At a lower hydrogen energy, extremely lean local zones outside the ignition limits are formed, which lead to a slight increase in COV
IMEP and unburned H
2.
Combustion losses describe the decrease in efficiency resulting from actual burn rates (combustion duration) and suboptimal combustion phasing (MFB50%).
Heat transfer involves losses due to the transfer of heat to the combustion chamber walls. The ‘WoschniGT’ model was chosen as the ‘Heat Transfer Model’.
Finally, gas exchange summarizes the energy losses due to charge exchange work. Since the ratio of exhaust backpressure to intake manifold pressure was kept constant at each operating point, the impact of these losses is negligible.
Based on the reasons mentioned above, the analysis focuses on ‘Fluid’, ‘Combustion’, and ‘Heat Transfer’ losses.
In the following sections, two efficiency loss analyses are presented: one focusing on water injection and the other on boost pressure increase. Each analysis examines two operating points, OP1 and OP2. For each operating point, four scenarios are analyzed, as follows: a pure kerosene operation point (0% H2) as a baseline, a point with the highest hydrogen substitution rate without a strategy, a point with the same hydrogen substitution rate but with water injection or boost pressure increase, and a point with the highest achievable hydrogen substitution rate with water injection or boost pressure increase.
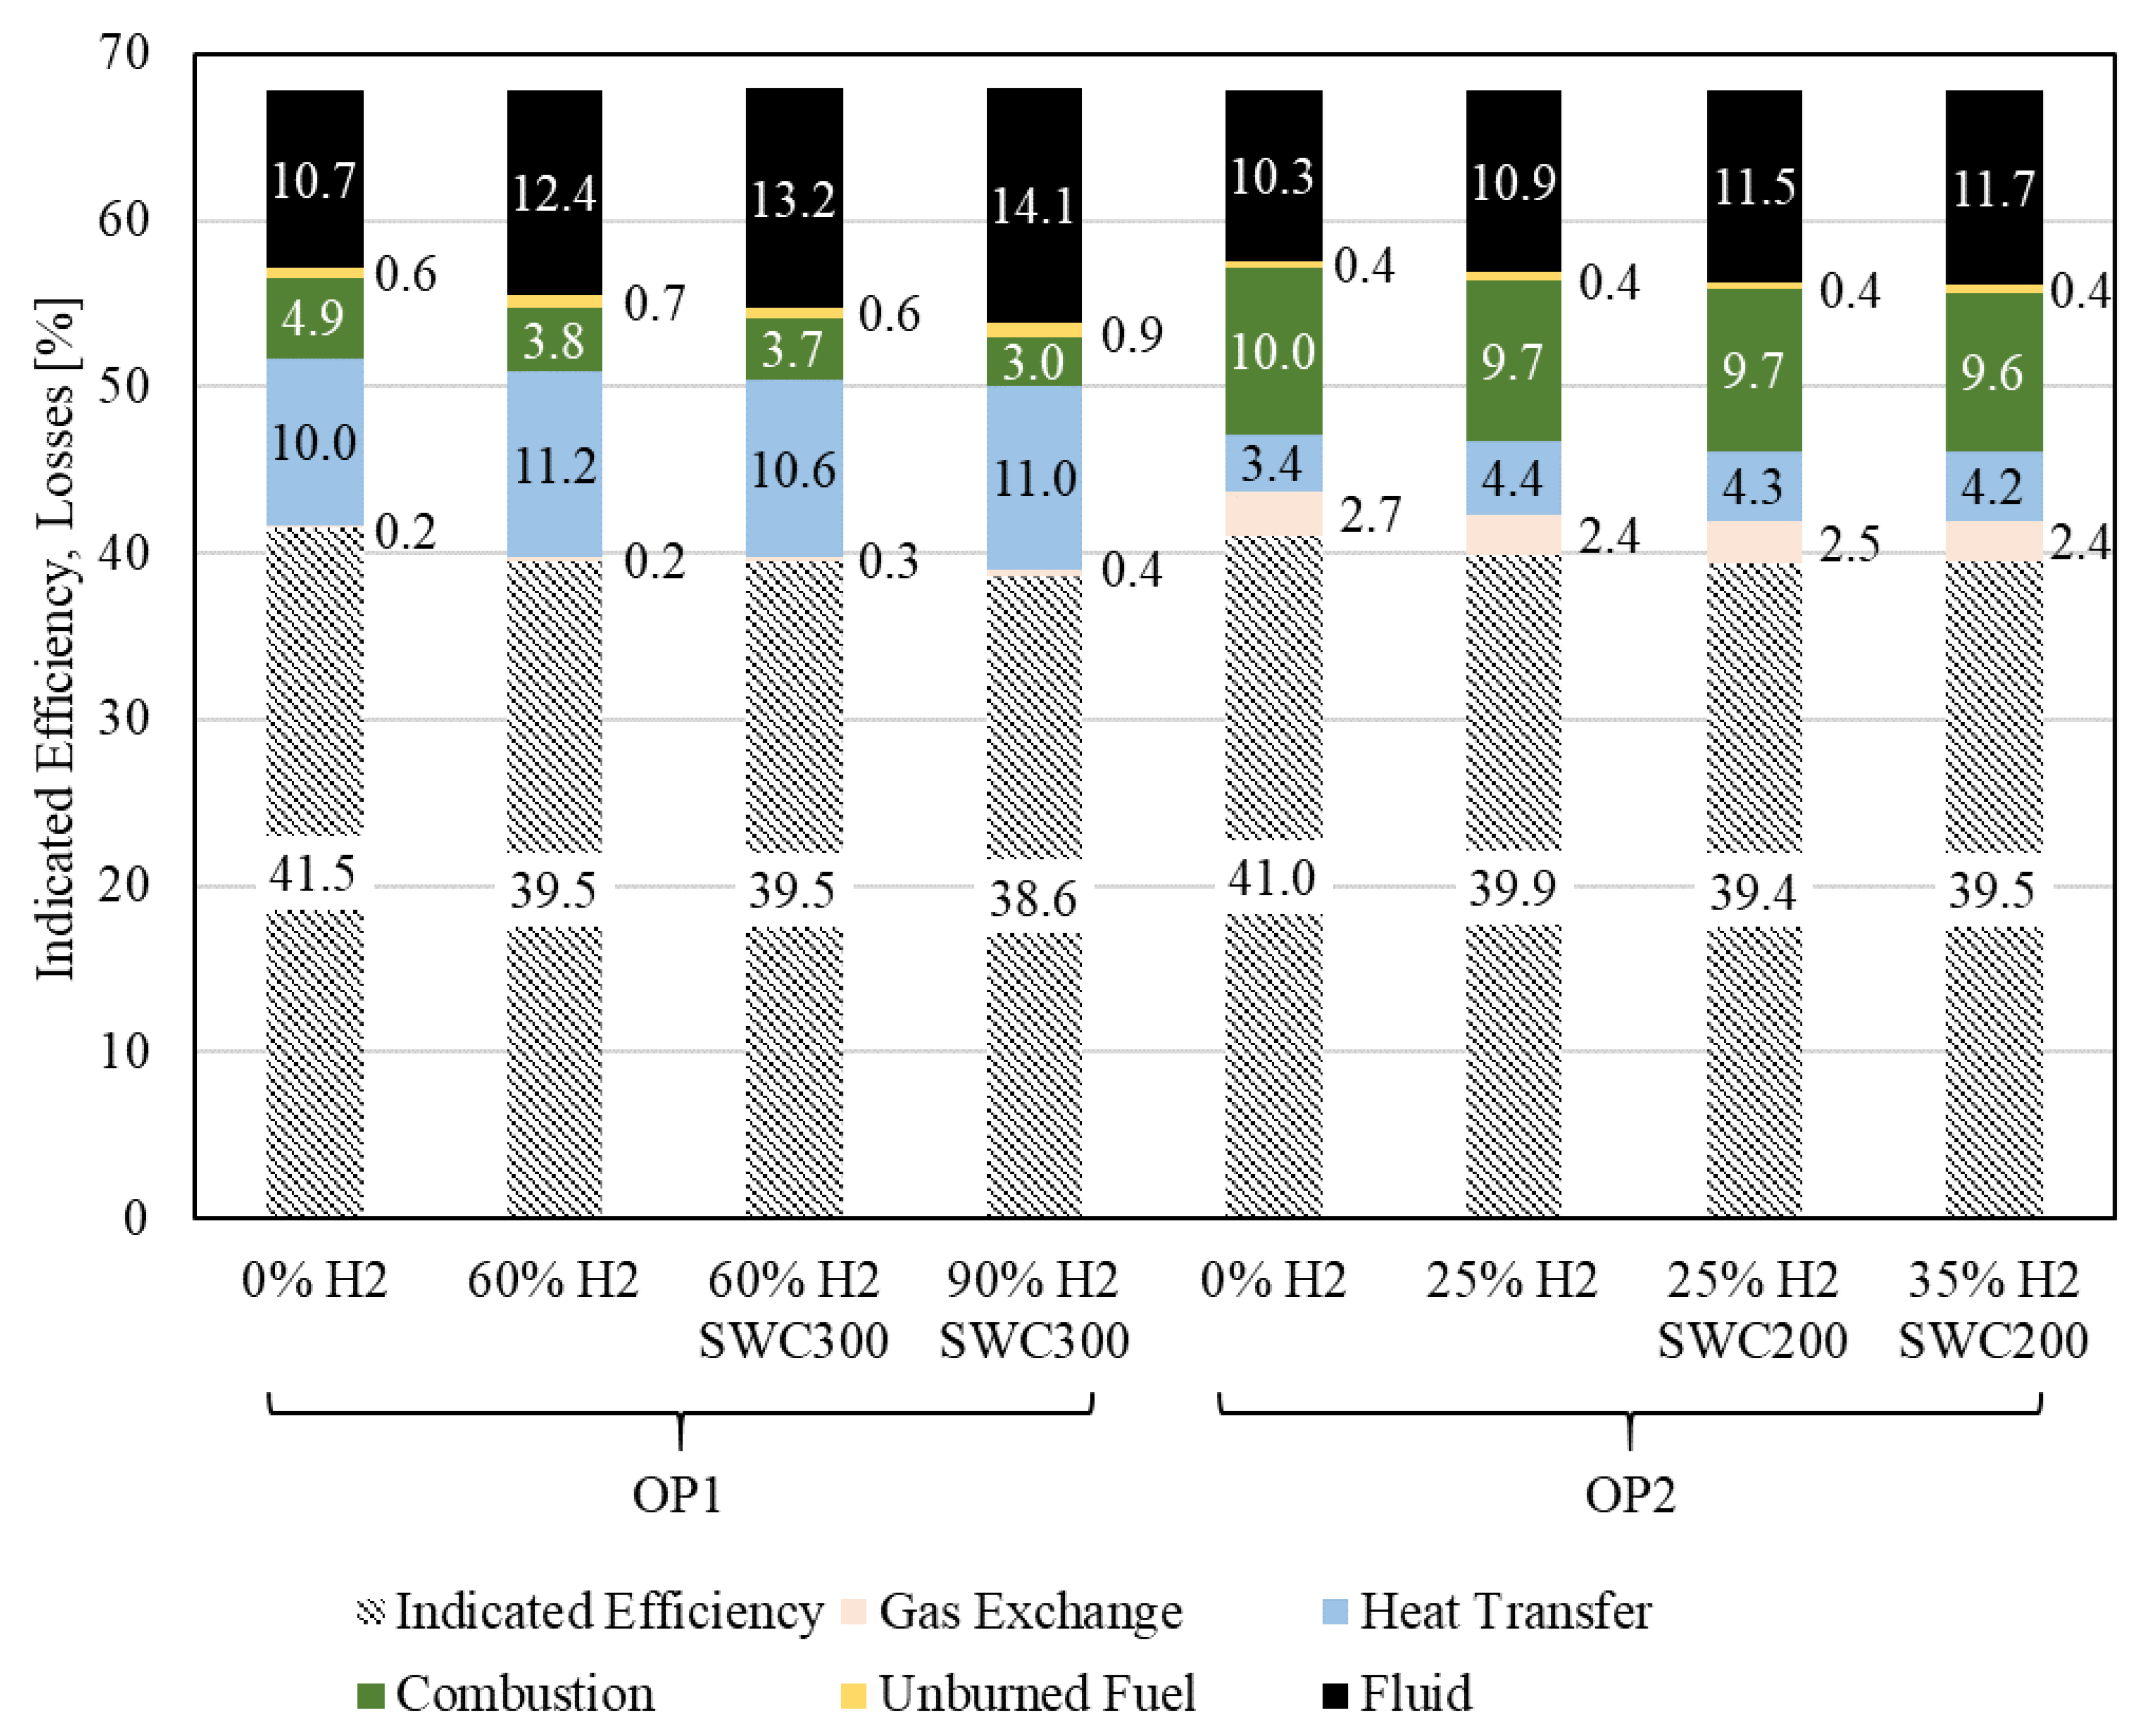
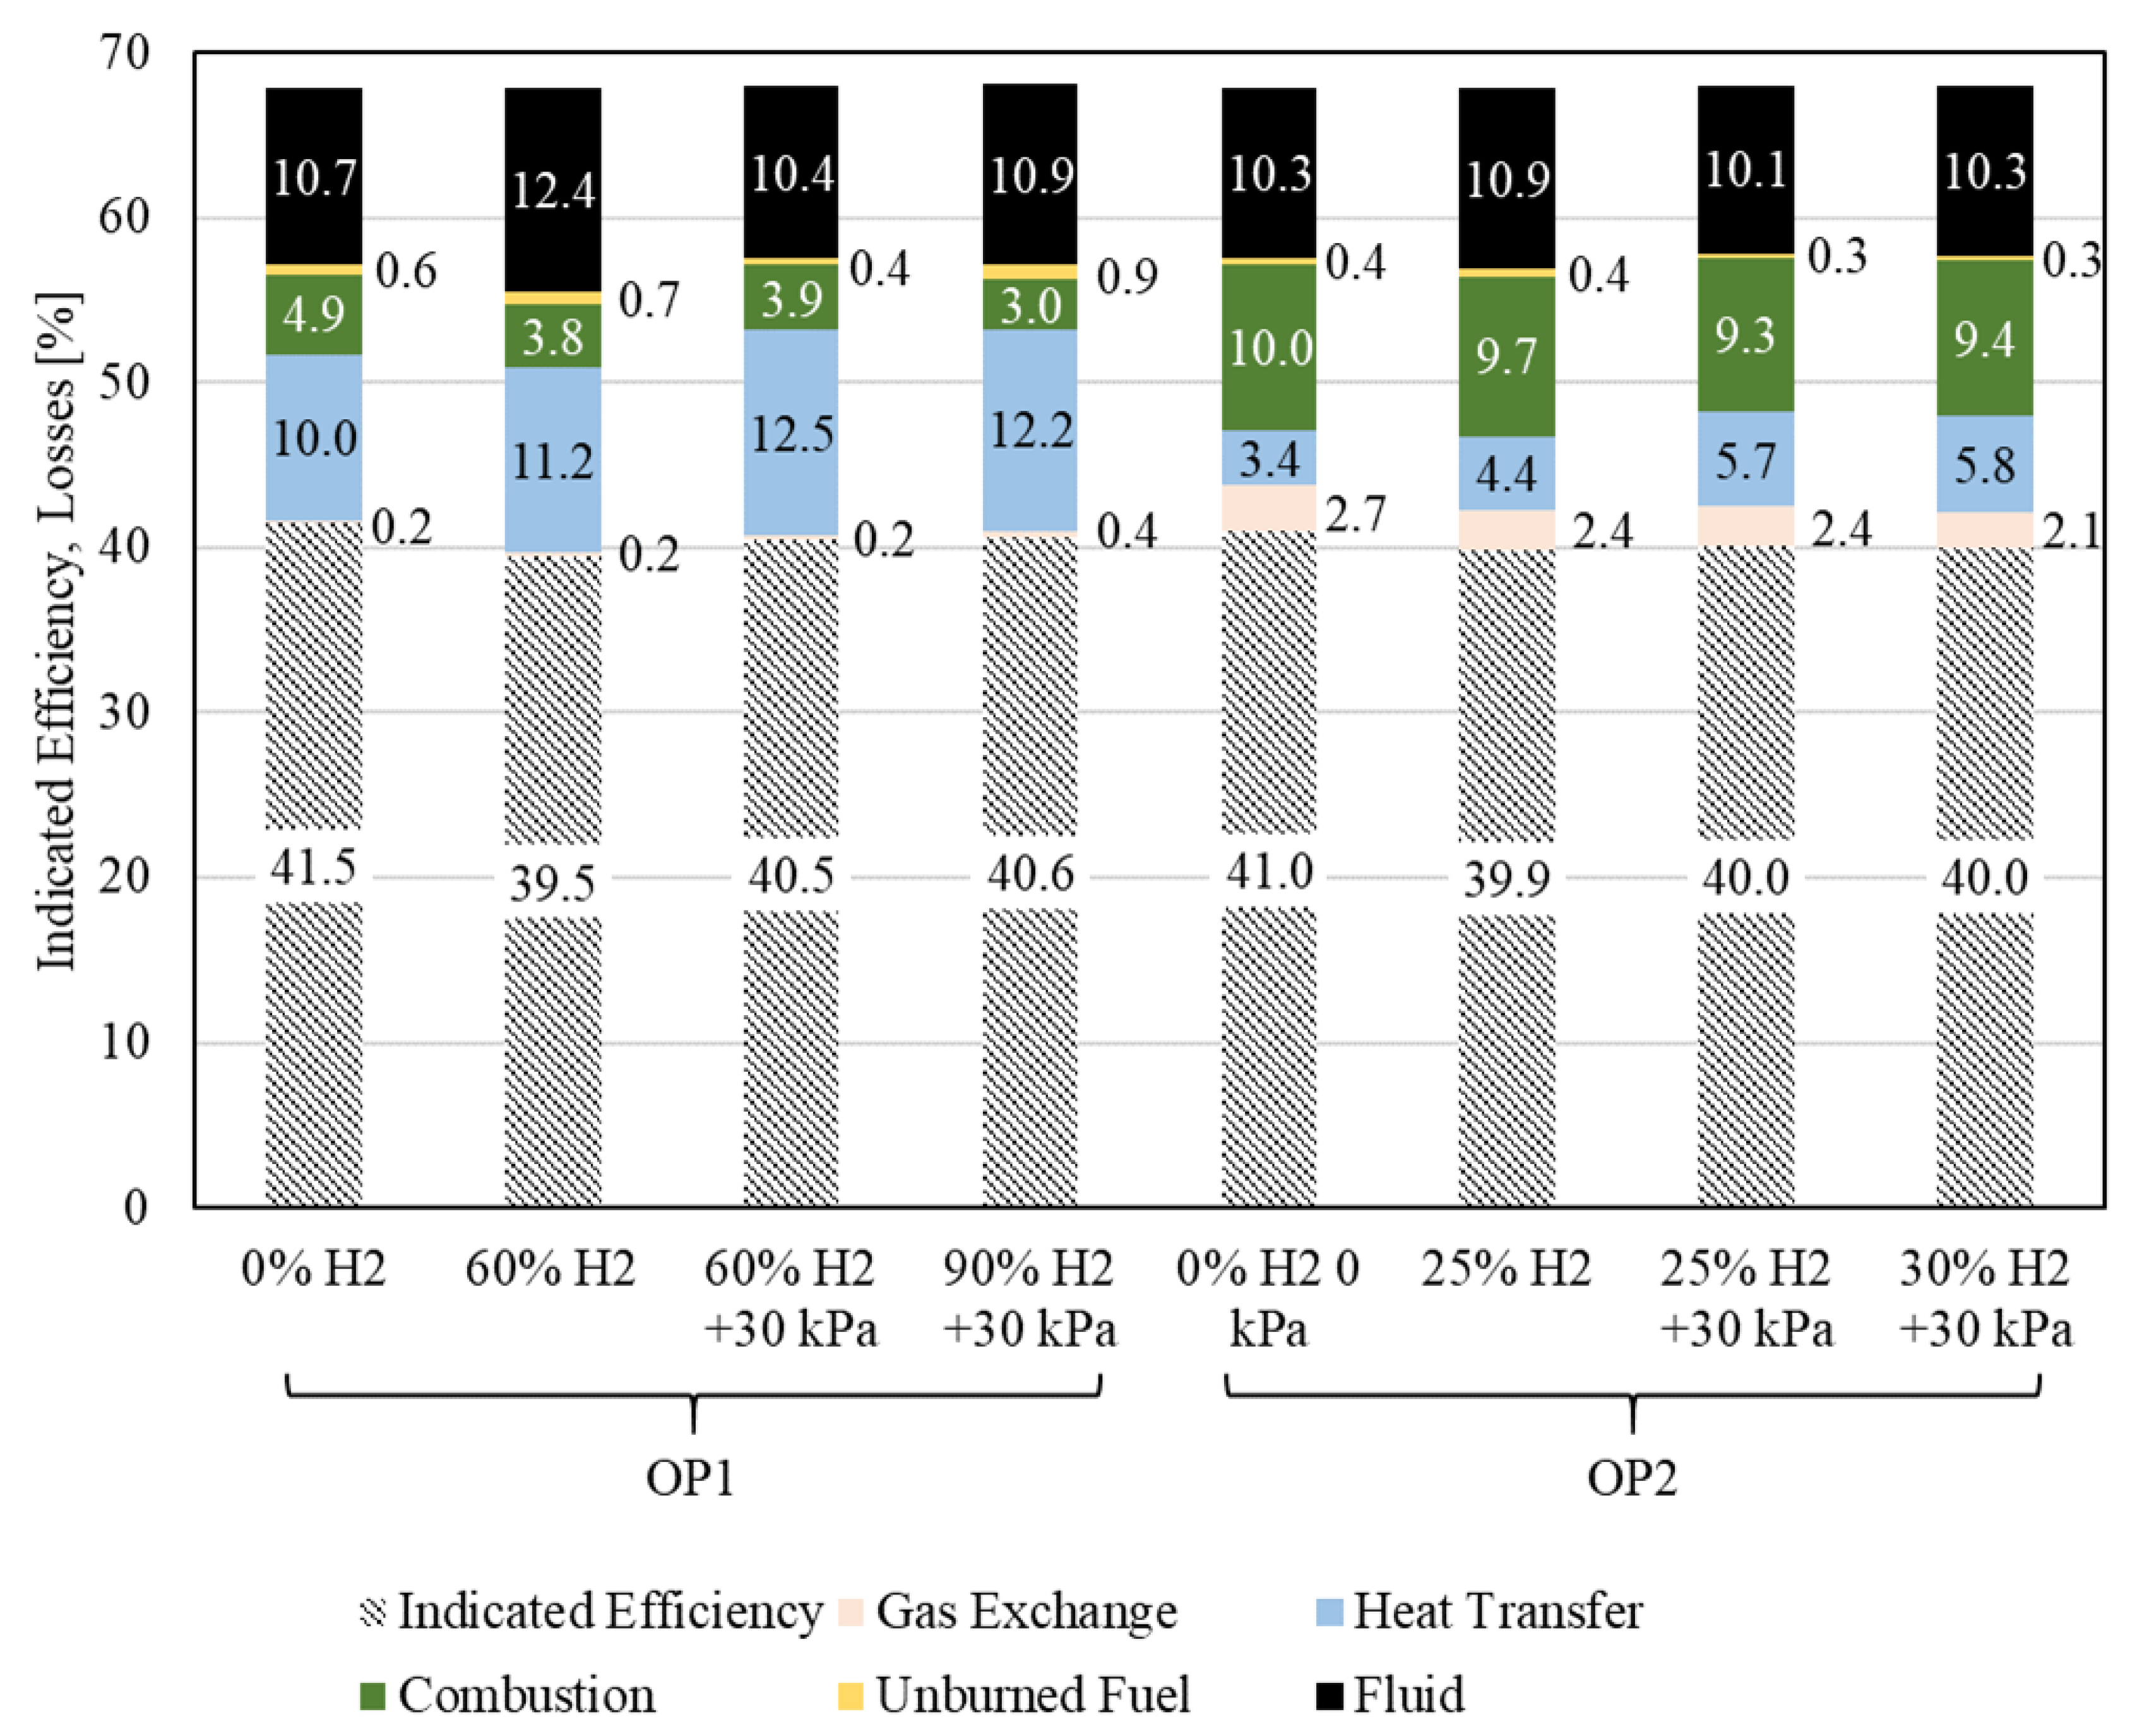
Figure 24 illustrates the loss analysis with a focus on water injection for the two operating points.
The results in
Figure 8 and
Figure 12 can be explained by the increase in fluid losses (higher specific heat capacity of hydrogen compared to air) and wall heat losses (higher laminar flame speeds, which reduce the quenching distance, and the higher adiabatic flame temperatures of hydrogen, as well as the higher thermal conductivity of hydrogen compared to air, as already discussed in previous investigations [
2]) for both operating points, despite the lower combustion losses (shorter combustion duration).
In both operating points, it is evident that fluid losses significantly increase with water injection and further increase with higher hydrogen energy shares. This can be explained by the high specific heat capacity of both fluids and their greater temperature dependency.
Furthermore, the combustion losses show no significant change with water injection. However, at OP1 with 90% H2, the combustion clearly benefits from the rapid flame speed of hydrogen, which results in a shortened combustion duration. Consequently, combustion losses decrease at the highest hydrogen energy share. This is particularly noticeable at OP1 due to the significant increase in H2 in comparison with OP2, which shows only a minor decrease in combustion losses at the highest hydrogen energy share with water injection.
Finally, water injection at both operating points shows reduced wall heat losses. This can be attributed to the lower process temperatures during combustion. With a further increase in the H
2 share alongside water injection, contrasting results are observed between the two operating points. At OP1, wall heat losses continue to increase. However, at OP2, the smaller absolute increase in H
2 and the resulting lower cylinder pressures, as shown in
Section 3.1 and
Figure 10, appear to be the dominant factors, ultimately leading to slightly lower wall heat losses.
Overall, the indicated efficiency decreases at the maximum hydrogen energy share, which is achieved through water injection for both operating points. This reduction is primarily due to the increased fluid losses.
The loss analysis focusing on boost pressure increase is shown in
Figure 25. Regarding fluid losses, it is clear in both operating points that higher boost pressure results in decreased losses. This is due to the higher proportion of air, which leads to a lower specific heat capacity and reduced temperature dependency of the mixture. However, the increased substitution rate enabled by higher boost pressure leads to greater fluid losses associated with hydrogen, as discussed in the previous section.
At the low load point (OP1), there is no noticeable improvement in combustion with increased boost pressure. However, similar to the scenario with water injection at a higher hydrogen rate, the beneficial combustion properties of hydrogen are evident. At the high load point (OP2), an improvement in combustion losses due to boost pressure increase is noticeable. This can be attributed to the slight reduction in combustion duration shown in
Section 3.2. The further increase in hydrogen from 25% to 30% ultimately has a negligible impact on combustion losses.
Finally, in both cases, the wall heat losses are significantly higher with increased boost pressure, which can be attributed to the resulting higher combustion chamber pressures. At OP1, the substantial increase in hydrogen (90%) results in increased wall heat losses, whereas at OP2, the relatively small increase in hydrogen shows no noticeable change in wall heat losses.
In general, increasing the boost pressure results in higher indicated efficiency at both operating points. Unlike water injection, this improvement is chiefly due to reduced fluid losses.
In summary, lean operation with increased boost pressure offers significant efficiency advantages over water injection. In both scenarios, fluid losses are the primary factors affecting efficiency changes—these losses decrease with increased boost pressure and increase with water injection.
5. Conclusions and Outlook
The study explores various combustion process strategies to minimize abnormal combustion, such as preignitions or knocking, with the goal of increasing the hydrogen energy share of a dual-fuel hydrogen kerosene engine. These investigations include the use of water injection (WI) and raising the air–fuel ratio (AFR) by increasing the boost pressure.
In terms of the maximum hydrogen energy share, both investigated strategies lead to significant improvements, whereas water injection has slightly higher benefits at high load. The H2 energy share increased from 60% to 90% for low load (OP1) and from 25% to 35% for high load (OP2) with the addition of water. Increasing the boost pressure results in maximum hydrogen energy shares of up to 90% for OP1 and 30% for OP2, however, this is limited by the maximum allowable pressures.
Nevertheless, regarding NOx emissions, water injection showed significant improvements, especially at high load operation. Only at low load and high hydrogen energy shares were the NOx emissions with increased boost pressure slightly lower. With respect to soot emissions, measured by the filter smoke number (FSN), the increased boost pressure showed clear advantages in comparison to water injection at a high load, while only showing minor improvements at a low load.
A detailed 0D/1D simulation revealed the influence of both water injection and increased boost pressure on the burned zone temperatures, as well as their contribution to the specific heat, trapped mass, and heat capacity. Additionally, an efficiency loss analysis showed the influence of these strategies on the individual losses. The results demonstrated that the fluid losses are responsible for lower efficiencies when using water injection and simultaneously for the higher efficiency at higher boost pressures.
In addition to optimizing single-cylinder performance, the scalability of these strategies must be considered for multi-cylinder and high-power aviation engines. While the fundamental principles remain transferable, factors such as charge distribution, intake resonance effects, and injector design, may impact real-world implementation. Future work should focus on adapting these strategies for full-scale propulsion systems, integrating advanced control methods for knock mitigation and efficiency optimization.


