1. Introduction
In the face of the growing energy demand and the imperative to mitigate climate change, the adoption of renewable energies has become imperative. However, the low energy efficiency and intermittency of renewables restrict their widespread direct usage [
1]. Green hydrogen is acknowledged for its capacity to support sector coupling, providing long-term storage for electricity generated from intermittent renewable sources and facilitating grid balancing [
2,
3]. It is therefore a key element in the stability of tomorrow’s energy mix. The efficient storage and utilisation of renewable energy that would otherwise be wasted are achieved through the conversion of excess electricity into hydrogen. This decouples energy generation from energy consumption by providing a flexible and scalable solution for intermittent renewable energy sources such as solar and wind. Moreover, when hydrogen is used as an energy source, it produces only water vapour as a byproduct, making it a clean and environmentally friendly option. This can help reduce greenhouse gas emissions and mitigate the impact of climate change. Green hydrogen is increasingly gaining global recognition as a clean, carbon-free fuel option that can be used to address climate change challenges [
4,
5].
By promoting the adoption of renewables energies, blending hydrogen into the NG network can contribute to the decarbonization of the energy industry [
6]. This Power-to-Gas (PtG) option has many benefits [
7,
8]. In addition to tackling the large-scale application issue of the usage of hydrogen as an energy source, blending it also addresses the transmission challenge, making it an effective solution for reaching carbon neutrality objectives. Injecting hydrogen into NG pipelines without altering the existing infrastructure has been the subject a substantial amount of research [
9,
10,
11,
12]. Several studies argued that a 20% threshold is technically feasible without significant modifications to the pipeline infrastructure [
13,
14,
15,
16,
17,
18].
Tunisia is particularly well-positioned to take advantage of this technology, as it has an extensive natural gas distribution network that spans both its major cities and industrial hubs. According to the latest report from the national electricity and gas company, STEG, this network is continuously expanding. As of 2020, the gas transportation grid spans 3000 kilometres, while the distribution network covers an extensive 17,000 kilometres. Algerian gas is mainly distributed in the north of the country, and it is mixed with national gas provided by Miskar and Nawara gas fields, to be distributed in the south of Tunisia [
19]. The existing pipelines of the Tunisian natural gas network has several notable benefits. A strong maintenance and control framework, a large capacity, strong security protocols, broad coverage and interconnectivity, efficient network management, and operational strategies are a few of these [
20,
21].
The development of a hydrogen distribution network could be one of the key challenges in creating a hydrogen economy, and Tunisia’s existing NG infrastructure may serve as an effective solution to this issue. The construction of a new pipeline system for the distribution of hydrogen is an expensive and time-consuming endeavour [
13].
To harness renewable energy potential and improve the energy balance, Tunisia’s gas infrastructure investments will focus on creating a low-carbon energy system. This system will integrate renewable electricity and gas networks, facilitating sector coupling via green hydrogen carriers [
22]. Tunisia possesses substantial potential for green hydrogen production, thanks to its renewable energy sources, positioning it to becoming a global producer of this energy vector.
Given the varying pipeline characteristics and natural gas compositions worldwide, it is essential for each country to assess the technical, economic, and regulatory aspects of hydrogen injection into its NG pipelines to ensure safe and efficient operations and identify any potential opportunities or barriers for this technology [
11,
12]. For example, the National Renewable Energy Laboratory (NREL) in the US has reviewed several hydrogen blending studies and found that injecting hydrogen in concentrations of 5–15% by volume is technically feasible with minimal modifications [
13]. Similarly, studies in the UK and Europe have demonstrated the technical feasibility of hydrogen blending in natural gas grids, with some pilot projects, such as HyDeploy in the UK and GRHYD in France, showing that hydrogen blends of up to 20% by volume, without resorting to major changes to appliances and the eventual disruption [
23,
24,
25,
26]. The calculations indicate that achieving a 20% hydrogen blend may prevent 6 million tonnes of CO
2 emissions annually.
The blending of hydrogen into NG can affect combustion characteristics. The presence of hydrogen in NG mixtures result in higher combustion temperatures and consequent high pressures result in increased NOx emissions and knocking [
27,
28]. An increase of 5% in laminar flame speed is observed in mixture with 20% hydrogen and 80% methane [
29]. This effect is more pronounced in turbulent flame speed in gas turbines where the increase is documented at 20% with similar concentration of hydrogen [
30]. Additionally, as natural gas-powered internal combustion engines (ICEs) are commonly used in power plants and vehicles, blending hydrogen with NG can also impact the performance of such equipment. These effects need to be assessed carefully to ensure the performance of engines and other gas appliances.
This research aims to determine the optimal blending ratio of green hydrogen into NG in Tunisia, through the application of and the comparison between various interchangeability methods. Our investigative efforts are underpinned by a meticulous analysis of the existing natural gas compositions distributed throughout Tunisia. This work serves as a foundational pillar for establishing a well-informed and effective framework for the blending of green hydrogen with natural gas within the Tunisian energy landscape.
2. Gas Properties
In this paper, we study the natural gas types predominantly used in Tunisia: Miskar natural gas (MNG) and Algerian natural gas (ANG). The volumetric compositions of the main constituents of both gases are presented in
Table 1. Some characteristics and combustion parameters of the studied natural gases are provided in
Table 2. All volumetric quantities are expressed in units of energy per “normal cubic metre” (denoted Nm
3). The volume is given for a temperature of 0 °C and a pressure of 1 atmosphere). Volume at 15 °C are obtained using the following formula: 1 m
3 = 0.944 Nm
3.
3. HHV and Wobbe Index
The first gas mixture property is the higher heating value (HHV), a measure of the amount of thermal energy produced by the complete combustion of a fuel. The HHV considers the latent heat of vaporisation of water in the form of vapour present in the combustion products. The HHV of the gas mixture is as follows:
where
x% is the volumetric percentage of hydrogen in the gas mixture.
HHVNG and
HHVH2 are the HHV of natural gas and hydrogen, respectively. The heating value can be considered to estimate the efficiency of the fuel; however, this property is not the most important parameter in practical combustion applications [
31].
The second gas mixture property is the Wobbe Index (
WI). All gases that have the same WI will supply the same amount of energy. In this way, the WI is a simple indicator that provides a good generic description of interchangeability [
31,
32]:
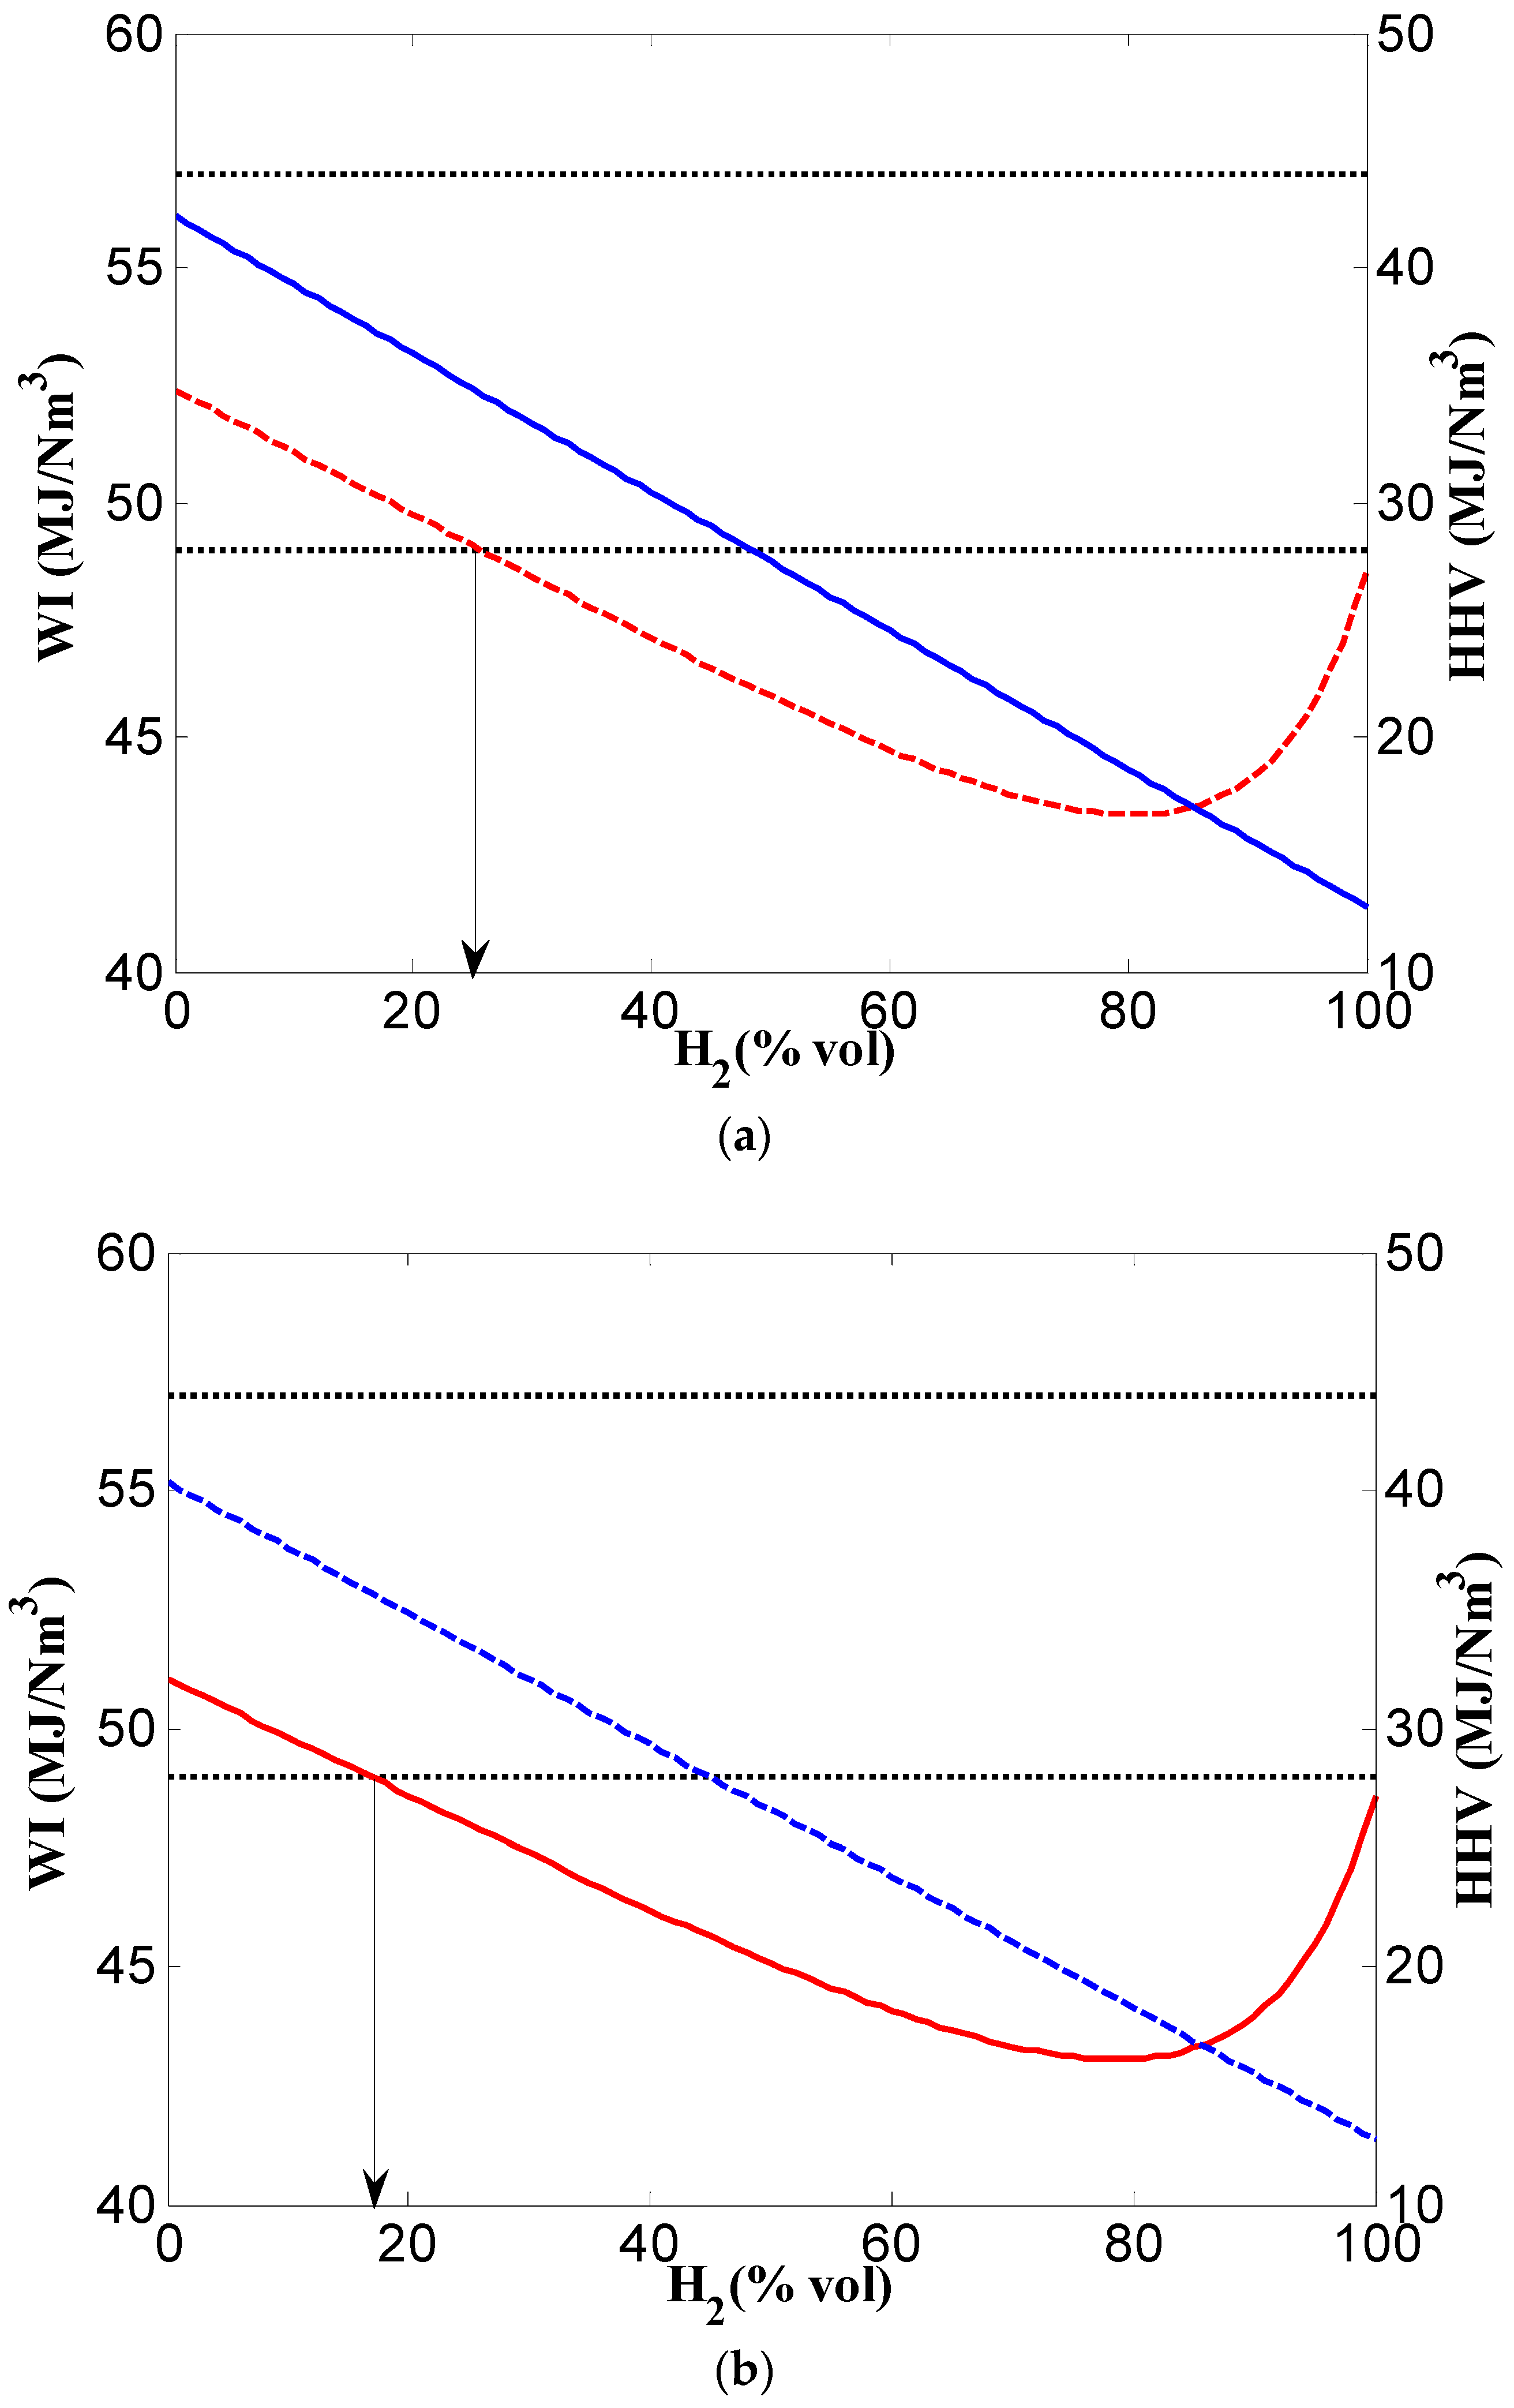
The heating value and Wobbe Index are plotted in
Figure 1. The solid and dashed lines represent the gas mixture properties (Wobbe Index and higher heating value). The upper and lower dotted lines indicate the Wobbe Index range (49 MJ/Nm
3–57 MJ/Nm
3) proposed by EASEE-gas, which represents the entire gas value chain in Europe [
33]. The lower limit is set to prevent potential flame blow-off in unblended natural gas, but it can be lowered further due to the flame-stabilising effect of hydrogen enrichment.
Hydrogen blending causes a decrease in both the higher heating value (HHV) and the Wobbe Index (WI). The HHV follows a linear trend with a negative slope of −0.28 MJ/Nm3 and −0.3 MJ/Nm3 for MNG and ANG, respectively, highlighting the trade-off between energy content and hydrogen content in the gas mixture.
However, the Wobbe Index decreases with increasing hydrogen content, reaching a minimum at 85 vol% hydrogen, after which it begins to increase. Due to this nonlinear behaviour, pure hydrogen has the same Wobbe Index as mixtures containing 30% hydrogen in ANG and 20% hydrogen in MNG, respectively. The addition of hydrogen up to 26 vol% in ANG and up to 18 vol% in MNG remains within acceptable limits. The results for ANG are consistent with those reported by Franco et al. [
34].
The Wobbe Index was prioritised as the most robust single parameter. Setting a maximum Wobbe Index can generally mitigate combustion issues such as yellow tipping, incomplete combustion, and the risk of elevated NOx and CO emissions. Conversely, establishing a minimum Wobbe Index helps prevent phenomena like flame lifting, blowout, and CO production. However, both laboratory tests and combustion theory have demonstrated that relying solely on a maximum Wobbe Index is insufficient to fully prevent incomplete combustion across different gas compositions [
35,
36].
The Wobbe Index provides a reliable and straightforward measure of gas interchangeability, making it widely used and easy to apply. However, it may not fully account for certain interchangeability challenges, particularly with some burner types. While the Wobbe Index remains the most commonly accepted parameter for evaluating interchangeability, various other parameters are utilised globally. In many cases, multiple indices are employed to define maximum and minimum thresholds, creating an “envelope” of acceptable operating conditions for downstream plants and equipment [
37]. Various multi-index methods are analysed in the upcoming sections.
4. Dutton Factors
This technique is primarily used for natural gases, although it also works with similar mixtures and gases containing hydrogen, but it simplifies the natural gas intro three component: methane, propane (representing heavy hydrocarbons) and nitrogen (representing inert). Calculating the following additional interchangeability parameters is necessary for the Dutton’s method: incomplete combustion factor, Sooting Index, and flame lift [
32,
37].
4.1. Incomplete Combustion Factor ()
The number of times the CO/CO
2 ratio of NG must be doubled to match that of the weighted alternative gas is indicated by the
factor. The following is a mathematical expression of the incomplete combustion factor [
38]:
where WI is the Wobbe index, MJ/m
3,
ΩH2 indicates the volume proportion of hydrogen in the gas and
EPN stands for the volume fraction of nitrogen and propane (C
3H
8+N
2) in the stoichiometric mixture. For details concerning
EPN, see [
39] for an example.
Currently, the Gas Safety (Management) Regulations (GS(M)R) [
37], applicable in the UK, mandate that the index
must be lower than 0.48, with an upper limit of 1.48, to prevent incomplete combustion. If natural gas mixtures significantly exceed this limit, C
xH
y emissions will be released into the atmosphere, and the operational efficiency of combustion equipment will decrease.
Figure 2a presents the results of the calculations for this factor using Equation (3) for natural gas mixtures with varying hydrogen content. The calculations indicate that an increase in hydrogen content reduces both the hydrocarbon content in the mixture and the
factor, both of which help to prevent incomplete combustion. As a result, natural gases and their hydrogen-containing mixtures are interchangeable at any hydrogen content in terms of the incomplete combustion factor.
4.2. Lift Index ()
The LI index can be used to forecast a fuel gas propensity for flame lift. The
index can be calculated by the empirical relationship’s [
20,
31,
39]:
The lift index assesses interchangeability in terms of combustion stability, specifically related to flame detachment from the burner’s base and the light-back phenomenon. Its optimal value ranges from 0 to 6. When is zero, there is no visible detachment of the flame base from the burner, whereas the lifting happens at values higher than 6.
The results of
index calculations under Equation (4) are shown in
Figure 2b. The indicator is not critical until the plots intersect with the x-axis (
), which corresponds to a hydrogen content of approximately 36% for both ANG and MNG.
4.3. Soot Index ()
The Dutton’s Soot Index
evaluates the likelihood of soot particles forming and turning the flame yellow. Dutton employed radiant gas fires as a test appliance to investigate sooting.
values can be derived from the following equation [
20,
31,
39]:
Plots of the
index calculations under Equation (5) are given in
Figure 2c and the results are conformed to the UK GS (M) R guideline (
) which means that there is no danger of sooting for the substitute gas enriched with hydrogen. According to Dutton’s criteria, up to a 36% vol hydrogen concentration, natural gas, and its mixture can be substituted with its hydrogen mixture.
5. Delbourg Method (Used in Europe)
The Delbourg diagram is used to demonstrate identical heat input, effective combustion, and flame stability after the interchange of two fuels. Burners and combustion equipment used in Europe are represented in this type of diagram. An inherent advantage of this graphical method is that they indicate the degree of potential interchangeability by referring to the location of a point for the substitute gas relative to boundary lines.
The combustion potential (CP) and the corrected Wobbe Index values (
WI′) are the evaluation factors. The basic Wobbe number is directly used to calculate the corrected Wobbe number, as shown in [
31]:
Two factors,
K1 and
K2, are used to adjust the
WI values. The first factor accounts for the total heat of combustion of hydrocarbons, which constitute a larger portion of the process gas than methane; the second factor considers both the heat of combustion and the concentrations of CO, CO₂, and O₂. The graphic dependence of K
1 and K
2 on given parameters can be found, for example, in [
31]. Natural gas and hydrogen differ not only in heating value but also in flame velocity. This is why two indices are needed to represent the two uncorrelated properties of these fuel gases [
40].
The stability and speed of combustion (i.e., flame lifting and flame flashback) are associated with the combustion potential parameter (
CP). The evaluated gas type, as well as the composition and relative specific weight of the tested gas, all influence the final CP value. The following provides the mathematical expression of CP [
31]:
where
,
,
, and
are the content of each combustible constituent (in %) (i: all hydrocarbons except CH
4),
is the correction factor of individual hydrocarbons, and
and
are the gas type factors. The necessary values for all factors are given in [
32].
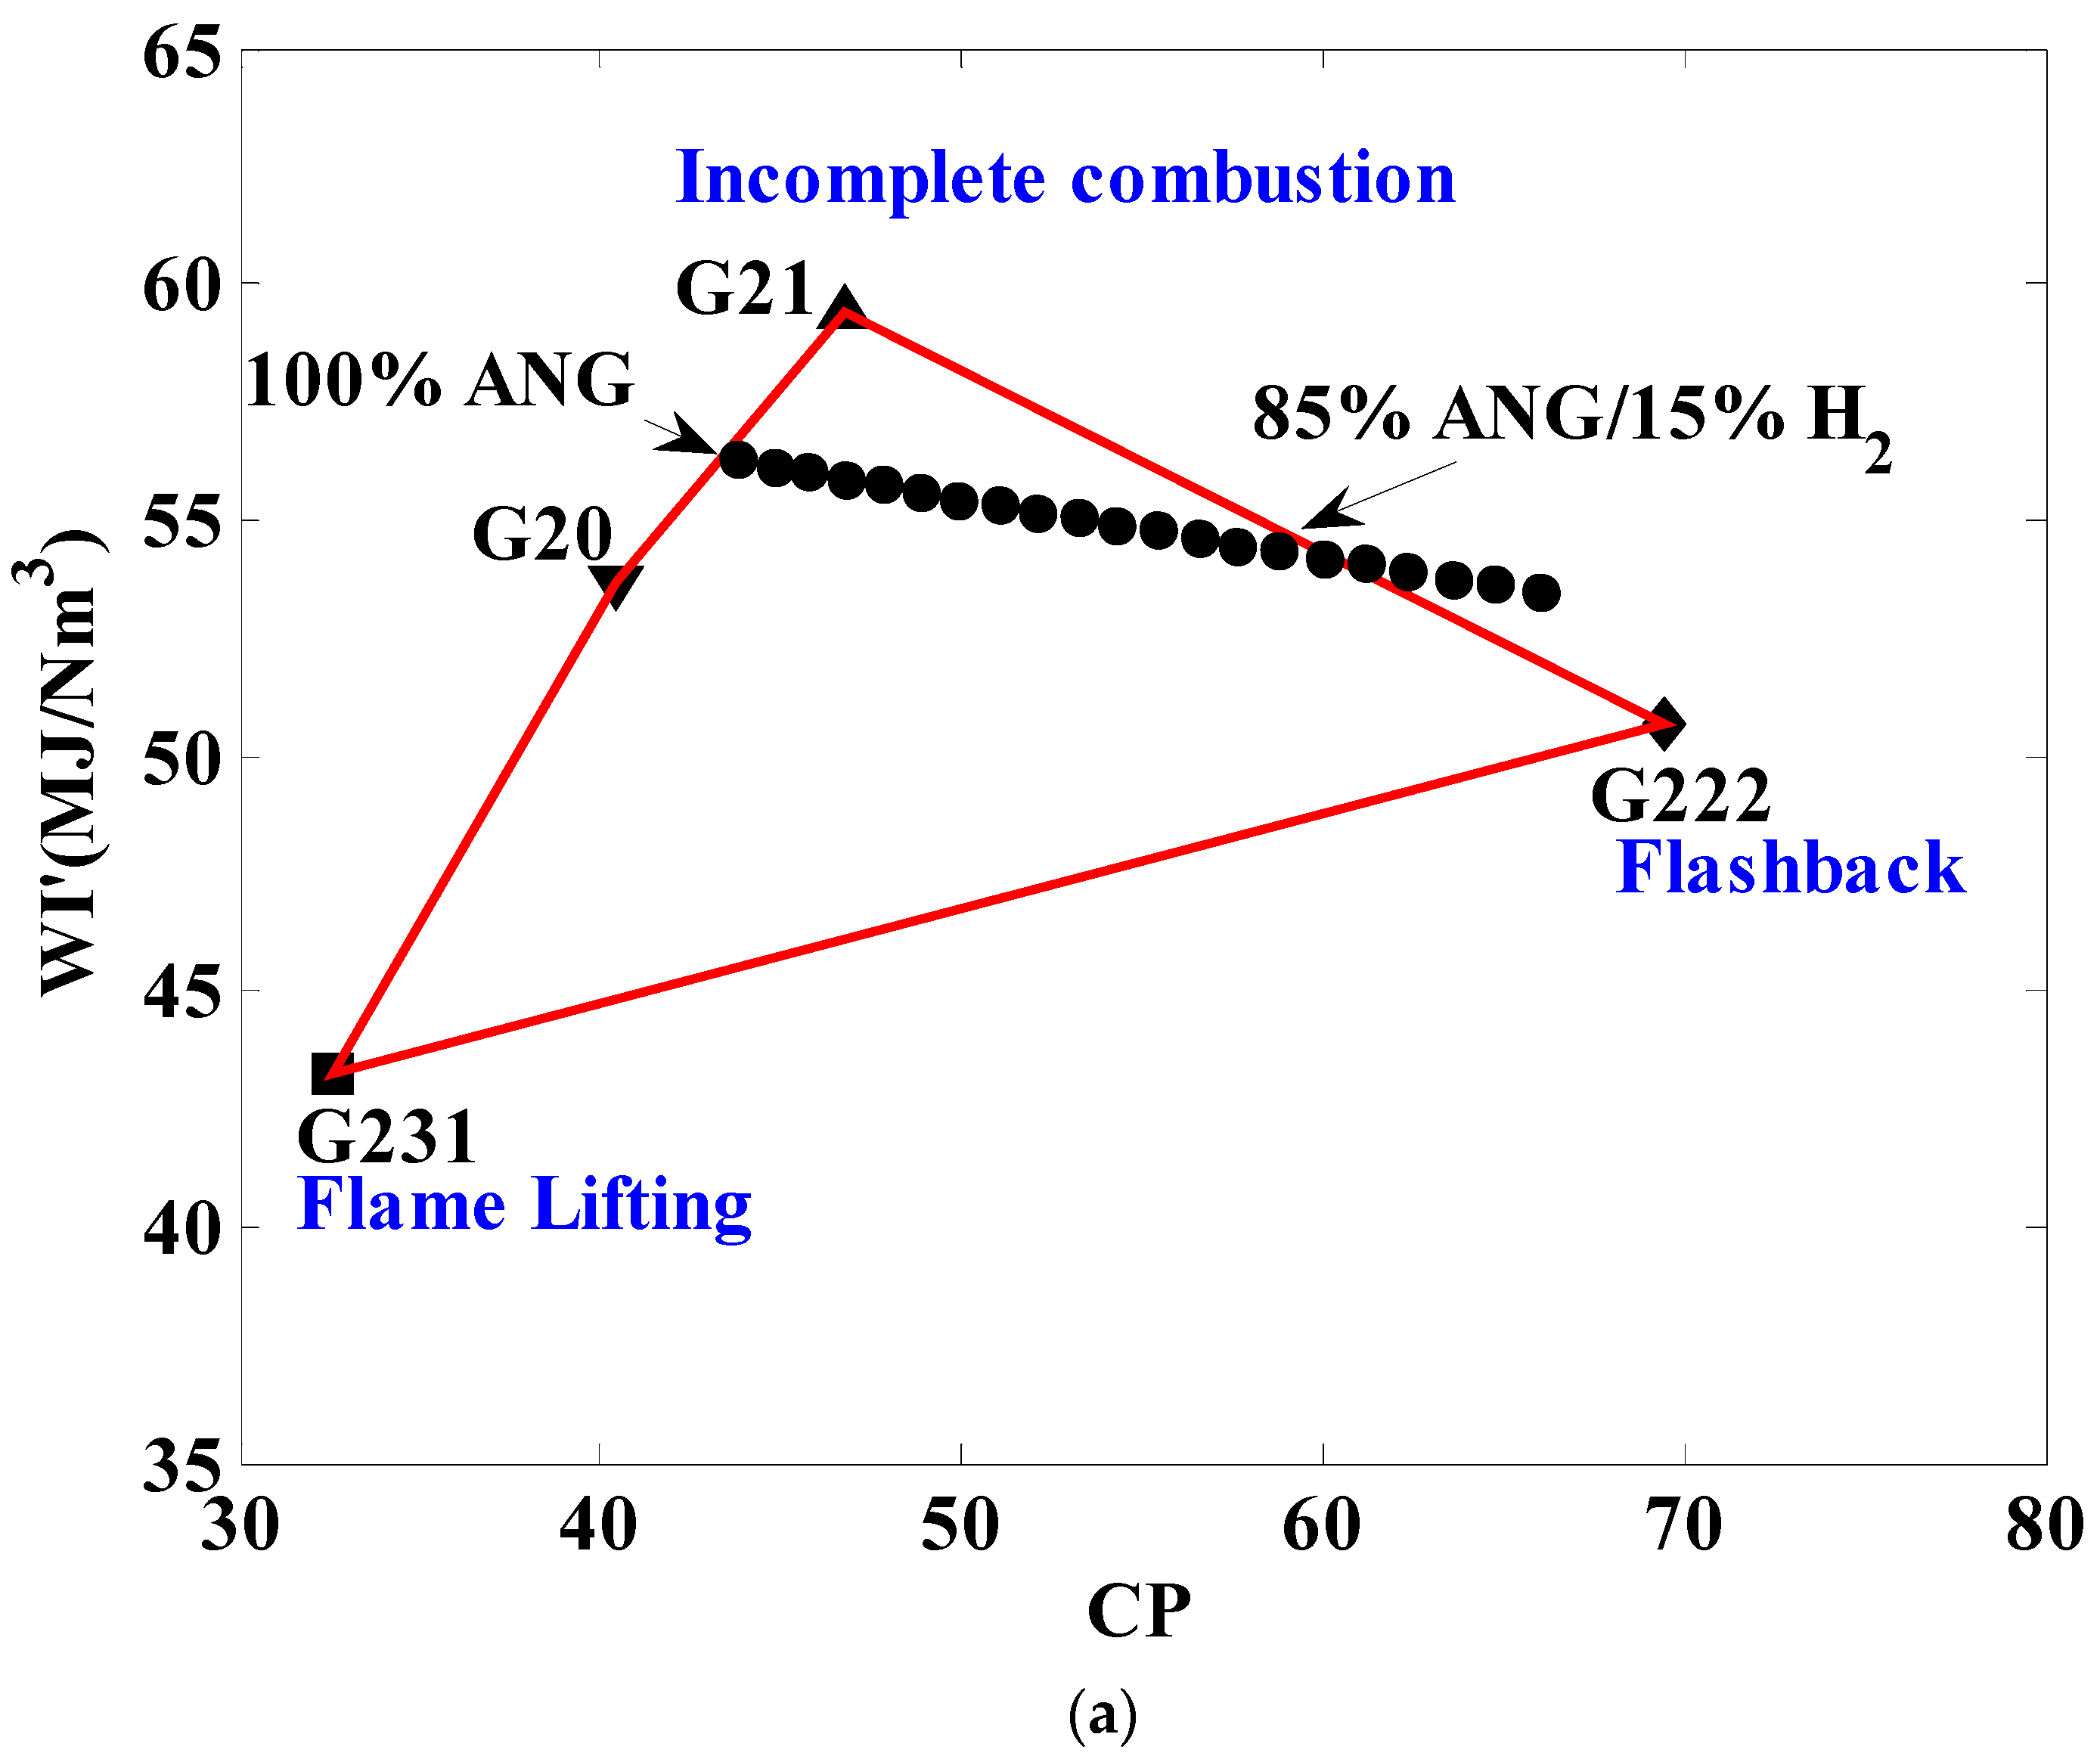
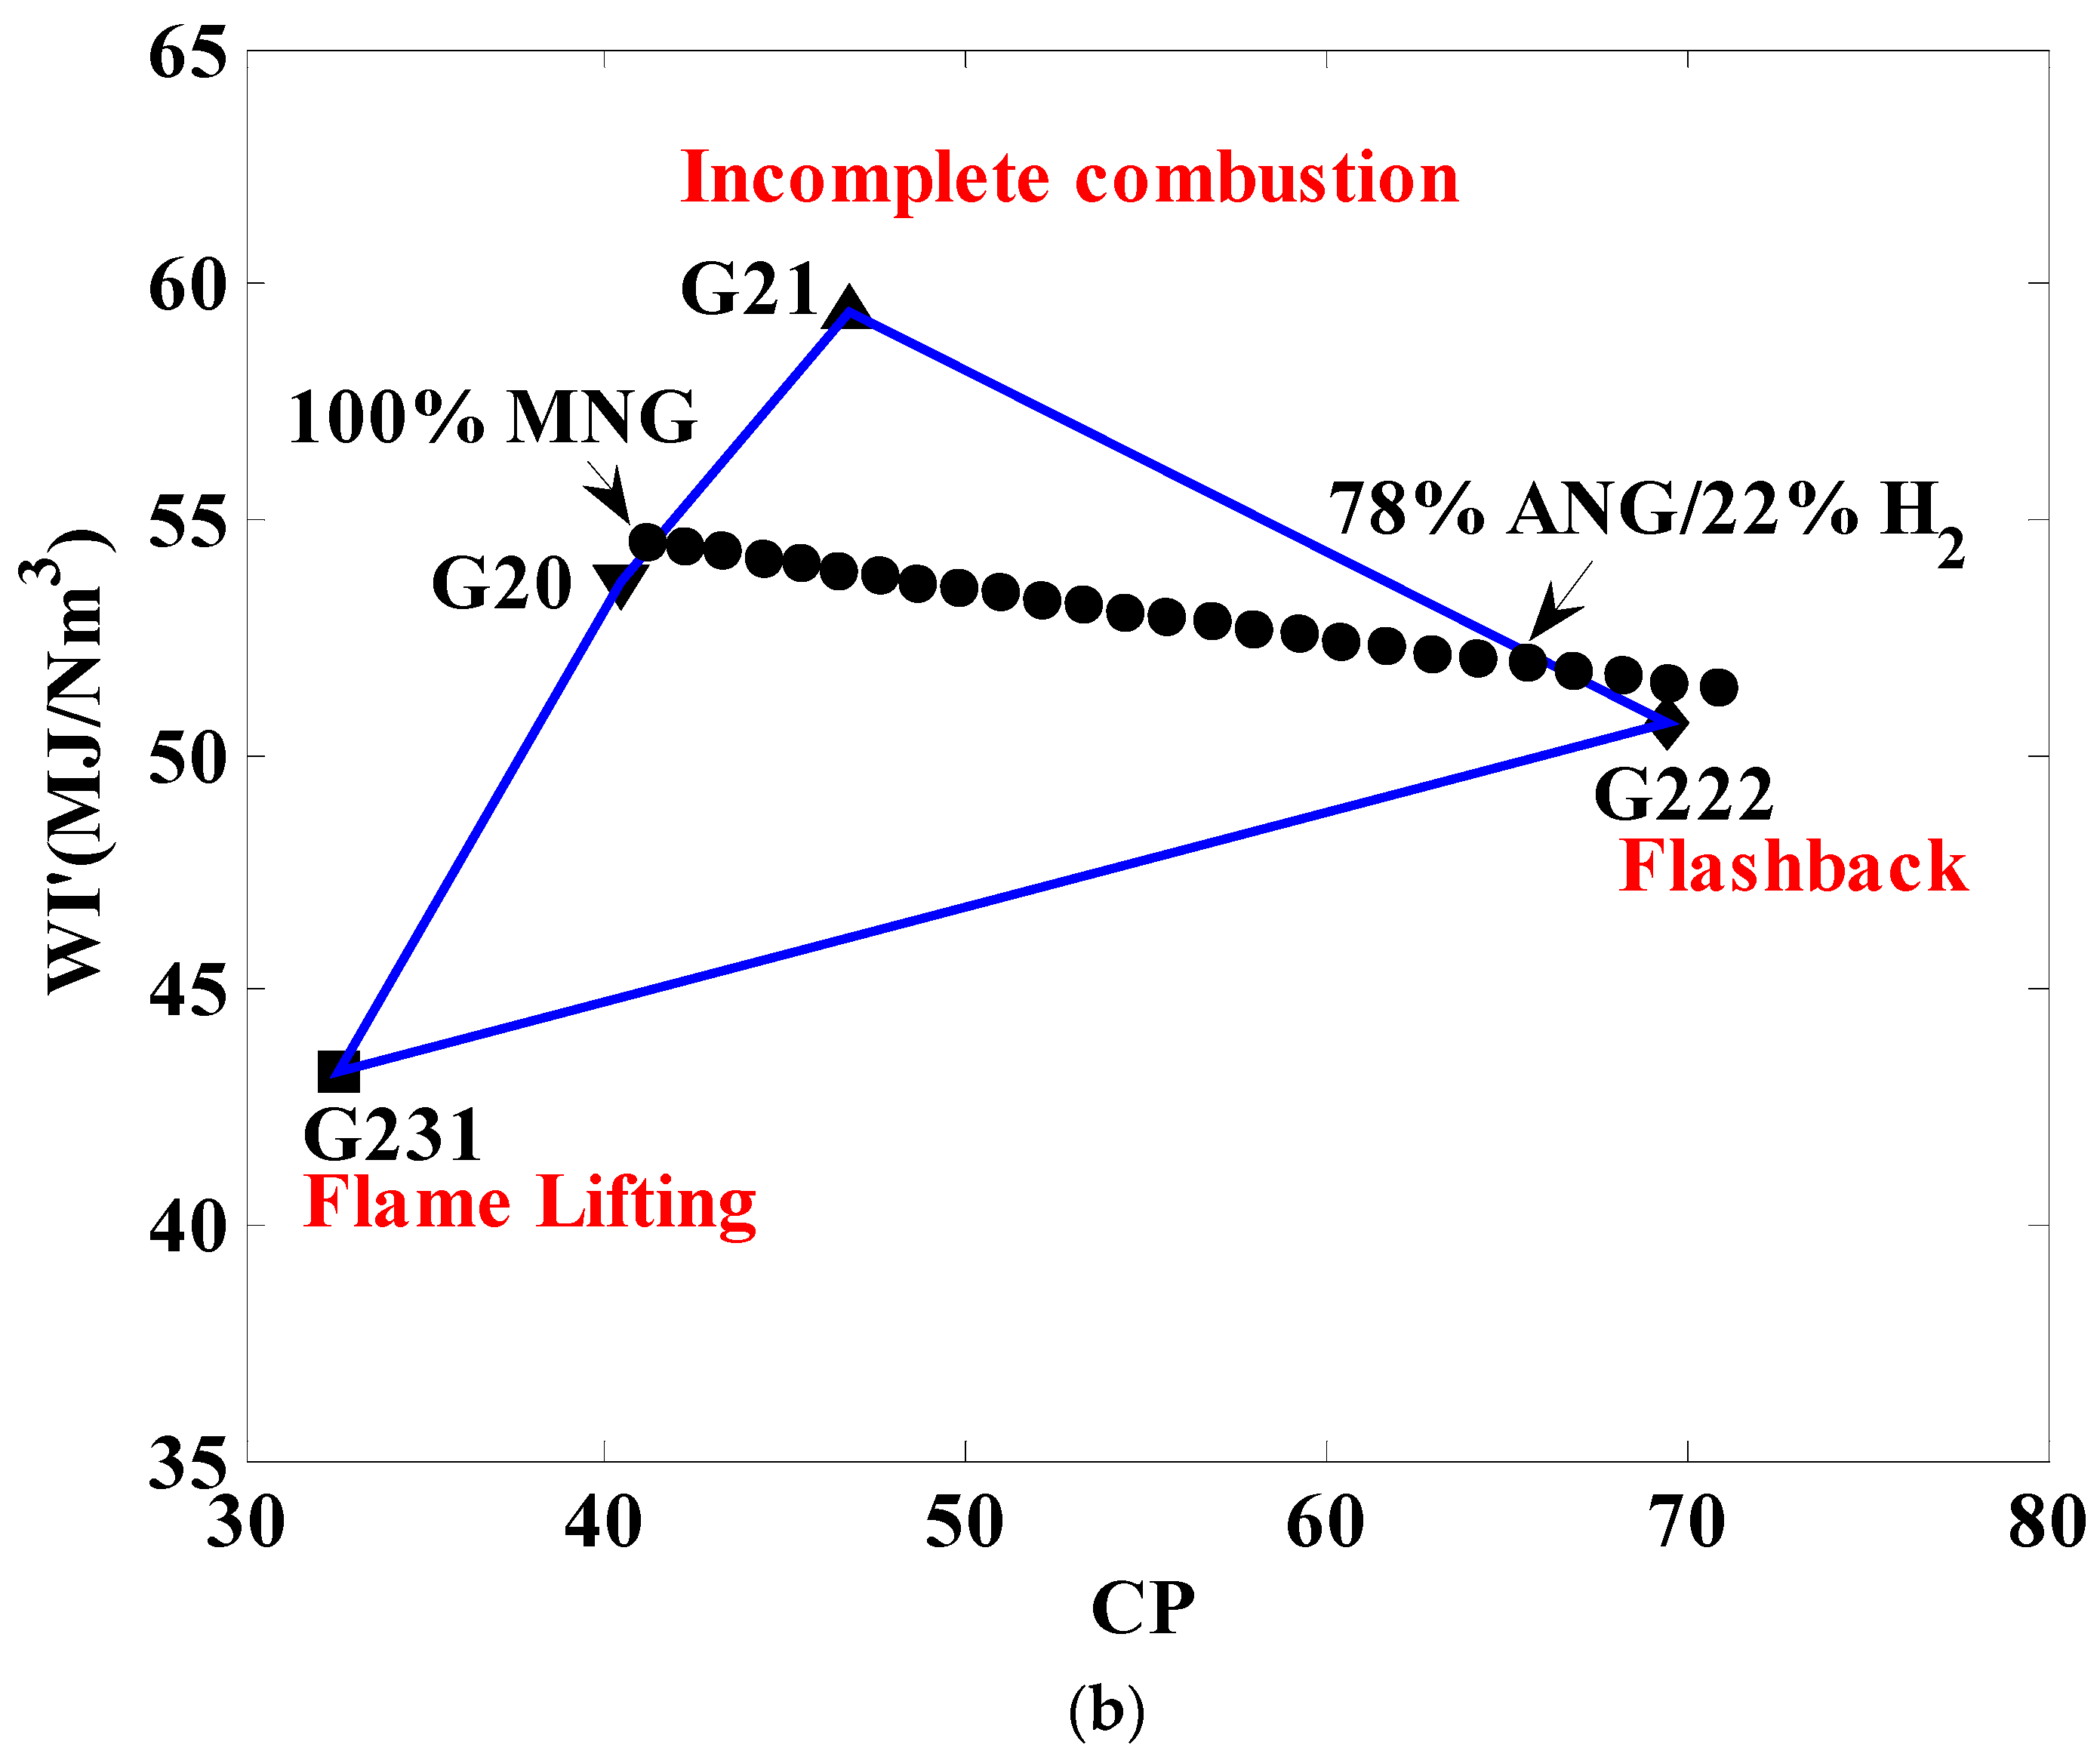
The corrected Wobbe Index variations as a function of combustion potential are plotted in
Figure 3. In accordance with EN 437, four patterns representing the various reference gases (G20, G21, G222, and G231) used for gas quality and appliance requirements are also included in the graph to define the line-demarcated boundaries of the interchangeability area. Each mixture, with an x% hydrogen content, is represented as a point on the diagram. If the calculated coordinate value of the substitute gas falls within this area, the gas is classified as interchangeable with the base gas (100% NG). The reference gases characteristics, including composition, Wobbe Index (WI), combustion potential (CP), and tested limits, are detailed in
Table 3.
An analysis of the diagrams reveals that an increase in hydrogen concentration triggers a rise in combustion potential, causing the characteristic mixture point to shift to the right side of the diagram. This implies a higher risk of flame flashback when the characteristic point lies outside the interchangeability borders. Therefore, the maximum allowable hydrogen blending content is 15% for ANG and 22% for MNG. These values provide insight into the maximum hydrogen concentration that can be injected without requiring changes to burner equipment.
6. Weaver Method (Used in the USA)
The Weaver indices are a set of non-dimensional indices that assess the potential for interchangeability in a more complex and comprehensive context. The principles of the Weaver method are based on empirically derived indices that primarily incorporate the flame speed parameter [
41]. The Weaver method gives an accurate description of incomplete combustion, lifting, and yellow tipping in partially premixed Bunsen-types burners.
Table 4 presents the calculation formulas and limit values for the six Weaver indices, which impact flame stability and the effectiveness of the combustion process. These relationships are derived from tests on low-pressure gas burners. A detailed description of Weaver’s indices can be found in references [
40,
41,
42], among others.
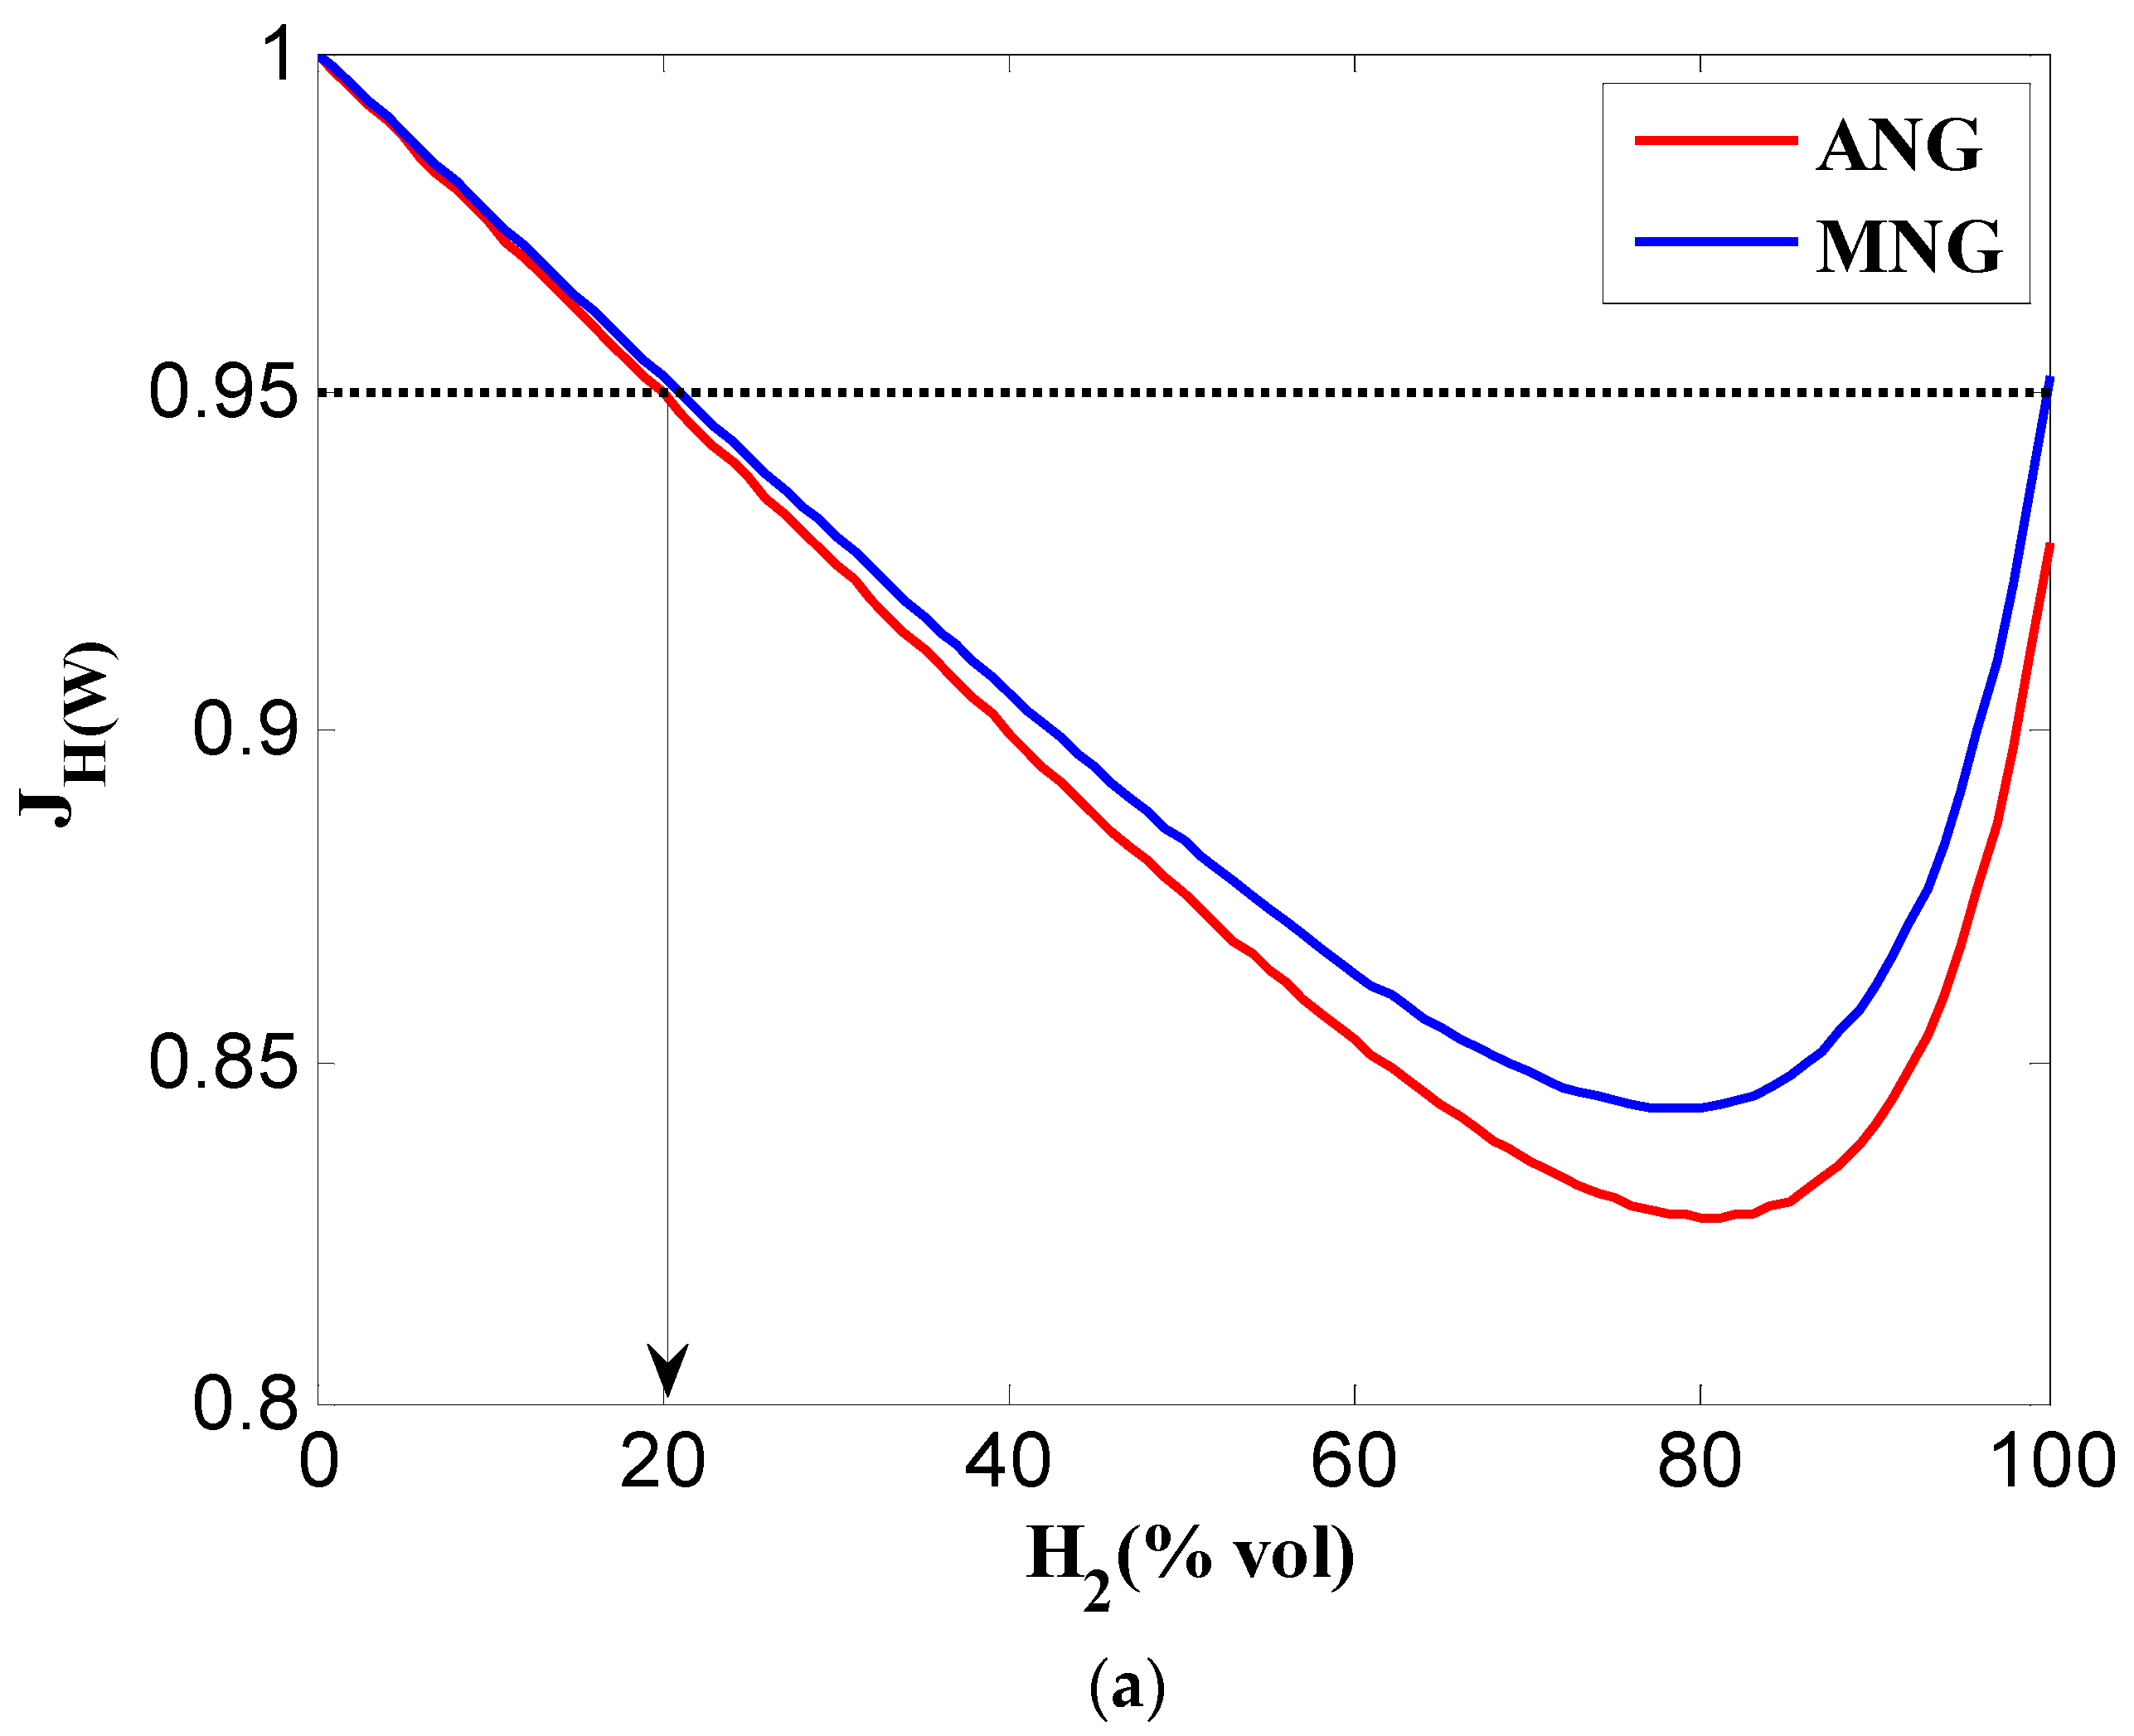
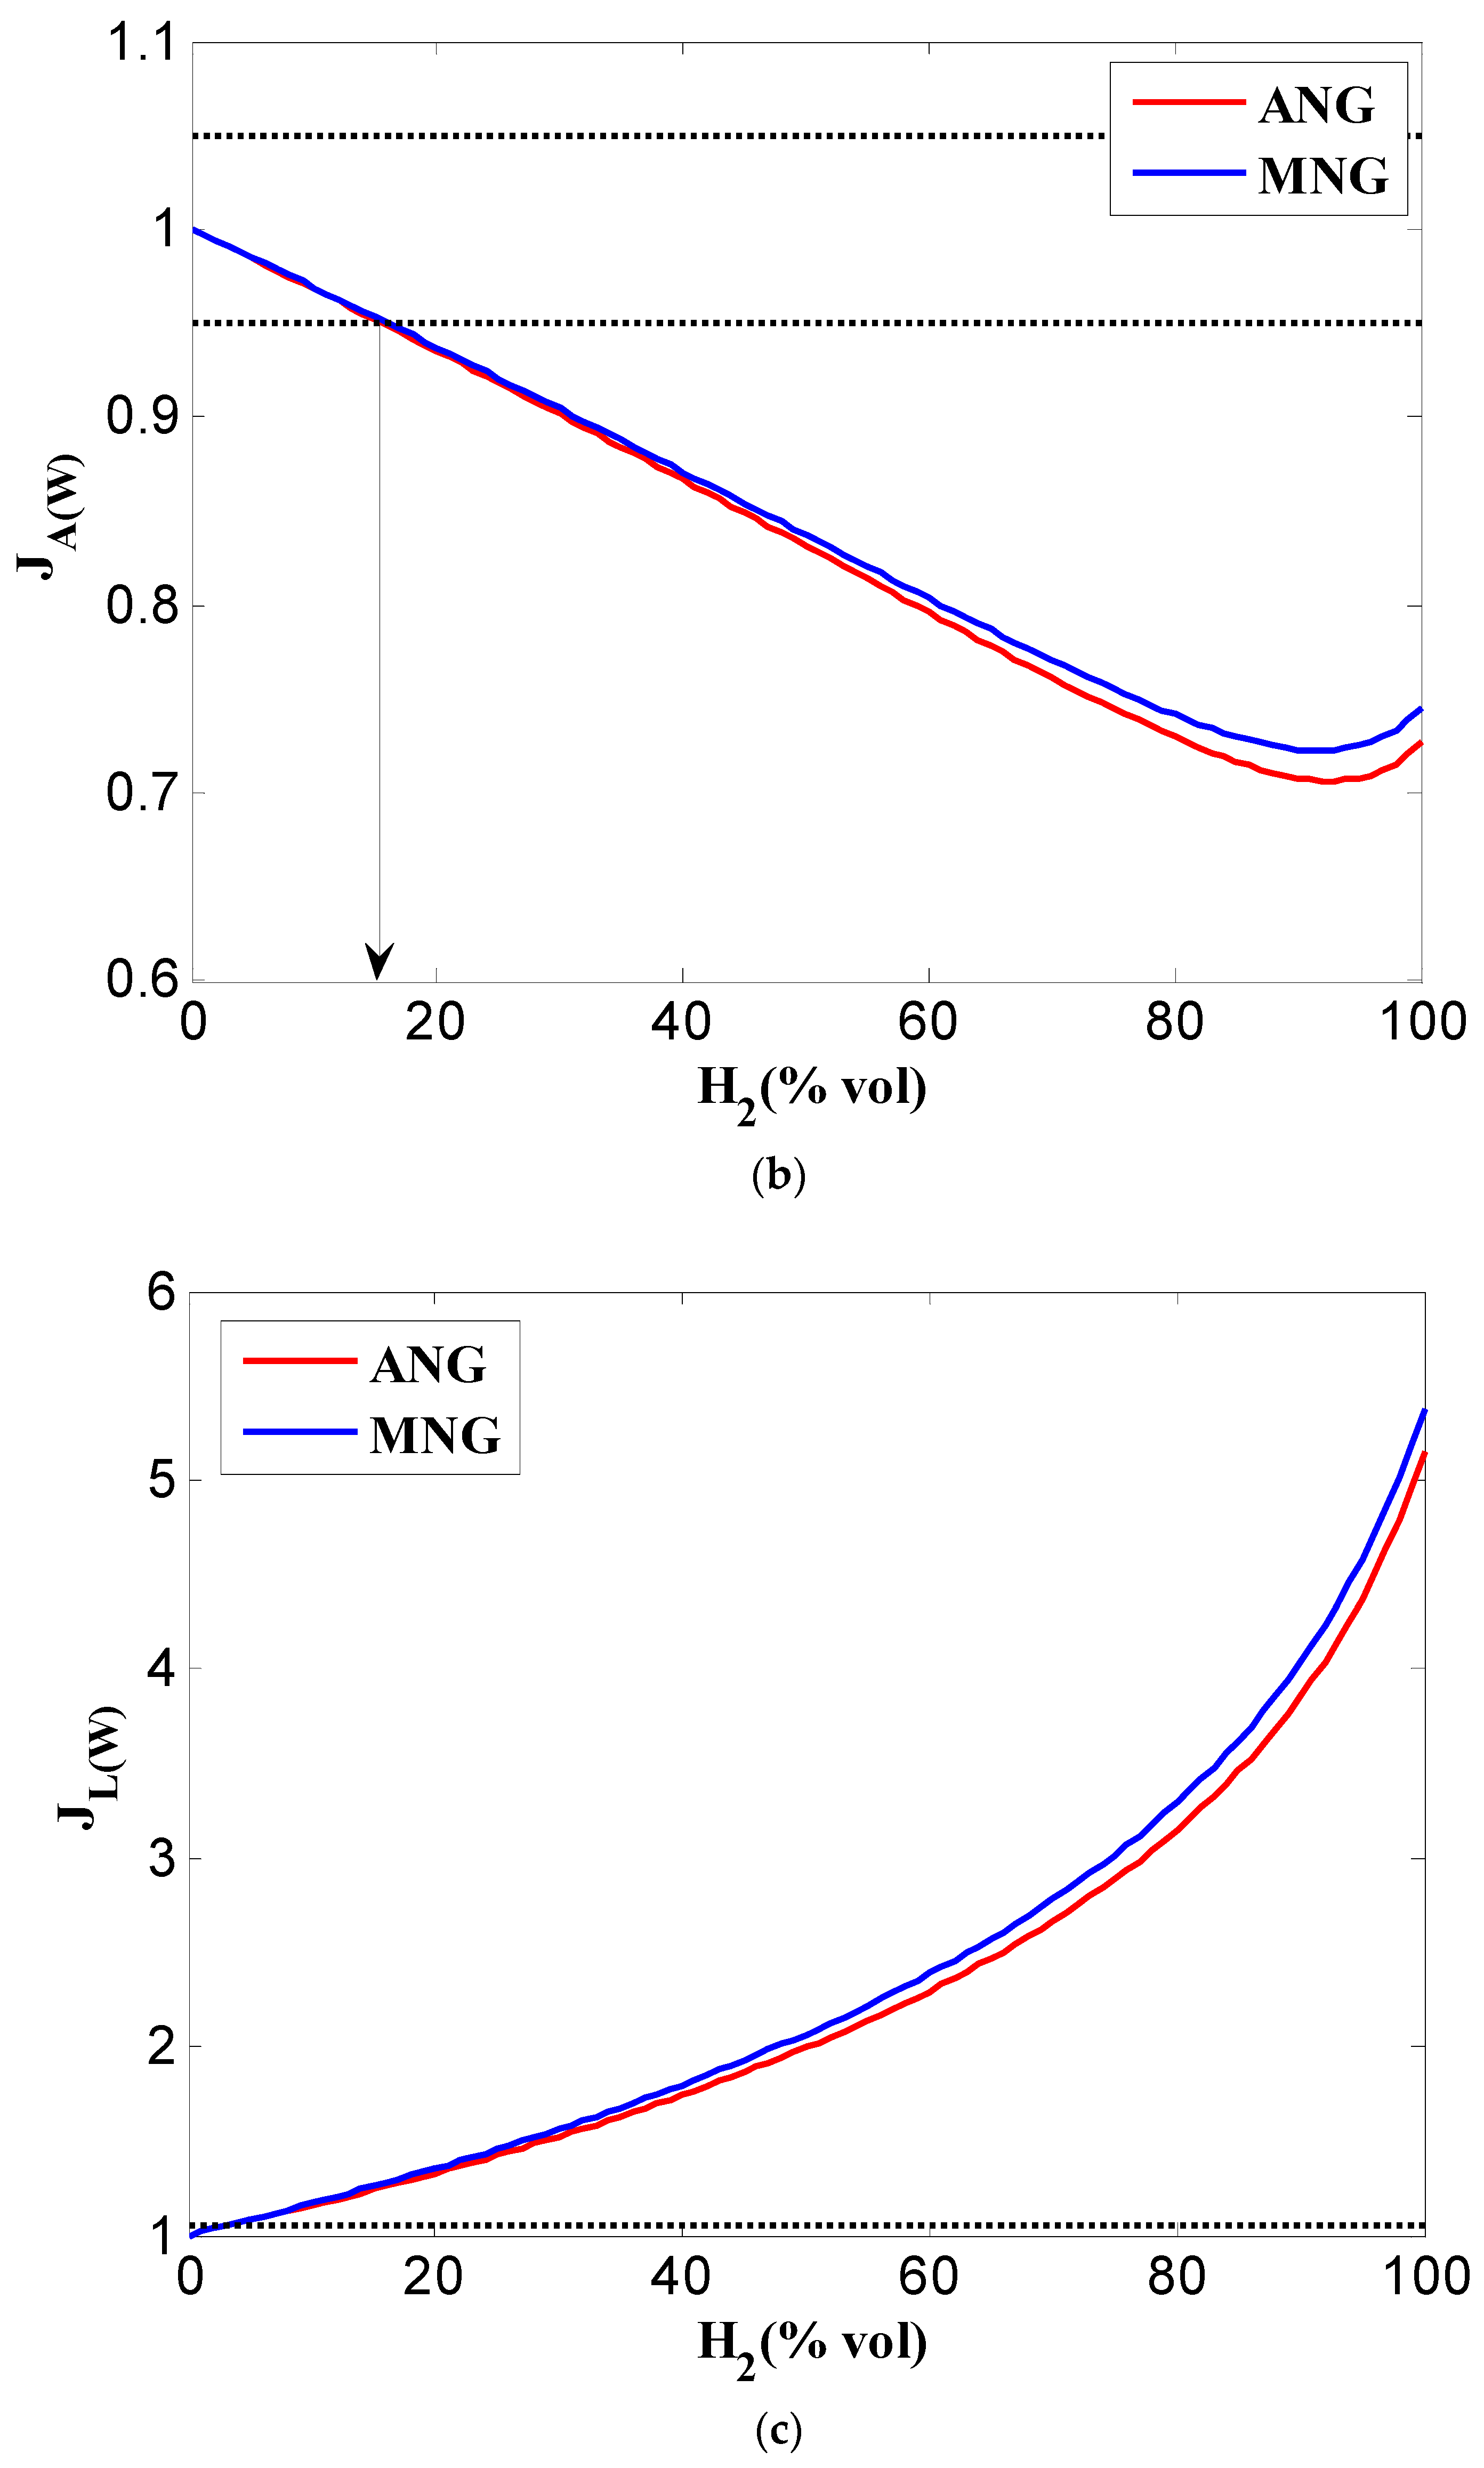
NG/H₂ mixtures are shown in
Figure 4. Weaver’s index of interchangeability concerning the rate of heat production or release is illustrated in
Figure 4a. The interchangeability condition is met when
. Hydrogen content of 20% by volume represents the upper limit within the acceptable range for NG/H₂ mixtures for both ANG and MNG.
The primary air ratio variation is displayed in
Figure 4b. When
, it indicates that the total amount of air required to burn each gas is the same. The index variations are similar for both ANG/H₂ and MNG/H₂ mixtures. Allowing a tolerance deviation of up to ±5% compared to natural gas, the maximum permissible hydrogen blending percentage in NG is approximately 17%.
The limiting value for the lifting index
is again 1. Gases with
of more than 1 show a higher susceptibility to lifting from the burner front.
Figure 4c shows that
values increase exponentially, along with the probability of lifting also becomes higher with the increase of hydrogen content. The primary cause of the high
values of the gas mixtures is the high hydrogen contents, which need 4 times less air for combustion than methane, or a high combustion velocity, which is directly proportional to the Weaver index. The problems of flashback are very likely to occur after the replacement of the gas. This assumption is also confirmed by the results obtained using the Weaver index
plotted in
Figure 4d. The burning of more hydrogen results in a greater susceptibility to flashback if
Any hydrogen content is also accompanied by the danger of an adverse effect on burners.
Lastly, based on the Weaver interchangeability criteria for the yellow tipping index
and the incomplete combustion index
, as plotted in
Figure 4e,f, any hydrogen content in a mixture with natural gas meets the interchangeability requirements without causing phenomena that would negatively impact combustion performance or safety.
7. Discussions
The results from the evaluation of hydrogen blending in natural gas (NG) using various interchangeability methods and parameters, including HHV, Wobbe Index, Dutton factors, Delbourg, and Weaver methods, provide a comprehensive understanding of the impact of hydrogen on combustion characteristics.
The basic trade-offs introduced by hydrogen blending are illustrated by the HHV and Wobbe Index (WI) assessments. While the HHV decreases linearly with increasing hydrogen content, indicating a reduction in the gas mixture’s energy density, the WI shows a nonlinear trend. The behaviour of the WI is particularly significant, as it governs the energy delivery during combustion. The maximum allowable hydrogen blending amounts are up to 18% for MNG and 26% for ANG, which is consistent with the findings in Franco et al. [
34].
Additional insights into combustion behaviour are provided by the Dutton factors, including the incomplete combustion factor, the lift index, and the soot index. The results show that hydrogen blends, due to their lower hydrocarbon concentration and improved flame stability, reduce the risk of incomplete combustion and pose no danger of sooting. This trend supports the safe interchangeability of hydrogen and NG mixtures within the investigated range. However, the results also indicate that mixtures become more susceptible to flame detachment at higher hydrogen concentrations.
The Delbourg diagram is particularly valuable for its graphical representation of interchangeability. It establishes a 15% hydrogen blending limit for ANG and a 22% limit for MNG, beyond which the risk of flame flashback increases. These thresholds are somewhat more restrictive than those derived from the WI alone, emphasising the importance of incorporating both the corrected WI (WI′) and the combustion potential (CP) into evaluations. This dual-parameter approach ensures a more thorough assessment of flame stability and heat input compatibility with existing burner designs.
The Weaver indices provide a comprehensive perspective by considering air requirements, heat production, and flame speed. The heat rate ratio indicates that hydrogen blending is acceptable up to 20% for both ANG and MNG. The primary air ratio index sets a stricter limit of 17% hydrogen, ensuring consistent air-fuel ratios. Weaver indices highlight also the increased risks of flame lifting and flashback at higher hydrogen concentrations. The yellow tipping and incomplete combustion indices confirm that hydrogen blending has minimal impact on incomplete combustion or soot formation, ensuring clean and efficient operation.
Cooking and heating applications, including residential and commercial space heating, are widespread in Tunisia and predominantly rely on natural gas. Within the threshold levels indicated in this study, hydrogen blending does not necessitate burner adjustments. However, exceeding these levels could alter combustion parameters, requiring modifications to ensure efficient and stable operation in stoves, boilers, and heaters. Hydrogen blending reduces the HHV of the gas, which could slightly lengthen cooking times and reduce heating efficiency. To maintain performance, systems may need to operate for longer durations or undergo redesigns for optimal functionality with blended gas.
The employed indexes highlight the increased risks of flame lifting and flashback at higher hydrogen concentrations. This necessitates more precise control of gas-air mixtures, especially in advanced heating systems or industrial burners. Despite these challenges, hydrogen blending leads to cleaner combustion, reducing soot formation and maintenance requirements for burners and heaters. This is a significant benefit for both residential and commercial applications.
Electricity generation in Tunisia relies heavily on natural gas, which accounts for nearly 97% of the country’s energy supply. Power plants are primarily gas turbines and combined-cycle systems. Gas turbines require precise fuel characteristics for optimal performance. Hydrogen blending could affect combustion dynamics, requiring advanced control systems and potentially retrofitted turbines to handle blended gas. The maximum hydrogen concentration allowed in gas turbines varies considerably from one manufacturer to another. It is crucial to adhere to these specifications to maintain stability and efficiency. The literature indicates that 100% hydrogen can be used in gas turbines with stable operation, if flame stability is ensured. This requires the development of new combustor designs compatible with conventional compressors and turbines [
43].
Overall, the combined use of these methods offers a robust framework for evaluating the safe interchangeability of hydrogen and natural gas. However, it is crucial to consider infrastructure and safety requirements when blending hydrogen into natural gas to ensure a seamless and secure transition towards a low-carbon energy future. The distinct physical and chemical properties of hydrogen necessitate a thorough evaluation of the existing NG infrastructure in Tunisia, requiring potential upgrades to materials and systems for compatibility. Safety considerations are paramount, given hydrogen’s flammable nature, requiring the implementation of rigorous safety measures, specialised leak detection systems, and adherence to regulatory standards.
8. Conclusions
This study provides a comprehensive evaluation of green hydrogen blending into the Tunisian natural gas distributing system, examining the impact on combustion characteristics through various interchangeability methods, including HHV, Wobbe Index, Dutton factors, Delbourg, and Weaver indices. The results show that hydrogen blending leads to a decrease in the HHV and WI of the gas mixtures, which directly influences energy content. Hydrogen blending minimises the risk of incomplete combustion and sooting due to the lower hydrocarbon content. However, it increases the risks of flame lifting and flashback phenomena. Equipment for flame stabilisation will in turn be required. Hydrogen blending up to 15–20% appears feasible for most systems without requiring significant burner equipment adjustments, provided that operating conditions remain within the defined limits. This aligns with previous studies that suggest hydrogen blending up to a similar threshold is typically feasible for natural gas networks in other regions, particularly in Europe and North America.
This research contributes to the knowledge of hydrogen blending in natural gas system in Tunisia. Experimental investigations and pilot projects are essential to further validate these findings, assess real-world performance, and explore the economic viability of green hydrogen blending into Tunisia’s gas infrastructure.
Author Contributions
Conceptualization, H.B., H.T., M.B.C. and A.L.-A.; methodology, H.B., H.T., M.B.C. and A.L.-A.; software, H.B. and M.B.C.; validation, H.T., M.B.C. and A.L.-A.; formal analysis, H.B., H.T., M.B.C. and A.L.-A.; investigation, H.B., H.T. and M.B.C.; resources, H.B., H.T. and M.B.C.; data curation, H.B., H.T. and M.B.C.; writing—original draft preparation, H.B.; writing—review and editing, H.B., H.T., M.B.C. and A.L.-A.; visualization, M.B.C.; supervision, M.B.C. and A.L.-A.; project administration, M.B.C. and A.L.-A.; funding acquisition, M.B.C. and A.L.-A. All authors have read and agreed to the published version of the manuscript.
Funding
This research received no external funding.
Data Availability Statement
The original contributions presented in the study are included in the article, further inquiries can be directed to the corresponding author.
Conflicts of Interest
The authors declare no conflicts of interest.
References
- Price, A. The exploitation of renewable sources of energy for power generation. In Electrochemical Energy Storage for Renewable Sources and Grid Balancing; Elsevier: Amsterdam, The Netherlands, 2015; pp. 3–12. [Google Scholar]
- Tang, D.; Tan, G.L.; Li, G.W.; Liang, J.G.; Ahmad, S.M.; Bahadur, A.; Humayun, M.; Ullah, H.; Khan, A.; Bououdina, M. State-of-the-art hydrogen generation techniques and storage methods: A critical review. J. Energy Storage 2023, 64, 107196. [Google Scholar] [CrossRef]
- Taibi, E.; Miranda, R.; Vanhoudt, W.; Winkel, T.; Lanoix, J.C.; Barth, F. Hydrogen from Renewable Power: Technology Outlook for the Energy Transition; Institution of Gas Engineers and Managers (IGEM): Kegworth, UK, 2018. [Google Scholar]
- EU Commission. A Hydrogen Strategy for a Climate Neutral Europe. 2020. Available online: https://ec.europa.eu/energy/sites/ener/files/hydrogen_strategy.pdf (accessed on 16 February 2023).
- Kumar, S.; Baalisampang, T.; Arzaghi, E.; Garaniya, V.; Abbassi, R.; Salehi, F. Synergy of green hydrogen sector with offshore industries: Opportunities and challenges for a safe and sustainable hydrogen economy. J. Clean. Prod. 2023, 384, 135545. [Google Scholar] [CrossRef]
- Cheli, L.; Guzzo, G.; Adolfo, D.; Carcasci, C. Steady-state analysis of a natural gas distribution network with hydrogen injection to absorb excess renewable electricity. Int. J. Hydrogen Energy 2021, 46, 25562–25577. [Google Scholar] [CrossRef]
- Vidas, L.; Castro, R.; Pires, A. A review of the impact of hydrogen integration in natural gas distribution networks and electric smart grids. Energies 2022, 15, 3160. [Google Scholar] [CrossRef]
- Mahajan, D.; Tan, K.; Venkatesh, T.; Kileti, P.; Clayton, C.R. Hydrogen blending in gas pipeline networks—A review. Energies 2022, 15, 3582. [Google Scholar] [CrossRef]
- Gaz, R.D.F.G.; Storengy, F.; Reseau, G.D.S.; Syndicat, P.D.E.G.N. Technical and Economic Conditions for Injecting Hydrogen into Natural Gas Networks-Final Report; IAEA: Paris, France, 2019. [Google Scholar]
- Shirvill, L.C.; Roberts, T.A.; Royle, M.; Willoughby, D.B.; Sathiah, P. Experimental study of hydrogen ex-plosion in repeated pipe congestion–Part 2: Effects of increase in hydrogen concentration in hydrogen-methane-air mixture. Int. J. Hydrogen Energy 2019, 44, 3264–3276. [Google Scholar] [CrossRef]
- Raju, A.S.; Martinez-Moralez, A.; Lever, O.; Asiedu-Akrofi, L. Hydrogen Blending Impacts Study; California Public Utilities Commission: San Francisco, CA, USA, 2022. [Google Scholar]
- Guzzo, G.; Cheli, L.; Carcasci, C. Hydrogen blending in the Italian scenario: Effects on a real distribution network considering natural gas origin. J. Clean. Prod. 2022, 379, 134682. [Google Scholar] [CrossRef]
- Melaina, M.W.; Antonia, O.; Penev, M. Blending Hydrogen into Natural Gas Pipeline Networks: A Review of Key Issues; Institution of Gas Engineers and Managers (IGEM): Kegworth, UK, 2013. [Google Scholar]
- Topolski, K.; Reznicek, E.P.; Erdener, B.C.; San Marchi, C.W.; Ronevich, J.A.; Fring, L.; Simmons, K.; Fernandez, O.J.G.; Hodge, B.M.; Chung, M. Hydrogen Blending into Natural Gas Pipeline Infrastructure: Review of the State of Technology; National Renewable Energy Lab. (NREL): Golden, CO, USA, 2022. [Google Scholar]
- Bard, J.; Gerhardt, N.; Selzam, P.; Beil, M.; Wiemer, M.; Buddensiek, M. The Limitations of Hydrogen Blending in the European Gas Grid; Institution of Gas Engineers and Managers (IGEM): Kegworth, UK, 2022. [Google Scholar]
- Cavana, M.; Mazza, A.; Chicco, G.; Leone, P. Electrical and gas networks coupling through hydrogen blending under increasing distributed photovoltaic generation. Appl. Energy 2021, 290, 116764. [Google Scholar] [CrossRef]
- Vaccariello, E.; Trinchero, R.; Stievano, I.S.; Leone, P. A statistical assessment of blending hydrogen into gas networks. Energies 2021, 14, 5055. [Google Scholar] [CrossRef]
- Zhao, Y.; McDonell, V.; Samuelsen, S. Influence of hydrogen addition to pipeline natural gas on the combustion performance of a cooktop burner. Int. J. Hydrogen Energy 2019, 44, 12239–12253. [Google Scholar] [CrossRef]
- Société Tunisienne d’Electricité et du Gaz, STEG, Report 2020. Available online: https://www.steg.com.tn/$J@5cg0AExGgawE-EkGN45x-z-JlHIJ1Dl4LHL79DhAsXzb90t9iMkwwxmzxKDTK67RXqj1m8mjMCaT5cwUlaujP0Cpq6wgf1ZDmuRFNxnxTJEEHztFSUPetH0?tknfv=9eab66f4b-f7d7-498b-a9c5-10555b899301n29 (accessed on 1 November 2024).
- Britain, G. A Guide to the Gas Safety (Management) Regulations 1996: Guidance on Regulations; HSE Books: Norwich, UK, 1996. [Google Scholar]
- Fík, J. Combustion of Gaseous Fuels and Gas Burners; GAS Ltd.: Coventry, UK, 1998. [Google Scholar]
- GIZ Final Report Study on the Potential of Renewable Energies for the Production of Electricity Intended for National Consumption in Tunisia as well as for Export to the EU. Available online: https://energypedia.info/images/archive/3/31/20130121165137%21Renewable_energy_potential_for_electricity_generation_for_national_consumption_in_Tunisia_and_export_to_the_EU_%28French_version%29.pdf (accessed on 1 November 2024).
- Edwards, R.L.; Font-Palma, C.; Howe, J. The status of hydrogen technologies in the UK: A multi-disciplinary review. Sustain. Energy Technol. Assess. 2021, 43, 100901. [Google Scholar] [CrossRef]
- Robinson, Z.; Peacock, A.; Thompson, M.; Catney, P. Consumer Perceptions of Blended Hydrogen in the Home: Learning from HyDeploy; Keele University: Keele, UK, 2022. [Google Scholar]
- The GRHYD Demonstration Project. Available online: https://www.engie.com/en/businesses/gas/hydrogen/power-to-gas/the-grhyd-demonstration-project (accessed on 1 November 2024).
- Erdener, B.C.; Sergi, B.; Guerra, O.J.; Chueca, A.L.; Pambour, K.; Brancucci, C.; Hodge, B.M. A review of technical and regulatory limits for hydrogen blending in natural gas pipelines. Int. J. Hydrogen Energy 2023, 48, 5595–5617. [Google Scholar] [CrossRef]
- Korb, B.; Kawauchi, S.; Wachtmeister, G. Influence of hydrogen addition on the operating range, emissions and efficiency in lean burn natural gas engines at high specific loads. Fuel 2016, 164, 410.e8. [Google Scholar] [CrossRef]
- Sofianopoulos, A.; Assanis, D.N.; Mamalis, S. Effects of hydrogen addition on automotive lean-burn natural gas engines: Critical review. J. Energy Eng. 2015, 142, E4015010. [Google Scholar] [CrossRef]
- Donohoe, N.; Heufer, A.; Metcalfe, W.K.; Curran, H.J.; Davis, M.L.; Mathieu, O.; Plichta, D.; Morones, A.; Petersen, E.L.; Güthe, F. Ignition delay times, laminar flame speeds, and mechanism validation for natural gas/hydrogen blends at elevated pressures. Combust. Flame 2014, 161, 1432.e43. [Google Scholar] [CrossRef]
- Ravi, S.; Morones, A.; Petersen, E.L.; Güthe, F. Effects of hydrogen addition on the flame speeds of natural gas blends under uniform turbulent conditions. In ASME Turbo Expo 2015: Turbine Technical Conference and Exposition; American Society of Mechanical Engineers: New York, NY, USA, 2015. [Google Scholar]
- Deschamps, Y. Combustibles Gazeux. Utilisation et Combustibilité des Gaz. In Généralités: Sciences Fondamentales, Génie Industriel; Techniques de l’Ingénieur: Saint-Denis, France, 1984; Available online: https://www.techniques-ingenieur.fr/base-documentaire/archives-th12/archives-ressources-energetiques-et-stockage-tiabeb/archive-1/combustibles-gazeux-utilisation-et-combustibilite-des-gaz-a1750/ (accessed on 1 November 2024).
- Alexander, S.; Anatolii, K.; Vitalii, T. Interchangeability and Standardization of the Parameters of Combustible Gases When Using Hydrogen. Archit. Eng. 2022, 7, 33–45. [Google Scholar]
- Williams, T. European gas interchangeability. In Proceedings of the World Gas Conference, Buenos Aires, Argentina, 5–9 October 2009. [Google Scholar]
- Franco, A.; Rocca, M. Industrial Decarbonization through Blended Combustion of Natural Gas and Hydrogen. Hydrogen 2024, 5, 519–539. [Google Scholar] [CrossRef]
- Plus, N.G.C. White Paper on Natural Gas Interchangeability and Non-Combustion End Use; NGC+ Interchangeability Work Group. 2005. Available online: https://www.naesb.org/pdf/update011905w10.pdf (accessed on 1 November 2024).
- Honus, S.; Kumagai, S.; Němček, O.; Yoshioka, T. Replacing conventional fuels in USA, Europe, and UK with plastic pyrolysis gases–Part I: Experiments and graphical interchangeability methods. Energy Convers. Manag. 2016, 126, 1118–1127. [Google Scholar] [CrossRef]
- Wood, K.; Gomes, I.; Ho, B.; Kerr, S.; Cavanagh, S.; Wood, D.; Haywood, A. Guidebook to Gas Interchangeability and Gas Quality; Technical Report; International Gas Union, British Petroleum: London, UK, 2011. [Google Scholar]
- Dutton, B.C.; Wood, S.W. Gas interchangeability: Prediction of soot deposition on domestic gas appliances with aerated burners. J. Inst. Energy 1984, 57, 432. Available online: https://www.osti.gov/etdeweb/biblio/5056548 (accessed on 1 November 2024).
- Lander, D. UK situation regarding gas quality. In Presentation to Marcogaz Gas Quality WG; 2002. [Google Scholar]
- Honus, S.; Kumagai, S.; Yoshioka, T. Replacing conventional fuels in USA, Europe, and UK with plastic pyrolysis gases–Part II: Multi-index interchangeability methods. Energy Convers. Manag. 2016, 126, 1128–1145. [Google Scholar] [CrossRef]
- Ortíz, J.M. Fundamentos de la Intercambiabilidad del Gas Natural; Ciencia: Hartford, CT, USA, 2014; Available online: https://www.cnogas.org.co/documentos/1_Intercambiailidad%20del%20gas%20natural.pdf (accessed on 1 November 2024).
- Ferguson, D.H.; Straub, D.L.; Richards, G.A.; Robey, E.H. Impact of Fuel Interchangeability on Dynamic Instabilities in Gas Turbine engines (No. DOE/NETL-IR-2007-102); National Energy Technology Laboratory (NETL): Pittsburgh, PA, USA; Morgantown, WV, USA; Albany, OR, USA, 2007. [Google Scholar]
- Park, Y.; Choi, M.; Choi, G. Thermodynamic performance study of large-scale industrial gas turbine with methane/ammonia/hydrogen blended fuels. Energy 2023, 282, 128731. [Google Scholar] [CrossRef]
| Disclaimer/Publisher’s Note: The statements, opinions and data contained in all publications are solely those of the individual author(s) and contributor(s) and not of MDPI and/or the editor(s). MDPI and/or the editor(s) disclaim responsibility for any injury to people or property resulting from any ideas, methods, instructions or products referred to in the content. |
© 2024 by the authors. Licensee MDPI, Basel, Switzerland. This article is an open access article distributed under the terms and conditions of the Creative Commons Attribution (CC BY) license (https://creativecommons.org/licenses/by/4.0/).


