1. Introduction
Cement was first used on a large scale in Greece and Rome by mixing lime and volcanic ash. This material proved to be excellent for construction, and as time went by, the recipe improved until it became the modern version, Portland cement, using limestone and clay [
1]. The cement industry is one of the biggest in the world and contributes 6~8% of global carbon emissions. This rather significant value will continue to grow with the ever-increasing demand from the construction sector unless proper actions are taken [
2,
3].
To produce cement, limestone (CaCO
3) is extracted and crushed, combined with an aluminous mineral such as clay or marl, and some additives like iron ore or silica may be added to correct the chemical composition. The mixture is then ground more finely and goes through a preheater, a tower of four to six cyclones, and in more modern cement plants, through a precalciner as well, where calcination occurs and quicklime (CaO) is formed, as shown in Equation (1).
The calcined raw meal then enters the rotary kiln. The kiln presents a slight slope, which, combined with its rotation, causes the mixture to move along the kiln’s length. The meal passes through progressively hotter zones before reaching the main burner, where it is subjected to temperatures as high as 1450 °C. During this heating process, the raw meal undergoes clinkerization. The result is a mixture of minerals, the main ones being belite, alite, calcium aluminate, and calcium aluminoferrite, which are responsible for the properties of cement. The formation mechanisms of these four minerals are shown in Equations (2)–(5), with alite being the most prevalent [
4].
The divisions of the rotary kiln are still under debate. Still, it is generally agreed upon that, in modern rotary kilns, the first is the upper-transition zone, where the calcination of limestone is completed and mineral formation starts. It is followed by the sintering zone, where all the clinker mineral reactions occur, helped by a liquid phase of mainly calcium, aluminum, and iron. This is where temperature peaks, partially due to sintering’s exothermic nature, making the sintering possible and forming clinker nodules. The lower transition zone connects the sintering zone with the cooler. When the clinker enters the cooler, the temperature is lowered to 100–200 °C using large amounts of air, stabilizing the thermodynamically unstable minerals like alite [
5]. It is then ground into a fine powder and blended with additives such as gypsum, at which point it is defined as cement [
4].
During cement production, 590 kg of carbon dioxide (CO
2) are released for every ton of cement produced [
2], with 40% originating from the burning of fossil fuels, usually pulverized coal or petroleum coke, and 60% being released during raw meal calcination [
4]. To reduce fuel emissions, the most reliable method is altering the fuel mix; however, this is a delicate balancing act to keep the burning conditions in the kiln close to those of coal, or at least without affecting cement quality. For example, using a high biomass content in the fuel mix would raise the moisture content, reducing the maximum temperature in the kiln and not reaching the threshold necessary for forming certain minerals. As for the emissions associated with calcination, as this step is required in cement production, its emissions must be mitigated using other methods. This work, however, focuses primarily on two alternative approaches to tackle fossil fuel emissions: using oxygen enrichment (OXE) and adding H
2 into the fuel mix. Other decarbonization methods have been explained in the next section to provide some context. Still, this work focuses on estimating the capital expenditures (CAPEX) of implementing OXE and H
2, using data from the literature and process information provided by Secil, a leading producer of cement in Portugal.
2. Cement Industry Decarbonization Strategies
One of the arguably simplest ways to reduce emissions during cement production, albeit already carried out in most of the world, would be to shift from the old vertical shaft kiln to the rotating kiln. All modern countries have made the switch, and China, responsible for over half of the world’s cement production, has also done so. Other significant producers like India and Vietnam could also perform the switch. For them, it remains the best decarbonization method despite the high costs of replacing a major piece of equipment. While reducing emissions might not be a priority for these countries, these kilns have lower energy consumption and can produce higher-quality cement, justifying the investment [
6].
As for the rest of the world, decarbonization will most likely have to be implemented by retrofitting the process. One method could be lowering the clinker content in cement (from the usual 0.7 kg clinker/kg cement) by replacing the clinker with waste materials like copper tailings and sugar cane bagasse, reducing the amount of limestone needed and thus the emissions from carbonation [
7]. Another promising recipe is limestone-calcinated clay cement (LC
3), which claims to reduce CO
2 emissions by up to 40% while having a near-equal performance to standard cement [
7].
Another option is waste heat recovery since the process operates at relatively high temperatures and has significant heat losses (35–40%) occurring through the exhaust gas (19%), in the cooler (5%), and through the convection/radiation in the kiln (15%) [
8]. Using the Rankine cycle, waste heat can be converted into electricity, mitigating emissions by requiring less electricity from the grid. Most of the waste heat is in the air used to cool clinker and flue gases [
7], which is often already used to heat the preheater and precalciner; this, alongside a significant CAPEX, makes this option only viable in certain cases [
7,
9].
While the above are valid strategies for combating cement emissions, what most have in mind for this topic would be carbon capture and storage (CCS), an end-of-pipe treatment that captures the CO
2 at the end of the process. This method can have different configurations, but a common one is the reactive absorption-stripping method, also known as amine scrubbing, which uses amines, such as ethanolamine (C
2H
7NO), to react with water and CO
2 in an absorption column. In this method, the flue gas enters from the bottom of the column, counter-current to the solvent, and has its CO
2 removed by the solvent, which is composed of water and amines. It then exits through the top of the column and is sent to the stack. The solvent, now rich in CO
2, is then heated and sent to the top of a stripping column, counter-current to the steam generated by the reboiler. At the top of this column, CO
2 and water are sent to a condenser, where the water is recovered back into the column, and the CO
2 is purified and ready to be compressed for storage and transportation. At the bottom, the regenerated solvent is used to heat the stream from the bottom of the absorption column and sent back to the top of the absorber, where the cycle begins again [
10].
Figure 1 shows a diagram of this process.
While CCS appears to be ideal on paper, as it would give us time to switch to less polluting energy sources, this is an expensive addition to the process, costing around 115 EUR/ton CO
2 at a 90% capture rate [
10]. In addition to more investment in research, another way to improve its viability is to complement it with other methods, like oxyfuel, where nitrogen (N
2) is removed from the primary combustion air. The nearly pure oxygen (>95 vol.% O
2) allows for improved burning efficiency and dramatically increases the CO
2 concentration in the flue gas, which makes it much easier for the CCS units to remove it. This method, besides requiring a pure source of oxygen on-site (adding to the cost and operational complexity of the unit), also increases the flame temperature. This can further ensure the complete conversion of quicklime into clinker minerals and reduce energy demands, but it can also damage the inner refractory brick lining of the rotary kiln [
9]. As such, this temperature increase can be controlled by altering the fuel mix (i.e., integrating more biomass) or operating at lower oxygen concentrations. Additionally, the CO
2 must be stored or consumed elsewhere. Currently, its production far outweighs what is needed in industries like metallurgy or beverage production, but that could change as more businesses see an opportunity in a waste product. As for storing CO
2, it can be compressed and injected back into deep reservoirs of porous rock under an impermeable layer of rock, similar to the formations from which we extracted oil and gas. Studies also show an abundance of storage sites, exceeding what is expected to be needed, but further analysis is necessary to determine their commercial viability [
11].
Two other exciting strategies whose viability is analyzed more in-depth in this study are oxygen (O2) enrichment, a more moderate use of oxyfuel that increases the O2 concentration in the air while only partially removing N2, and the addition of hydrogen (H2) to the fuel mix to achieve a more complete combustion and allow for the use of alternative fuels while maintaining close to normal combustion conditions.
3. Oxygen Enrichment (OXE)
Air is composed of 21 vol.% O
2 and 78 vol.% N
2, with the remaining 1% comprising other gases like CO
2 and argon. Only O
2 is consumed during combustion, while the remaining components are inert, adding unnecessary volume and lowering the temperature during combustion. OXE uses an air separator, usually through pressure swing adsorption (PSA) or cryogenic distillation, to obtain a stream of high-purity O
2 (90–95 vol.%) that can then be added to the primary burning air, outside air that is directly injected into the kiln burner, raising the overall O
2 concentration. This reduces the volume of outside air that must be drawn, improves fuel efficiency, and increases the maximum flame temperature while keeping the same shape and only slightly increasing the average temperature of the kiln. The increase in flame and clinker temperature depends on the concentration of O
2 in the burning air [
12]. Still, for a significant enrichment (>23 vol.% O
2), appropriate measures must be taken to avoid the more frequent replacement of the kiln refractory brick lining, such as increasing the alternative fuel rate or installing a more temperature-resistant type of refractory brick. PSA is a well-established method for producing O
2, having the highest technology readiness level (TRL) of nine.
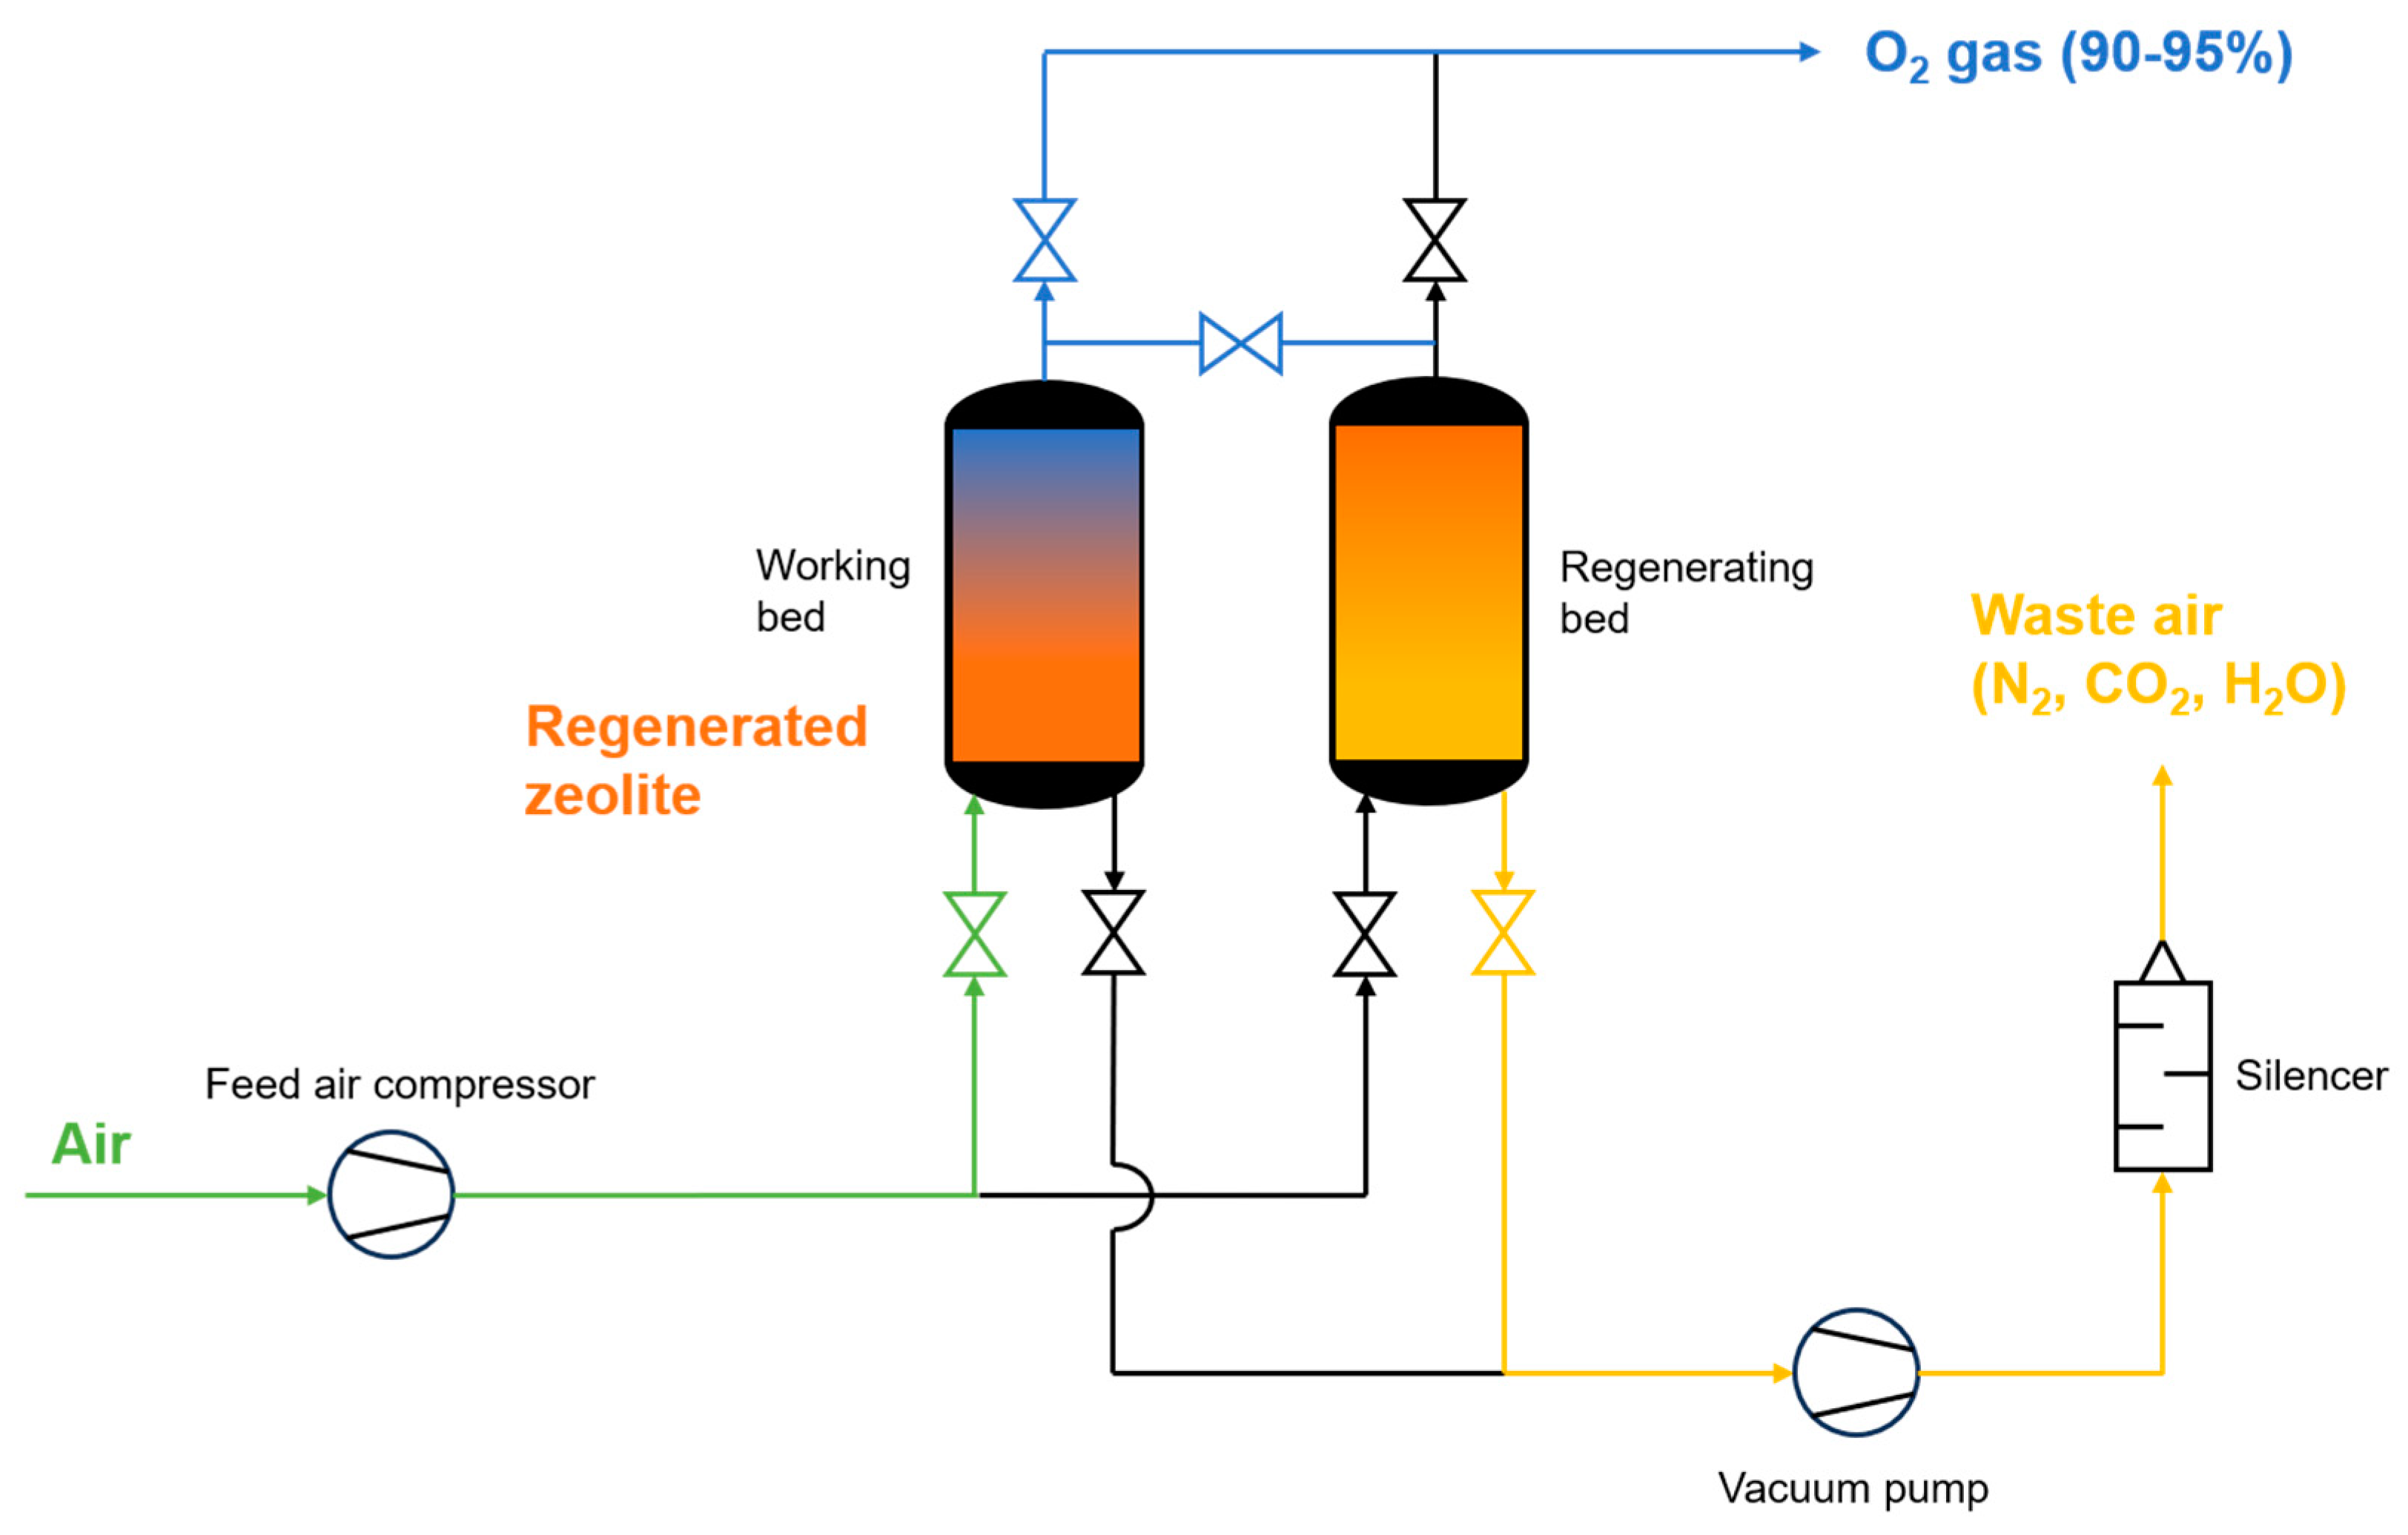
PSA usually comprises two packed beds containing zeolites, such as 5A and 13X, made from aluminum and silica and can adsorb O
2 at high pressures (5–10 bar). The process alternates between the two beds; while one bed is pressurized with the feed stream, the other purges the remaining gases, lowering pressure. The valve opens once the pressure is high enough in the working bed; O
2 is then extracted, with a portion used to help regenerate the other bed. Then, both beds are connected to equalize the pressure, which lowers energy consumption as it reduces the amount of pressurization needed. This cycle repeats with the beds switching roles to provide a continuous oxygen flow. An alternative to regular PSA is vacuum PSA, which is the chosen method to assess the process costs. The latter uses a vacuum pump during the desorption of the regenerating bed operating below 0.6 bar for improved regeneration, only requiring some feed pressurization [
13].
Figure 2 shows a schematic diagram of the vacuum PSA system, and Equation 6 illustrates the adsorption equation and its enthalpy, with A representing the adsorbent (5A or 13X) surface [
14].
Considering the average production of European cement line (3000 tons of clinker per day [
15]), an air intake of ca. 2.25 kg/s or 6265 Nm
3/h is necessary, according to the cement company Secil. Wang et al. who reported that increasing the O
2 concentration from 21 to 27 vol.% is optimal, improving heat transfer rate, increasing temperature, and decreasing CO emissions, meaning a more complete combustion. At higher O
2 concentrations, NO
x production spikes, as thermal NO
x production becomes more relevant after a certain temperature threshold. This O
2 concentration causes a negligible increase in the average kiln temperature, but the maximum temperature can experience an increase of up to 10% [
16].
Using a purity of 90% for the enriched air, usually considered a reasonable value [
17], 545 Nm
3/h of enriched air will have to be injected alongside 5720 Nm
3/h of regular air to maintain the same volume of primary air as normal operating conditions. According to this work [
18], producing this much oxygen through PSA would have a CAPEX of 1.13 MEUR and require an additional consumption of 594 kWh. The CAPEX was calculated using William’s rule, as shown in Equation (7).
Table 1 shows a summary of the costs and benefits of this implementation.
4. Adding Hydrogen to the Fuel Mix
Adding H2 to the fuel mix can prove beneficial, both to help decarbonize the process by using a fuel that only releases water when burned and that improves combustion, making it more complete. This is achieved due to H2’s high energetic content, burning temperature, and speed, which increases fuel efficiency, with less carbon being used to form other pollutants like CO and NOx, thus reducing fuel consumption. This can also benefit companies aiming to use a fuel mix containing more moisture, like biomass or waste-based fuels, as these tend to have lower burning temperatures. For this case, it was considered that 5% of the thermal energy required to operate the kiln would be supplied by H2, a figure significant enough to evaluate its economic viability. Assuming that petcoke is used to provide the remaining 95% of the kiln’s thermal needs, this would translate into H2 making up 1.2 wt.% or 99.2 vol.% of the fuel composition.
However, any environmental benefits from using H
2 as a fuel are invalidated if its production is not equally low in emissions. One of the best ways to do this is through electrolysis: by immersing two electrodes in water and applying an electrical current, it is possible to split water into H
2 at the cathode (−) and O
2 at the anode (+). If the electricity comes from renewable or nuclear energy sources, then no carbon emissions are associated with the H
2 production method. For continuous production, as is the case, the fluctuating character of renewable energy sources, such as solar and wind, can have trouble providing a constant amount of electricity. Thus, the factory may need access to other renewable sources of energy, such as geothermal or hydroelectric, which can prove quite tricky, or to design the system for a higher production capacity and ensure adequate storage. As this work intends to study the effects and costs of using H
2 on a cement kiln, it will not delve further into this limitation. It should be noted that this is one of the most expensive methods, at 3–7 EUR/kg H
2, due to both its high electricity consumption and the materials necessary to build the cell [
19].
Figure 3 shows one such electrolysis cell, while Equations (8)–(10) show the electrolysis reactions for an acid/neutral environment [
20].
There are four main types of electrolyzers, but the ones most likely to be seen in a current industrial setting are alkaline water electrolysis (AWE), a cell similar to the one in
Figure 3 but in alkaline solution (usually of potassium hydroxide) and using nickel and stainless steel electrodes, or proton-exchange membrane (PEM) electrolysis, where the aqueous electrolyte is replaced by a solid polymer electrolyte membrane, usually Nafion
®, with noble-metal based electrode materials. PEM electrolyzers are more recent, and despite costing more than AWE, their price is expected to drop as they offer some advantages like better efficiency and higher H
2 purity; thus, PEM implementation will be considered [
21]. While TRLs vary for each type of electrolyzer, PEM electrolysis has a TRL of nine [
22].
To calculate costs for the same production line (3000 tons clinker/day) with a specific fuel consumption of 0.911 kWh/kg clinker [
23] and an H
2 HHV of 39.4 kWh/kg [
24], an H
2 flow of 144 kg/h or 1606 m
3/h would be needed to meet the criteria, supplying to the kiln 5.6 MWh in the form of H
2. Two sources were considered to calculate the equipment cost: a report from the US Department of Energy (DOE) [
25] and a report from the British Department for Business, Energy and Industrial Strategy (BEIS) [
26].
According to the DOE, the cost of a PEM electrolyzer CAPEX depends on the electrical capacity required, costing between 940 and 1400 EUR/kW. Assuming an input of 48 kWh per kg of H
2 [
27], an electrolyzer capacity of 6.93 MWh will be required, resulting in the equipment costing between 6.44 and 9.67 MEUR. The BEIS calculates the CAPEX using the heating capacity of the H
2 produced (HHV). From there, it can be estimated that a conservative range for PEM electrolyzer costs would be 930–1400 EUR/kWh H
2. Then, the equipment necessary to produce 5.6 MWh of H
2 will cost between 5.22 and 7.83 MEUR.
Since these sources only consider the equipment price, to obtain the final implementation, the following steps were taken [
23]:
+5% for reconstruction of the nearby area/equipment;
Assume the equipment costs make up 48% of installation costs, with 37% for civil and steel work and 15% for erecting it;
+10% for contingency and fees;
+20% for interest, working capital, and owner’s costs.
The calculated costs are summarized in
Table 2, with LB and HB standing for the costs’ lower and higher bounds according to each source.
Averaging the results, the equipment needed to ramp up H
2 production would cost 21.05 MEUR. This would also carry an additional consumption of approximately 6.9 MWh, a rather significant increase in consumption. As for the supplementary costs, assuming a PEM electrolysis stack is used over a 10-year lifetime period, there should be no need to replace the membranes, considering that the BEIS report states that PEM membranes only need replacement every 11 years [
26].
5. Carbon Intensity
This section discusses the method that better helps with cement-industry decarbonization. A modern cement line producing 3000 tons of clinker per day could produce 4225 tons of cement daily (clinker-to-cement ratio of 0.71 [
2]). This would emit 2450 tons of CO
2 per day (t
CO2/day), assuming the emission of 0.58 tons of CO
2 per ton of cement produced [
2]). The discussed methods can only combat 40% (980 t
CO2/day) of the CO
2 emissions, as they have no effect on the remaining 60% of emissions that occur during calcination (1470 t
CO2/day) [
4]. It is also important to note that these emissions are split between the kiln and the preheater, as both require fuel. However, considering the kiln consumes most of the fuel due to its size and need for high temperatures, a simplification is made, and only the kiln emissions are taken into account.
Using OXE would mean the same amount of fuel could produce 7–10% more clinker if enough CaO is provided [
15,
16]. This results in an improvement in process energy efficiency of 6.5–8.1%, preventing the emission of 64–79 t
CO2/day. This method also carries an additional electrical power requirement of 713 kWh. Considering the average CO
2 emissions associated with electricity generation in Portugal in 2022 [
28], this results in additional emissions of 4 t
CO2/day, bringing the total CO
2 reduction of this method to 60–75 t
CO2/day.
As for the use of H
2 in the fuel mix, it is unlikely that supplying 5% of the kiln’s thermal needs using H
2 and the remaining using alternative fuels (i.e., 5% H
2 + 95% of solid recovered fuel (SRF)) is enough to achieve adequate burning conditions. A higher fraction, closer to 7.5%, would likely be needed for a net-zero fuel mix [
29]. It should be noted that the decarbonization impact of H
2 fuel at this scale comes not from the fuel itself but from the fact that it allows the use of a higher fraction of alternative fuels, mainly biomass, and SRFs.
Assuming no SRF processing, a factory could continue using coal for the rest of the fuel mix (5% H
2 + 95% coal) and reduce CO
2 emissions by 49 t
CO2/day, assuming the benefits to the process’s energy efficiency. In the best-case scenario, the fuel mix could still use some coal as a correction fuel to achieve fine control over the necessary temperatures, albeit in a lower proportion than the 60% SRF + 40% petcoke case described by Hercog et al. [
29]. Employing a fuel mix of 5% H
2 + 65% SRF + 30% petcoke reduces process emissions by 686 t
CO2/day. Considering the 6.9 MWh necessary to operate the electrolyzers, there is an additional 39 t
CO2/day. This results in a daily CO
2 reduction of as low as 10 tons or as high as 647 tons.
In conclusion, OXE can provide a smaller but more consistent reduction in emissions (2–3%), while H
2 has greater potential to reduce emissions (26%) but requires significant changes in the fuel mix. The contents of this section are summarized in
Table 3.
Concerning the other previously discussed decarbonization methods, the most important to compare with is CCS. This method could have a significantly high impact, as it is one of the few technologies that can combat calcination and fuel combustion emissions. At a reasonable efficiency/capture rate, CCS technology could prevent 90% of the CO
2 emissions in the flue gas, causing a reduction of 2205 t
CO2/day. This does not account for the electrical consumption of the process, but the main power draw of this technique comes from pumping. Therefore, the emissions occurring during power generation should not be too detrimental compared to the reduced emissions [
10].
6. Discussion
Of the two presented methods (i.e., OXE and H
2), using H
2 to supply 5% of the kiln’s thermal needs has the greatest potential for decarbonization. Using only H
2 and other alternative fuels, especially those with high energy content, like SRFs, could allow for a net-zero fuel mix. However, since this fuel type has a higher moisture content and varying composition, it could require a higher H
2 content to reach similar burning conditions to coal [
29]. Still, removing the process emissions associated with burning fossil fuels would be a significant step in decarbonizing this sector.
Assuming the most likely scenario, where the CAPEX and operating expenses (OPEX) of electrolysis are lower and green electricity becomes more accessible, this method is expected to gain traction. An essential factor to consider is that PEM electrolysis produces both H
2 and O
2 with high purity; so, at the studied scale, an electrolyzer would produce 803 Nm
3/h of O
2, enough to also perform OXE. This would require both H
2 and O
2 to be mixed with primary air or modifications to the burner to allow both gases to be injected at the root of the flame [
30]. While possible, the use of both methods is limited by the increase in temperature caused by each, as it can start damaging the refractory bricks lining the kiln, requiring frequent replacements. This could be counteracted by using alternate fuels, as their moisture content can lower the flame and kiln temperatures, but further studies are needed.
OXE is still an exciting option, but mainly for older factories. It provides some fuel savings and consequently reduces fuel emissions at a comparatively low cost, helping these plants meet decarbonization goals [
31]. Production lines able to invest in green H
2 could perform OXE with only some additional costs, so in those cases, it does not appear to be worthwhile to implement O
2 production on-site.
Regarding how cement quality could be affected by these methods, there should be no issues for OXE, and it could even lead to some slight improvements [
12]. As for using H
2 in the fuel mix, effectiveness will depend on the fuel composition. If the temperature is close to or slightly higher than normal functioning conditions, it should pose no complications.
Finally, regarding OPEX, the main one for both technologies is electricity, with H2 addition requiring more than nine times the electrical consumption of OXE. Electrolysis also requires pure water, adding to the costs, although this value should be much lower than the electricity costs. OXE, on the other hand, could require replacing the zeolite more often, but this greatly depends on the choice of zeolite, with some being able to withstand the 10-year period considered.


