Abstract
A proton exchange membrane (PEM) electrolyzer is fed with water and powered by electric power to electrochemically produce hydrogen at low operating temperatures and emits oxygen as a by-product. Due to the complex nature of the performance of PEM electrolyzers, the application of an artificial neural network (ANN) is capable of predicting its dynamic characteristics. A handful of studies have examined and explored ANN in the prediction of the transient characteristics of PEM electrolyzers. This research explores the estimation of the transient behavior of a PEM electrolyzer stack under various operational conditions. Input variables in this study include stack current, oxygen pressure, hydrogen pressure, and stack temperature. ANN models using three differing learning algorithms and time delay structures estimated the hydrogen mass flow rate, which had transient behavior from 0 to 1 kg/h, and forecasted better with a higher count (>5) of hidden layer neurons. A coefficient of determination of 0.84 and a mean squared error of less than 0.005 were recorded. The best-fitting model to predict the dynamic behavior of the hydrogen mass flow rate was an ANN model using the Levenberg–Marquardt algorithm with 40 neurons that had a coefficient of determination of 0.90 and a mean squared error of 0.00337. In conclusion, optimally fit models of hydrogen flow from PEM electrolyzers utilizing artificial neural networks were developed. Such models are useful in establishing an agile flow control system for the electrolyzer system to help decrease power consumption and increase efficiency in hydrogen generation.
1. Introduction
Given the current development and investigation of the potential replacement of fossil fuel assets, which are not friendly to the climate and environment, fuel cells have been encouraged by researchers as a suitable alternative for automotive applications. The ongoing depletion of fossil fuel reserves combined with their unpredictable prices are significant factors heightening this need for alternative fuel and power systems. To power a fuel cell electric vehicle, hydrogen can be used as fuel. Hydrogen can electrochemically react with oxygen in the air to produce electric power for the vehicle, and the by-product is basically water vapor.
Although hydrogen is the most abundant element in the world, the extraction and attainment of hydrogen in its elemental form can be quite challenging. Some methods of obtaining hydrogen rely on fossil fuels, whereas an alternative method can utilize electrolysis for splitting water into hydrogen and oxygen. With recent improvements in its technology and electrode materials, the proton exchange membrane (PEM) electrolyzer is still considered to be a better option for making clean and high-purity hydrogen because it is a sustainable process, and it emits basically no carbon emissions compared to hydrocarbon reforming processes. PEM electrolyzers also have benefits over other electrolysis processes such as alkaline and solid oxide electrolysis devices: they are simplistic and compact in design, they are less caustic due to the absence of any caustic electrolyte, and they can operate at lower cell voltages, higher current densities, and higher efficiencies (>80%) [1,2,3]. Another advantage of PEM electrolyzers can be their ability to run at a higher pressure on the cathode side while running at atmospheric pressure at the anode [4]. PEM electrolyzers utilize electrical power to oxidize water to generate oxygen molecules and protons at the anode given that electrochemical reactions occur in porous catalyst layers on both sides of the membrane. Electrons travel through an exterior circuit from the anode to the cathode where, with the protons, which simultaneously travel across the membrane, they reduce into hydrogen [1]. This process is illustrated through the electrochemical equations at each electrode that are given as follows:
Anode: 2H2O → 4H+ + 4e− + O2
Cathode: 4H+ + 4e− → 2H2
The central element within an electrolyzer system is the electrolysis cell stack. In PEM electrolysis, this stack utilizes a solid electrolyte comprising a polymeric membrane, commonly made from materials such as Nafion or other perfluorosulfonic acid polymers. This membrane plays a crucial role, enabling the selective passage of protons while preventing the mixing of hydrogen and oxygen gases. As a result, the electrolysis cell stack effectively splits water into hydrogen and oxygen gases when an electric current is applied, making it a vital component in the production of high-purity hydrogen gas for various applications. Membranes are thin, flexible, and impermeable, resulting in low-resistance cells and compact systems that can work at medium-high absolute pressure and high differential pressure. The membrane enables the transport of protons or H+ cations from the anode to the cathode while ensuring the separation of the H2 and O2 produced. PEM electrolyzers can generally operate around a current density of 2 A/cm2 at an approximate voltage of 2.1 V and in a temperature range of 50–80 °C [4]. However, the acidic cell environment in the sulfonic-based membrane forces the utilization of particular materials. These materials need to resist the corrosive condition of low pH and sustain the applied overvoltage at the anode, which is about 2 V, and at relatively higher current densities. The catalyst used in an electrolyzer system, along with the current collectors and separator plates, must exhibit corrosion resistance. This quality is essential because these components are exposed to the harsh conditions of the electrolysis process. Only a limited number of materials can meet the requirements for corrosion resistance under such circumstances [4]. To accomplish this, elevated loadings of precious metal electrocatalysts, for example, platinum (Pt) or iridium (Ir), and expensive limiting corrosion-resistant components such as bipolar plates are needed [4]. In marketable units, differential pressure technology is adopted such that the anodic side is supplied with water at standard pressure. The cathodic side generates H2 at 25–35 bar [5,6]. The hydrogen output from this unit can limit the contamination with oxygen. Moreover, the unit can reduce the minimum electrical load as well as the necessity of oxygen removal [7]. Furthermore, it is important to incorporate a de-moisturizing system in the electrolyzer setup to remove water. This is necessary because during the electrolysis process, the water introduced on the anode side as an inlet can be partially transported through the membrane to the cathode due to diffusion and electro-osmotic drag. Thus, a de-moisturizing system helps maintain optimal operating conditions and prevent unwanted water accumulation in the cathode compartment [8]. Afshari et al. investigated the effect of membrane thickness on cell voltage and hydrogen crossover. They determined that a thicker membrane results in higher voltage losses and lower hydrogen crossover [9]. Additionally, other researchers have discovered that the decreased gas penetration, facilitated by the solid polymeric membrane in PEM electrolyzers, allows the system to be operated at high pressures. This characteristic is beneficial as it opens up the possibility of running the PEM electrolyzer at elevated pressures, which can have advantages in terms of improved overall system efficiency and higher hydrogen production rates [10]. As a result, the complexity of the PEM electrolyzer system is reduced, eliminating the need for additional stages of hydrogen compression, which is often required in other reforming and electrolysis processes. The inherent gas-tight nature of the solid polymeric membrane allows the PEM electrolyzer to directly produce hydrogen at high pressures, streamlining the overall system and making it more efficient compared to alternative methods that involve separate hydrogen compression stages. This advantage contributes to the growing interest and application of PEM electrolysis in various industries seeking efficient and cost-effective hydrogen production methods [11]. Ogumerem et al. have developed a thermal management strategy to address the thermal degradation issue faced by PEM (proton exchange membrane) electrolysis systems at high temperatures. The strategy aims to regulate the system’s operating temperature within an optimal range to minimize the negative effects of heat on the membrane. By implementing cooling mechanisms or heat dissipation techniques, the approach safeguards the PEM electrolysis system, enhances its performance, and extends the membrane’s lifespan. This work contributes to improving the practical applicability of PEM electrolysis technology in various applications [12].
In PEM electrolyzers, many operating parameters and variables, including support and surface materials, anode and cathode gas diffusion layers, properties of membrane and electrolyte, flow rate, and temperature, are needed to determine the different mechanisms and reaction steps to result in optimal current density and voltage. However, this can be very challenging to accomplish through traditional approaches because of the intricate relationships among these parameters and variables with respect to the electrolyzer performance [1]. Thus, researchers have also looked to improve the performance of hydrogen electrolysis technology through computation since most of the electrolyzer models use conventional analytical and empirical mathematical modeling approaches [13]. The complexity of those models is due to many process variables, which must be tested initially [14]. The accuracy of the models can be quantified and evaluated based on the number of process variables considered and the precision of the curve-fitting methods utilized. In other words, the more process variables accounted for and the higher the accuracy of the curve-fitting techniques applied, the better the measurable accuracy of the models will be [13,14]. To avoid tedious and intensive trial-and-error approaches, numerous studies have been conducted to develop models of multiple input and output variables based on changing dynamic operating environments. Although numerous approaches are used to develop dynamic models, the artificial neural network (ANN) technique has not been utilized for PEM electrolyzer systems, despite promising results from investigations of similar electrochemical systems like fuel cells [15,16,17,18,19,20,21,22]. Given the significant scientific evolution in the application of ANN for various complex systems, this modeling approach is able to manage all complex engineering systems. For diverse input and output parameters, the model can simulate the nonlinear transient features of many systems. The error margin is negligible and the solution can readily converge within a reasonable computational time [23,24,25,26]. Although ANNs can be classified into various types depending on the implementation, the time-series modeling ANN with different learning algorithms and time delay is better suited for dynamic empirical modeling in electrochemical energy system applications [23,27].
This study explores a PEM electrolyzer and models its characteristics. Varying input and output variables were considered under dynamic operating environments. The developed variables formed a set of data to lay the groundwork for the empirical models. Furthermore, they were incorporated to precisely calculate the hydrogen flow rate. The study highlights the influence of major variables on hydrogen production performance, using quantitative and qualitative transient trends. By analyzing these trends, a comprehensive understanding of how these variables affect hydrogen production over time is achieved, enhancing overall comprehension of their impact on the process. The study is presented as follows: Section 1 introduces the topic of PEM electrolyzers and empirical dynamic modeling using ANN, Section 2 describes the ANN and its related learning algorithms and structures, Section 3 details the results of the ANN models and discusses these promising outcomes, and Section 4 presents the closing remarks of this study and future prospects.
2. Procedure
ANN is similar to the nervous system. Applications of this modeling approach have broadened in the past few years due to sizable advancements in solving complex, large-scale problems using emerging technology and expanding computational capability [13,28]. Explanations for many of the challenging practical matters originate within specific timeframes using higher computational resources [28,29].
Figure 1 shows an ANN time series with time delay architecture that consists of input (independent variable); neurons (NRs), including weight, bias, and time delay matrices; and output [18]. An NR is connected to an alternative NR through a weight function w, summed with a bias term b, and an activation function g(·). Figure 1 shows a model that has the input variable vector U and the output variable layer vector . In Figure 1, the input vector U feeds through the time delay block to then go through a weight function matrix and is summed with a bias matrix as the response vector is generated by an activation function g(·), which is a log-sigmoid function in the hidden layer. The neurons in subsequent layers obtain the response from the preceding layer, as illustrated in Figure 1. The response vector then feeds through an output weight function matrix and is summed with an output bias matrix as the response vector is generated by an activation function g(·), which is a linear function in the output layer. Analogously, the number of hidden-layer neurons may vary autonomously. The performance of summation combined with the execution of activation functions to realize the hidden output layer values for a single time step ahead happens because of the structure of the ANN.

Figure 1.
Diagram of ANN model with time delay structure.
For the training and validation of the models, the data obtained from the literature were collected from an experiment carried out at the National Fuel Cell Research Center [30]. The Nel ASA C10 commercial system used in the experiment includes the electrolyzer stack, which is composed of sixty-five cells electrically connected in series to increase the voltage. Table 1 shows the key variables of the electrolyzer stack. The gauge pressure at the cathode side is around the value of 30 bar, where the pressure is reached very quickly after system startup. The gauge pressure at the anode side is between 1.0 and 2.7 bar, and the stack temperature ranges from 45 °C to 60 °C. The dataset was collected while testing the plant under variable load operations [30].

Table 1.
Electrolyzer stack variables used in this study [30].
During the training process, output values are realized based on the input vector. Evaluating the structure of the network shows the input variables used to produce output. A reduction in the error margin implies comparing trained data and output data. When the error margin in the model’s predictions is high, an iterative approach is employed, where the model processes all input parameters again until the error meets the specified conditions. This iterative process aims to continually refine the model’s predictions, reducing the error and improving accuracy in handling complex systems. Upon completing the training process of an artificial neural network (ANN), the network can retain the learned weight values and bias value approximations for subsequent validation. These parameters are vital as they encapsulate the knowledge gained from the training data. During validation, the ANN utilizes these approximate weights and biases to evaluate its performance on new, unseen data, based on the given parameters. By leveraging these learned parameters, the ANN demonstrates its ability to make accurate predictions on data beyond the training phase. During the decision-making process, the model identifies patterns using untrained parameters aligned with the overall training objective. It analyzes data to discover meaningful relationships independently, without prior knowledge. By doing so, the model gains insights into decision-making patterns solely from the training data. The main goal is to lower the error margin between the predicted and experimental values. Various approaches can be employed to substantially reduce the error margin between predicted and experimental data, but the choice of method depends on the user’s judgment and specific needs. One example of such an approach is the mean squared error (MSE) depicted in Equation (3), a commonly used metric for evaluating prediction model performance. Selecting the appropriate method will depend on the user’s understanding of the problem and the specific requirements for improving prediction accuracy.
Data points occurring are denoted as m, prediction as W, and empirical data as X [19]. Errors are useful in calculating the coefficient of determination. Equation (4) summarizes the coefficient of determination mathematically.
The correlation coefficient is is the data averaged and the sum of squares is [28].
The range of is between 0 and 1. A coefficient of determination of 0.7 implies that 70% of the variability is explained by predictor factors, ideal for exceptional fit. To attain a suitably fitted model, it is subjected to fast training of the data and lowering of the error margin. Quick convergence requires training the ANN using Newton’s method. The Hessian matrix (HM), on the other hand, is singular [31]. The Levenberg–Marquardt algorithm (LMA) is an alternative to the Hessian matrix that can resolve issues concerning HM. In LMA, another term, µI, is included to enhance conditioning. Detailed investigations have been conducted to establish suitable values for µ [32]. When values of µ are smaller, Newton’s algorithm is achieved; when values of µ are larger, there is a decline in the gradient.
The scaled conjugate gradient algorithm (SCGA), according to Moller, is preceded by conjugate directions. This approach does not carry out a search for every iteration [33]. The cost of running such simulations is high compared to others. SCGA was developed mainly to eliminate the need for difficult line searches. Whenever SCGA is utilized, the MATLAB® function ‘trainscg’ adjusts the weight and bias values of the network [27]. The size of each step is approximated with the assistance of different techniques. Equation (5) shows the term in second order:
represents the scalar unit and is subjected to the sign of .
represents the vector in space , denotes the global error function, is the gradient of error, is the quadratic approximation, and are weight vectors.
can be revised using Equation (7):
When ; when , .
is a comparative value, deduced using Equation (8):
The Bayesian estimation and regularization algorithm (BERA) captures the Hessian matrix [27]. Equation (9) represents the objective function:
The BERA considers weight in relation to the network as subjectively selected parameters. Equation (10) is the probability function for an array w:
M represents the ANN model used. is the prior density and is the likelihood function.
3. Results and Discussion
The ANN time series model fit was examined using the MATLAB Deep Learning Toolbox®. Four input variables were considered for this study, along with the output variable of hydrogen flow. The developed models utilized >90% of over 1000 datasets for training the model and <10% for testing and validation of the model. The number of hidden layer neurons, the type of learning algorithm, and the inclusion of the time delay structure, shown in Figure 2, were adjusted to obtain different models to find the best-fitting one. Table 2 presents a comparison of the three different algorithms of the ANN time series or dynamic model with time delay using the R2 and the mean squared error. Table 3 shows another comparison of the three different algorithms of the ANN time series or dynamic model without time delay. In both tables, the type of algorithm is shown in Column 1, the count of hidden neurons is presented in Column 2, the R2 results are in Column 3, and the mean squared error values are in Column 4. Figure 3 shows the empirical and model responses of the hydrogen mass flow rate for the ANN models with 1, 10, 20, and 40 hidden neurons and time delay using LMA. Figure 4 captures the experimental and model data of the hydrogen flow rate for the ANN models with varying hidden neurons and time delay using BERA. Figure 5 depicts the experimental and model data of the hydrogen mass flow rate for the ANN models with varying hidden neurons and time delay using SCGA. Figure 6 shows the empirical and model responses of the hydrogen mass flow rate for the ANN models with 1, 10, 20, and 40 hidden neurons and without time delay using LMA. Figure 7 includes plots of empirical and model responses of the hydrogen mass flow rate for the ANN models with varying hidden neurons and without time delay using BERA. Figure 8 shows plots of empirical and model responses of the hydrogen mass flow rate for the ANN models with varying hidden neurons and without time delay using SCGA. In Figure 3, Figure 4, Figure 5, Figure 6, Figure 7 and Figure 8, the y-axis is the hydrogen mass flow rate in kg/h and the x-axis is time in minutes.

Figure 2.
Layout of ANN model with time delay structure in MATLAB Deep Learning Toolbox®.

Table 2.
Analysis and comparison of model results for ANN time series with time delay structure.

Table 3.
Analysis and comparison of model results for ANN time series with no time delay.
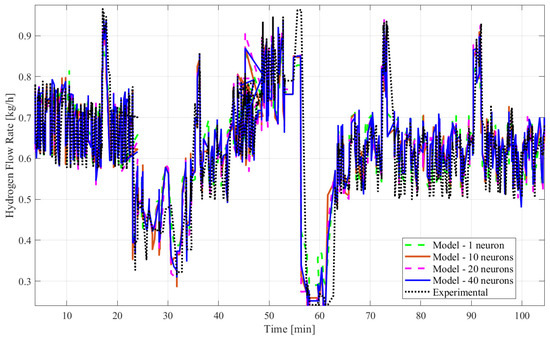
Figure 3.
Plots of empirical and model responses of the hydrogen mass flow rate predicted by ANN time series with time delay structure and LMA (1, 10, 20, and 40 neurons).
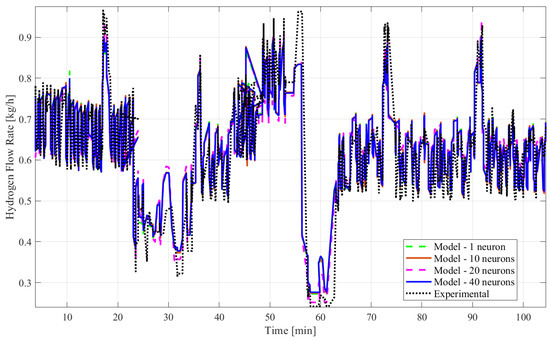
Figure 4.
Empirical and model data of the hydrogen mass flow rate predicted by ANN time series with time delay structure and BERA with 1, 10, 20, and 40 neurons.
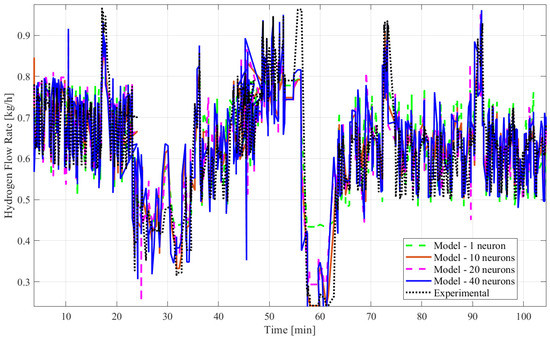
Figure 5.
Plots of experimental and model responses of the hydrogen mass flow rate predicted by ANN time series with time delay structure and SCGA with 1, 10, 20, and 40 hidden neurons.
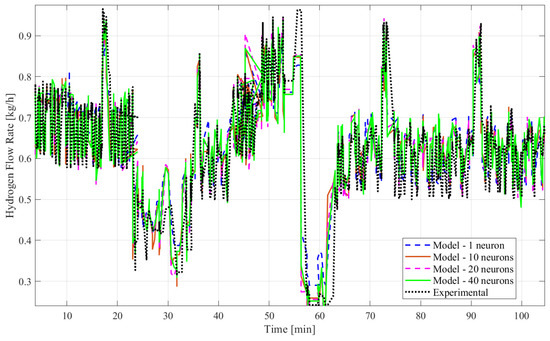
Figure 6.
Plots of experimental and model data of the hydrogen mass flow rate predicted by ANN time series without time delay structure with LMA (1, 10, 20, and 40 neurons).
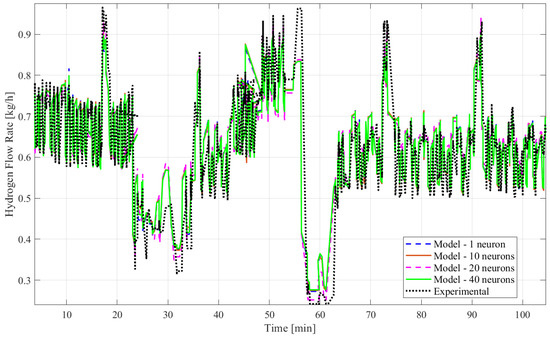
Figure 7.
Plots of experimental and model results of the hydrogen mass flow rate predicted by ANN time series without time delay structure and BERA with 1, 10, 20, and 40 hidden neurons.
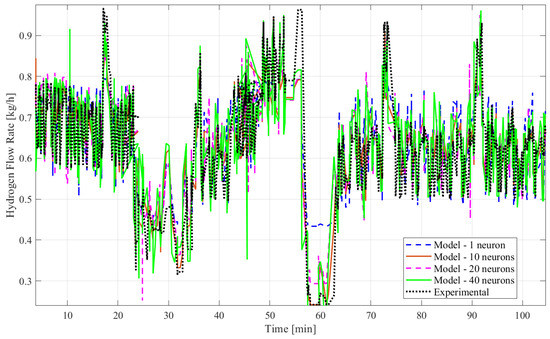
Figure 8.
Experimental and model data of the hydrogen mass flow rate predicted by ANN time series without time delay structure with SCGA (1, 10, 20, and 40 neurons).
Based on all tables and figures, the majority of the models with varying numbers of hidden neurons as well as different algorithms and structures can reasonably approximate the transient data. Models having more hidden neurons (10 to 40) for all three algorithms performed better than models with lower or much higher numbers of hidden neurons (<5 or >50) based on the R2 and MSE values, which are show in the blue highlighted rows in Table 2 and Table 3. A model with a lower number of hidden neurons (<5) is likely to have a poor fit compared to other models due to fewer weights and biases. This is illustrated in Table 2 with the example of the ANN model with the time delay structure, SCGA, and one hidden neuron, which obtained a coefficient of determination of 0.7829, much lower than 0.85. An ANN model with a very high number of neurons (>50) can suffer from overfitting, indicated by a low coefficient of determination, as shown by the ANN model without the time delay structure, SCGA, and 50 hidden neurons, which had an R2 of 0.0224. Moreover, models using LMA consistently predict hydrogen flow dynamic behavior more accurately, with a coefficient of determination higher than 0.9 for 10, 20, and 40 hidden neurons, as highlighted in Table 2 and Table 3, compared to the other algorithms for a similar number of hidden neurons. From Table 2 and Table 3, the best-fitting model is the dynamic ANN model using LMA and 40 hidden neurons, which had a coefficient of determination of 0.9013 and a mean squared error of 0.003371, which is less than 1%.
Although several investigations have been conducted on electrolyzers, there are very few research efforts to estimate dynamic flow behavior [13,14,26]. Becker et al. developed a set of models using Adaptive Neuro-Fuzzy Inference Systems (ANFIS) for predicting the hydrogen volumetric flow rate of a small-scale electrolyzer (about 5 to 10 L/min of hydrogen) along with stack and system efficiencies [13]. The results were consistent and quite accurate, with low error percentages (<5%) for flow rate and efficiency, which are comparable to the results of this study for the modeling technique [13]. Unlike their empirical modeling method and results, this study looks at the hydrogen mass flow rate for a larger-scale PEM electrolyzer system (about 22 to 200 L/min of hydrogen) using ANN, not ANFIS. The same researchers conducted another study on predictive models using neural networks for hydrogen flow rate, electrolyzer system efficiency, and stack efficiency [26]. A comprehensive experimental database was obtained using the same electrolyzer system. The models were found to be reliable, with an accuracy of <3% compared with empirical values. Although the results have the potential for further studies with the implementation of virtual sensors instead of physical sensors in such systems, their study is again limited to small-scale electrolyzers and plots data as a function of indexed data instead of time; thus, the results do not provide a clear picture of the dynamic behavior of the system. In another study, the dynamic voltage behavior of a PEM electrolyzer with a three-cell stack (100 cm2 of active area) was modeled using ANN with a reliable accuracy of <2% with two inputs of electrolyzer electric current and operating temperature in each electrolyzer [14]. Although the results seem to be reliable, the study only considers two input variables, unlike this study, which considers four variables to account for more variation and different operating conditions with less restriction. Moreover, the goal of their study was to explore the hydrogen production rate, yet the focus of the results showed voltage behavior for changes in current, unlike this study, which shows the hydrogen mass flow rate directly. Although there are a few related studies on PEM electrolyzer model development using ANN or similar machine learning methods, the present study does not compare to what is in the literature.
4. Conclusions
The study looked at the use of artificial neural network modeling with varying learning algorithms and time structures to predict transient electrolyzer performance. The models are similar and stable in relation to the experimental datasets. Through this study, we found the following:
- The majority of the dynamic ANN models showed responses with relatively high coefficients of determination (greater than 0.8).
- ANN models using any of the three algorithms with the number of hidden neurons ranging from 10 to 40 and inclusion or exclusion of time delay showed a very good fit.
- Dynamic ANN models with 10 to 40 hidden neurons combined with the LMA algorithm had better performance, with most coefficient of determination values being above 0.9.
- With a mean squared error of only 0.00337 and a coefficient of determination of 0.9013, the most suitable ANN model to approximate the hydrogen mass flow rate was the ANN model with the LMA algorithm and 40 neurons. However, the models with 10 and 20 neurons were very close, each with a coefficient of determination of 0.9.
Moreover, most of these modeling methods can be effective computational instruments in designing a robust control architecture for electrolysis systems to boost efficiency and operating stabilization in actual dynamic environments. The best-fitting models for predicting the hydrogen flow of the electrolyzer using ANN time series can be utilized to design and optimize control strategies to enhance the flow and power management of PEM electrolyzer systems. This will lead to lower power consumption and higher efficiency of similar electrolyzer systems.
Author Contributions
Conceptualization, M.B. and T.W.; methodology, T.W. and M.B.; formal analysis, M.B.; validation, M.B.; investigation, M.B. and M.A.B.; resources, M.B.; data curation, M.B.; writing—original draft preparation, M.B., M.A.B. and T.W.; writing—review and editing, M.B., M.A.B. and T.W.; visualization, M.B. All authors have read and agreed to the published version of the manuscript.
Funding
This research received no external funding.
Data Availability Statement
The experimental data presented in this study are available in [30].
Conflicts of Interest
The authors declare no conflict of interest.
Nomenclature
| Artificial neural network | |
| Proton exchange membrane | |
| Weight function | |
| Bias | |
| g(·) | Activation function |
| Input variable | |
| Output variable | |
| Weight function matrix | |
| Biase function matrix | |
| Response vector | |
| Output weight function matrix | |
| Mean squared error | |
| Coefficient of determination | |
| Hidden neurons | |
| Data points | |
| Predicted data | |
| Empirical data | |
| Averaged data | |
| Range between 0 and 1 | |
| HM | Hessian matrix |
| LMA | Levenberg–Marquardt algorithm |
| SCGA | Scaled conjugate gradient algorithm |
| Scalar unit | |
| Vector in space | |
| Global error function | |
| BERA | Bayesian estimation and regularization algorithm |
References
- Günay, M.E.; Tapan, N.A. Analysis of PEM and AEM electrolysis by neural network pattern recognition, association rule mining and LIME. Energy AI 2023, 13, 100254. [Google Scholar] [CrossRef]
- Stempien, J.; Sun, Q.; Chan, S. Solid oxide electrolyzer cell modelling: A review. J. Power Technol. 2013, 93, 216–246. [Google Scholar]
- Ruuskanen, V.; Koponen, J.; Sillanpää, T.; Huoman, K.; Kosonen, A.; Niemelä, M.; Ahola, J. Design and implementation of a power-hardware-in-loop simulator for water electrolysis emulation. Renew. Energy 2018, 119, 106–115. [Google Scholar] [CrossRef]
- Miller, H.A.; Loos, S.; Bernäcker, C.; Weißgärber, T.; Röntzsch, L.; Meier-Haack, J. Green hydrogen from anion exchange membrane water electrolysis: A review of recent developments in critical materials and operating conditions. Sustain. Energy Fuels 2020, 4, 2114–2133. [Google Scholar] [CrossRef]
- Grigoriev, S.; Porembskiy, V.; Korobtsev, S.; Fateev, V.; Auprêtre, F.; Millet, P. High pressure PEM water electrolysis and corresponding safety issues. Int. J. Hydrogen Energy 2011, 36, 2721–2728. [Google Scholar] [CrossRef]
- Deutsches Zentrum für Luft-und Raumfahrt (DLR) (Germany). Water Electrolyzer Technology with Wide Operation Range and Reduced Cost (PRETZEL). Deutsches Zentrum für Luft-und Raumfahrt (DLR) (Germany). 16 November 2021. Available online: https://pretzel-electrolyzer.eu/ (accessed on 20 June 2023).
- Carmo, M.; Fritz, D.; Mergel, J.; Stolten, D. A comprehensive review on PEM water electrolysis. Int. J. Hydrogen Energy 2013, 38, 4901–4934. [Google Scholar] [CrossRef]
- Bessarabov, D.; Wang, H.; Li, H.; Zhao, N. Electrolysis for Hydrogen Production: Principle and Application; CRC Press: Boca Raton, FL, USA, 2016. [Google Scholar]
- Afshari, E.; Khodabakhsh, S.; Jahantigh, N.; Toghyani, S. Performance assessment of gas crossover phenomenon and water transport mechanism in high pressure PEM electrolyzer. Int. J. Hydrogen Energy 2021, 46, 11029–11040. [Google Scholar] [CrossRef]
- Schalenbach, M.; Carmo, M.; Fritz, D.; Mergel, J.; Stolten, D. Pressurized PEM water electrolysis: Efficiency and gas crossover. Int. J. Hydrogen Energy 2013, 38, 14921–14933. [Google Scholar] [CrossRef]
- Scheepers, F.; Stähler, M.; Stähler, A.; Rauls, E.; Müller, M.; Carmo, M.; Lehnert, W. Improving the efficiency of PEM Electrolyzers through Membrane-Specific Pressure Optimization. Energies 2020, 13, 612. [Google Scholar] [CrossRef]
- Ogumerem, G.; Pistikopoulos, E. Parametric optimization proton exchange and control for a smart proton exchange membrane water electrolysis (PEMWE) system. J. Process Control 2020, 91, 37–49. [Google Scholar] [CrossRef]
- Becker, S.; Karri, V. Predictive models for PEM-electrolyzer performance using adaptive neuro-fuzzy inference systems. Int. J. Hydrogen Energy 2010, 35, 9963–9972. [Google Scholar] [CrossRef]
- Chavez-Ramirez, A.U.; Munoz-Guerrero, R.; Ramirez-Arredondo, J.; Ornelas, R.; Arriaga, L.; Siracusano, S.; Brunaccini, G.; Napoli, G.; Antonucci, V. Arico Dynamic Model of a PEM Electrolyzer based on Artificial Neural Networks. J. New Mater. Electrochem. Syst. 2011, 14, 113–119. [Google Scholar] [CrossRef]
- Abdin, Z.; Webb, C.; Gray, E. Modelling and simulation of a proton exchange membrane (PEM) electrolyser cell. Int. J. Hydrogen Energy 2015, 40, 13243–13257. [Google Scholar] [CrossRef]
- Biswas, M.; Mwara, K. Model Development of Solid Oxide Fuel Cell Thermal Performance Using Artificial Neural Network. In Proceedings of the 2020 Spring Meeting & 16th Global Congress on Process Safety, Virtual, 17–21 August 2020. [Google Scholar]
- Biswas, M.; Mudiraj, S.; Lear, W.; Crisalle, O. Systematic approach for modeling methanol mass transport on the anode side of direct methanol fuel cells. Int. J. Hydrogen Energy 2014, 39, 8009–8025. [Google Scholar] [CrossRef]
- Wilberforce, T.; Biswas, M. A study into Proton Exchange Membrane Fuel Cell power and voltage prediction using Artificial Neural Network. Energy Rep. 2022, 8, 12843–12852. [Google Scholar] [CrossRef]
- Lee, B.; Park, K.; Kim, H. Dynamic simulation of PEM water electrolysis and comparison with experiments. Int. J. Electrochem. Sci. 2013, 8, 235–248. [Google Scholar] [CrossRef]
- Falcão, D.; Pinto, A. A review on PEM electrolyzer modelling: Guidelines for beginners. J. Clean. Prod. 2020, 261, 121184. [Google Scholar] [CrossRef]
- Ma, Z.; Witteman, L.; Wrubel, J.; Bender, G. A comprehensive modeling method for proton exchange membrane electrolyzer development. Int. J. Hydrogen Energy 2021, 46, 17627–17643. [Google Scholar] [CrossRef]
- Hernández-Gómez, Á.; Ramirez, V.; Guilbert, D.; Saldivar, B. Development of an adaptive static-dynamic electrical model based on input electrical energy for PEM water electrolysis. Int. J. Hydrogen Energy 2020, 45, 18817–18830. [Google Scholar] [CrossRef]
- Hagan, M.; Demuth, H.; Beale, M. Neural Network Design; PWS Publishing: Boston, MA, USA, 1997. [Google Scholar]
- Tafazoli, M.; Baseri, H.; Alizadeh, E.; Shakeri, M. Modeling of direct methanol fuel cell using the artificial neural network. J. Fuel Cell Sci. Technol. 2013, 10, 041007. [Google Scholar] [CrossRef]
- Mohamed; Ibrahem, H.; Yang, R.; Kim, K. Optimization of Proton Exchange Membrane Electrolyzer Cell Design Using Machine Learning. Energies 2022, 15, 6657. [Google Scholar] [CrossRef]
- Becker, S.; Karri, V. Implementation of neural network models for parameter estimation of a PEM-electrolyzer. J. Adv. Comput. Intell. 2010, 14, 735–740. [Google Scholar] [CrossRef]
- The MathWorks Inc. How Dynamic Neural Networks Work. The MathWorks Inc. 28 April 2023. Available online: https://www.mathworks.com/help/deeplearning/ug/how-dynamic-neural-networks-work.html (accessed on 29 June 2023).
- Biswas, M.; Robinson, M.; Fumo, N. Prediction of residential building energy consumption: A neural network approach. Energy 2016, 117, 84–92. [Google Scholar] [CrossRef]
- Robinson, M.; Manry, M. Two-stage second order training in feedforward neural networks. In Proceedings of the Twenty-Sixth International FLAIRS Conference, St. Pete Beach, FL, USA, 22–24 May 2013. [Google Scholar]
- Crespi, E.; Guandalini, G.; Mastropasqua, L.; Campanari, S.; Brouwer, J. Experimental and theoretical evaluation of a 60 kW PEM electrolysis system for flexible dynamic operation. Energy Convers. Manag. 2023, 277, 116622. [Google Scholar] [CrossRef]
- Wille, J. On the structure of the Hessian matrix in feedforward networks and second derivative methods. In Proceedings of the International Conference on Neural Networks, Houston, TX, USA, 12 June 1997. [Google Scholar]
- Dennis, J., Jr.; Schnabel, R. Numerical Methods for Unconstrained Optimization and Nonlinear Equations; Society for Industrial and Applied Mathematics: Philadelphia, PA, USA, 1996. [Google Scholar]
- Møller, M.F. A scaled conjugate gradient algorithm for fast supervised learning. Neural Netw. 1993, 6, 525–533. [Google Scholar] [CrossRef]
Disclaimer/Publisher’s Note: The statements, opinions and data contained in all publications are solely those of the individual author(s) and contributor(s) and not of MDPI and/or the editor(s). MDPI and/or the editor(s) disclaim responsibility for any injury to people or property resulting from any ideas, methods, instructions or products referred to in the content. |
© 2023 by the authors. Licensee MDPI, Basel, Switzerland. This article is an open access article distributed under the terms and conditions of the Creative Commons Attribution (CC BY) license (https://creativecommons.org/licenses/by/4.0/).