
Simulation of Biogas Conversion Using Porous Solid Oxide Electrochemical Cells: Virtual Prototyping

 , , and
Abstract
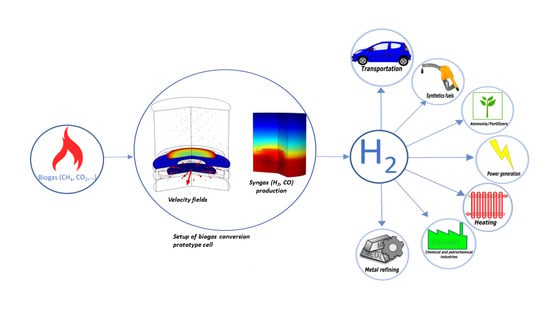
1. Introduction
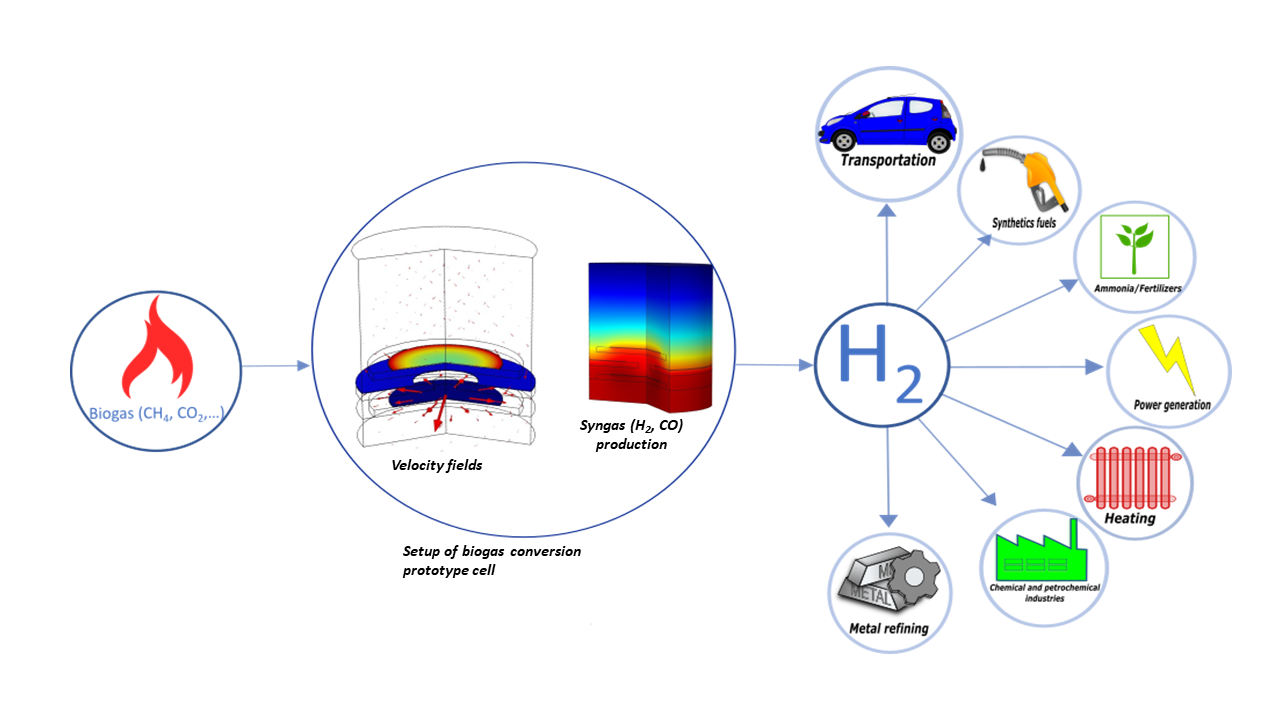
2. Cell Design and Operating Conditions of Simulations
- A catalytic layer of cermet CGO–Ni cermet (CGO: cerium-gadolinium oxide) with doped Ir, noted as Ir–cermet;
- A porous membrane of YSZ (YSZ: yttria-stabilized zirconia).
3. Model and Assumptions
3.1. Momentum Balance
3.2. Mass Balance
3.3. Heat Balance
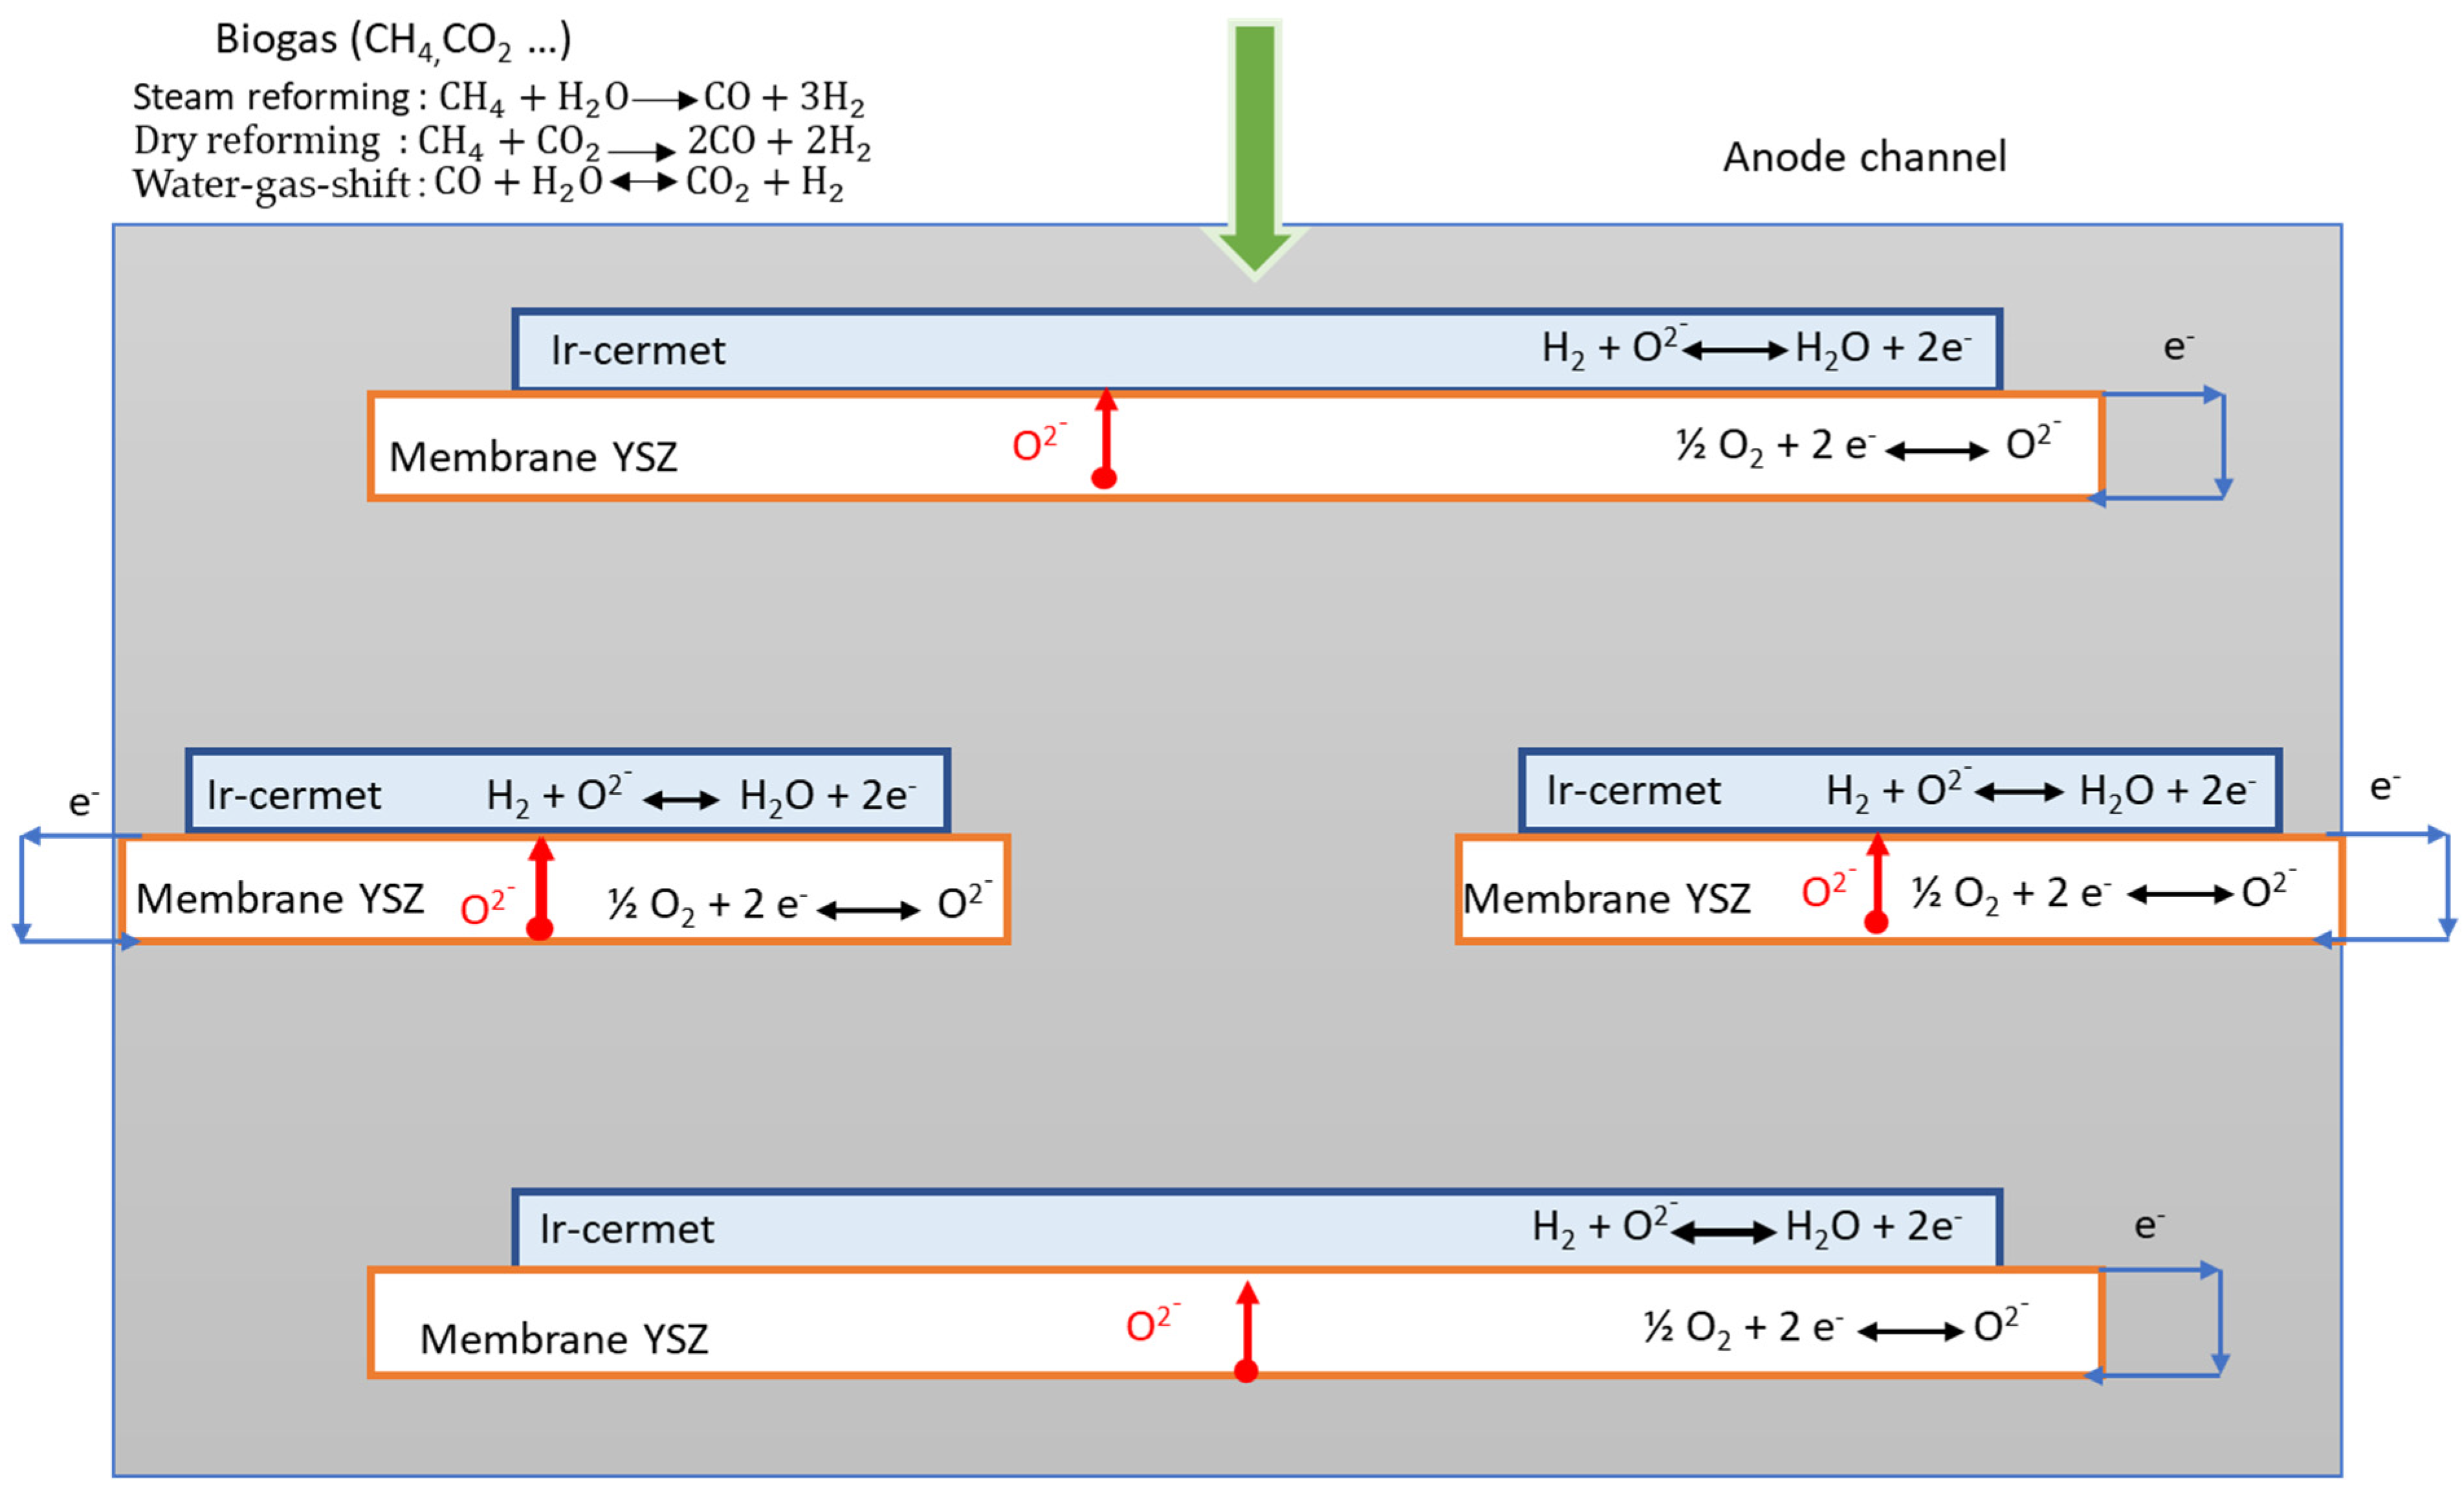
4. Results and Discussion
5. Conclusions
Supplementary Materials
Author Contributions
Funding
Institutional Review Board Statement
Informed Consent Statement
Data Availability Statement
Conflicts of Interest
Nomenclature
| Total current density of cell, | |
| Anodic current transfer, | |
| Pressure, Pa | |
| Atmospheric pressure, Pa | |
| Partial pressure species i, Pa | |
| Kinetic of dry reforming, mol·m−3·s−1 | |
| Kinetic of water–gas shift, mol·m−3·s−1 | |
| Kinetic of steam reforming, mol·m−3·s−1 | |
| Rate, m/s | |
| Mass fraction of species i | |
| Molar fraction of species i | |
| Molar heat capacity of species at constant pressure, J·mol−1·K−1 | |
| Binary coefficient diffusion, | |
| Heat generated from dry reforming, W/m3 | |
| Heat generated from water–gas shift, W/m3 | |
| Heat generated from steam reforming, W/m3 | |
| Heat generated from electrochemical reaction, W/m3 | |
| Heat generated from Joule effect of YSZ, W/m3 | |
| Ji | Molar flux density of species i, kg·m−2s−1 |
| Mi | Molecular weight of species i, g/mol |
| Ri | Mass sources of species i, kg·m−3s−1 |
| Heat sources, W/m3 | |
| Thermal conductivity, mW·m−1·K−1 | |
| Dynamic viscosity, Pa·s | |
| Density, kg·m−3 | |
| Heat flow, W·m−2 | |
| Reaction enthalpy at temperature T, J/mol |
References
- Kamalimeera, N.; Kirubakaran, V. Prospects and restraints in biogas fed SOFC for rural energization: A critical review in indian perspective. Renew. Sustain. Energy Rev. 2021, 143, 110914. [Google Scholar] [CrossRef]
- Gandiglio, M.; Lanzini, A.; Santarelli, M.; Acri, M.; Hakala, T.; Rautanen, M. Results from an industrial size biogas-fed SOFC plant (the DEMOSOFC project). Int. J. Hydrog. Energy 2019, 45, 5449–5464. [Google Scholar] [CrossRef]
- Maurya, R.; Tirkey, S.R.; Rajapitamahuni, S.; Ghosh, A.; Mishra, S. Recent Advances and Future Prospective of Biogas Production. In Advances in Feedstock Conversion Technologies for Alternative Fuels and Bioproducts; Elsevier: Amsterdam, The Netherlands, 2019; pp. 159–178. [Google Scholar] [CrossRef]
- Outlook for Biogas and Biomethane: Prospects for Organic Growth. IEA, Mars 2020. [En Ligne]. Available online: https://www.iea.org/reports/outlook-for-biogas-and-biomethane-prospects-for-organic-growth (accessed on 1 March 2020).
- Rajkumar, R.; Kurinjimalar, C. Food wastes/residues: Valuable source of energy in circular economy. J. Handb. Biofuels 2021, 7, 147–163. [Google Scholar] [CrossRef]
- Jung, S.; Lee, J.; Moon, D.H.; Kim, K.-H.; Kwon, E.E. Upgrading biogas into syngas through dry reforming. Renew. Sustain. Energy Rev. 2021, 143, 110949. [Google Scholar] [CrossRef]
- Ren, J.; Liu, Y.-L.; Zhao, X.-Y.; Cao, J.-P. Methanation of syngas from biomass gasification: An overview. Int. J. Hydrog. Energy 2019, 45, 4223–4243. [Google Scholar] [CrossRef]
- Klein, J.-M.; Bultel, Y.; Georges, S.; Pons, M. Modeling of a SOFC fuelled by methane: From direct internal reforming to gradual internal reforming. Chem. Eng. Sci. 2007, 62, 1636–1649. [Google Scholar] [CrossRef]
- Chen, X.; Jiang, J.; Li, K.; Tian, S.; Yan, F. Energy-efficient biogas reforming process to produce syngas: The enhanced methane conversion by O2. Appl. Energy 2017, 185, 687–697. [Google Scholar] [CrossRef]
- Bove, R.; Ubertini, S. Modeling solid oxide fuel cell operation: Approaches, techniques and results. J. Power Sources 2006, 159, 543–559. [Google Scholar] [CrossRef]
- Aicart, J.; Petitjean, M.; Laurencin, J.; Tallobre, L.; Dessemond, L. Accurate predictions of H2O and CO2 co-electrolysis outlet compositions in operation. Int. J. Hydrog. Energy 2015, 40, 3134–3148. [Google Scholar] [CrossRef]
- Papurello, D.; Canuto, D.; Santarelli, M. CFD model for tubular SOFC stack fed directly by biomass. Int. J. Hydrog. Energy 2022, 47, 6860–6872. [Google Scholar] [CrossRef]
- Georges, S.; Nóbrega, S.D.; Cheah, S.K.; Steil, M.C.; Bultel, Y.; Rieu, M.; Viricelle, J.-P.; Gelin, P. Effect of Catalyst Layer and Fuel Utilization on the Durability of Direct Methane SOFC. ECS Trans. 2015, 69, 51–59. [Google Scholar] [CrossRef]
- Deseure, J.; Aicart, J. Solid Oxide Steam Electrolyzer: Gas Diffusion Steers the Design of Electrodes. In Electrodialysis; Yonar, T., Ed.; IntechOpen: London, UK, 2020. [Google Scholar] [CrossRef]
- Bedogni, S.; Campanari, S.; Iora, P.; Montelatici, L.; Silva, P. Experimental analysis and modeling for a circular-planar type IT-SOFC. J. Power Sources 2007, 171, 617–625. [Google Scholar] [CrossRef]
- Aziz, M.A.A.; Jalil, A.A.; Wongsakulphasatch, S.; Vo, D.-V.N. Understanding the role of surface basic sites of catalysts in CO2 activation in dry reforming of methane: A short review. Catal. Sci. Technol. 2019, 10, 35–45. [Google Scholar] [CrossRef]
- Daun, K.; Beale, S.; Liu, F.; Smallwood, G. Radiation heat transfer in planar SOFC electrolytes. J. Power Sources 2006, 157, 302–310. [Google Scholar] [CrossRef]
- Lehnert, W.; Meusinger, J.; Thom, F. Modelling of gas transport phenomena in SOFC anodes. J. Power Sources 2000, 87, 57–63. [Google Scholar] [CrossRef]
- Richardson, J.; Paripatyadar, S. Carbon dioxide reforming of methane with supported rhodium. Appl. Catal. 1990, 61, 293–309. [Google Scholar] [CrossRef]
- Laurencin, J.; Kane, D.; Delette, G.; Deseure, J.; Lefebvre-Joud, F. Modelling of solid oxide steam electrolyser: Impact of the operating conditions on hydrogen production. J. Power Sources 2011, 196, 2080–2093. [Google Scholar] [CrossRef]
- Klein, J.-M.; Georges, S.; Bultel, Y. Modeling of a SOFC Fueled by Methane: Anode Barrier to Allow Gradual Internal Reforming without Coking. J. Electrochem. Soc. 2008, 155, B333–B339. [Google Scholar] [CrossRef]
- Bird, R.B.; Stewart, W.E.; Lightfoot, E.N. Transport Phenomena, Revised 2nd ed.; Wiley: New York, NY, USA, 2007; pp. 1–928. Available online: https://isbndb.com/book/9780470115398 (accessed on 5 October 2022).
- Reid, R.C.; Prausnitz, J.M.; Poling, B.E. The Properties of Gases and Liquids; McGraw-Hill: New York, NY, USA, 1989; Volume 4. Available online: https://www.osti.gov/biblio/6504847 (accessed on 5 October 2022).
- Fuller, E.N.; Schettler, P.D.; Giddings, J.C. New method for prediction of binary gas phase diffusion coefficients. Ind. Eng. Chem. 1966, 58, 18–27. [Google Scholar] [CrossRef]
- Le neindre, B. Mesure de la conductivité thermique des liquides et des gaz. Tech. L’ingénieur Mes. Gd. 1996, RC3, R2920. [Google Scholar] [CrossRef]
- Merlin, G.; Boileau, H. Anaerobic Digestion: Types, Processes and Environmental ImpactEdition: Series: Environmental Science, Engineering and Technology Waste and Waste Management. In Anaerobic Digestion: Types, Processes, and Environmental Impact, 4th ed.; Torrles, A., Ed.; Nova Science Publishers: New York, NY, USA, 2013; pp. 1–27. [Google Scholar]
- Henze, M. (Ed.) Biological Wastewater Treatment: Principles, Modelling and Design; IWA Pub: London, UK, 2008. [Google Scholar]
- Merlin, G.; Kohler, F.; Bouvier, M.; Lissolo, T.; Boileau, H. Importance of heat transfer in an anaerobic digestion plant in a continental climate context. Bioresour. Technol. 2012, 124, 59–67. [Google Scholar] [CrossRef] [PubMed]
- Merlin, G.; Outin, J.; Boileau, H. Co-Digestion of Extended Aeration Sewage Sludge with Whey, Grease and Septage: Experimental and Modeling Determination. Sustainability 2021, 13, 9199. [Google Scholar] [CrossRef]
- Harun, N.F.; Tucker, D.; Ii, T.A.A. Technical challenges in operating an SOFC in fuel flexible gas turbine hybrid systems: Coupling effects of cathode air mass flow. Appl. Energy 2017, 190, 852–867. [Google Scholar] [CrossRef]
- Sezer, H.; Mason, J.H.; Celik, I.B.; Yang, T. Three-dimensional modeling of performance degradation of planar SOFC with phosphine exposure. Int. J. Hydrog. Energy 2020, 46, 6803–6816. [Google Scholar] [CrossRef]
- Cavaignac, R.S.; Ferreira, N.L.; Guardani, R. Techno-economic and environmental process evaluation of biogas upgrading via amine scrubbing. Renew. Energy 2021, 171, 868–880. [Google Scholar] [CrossRef]


| Membrane | Catalyst Layer | Tube Size | Channel Height | |
|---|---|---|---|---|
| Radius (mm) | 19/2 | 7 | 11 | |
| Height (mm) | 1 | 0.1 | 26 | 1.5 |
| Number of Elements | Minimum Element Quality | Average Element Quality | Element Area Ratio | Mesh Area (m2) |
|---|---|---|---|---|
| 28,560 | 0.0896 | 0.8989 | 5.051 × 10⁻⁵ | 2.86× 10⁻⁴ |
| Reactions | Equations | Kinetics | Localizations |
|---|---|---|---|
| Steam Reforming | rvr (mol·m−3·s−1) | Ni-Ir Surface | |
| Dry Reforming | rdr (mol·m−3·s−1) | Ni-Ir Surface | |
| Water–Gas shift | rgs (mol·m−3·s−1) | In Gas Phase | |
| Hydrogen Oxidation | ia (A·m−3) | CGO-Cermet/YSZ Interface |
| Molar Reaction Speeds | |
|---|---|
| Anode Side (kg·m−3·s−1) * | |
| RCH4 | (−rvr − rdr) MCH4 |
| RCO2 | (rgs − rdr) MCO2 |
| RCO | (rvr − rgs + 2rdr) MCO |
| RH2O | (−rvr − rgs + ) MH2O |
| RH2 | (3rvr + rgs + 2rdr − ) MH2 |
| Heat Sources | Expression (W/m3) | Location |
|---|---|---|
| Chemical Energies | ||
| Steam Reforming, | Ir–CGO Cermet Volume | |
| Dry Reforming, | Ir–CGO Cermet Volume | |
| Water-Gas Shift, | In Gas Phase | |
| Electrochemical Energies: in this work, the main part of the electrochemical irreversibility process was due to the Joule effect. | ||
| Joule Effect *, | In YSZ Porous Material | |
| Mass Fraction of Mixture % CH4:CO2:H2O | Consumption Rate % | Production Rate % | ||
|---|---|---|---|---|
| ΔCH4 | ΔCO2 | ΔH2 | ΔCO | |
| A 28:70:1 | 99.99 | 63.64 | 99.37 | 99.99 |
| B 34:62:1 | 98.9 | 75.85 | 99.48 | 99.99 |
| C 40:50:1 | 90.99 | 85.22 | 99.5 | 99.99 |
| D 49:49:1 | 82.85 | 87.24 | 99.51 | 99.99 |
| E 50:40:1 | 79.31 | 94.2 | 99.48 | 99.99 |
| F 60:39:1 | 72.87 | 96.1 | 99.5 | 99.99 |
| G 70:28:1 | 54.66 | 99.99 | 99.37 | 99.99 |
Publisher’s Note: MDPI stays neutral with regard to jurisdictional claims in published maps and institutional affiliations. |
© 2022 by the authors. Licensee MDPI, Basel, Switzerland. This article is an open access article distributed under the terms and conditions of the Creative Commons Attribution (CC BY) license (https://creativecommons.org/licenses/by/4.0/).
Share and Cite
Kamara, K.P.; Merlin, G.; Bamba, G.; Druart, F.; Deseure, J. Simulation of Biogas Conversion Using Porous Solid Oxide Electrochemical Cells: Virtual Prototyping. Hydrogen 2022, 3, 488-500. https://doi.org/10.3390/hydrogen3040031
Kamara KP, Merlin G, Bamba G, Druart F, Deseure J. Simulation of Biogas Conversion Using Porous Solid Oxide Electrochemical Cells: Virtual Prototyping. Hydrogen. 2022; 3(4):488-500. https://doi.org/10.3390/hydrogen3040031
Chicago/Turabian StyleKamara, Konakpo Parfait, Gérard Merlin, Gaoussou Bamba, Florence Druart, and Jonathan Deseure. 2022. "Simulation of Biogas Conversion Using Porous Solid Oxide Electrochemical Cells: Virtual Prototyping" Hydrogen 3, no. 4: 488-500. https://doi.org/10.3390/hydrogen3040031
APA StyleKamara, K. P., Merlin, G., Bamba, G., Druart, F., & Deseure, J. (2022). Simulation of Biogas Conversion Using Porous Solid Oxide Electrochemical Cells: Virtual Prototyping. Hydrogen, 3(4), 488-500. https://doi.org/10.3390/hydrogen3040031