Article

Experimental Study on Hydrogen Recombination Characteristics of a Passive Autocatalytic Recombiner during Spray Operation

Intelligent Accident Mitigation Research Division, Korea Atomic Energy Research Institute, Daejeon 34057, Korea
*
Author to whom correspondence should be addressed.
Hydrogen 2022, 3(2), 197-217; https://doi.org/10.3390/hydrogen3020013
Submission received: 12 April 2022 / Revised: 10 May 2022 / Accepted: 12 May 2022 / Published: 18 May 2022

Abstract

:
During an accident, hydrogen distribution in a containment building of a nuclear power plant (NPP) and characteristics of hydrogen depletion by passive autocatalytic recombiners (PARs) differ depending on the thermal-hydraulic behaviors occurring in the containment. A spray system installed in the NPP containment to control the pressure in accident conditions may interact with PAR operations. This study intended to experimentally evaluate the hydrogen removal characteristics of a grid-type PAR when a spray was operating. For the experimental simulation of hydrogen recombination characteristics of the PAR affected by a spray operation, we used the SPARC experimental facility, which was equipped with a pressure vessel capable of controlling the wall temperature with a volume of 82 m3. To measure gas species concentrations, 14 probes each for hydrogen, oxygen, and water vapor were installed. Two tests were designed depending on the spray initiation time. The SSP3 test was an experiment to simulate an accident in which the PAR operated as hydrogen was released after the spray is activated, and the SSP4 test was an experiment to simulate an accident in which the spray began after the operation of the PAR was initiated by the hydrogen release. In the experiment, two contradictory results were obtained, which were an increased start-up delay time of the PAR by early initiation of the spray and a negligible impact on the PAR’s performance by the delayed initiation of the spray.

1. Introduction

In a nuclear power plant (NPP), hydrogen is generated by oxidation of fuel cladding during a severe accident accompanying core damage, and is released into the reactor containment building together with water vapor. A nuclear power plant must have a hydrogen-mitigation system (HMS) installed to protect the containment building from a thermomechanical load caused by a hydrogen explosion [1,2]. In NPPs currently operating worldwide, PARs or hydrogen igniters are mainly used as an HMS. Unlike a hydrogen igniter, which is an active device, a PAR begins to remove hydrogen when hydrogen contacts the catalyst without operator intervention and electric power supply, while the hydrogen removal rate is low. Due to the passive nature of PARs, the hydrogen-removal characteristics differ depending on the thermal-hydraulic behaviors in the containment building developed by an accident progression.
A PAR is composed of a catalyst body and a chamber. As a catalytic material, platinum or palladium is coated on the catalyst body for catalytic recombination of hydrogen and oxygen. The catalyst body comes in various shapes, such as foil [3,4], pebble [4,5], plate [4,6,7], and grid [8,9]. For maintenance of the catalyst body, it is generally in the form of a removable cartridge, and it is contained in a vertical chamber with an inlet at the bottom and an outlet at the top to improve the inflow rate of the hydrogen mixture gas flowing into the catalyst body and to protect the catalyst body from external contaminants.
While the passive character of the PAR is very attractive for accident management compared to the hydrogen igniter, it has several disadvantages resulting from the passive characteristic, which raises issues related to containment hydrogen control [10,11]. Representative issues related to the PAR include start-up time delay [12,13], autoignition by a high-temperature catalyst [14,15,16], hydrogen stratification induced by the exhaust gas [10,17], performance deterioration by surrounding thermal-hydraulic conditions (counter-current flow [18], the wall effect [19], CO poisoning [20], O2 starvation [21]), and the like.
When a PAR is actively operating, the hydrogen concentration in the exhaust gas of the PAR is below 1%. For a PAR to fully function, some period is required, which is called the start-up time. The catalyst body is continuously heated by an exothermic reaction of hydrogen and oxygen during the start-up time. The start-up delay time under normal conditions of commercial PARs reaches several minutes. However, this start-up delay time may be longer depending on the atmospheric composition and thermal-hydraulic conditions where the PAR is installed. In addition, the condition of the catalyst surface affects the start-up time, and the most representative substances that delay the start-up of a PAR are carbon monoxide (CO), volatile organic compounds (VOC), soot, water (liquid film formation), and the like. When these substances adhere to the surface of the catalyst, they impede the diffusion of hydrogen molecules to the surface of the catalyst or delay the catalytic reaction. It is known that when the temperature of the catalyst body is sufficiently high, foreign substances attached to the surface of the catalyst body are volatilized or disappear after that, so that the operation of the PAR is not affected anymore.
Autoignition by PARs is a phenomenon in which hydrogen is burned by a high-temperature catalyst, which is related to the autoignition temperature of hydrogen and the concentration of hydrogen. The spontaneous ignition temperature of hydrogen is known to be around 800 K, and above this spontaneous ignition temperature, hydrogen can be ignited and combusted without an additional energy supply. The spontaneous ignition condition of a PAR is also related to the intrinsic characteristics of the PAR, but most commercial PARs have a very high probability of spontaneous ignition in the atmosphere at a hydrogen concentration of about 8% or more. In the THAI international joint project [22,23], spontaneous ignition experiments using various types of PARs were conducted. Currently, spontaneous ignition of PARs is recognized as an unavoidable phenomenon when a PAR is installed in a high-concentration hydrogen atmosphere.
Hydrogen stratification by PARs is a phenomenon in which hydrogen stagnates at the lower area of the compartment with a PAR installed due to high-temperature exhaust gas, and it was recently re-evaluated through SPARC experiments [17]. The high-temperature exhaust gas emitted from a PAR may have a relatively low density compared to the hydrogen mixture gas. The formation of a positive temperature gradient (a higher temperature at the top) and a negative hydrogen concentration gradient (a higher concentration at the bottom) inside the compartment by the high-temperature exhaust gas from a PAR is called hydrogen stratification induced by PAR. In this case, natural convection by a PAR may be disturbed. Through the SPARC experiment, it was confirmed that the hydrogen-stratification phenomenon induced by a PAR could occur. It was also confirmed that the heat capacity of the catalyst could alleviate the hydrogen stratification by a PAR.
Various pressure control systems are installed in NPP containment buildings to prevent overpressure in accident conditions. Representative systems include a containment spray system (CSS), a fan cooler (reactor containment fan cooler (RCFC)), a filtered containment venting system (FCVS), and a passive containment cooling system (PCCS). Such a containment pressure control system makes it possible to secure the integrity of the containment building by maintaining a containment pressure lower than the design pressure in an accident condition. However, during the operation of this pressure-control system, the effectiveness of the hydrogen-control system and hydrogen safety in the containment building must be ensured [24].
The reactor containment spray system, which is an important means of preventing overpressure due to released steam, is used for accident management in case of design-based and beyond-design accidents. Sprays can enhance steam condensation and hydrogen mixing through the exchange of mass, momentum, and energy between the spray droplets and the atmosphere. This greatly affects the distribution of hydrogen in the containment. On the other hand, it is expected that PARs, which are used for hydrogen mitigation under design-based accidents as well as severe accident conditions, will continuously remove hydrogen even in an atmosphere with spraying in operation.
A spray system installed in a containment building of a pressurized light-water reactor, such as the APR1400 [25], can be operated automatically by a containment spray activation signal (CSAS) according to a pressure increase in the event of a design-based accident, or it can be operated manually after a decision by an accident manager. In this way, the spray system can be operated under various conditions of temperature and pressure in the containment to control the pressure in the event of an accident, and even under such conditions, when hydrogen is distributed in the containment building, the PAR is operating. Therefore, it is very important in accident management to understand the hydrogen-removal characteristics of a PAR during a spray operation.
The purpose of this study was to evaluate the effect of spray on the hydrogen recombination of a PAR using a SPARC test facility.

2. SPARC Test Facility

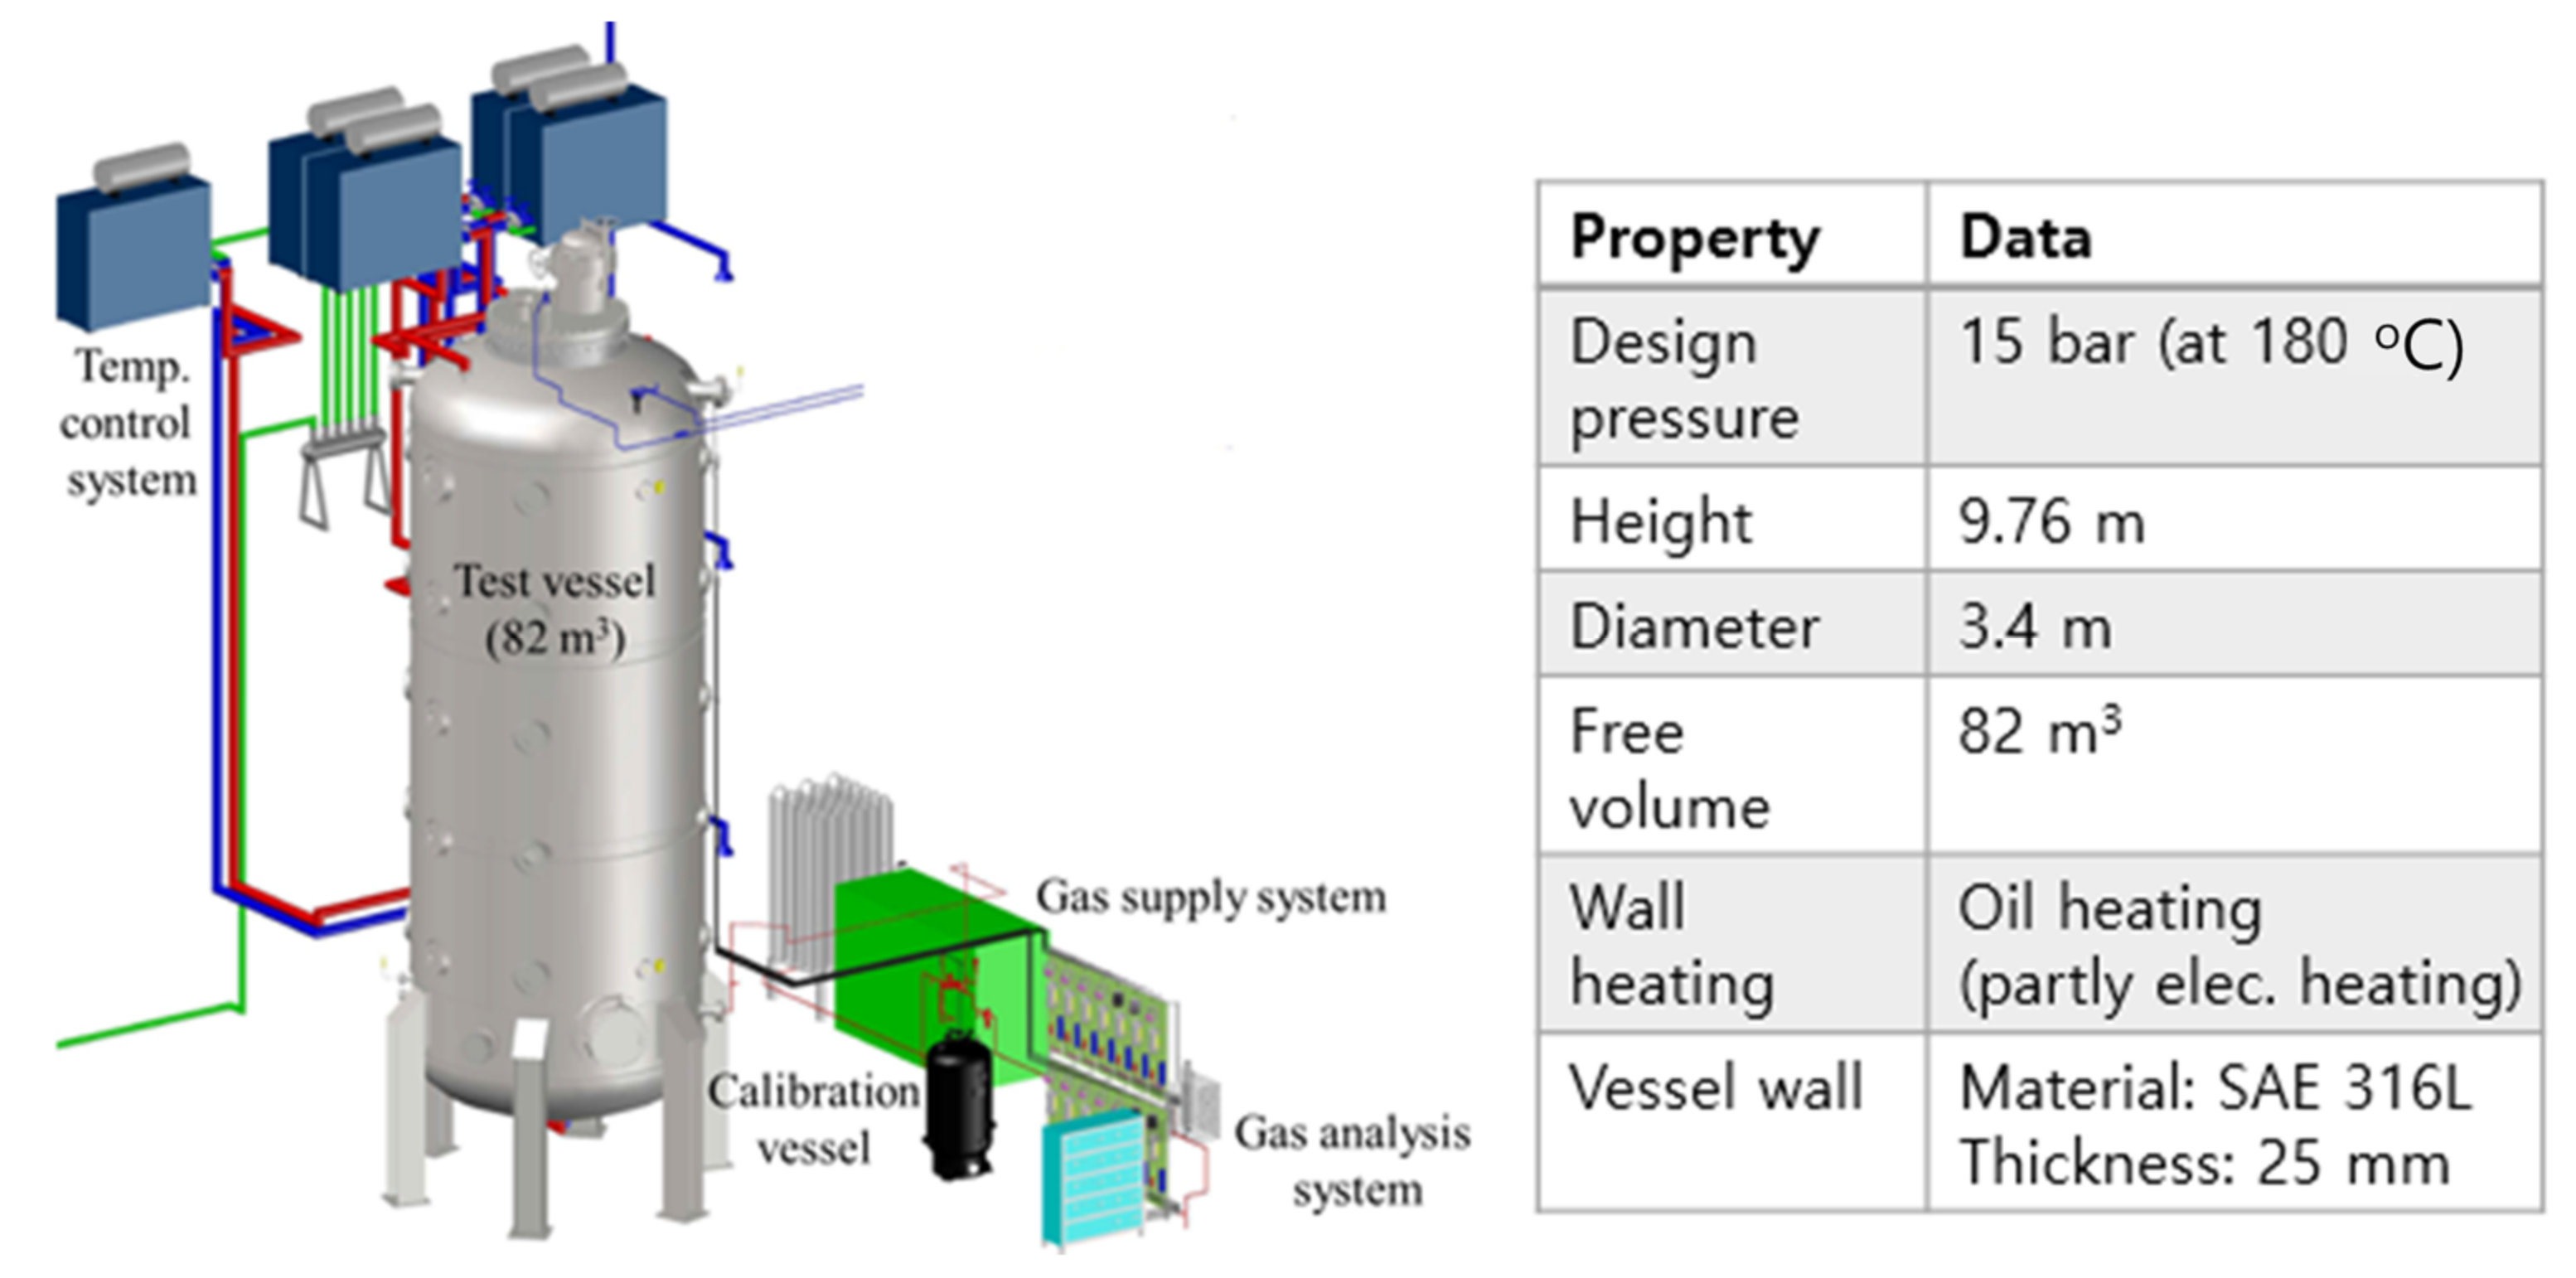
2.1. SPARC Pressure Vessel

The Spray-Aerosol-Recombiner-Combustion (SPARC) test facility was built in 2016 with an aim toward the experimental simulation of hydrogen behaviors in a containment such as a jet flow and mixing of hydrogen, a PAR and spray effects on the hydrogen behaviors, and flame propagation in a containment-type geometry [26]. It is composed of a large pressure vessel and temperature control, gas injection, measurement, and data-acquisition systems. The main component of the facility is the pressure vessel, which has a volume of 82 m3. Figure 1 shows the shape of the SPARC pressure vessel and the typical specifications of the vessel. The temperature of the SPARC pressure vessel is controlled using an oil jacket installed on the outer wall of the vessel, an oil heater, and an oil pump.

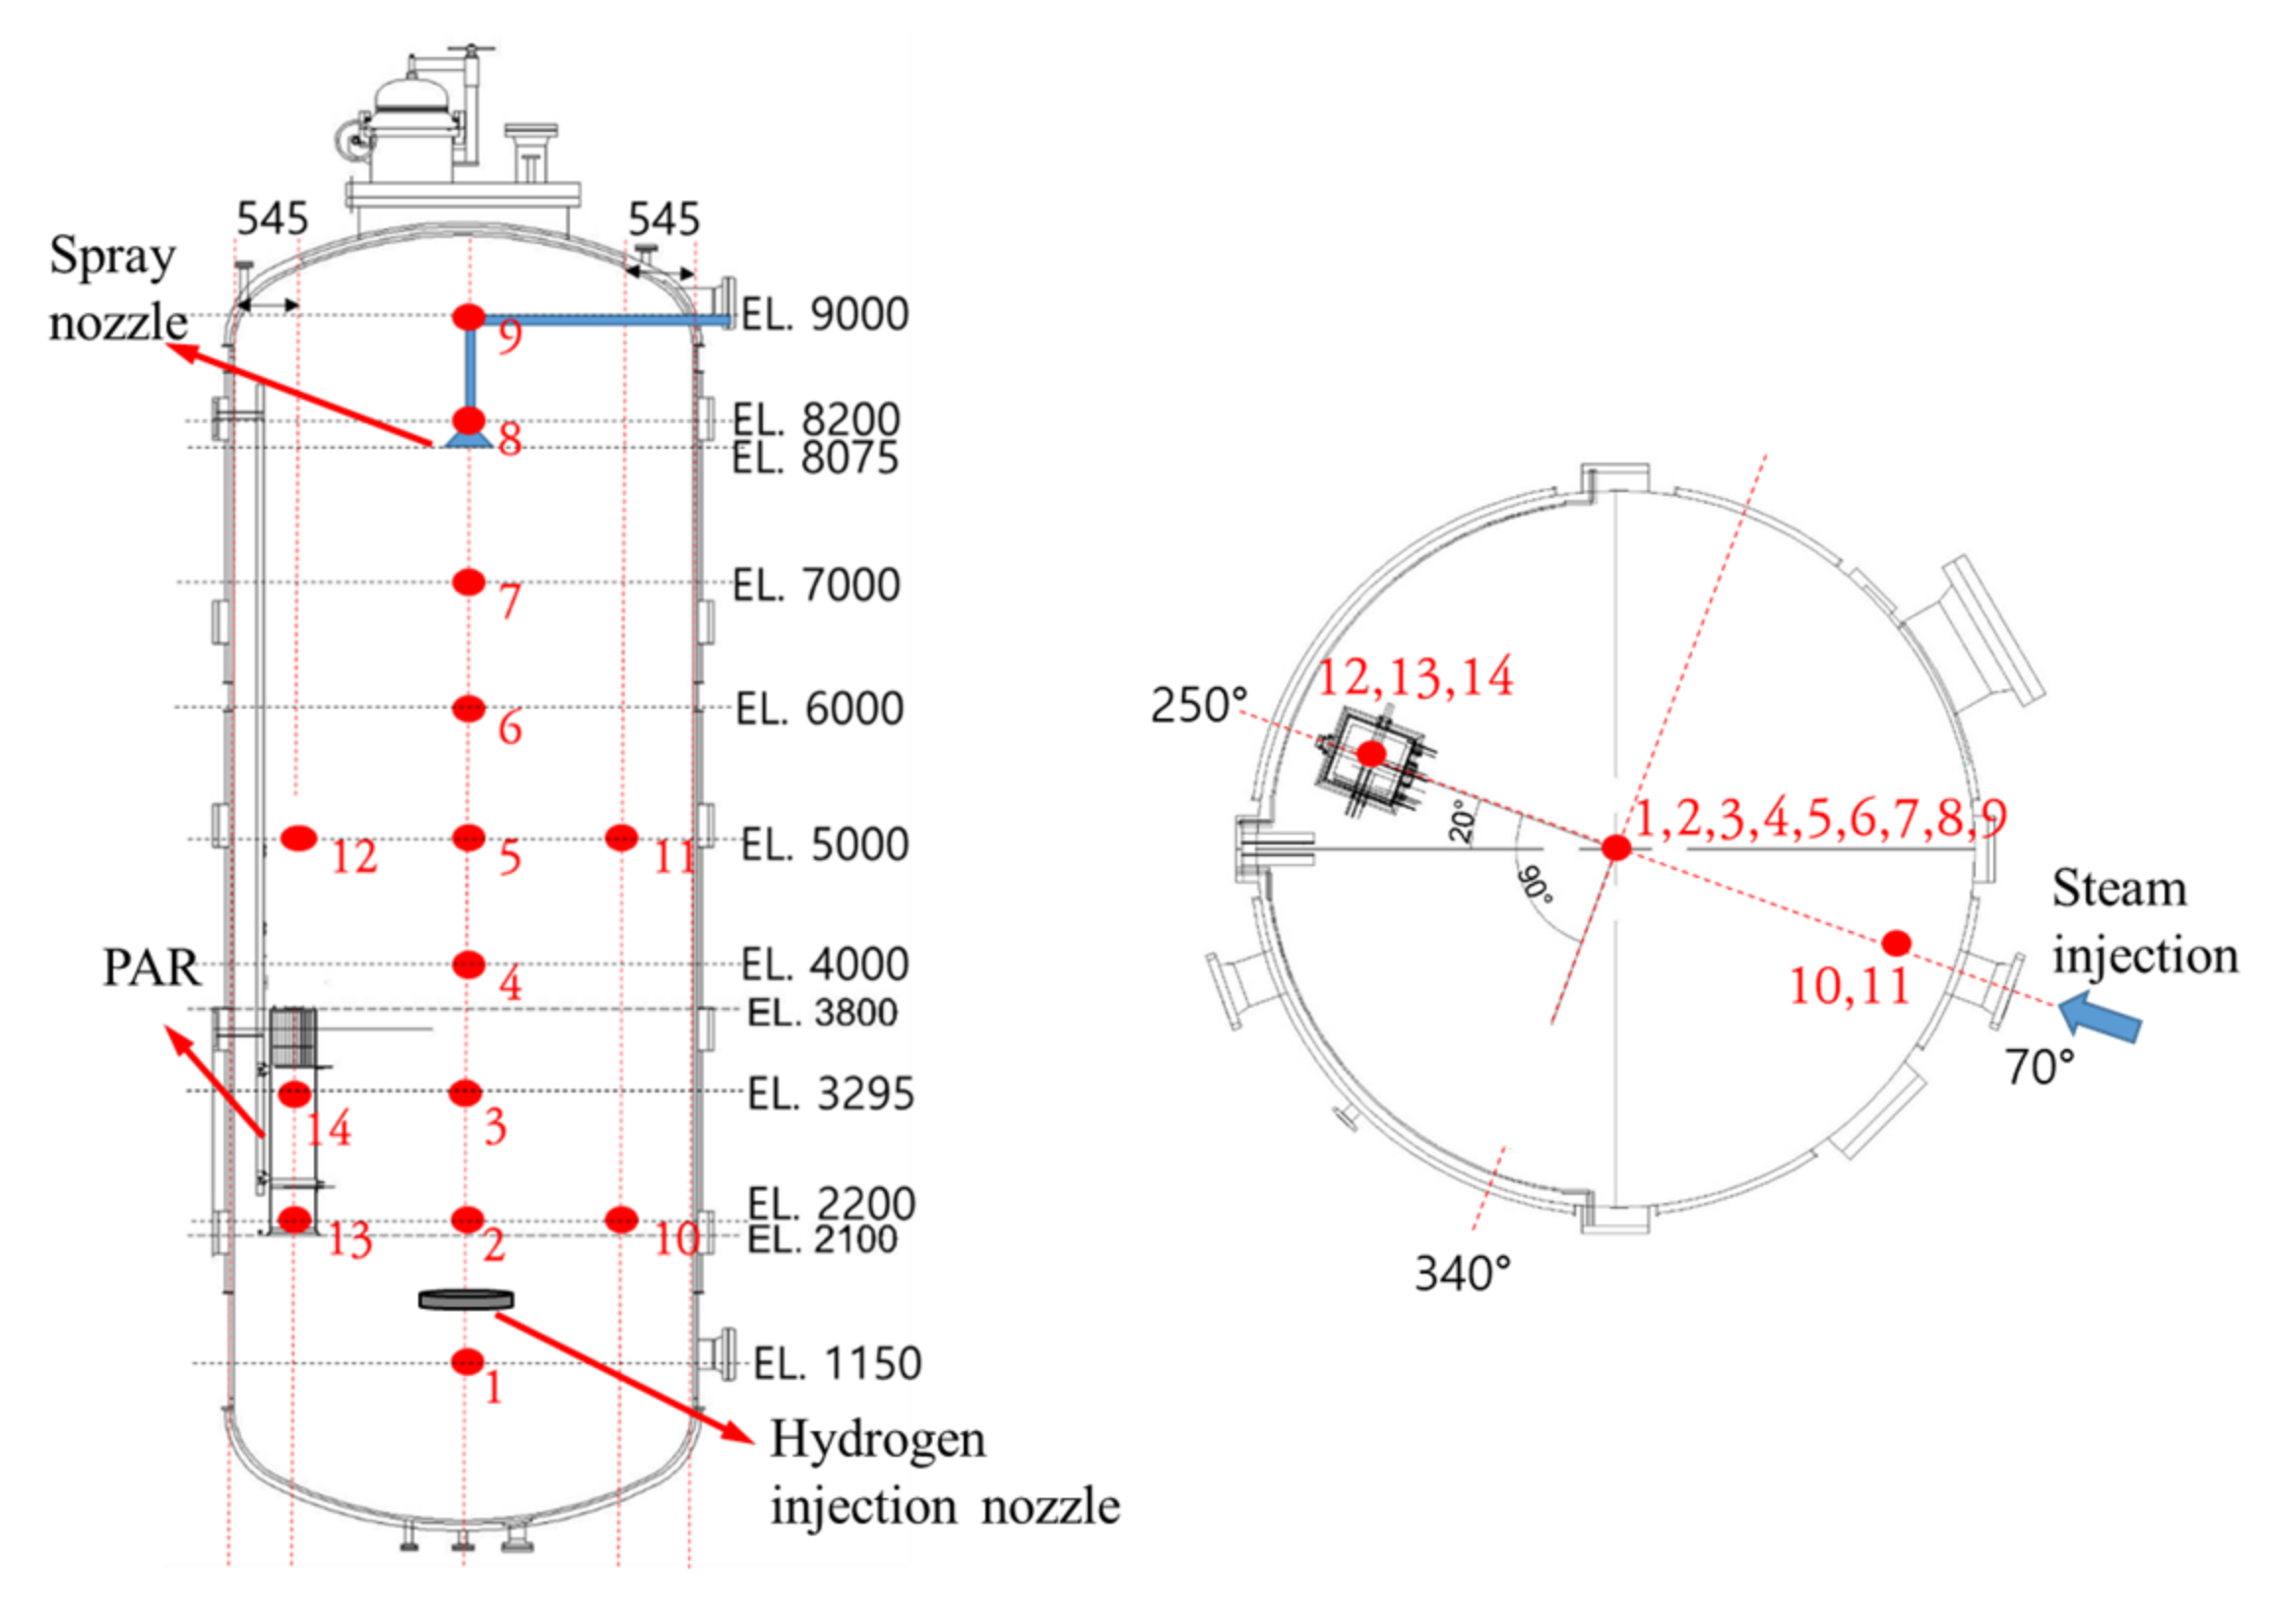
2.2. SPARC Measurement System
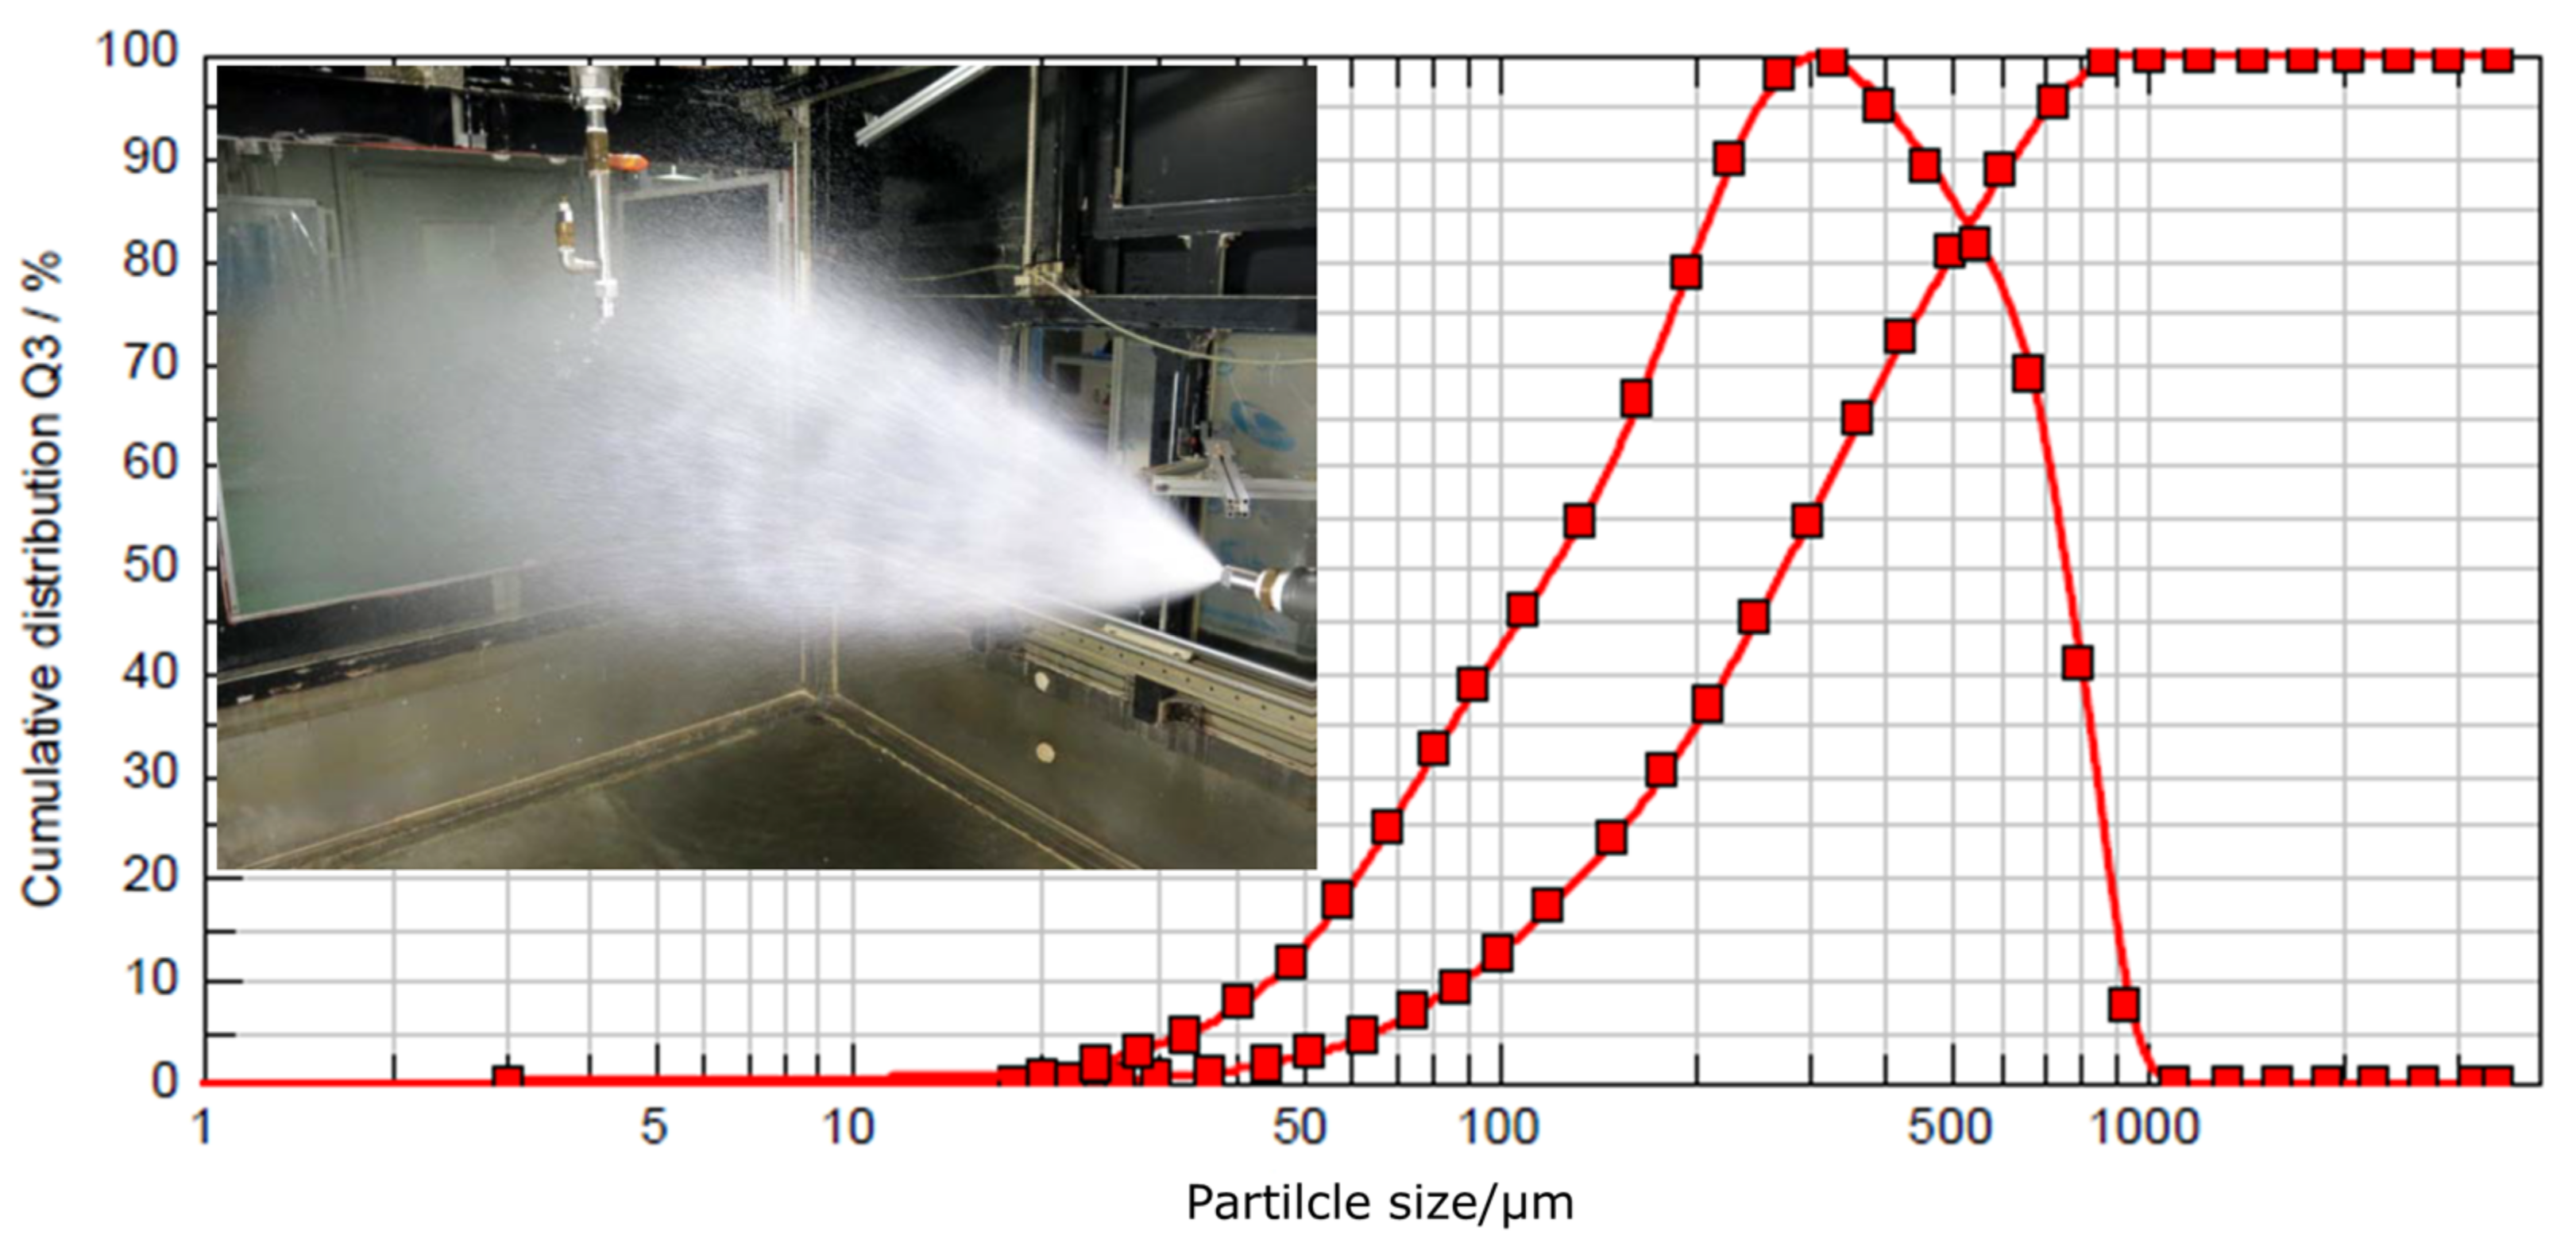
To experimentally simulate hydrogen behaviors in accident conditions, it is necessary to measure gas species concentrations such as those of hydrogen, oxygen, and water vapor, as well as thermal-hydraulic properties such as pressure, temperature, and velocity.
For temperature measurement of gas and the vessel wall, K-type thermocouples of OMEGA (CO3-K, inner diameter 0.25 mm bead, reaction speed 300 ms) are used. The current measurement system of the SAPRC test facility can measure concentrations of hydrogen, oxygen, and water vapor at 14 probing locations at the same time. The humidity of water vapor is measured by probe-type hygrometers (E+E Elektronik, EE33) that can measure directly inside the SPARC vessel. The concentration of water vapor can be obtained from the measured humidity and temperature. For the measurement of the hydrogen concentration, thermal-conductivity sensors (FTC300, Messkonzept, maximum pressure of 20 bar) with a gas-sampling system are used. Since a cooling channel is installed in front of the hydrogen sensors, the temperature of the hot gas sampled from the vessel decreases during the sampling process. A condensation trap and a filter are installed in each sampling line to remove the water vapor contained in the sampled gas. Oxygen sensors (PMA 1000, M&C, Germany, principle paramagnetic, reaction time less than 1 s, sampling range: 25 to 60 L/h, temperature range: −10 to 50 °C, maximum pressure: 1.6 bar) are attached after the hydrogen sensors along the sampling lines. In each sampling line, a pump controls the sampling flow rate (NMP 830 KNDC DC motor: 24 V, flow rate: 3.1 l/m, maximum measuring pressure: 1 bar, KNF). Figure 2 contains a schematic that shows the locations of probes, the PAR, and the spray nozzles used in this experimental study.

2.3. Spray System

For the SPARC spray experiment, we referred to the specifications of the spray system installed in the APR1400. The average flow rate of the spray nozzle installed in the APR1400 containment was 1 kg/s, and the volume average droplet diameter was about 300 μm. In the SPARC spray experiment, the spray angle was designed to be 60° so that some part of the spray droplets could enter the outlet of the PAR installed on the lower wall of the SPARC vessel. A spray-nozzle test was performed to verify the designed mean droplet diameter and spreading angle. Figure 3 shows the results of the test, which confirmed that the spray angle and volume-mean droplet diameter were satisfied.

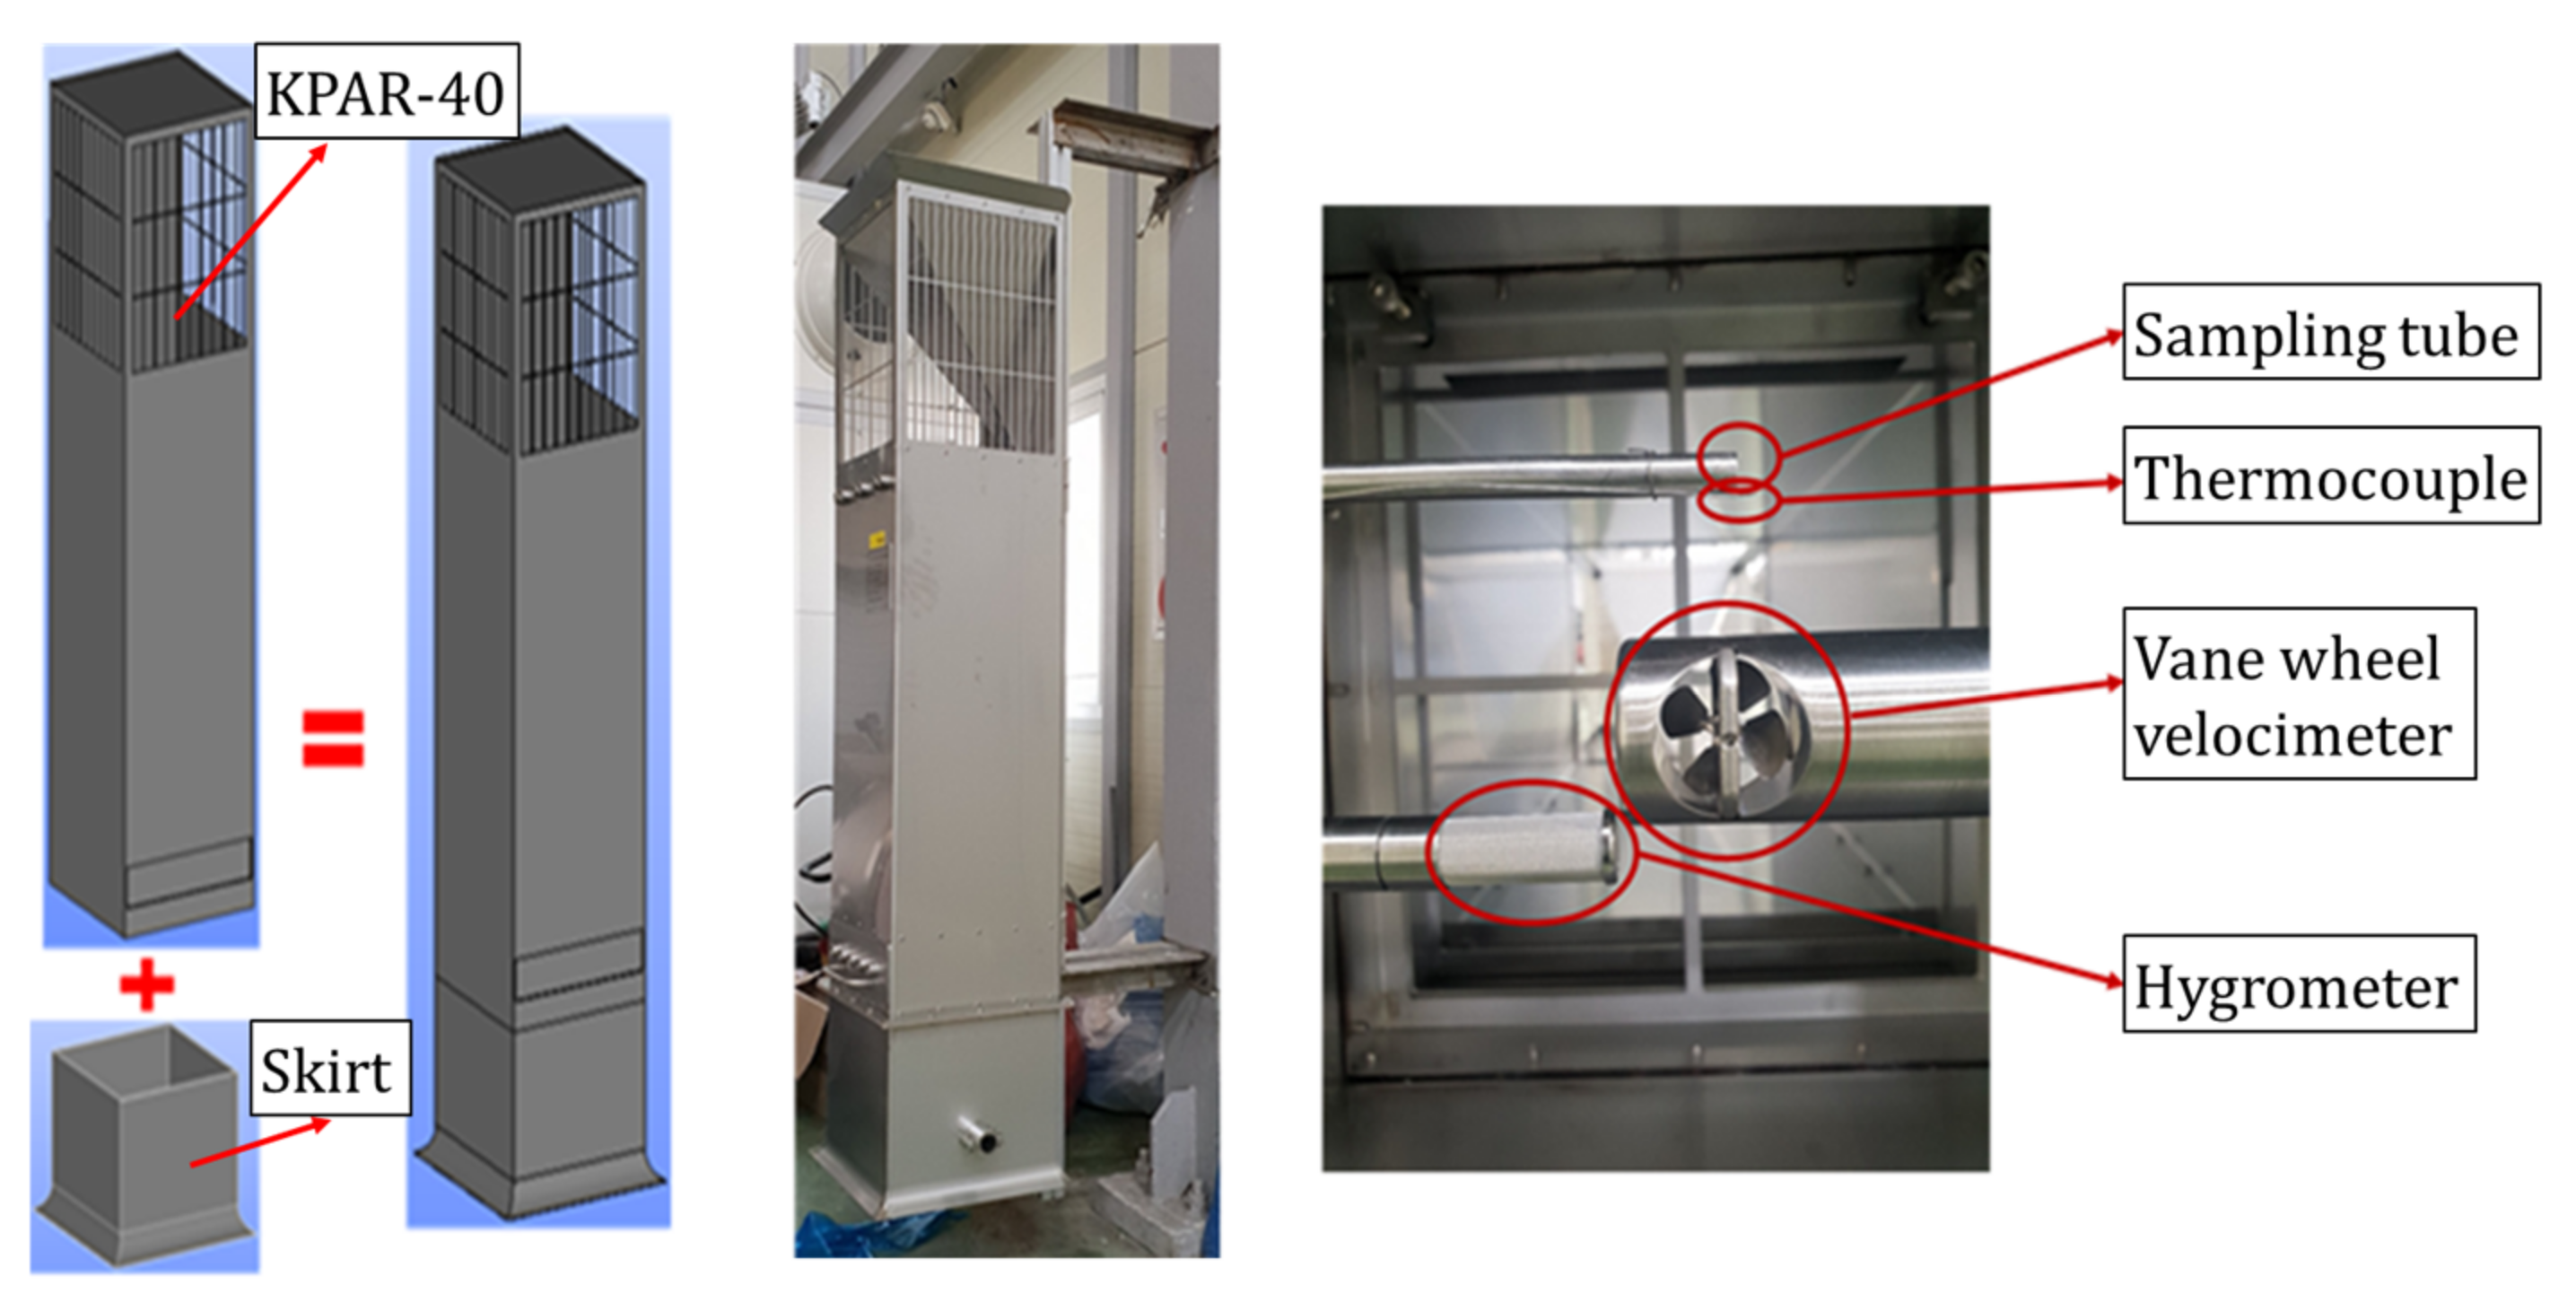
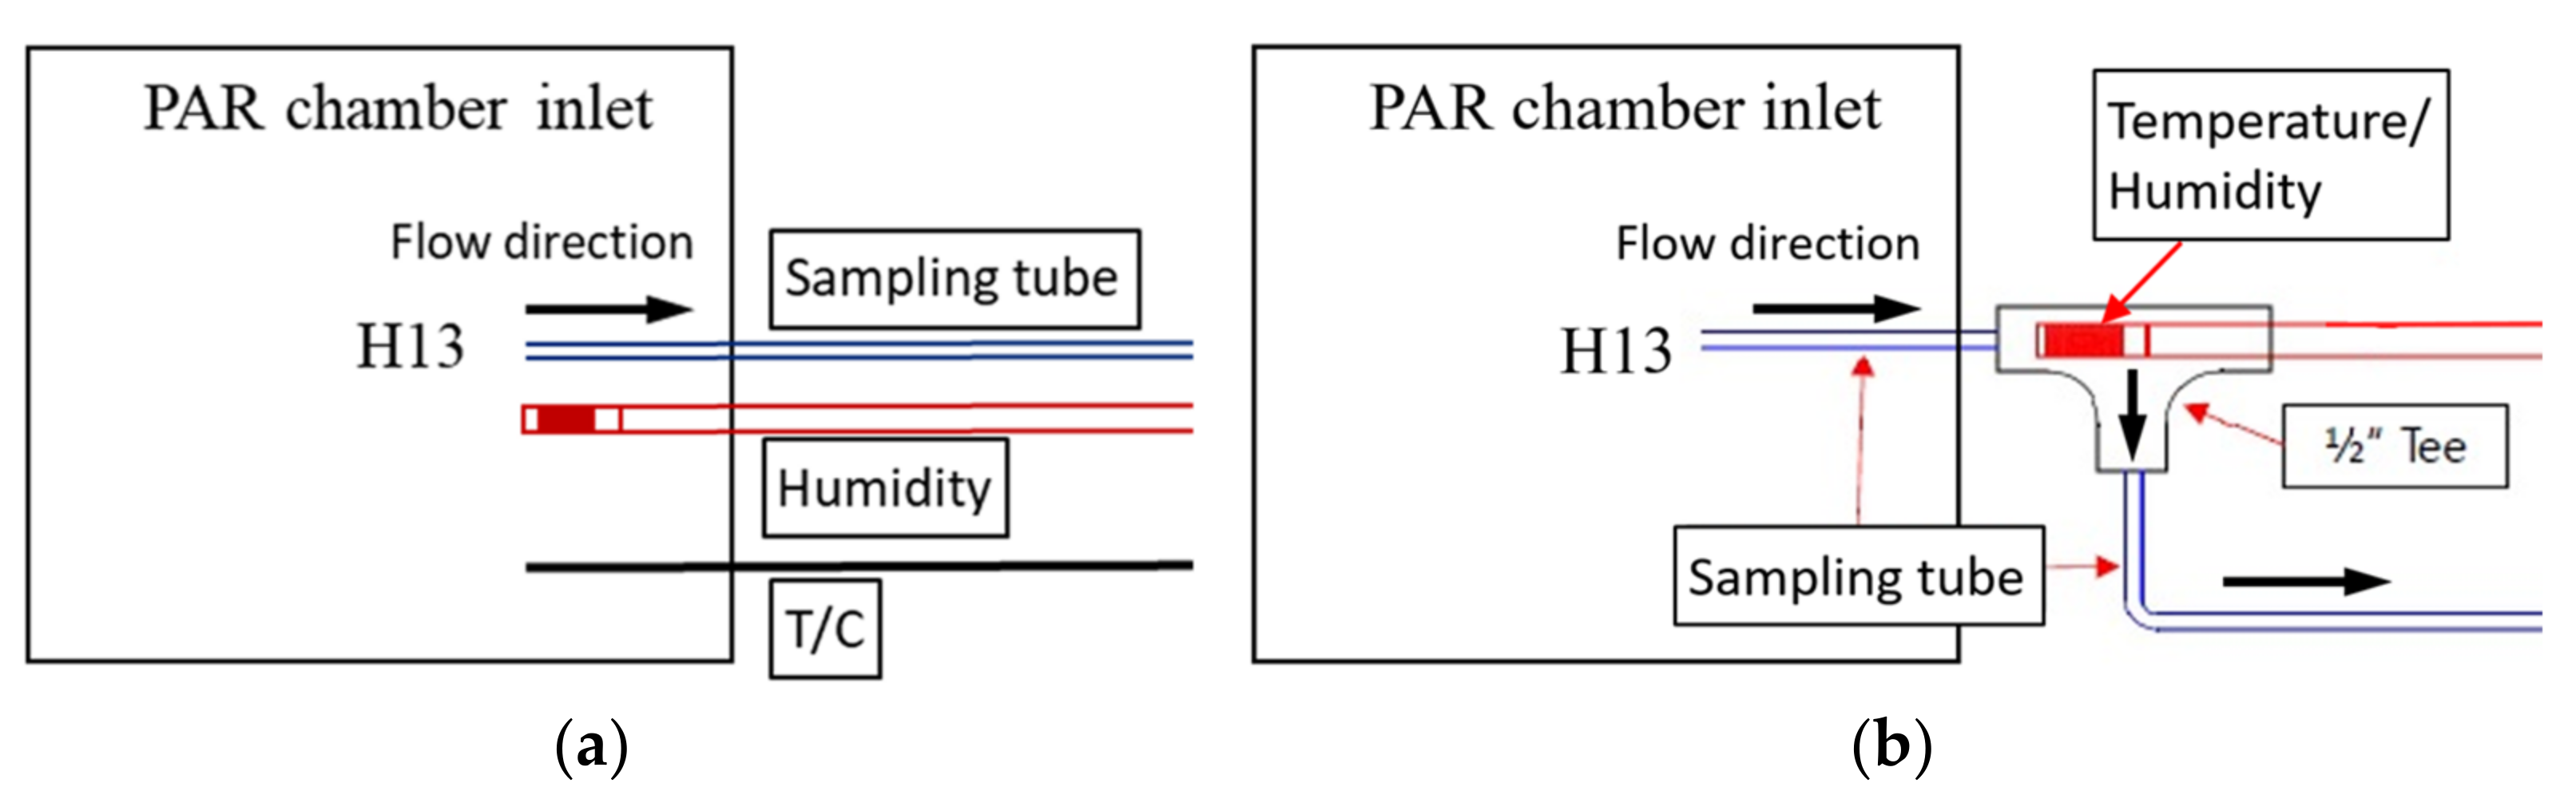
2.4. Test PAR and Measurement

In this study, a passive autocatalytic recombiner KPAR-40 [8] designed and manufactured by KNT Co. was used. The basic size of the PAR was 340 × 335 × 1400 mm; 4 grid-type catalysts (150 × 150 × 50 mm) were placed in the cartridge, and the cartridge was mounted in the PAR chamber. The catalyst used in the experiment had a platinum catalyst material and ceramic (2MgO•2Al2O3•5SiO2) as a base material. To evaluate the hydrogen-recombination rates of the PAR, a skirt was additionally manufactured and installed at the bottom of the PAR chamber, as shown in Figure 4, to measure the hydrogen and oxygen concentrations, humidity, temperature, gas inflow velocity, etc. at the entrance of the PAR.
The temperature of the gas flowing into the PAR chamber was one of the parameters used for the evaluation of hydrogen depletion by the PAR. During the operation of a PAR, the temperature of the catalyst body rises to 800 K or above, up to 1000 K. A sensor to measure the gas temperature, such as a thermocouple at the PAR inlet, may be influenced by thermal radiation from the heated catalyst body. The gas temperature measured by the thermally influenced thermocouple can be higher than the real gas temperature. If this augmented gas temperature at the PAR inlet is used for converting humidity to vapor concentration, the hydrogen concentration at the PAR inlet can be changed, and the depletion rate of the PAR can be also changed. To minimize the radiative effect from the catalyst body on the gas temperature measurement, a T-type connector was designed to couple the humidity and temperature sensors with the gas-sampling line intruded into the PAR chamber, as shown in Figure 5, which compares the normal and modified installations for the measurements.
In Figure 6, the gas temperature measured by a thermocouple intruded into the PAR chamber is compared with the sampled gas temperature and gas temperatures surrounding the PAR inlet. It depicts that the thermocouple installed below the catalyst body was thermally affected by the heated catalyst body when the PAR was actively operating.

3. Postprocessing of Experimental Data

3.1. Gas Species Concentrations

Since the hydrogen-concentration measurement system implemented in the SPARC experiment used the thermal conductivity of hydrogen, water vapor had to be removed from the gas mixture, and thus the hydrogen concentration in the dry condition excluding water vapor was obtained. A hygrometer was used to convert the measured hydrogen concentration to a real hydrogen concentration in a wet condition. From the relative humidity (RH) obtained from the humidity sensor, the water vapor concentration ( x h 2 o ) was obtained using Equation (1) with the measured pressure (p) and gas temperature (T):
x h 2 o = p h 2 o p = R H p s a t ( T ) p
where p s a t is a saturation pressure at the gas temperature T.
As noted above, the measured hydrogen and oxygen concentrations were in a dry condition, so the real concentrations were calculated by Equations (2) and (3) using the vapor concentration calculated by Equation (1):
x h 2 = N h 2 N = x h 2 d r y ( 1 x h 20 )
x o 2 = N o 2 N = x o 2 d r y ( 1 x h 20 )

3.2. PAR Recombination Rate

To evaluate the PAR’s performance in factors such as the hydrogen-recombination rate, recombination efficiency, and delay time of the PAR start-up through the PAR experiment, as much thermal-hydraulic data as possible needed to be collected. Two methods were available for evaluating the hydrogen-recombination rate of the PAR using experimental data [18,22,23]: a method using the hydrogen mass-flow difference at the inlet and outlet of the PAR chamber (Method-1); and a method using the hydrogen mass inventory that remained in the test vessel (Method-2).
The PAR hydrogen-recombination rate in Method-1 was derived from a hydrogen mass-conservation equation with a quasi-steady-state assumption. If a hydrogen mass conservation equation is integrated over the PAR chamber, Equation (4) is obtained:
R ˙ h 2 = m ˙ h 2 , i n m ˙ h 2 , o u t = ( ρ Y h 2 U A ) i n ( ρ Y h 2 U A ) o u t
Equation (4) is a formula to calculate the hydrogen-recombination rate depending on the total six values, including gas densities, hydrogen mass fractions, and velocities at the inlet and outlet. A continuity equation for a gas mixture can be used to remove the outlet gas velocity in Equation (4). When an equation of state for an ideal gas is applied to Equation (4), the following equation is obtained:
R ˙ h 2 = ρ i n U i n A i n ( Y h 2 , i n Y h 2 , o u t ) = p R m , i n T i n U i n A i n x h 2 W h 2 W m i n x h 2 W h 2 W m o u t ,
where p ,   T ,   x h 2 are the pressure, temperature, and hydrogen mole fraction, respectively; and W m and R m are the molecular weight and a gas constant divided by the molecular weight of the gas mixture, respectively. The hydrogen-depletion rate of Equation (5) requires hydrogen mole fractions at the inlet and outlet; these can be derived from the measured vapor and hydrogen concentrations.
Equation (5) can be used for the evaluation of the hydrogen-recombination rate by a PAR with an assumption of uniform inlet properties, such as the inlet velocity. However, the velocity at the PAR inlet can be nonuniform due to a near-wall effect. Figure 7 shows the results of a computational fluid dynamics (CFD) simulation to compare the nonuniformity of the PAR inlet flow depending on the near-walls [24]. Equation (5) must to be multiplied by a correction factor for a better prediction of the recombination rate. The recommended value of the correction factor is between 0.8 and 0.9.
The second method to evaluate the hydrogen-removal rate of a PAR, using the hydrogen mass conservation in the vessel (Method-2), applies the mass conservation law of hydrogen to the entire pressure vessel containing the PAR. If the equation of hydrogen mass conservation is integrated over the entire pressure vessel, the following equation is obtained:
m h 2 , v e s s e l t = m ˙ h 2 , i n j m ˙ h 2 , s a m p l R ˙ h 2
where m h 2 , v e s s e l is the amount of hydrogen remaining in the pressure vessel, m ˙ h 2 , i n j is the hydrogen mass flow rate injected into the pressure vessel, R ˙ h 2 is the hydrogen recombination rate of the PAR, and m ˙ h 2 , s a m p l is the sampling rate of hydrogen for the concentration measurement. If m h 2 , v e s s e l , m ˙ h 2 , i n j , and m ˙ h 2 , s a m p l of Equation (6) are obtained, the hydrogen removal rate R ˙ h 2 of a PAR can be obtained from the equation. However, Equation (6) is not good to apply to experimental data because there is a large amount of noise, such as oscillations in the hydrogen injection flow rate, sampling flow rate, and residual amount of hydrogen in the pressure vessel, so differential errors may occur. Additional noise filtering and large time-interval derivatives can be used to deal with this, but this can distort the hydrogen-removal rate of the PAR. Instead, a time-integral form of the equation was considered in this study. Integrating Equation (6) over time t with an initial condition of m h 2 , v e s s e l = 0 gives Equation (7):
m h 2 , v e s s e l = 0 t m ˙ h 2 , i n j d t 0 t m ˙ h 2 , s a m p l d t 0 t R ˙ h 2 d t
The last term of the right side of Equation (7) is a recombined mass of hydrogen until time t. When the recombined hydrogen mass is differentiated by time as shown in Equation (8), the recombination rate of a PAR is obtained.
R ˙ h 2 = d d t 0 t R ˙ h 2 d t = d d t 0 t m ˙ h 2 , i n j d t 0 t m ˙ h 2 , s a m p l d t m h 2 , v e s s e l

4. SPARC-SPRAY-PAR Experiment

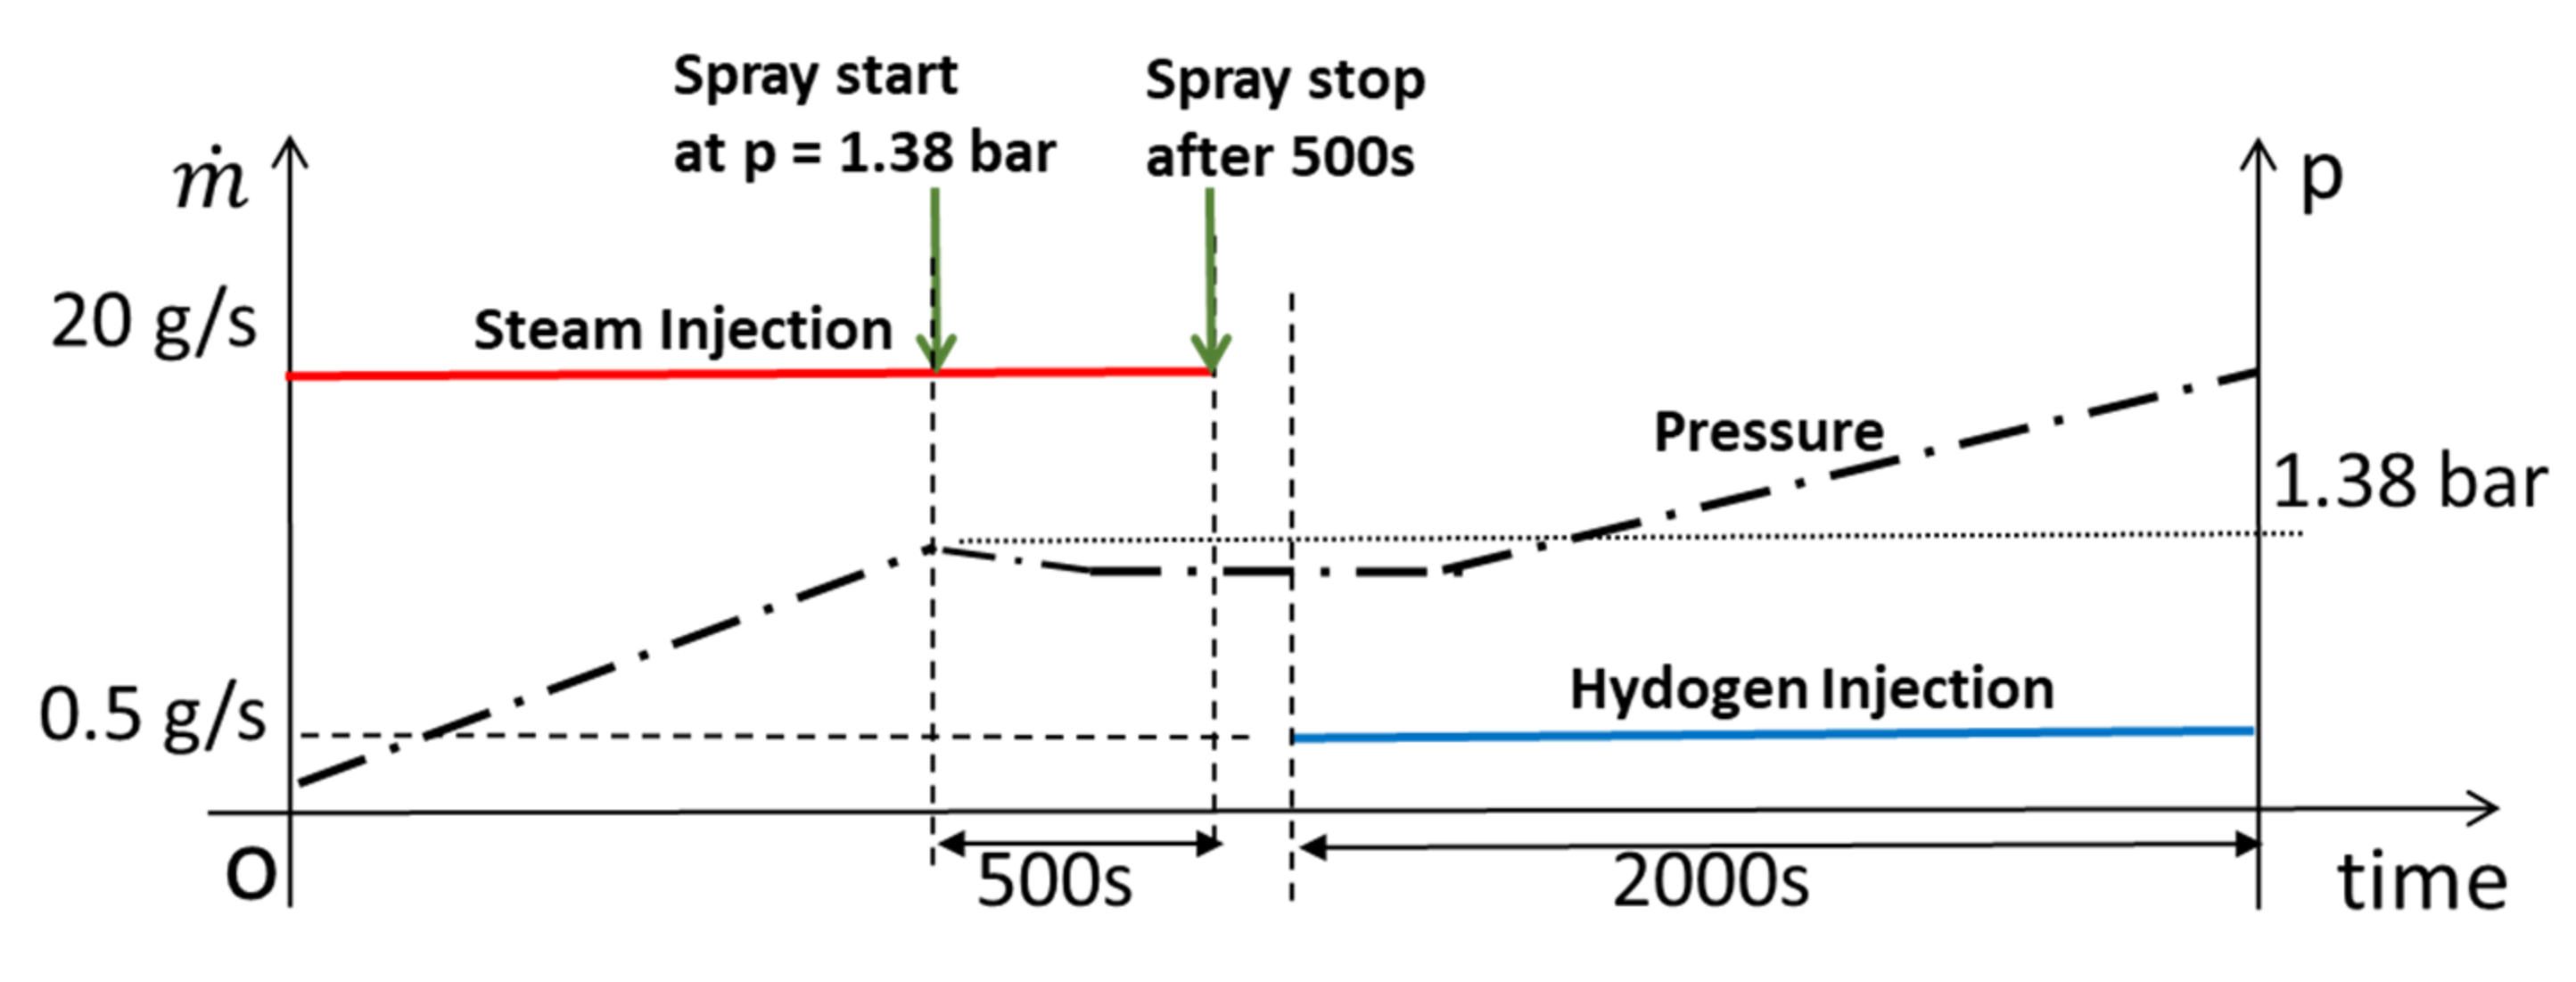
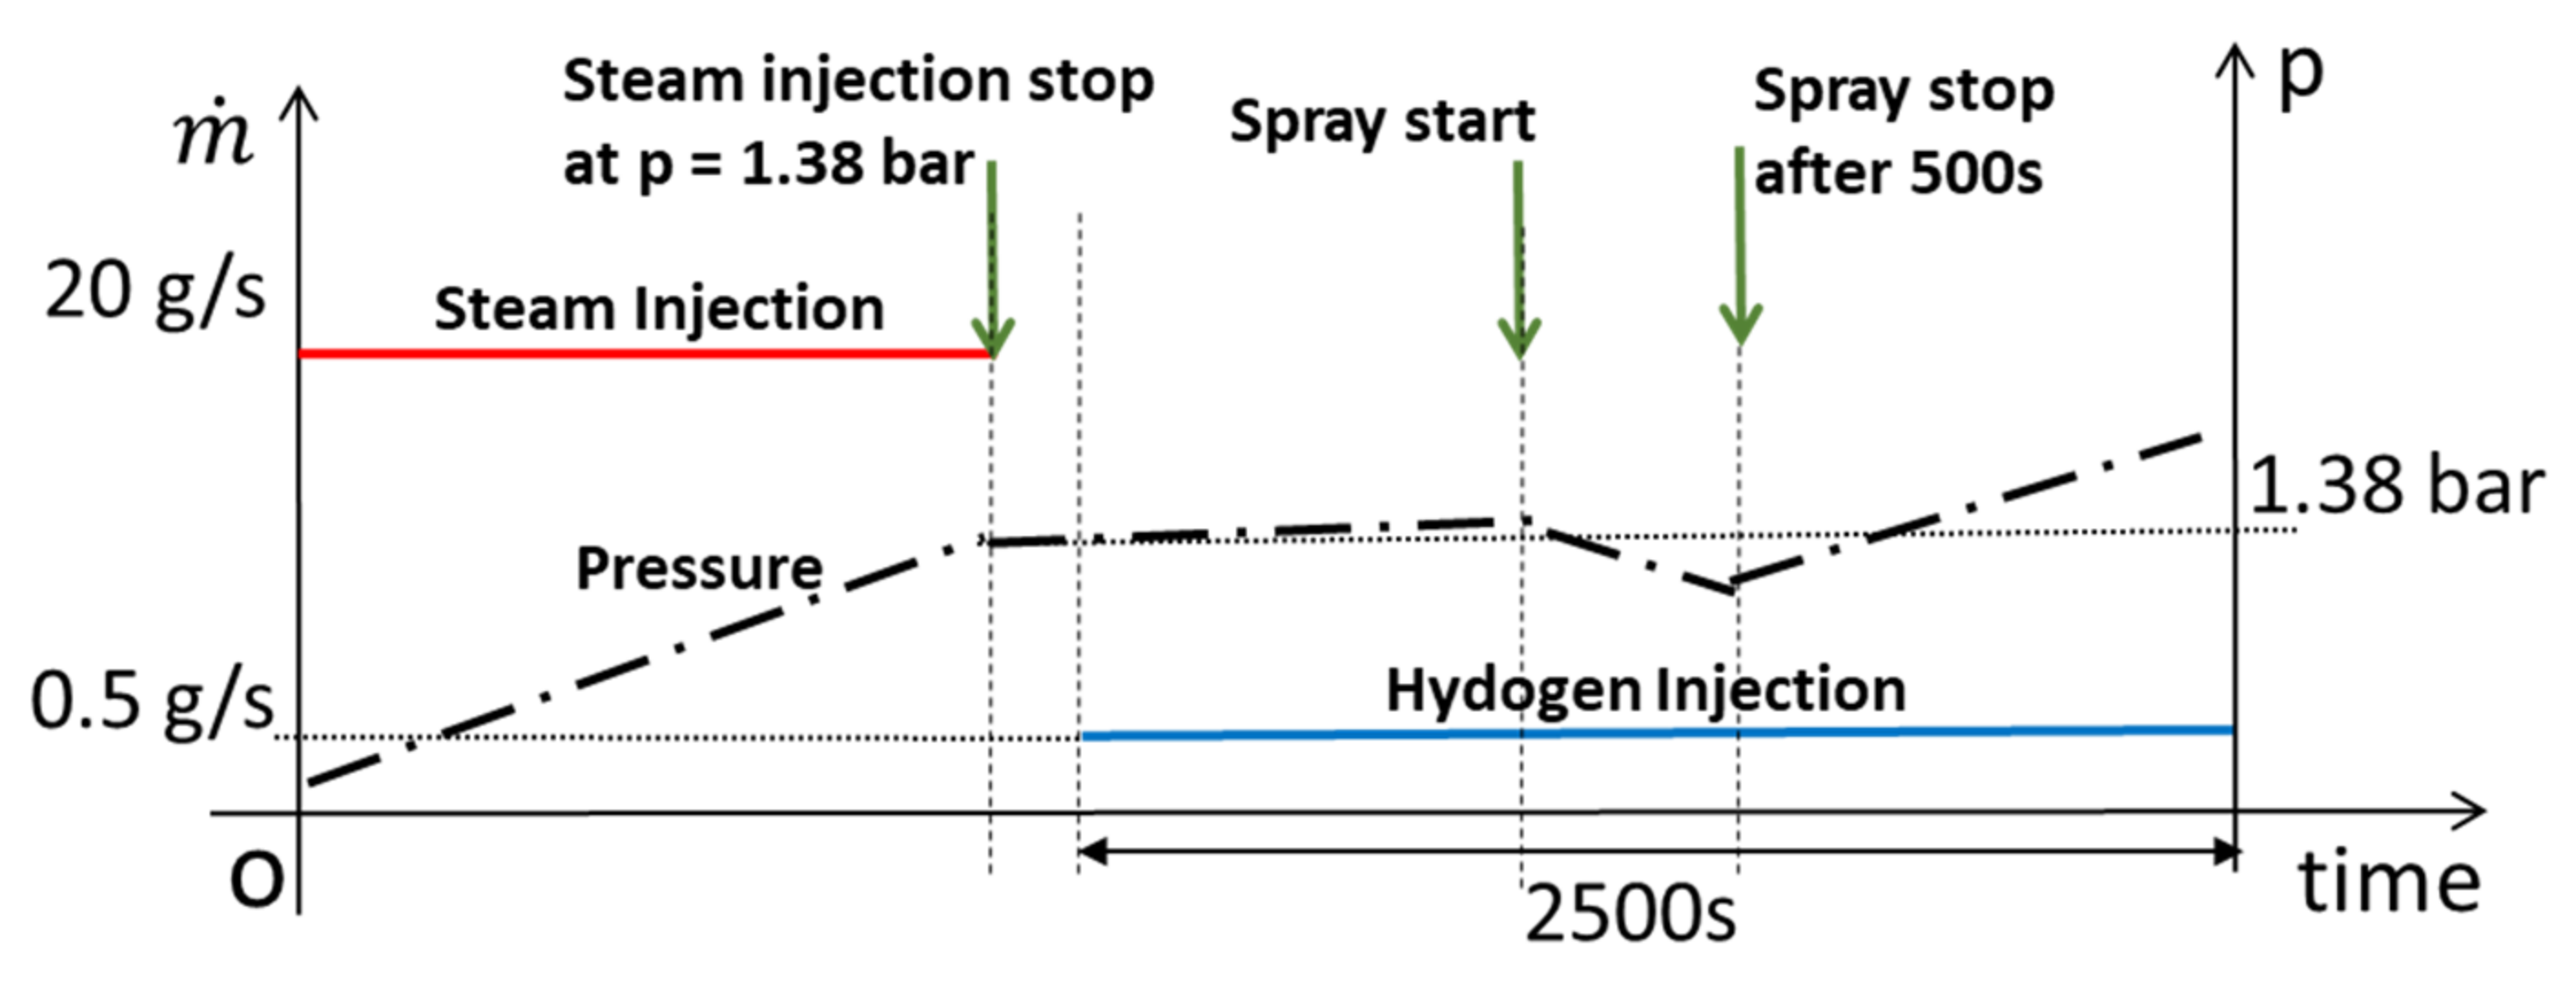
4.1. Test Conditions
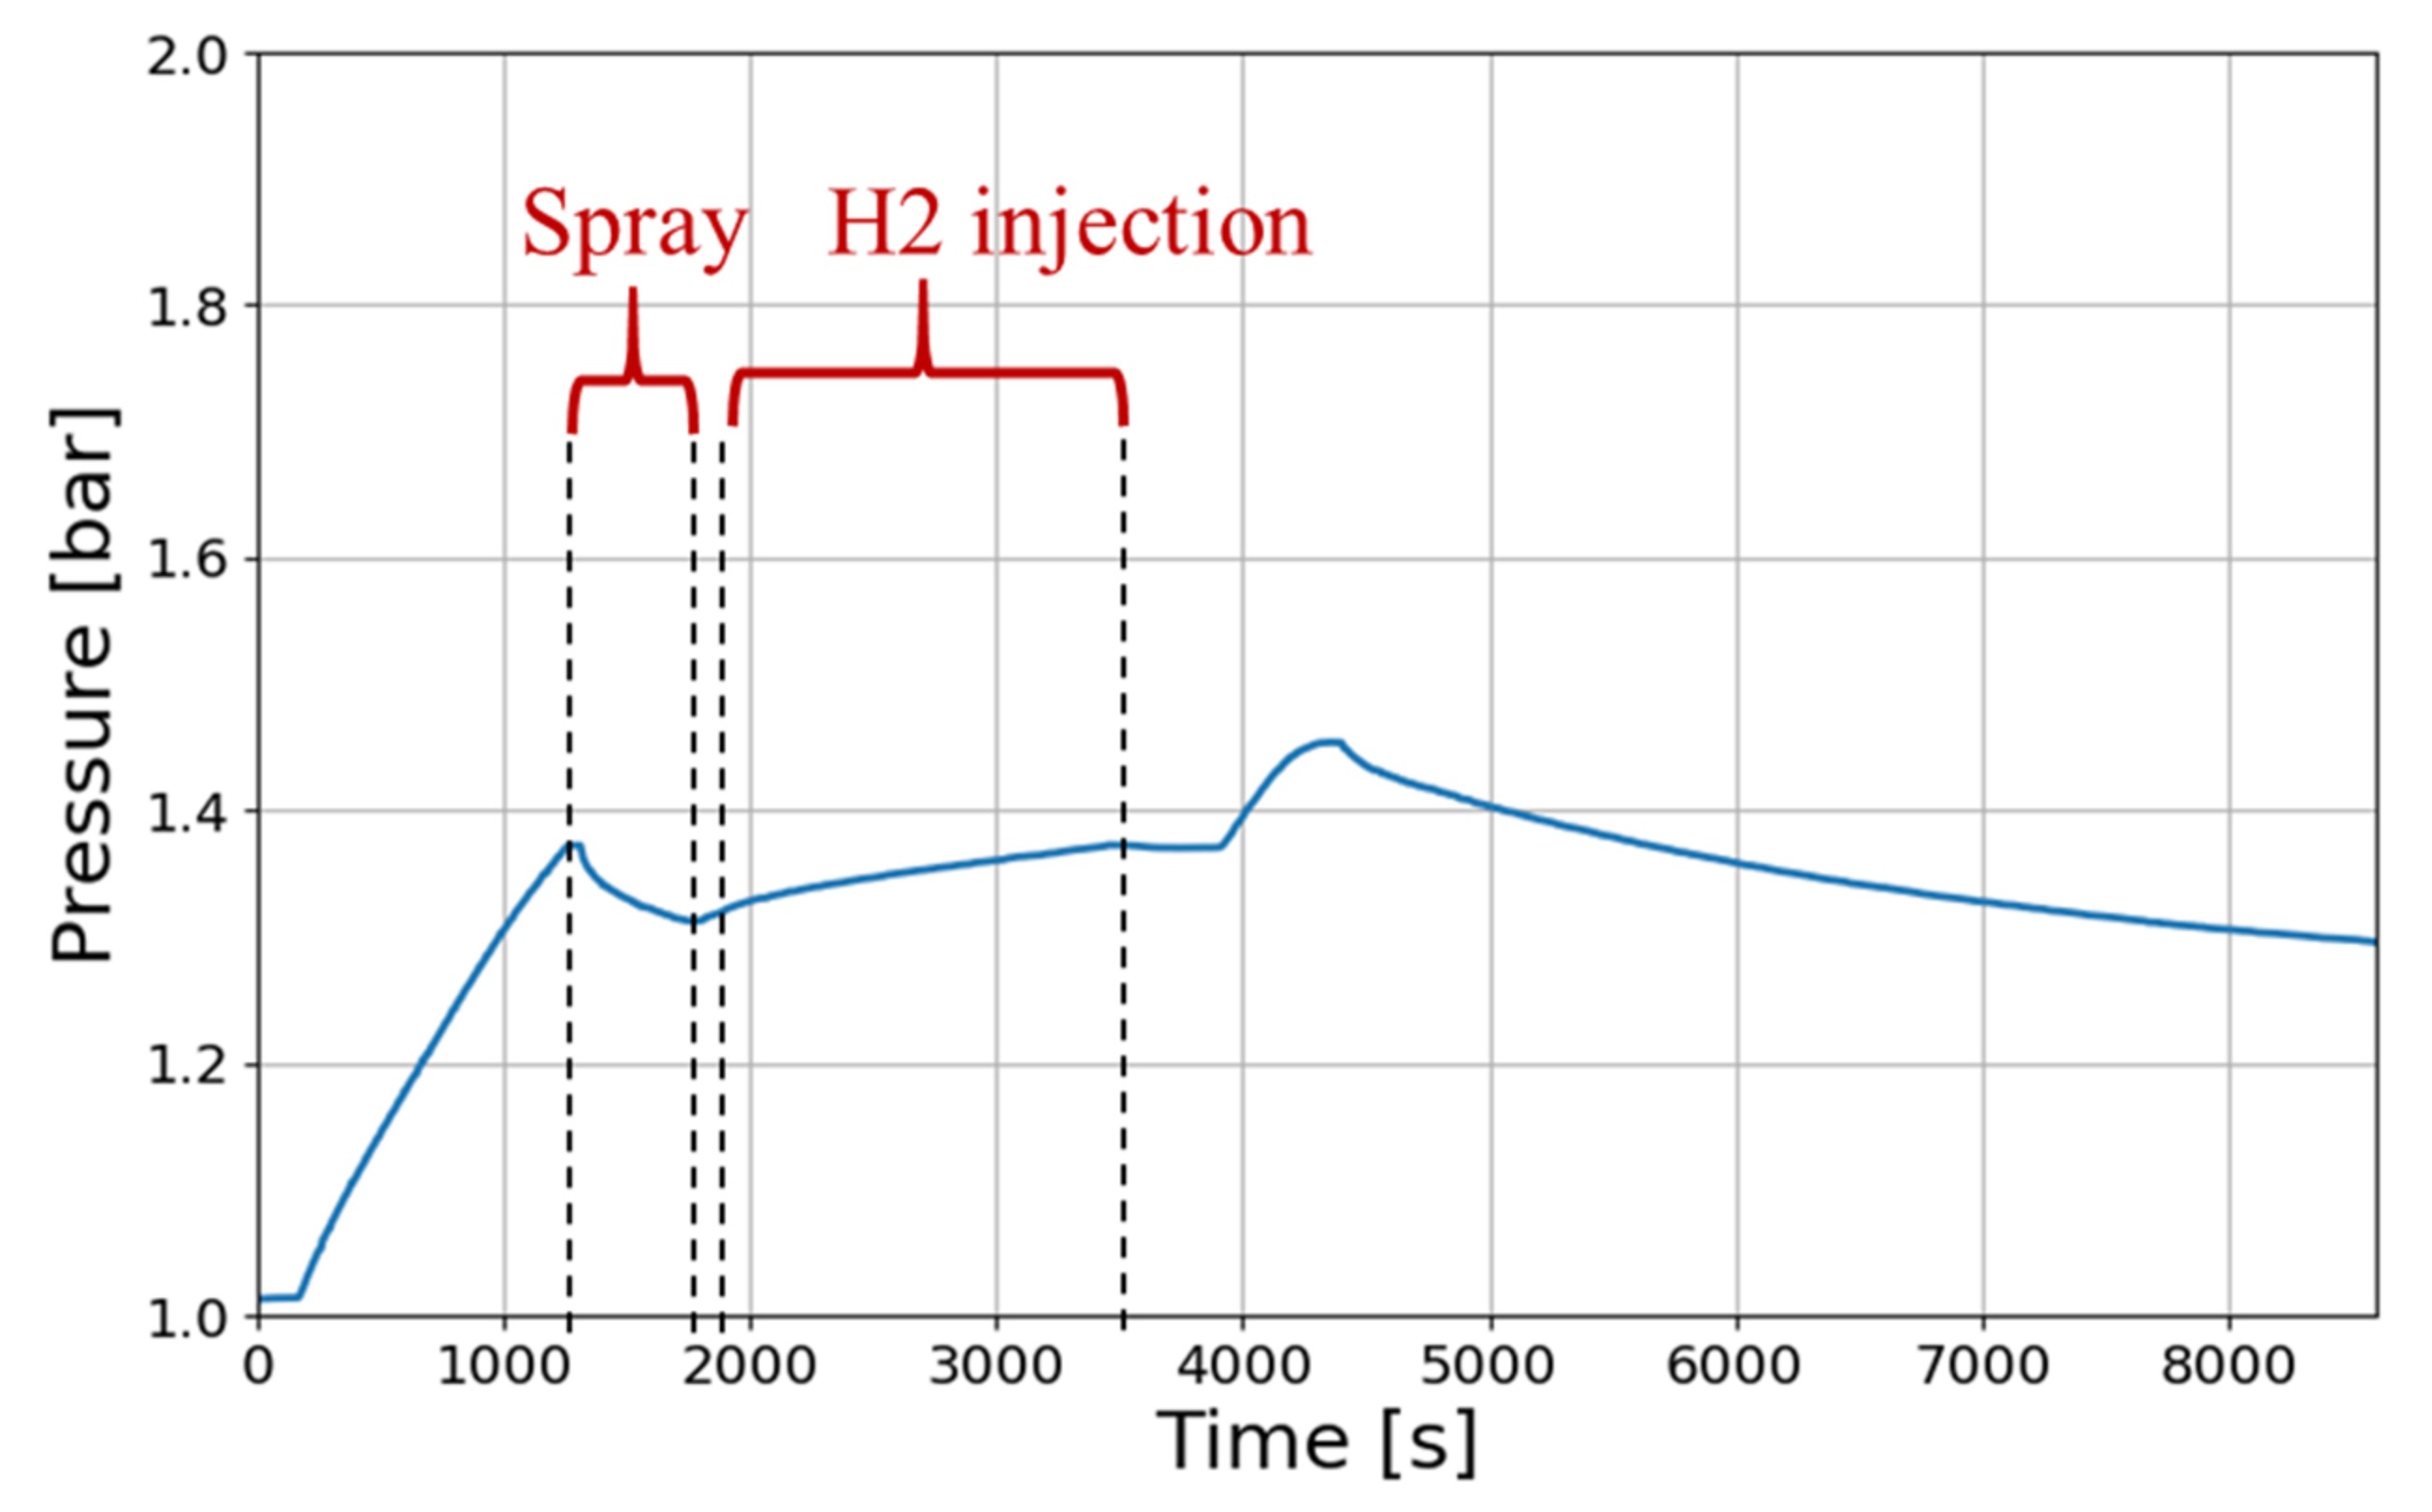
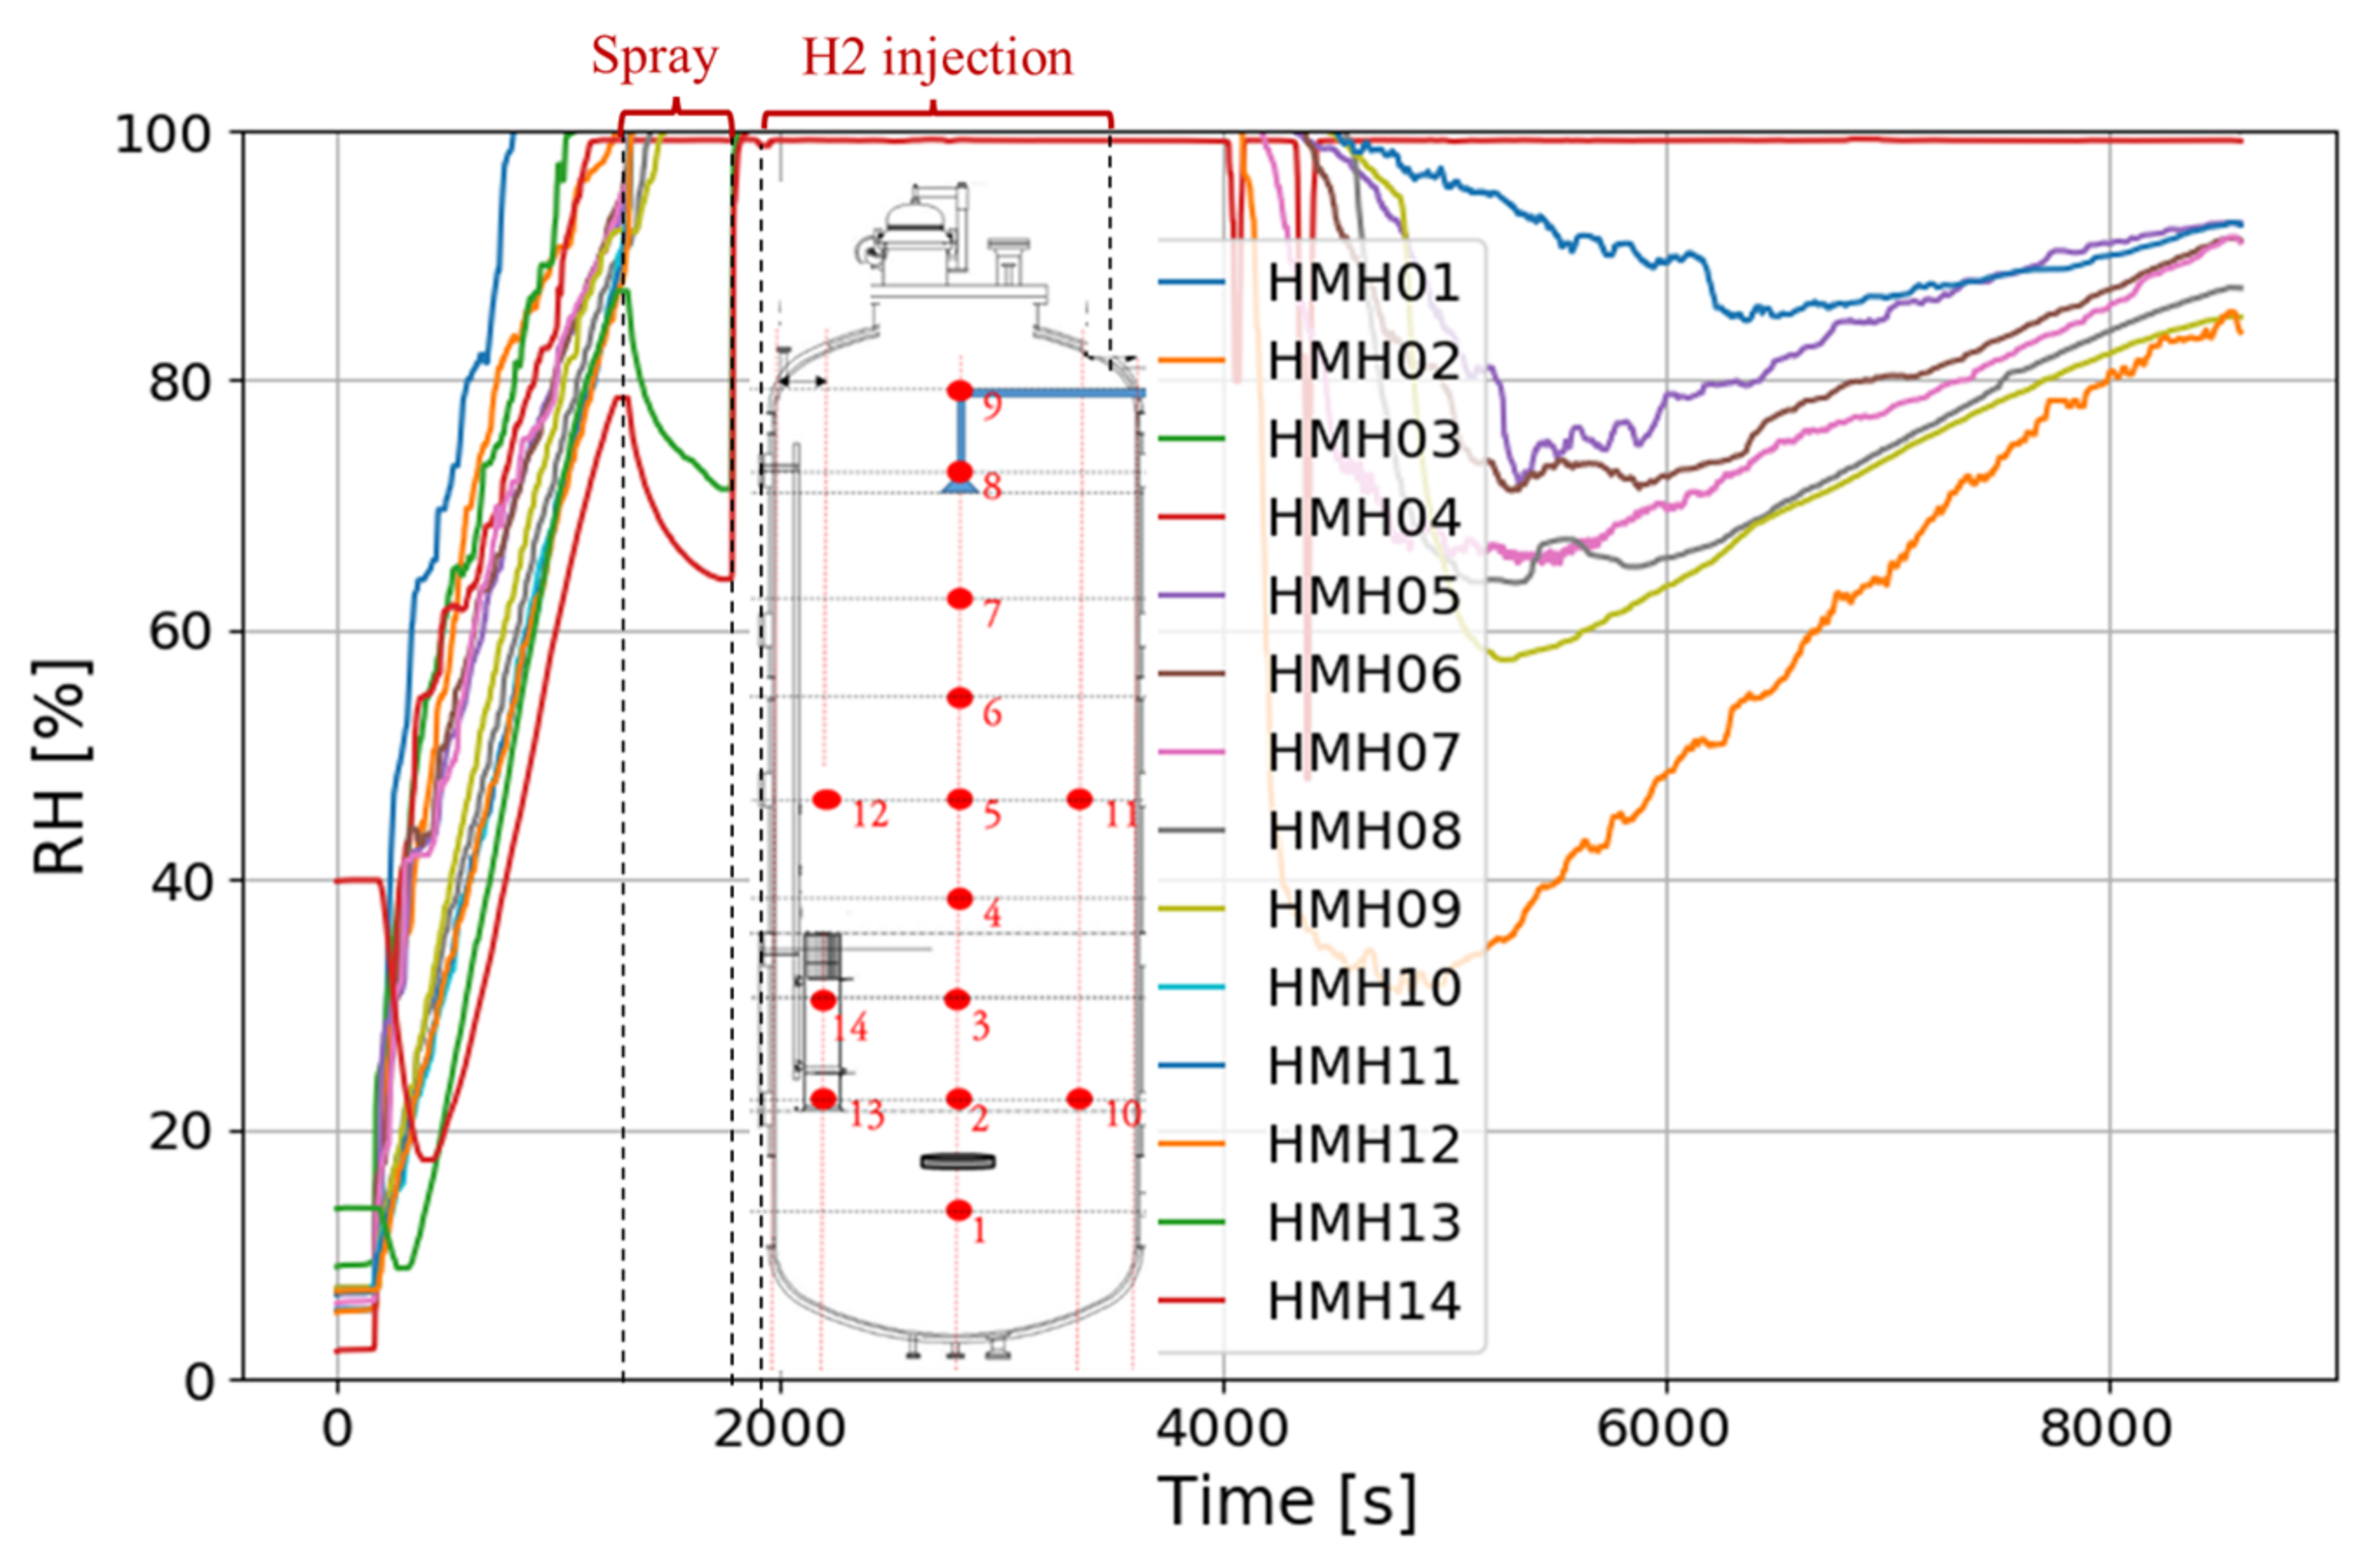
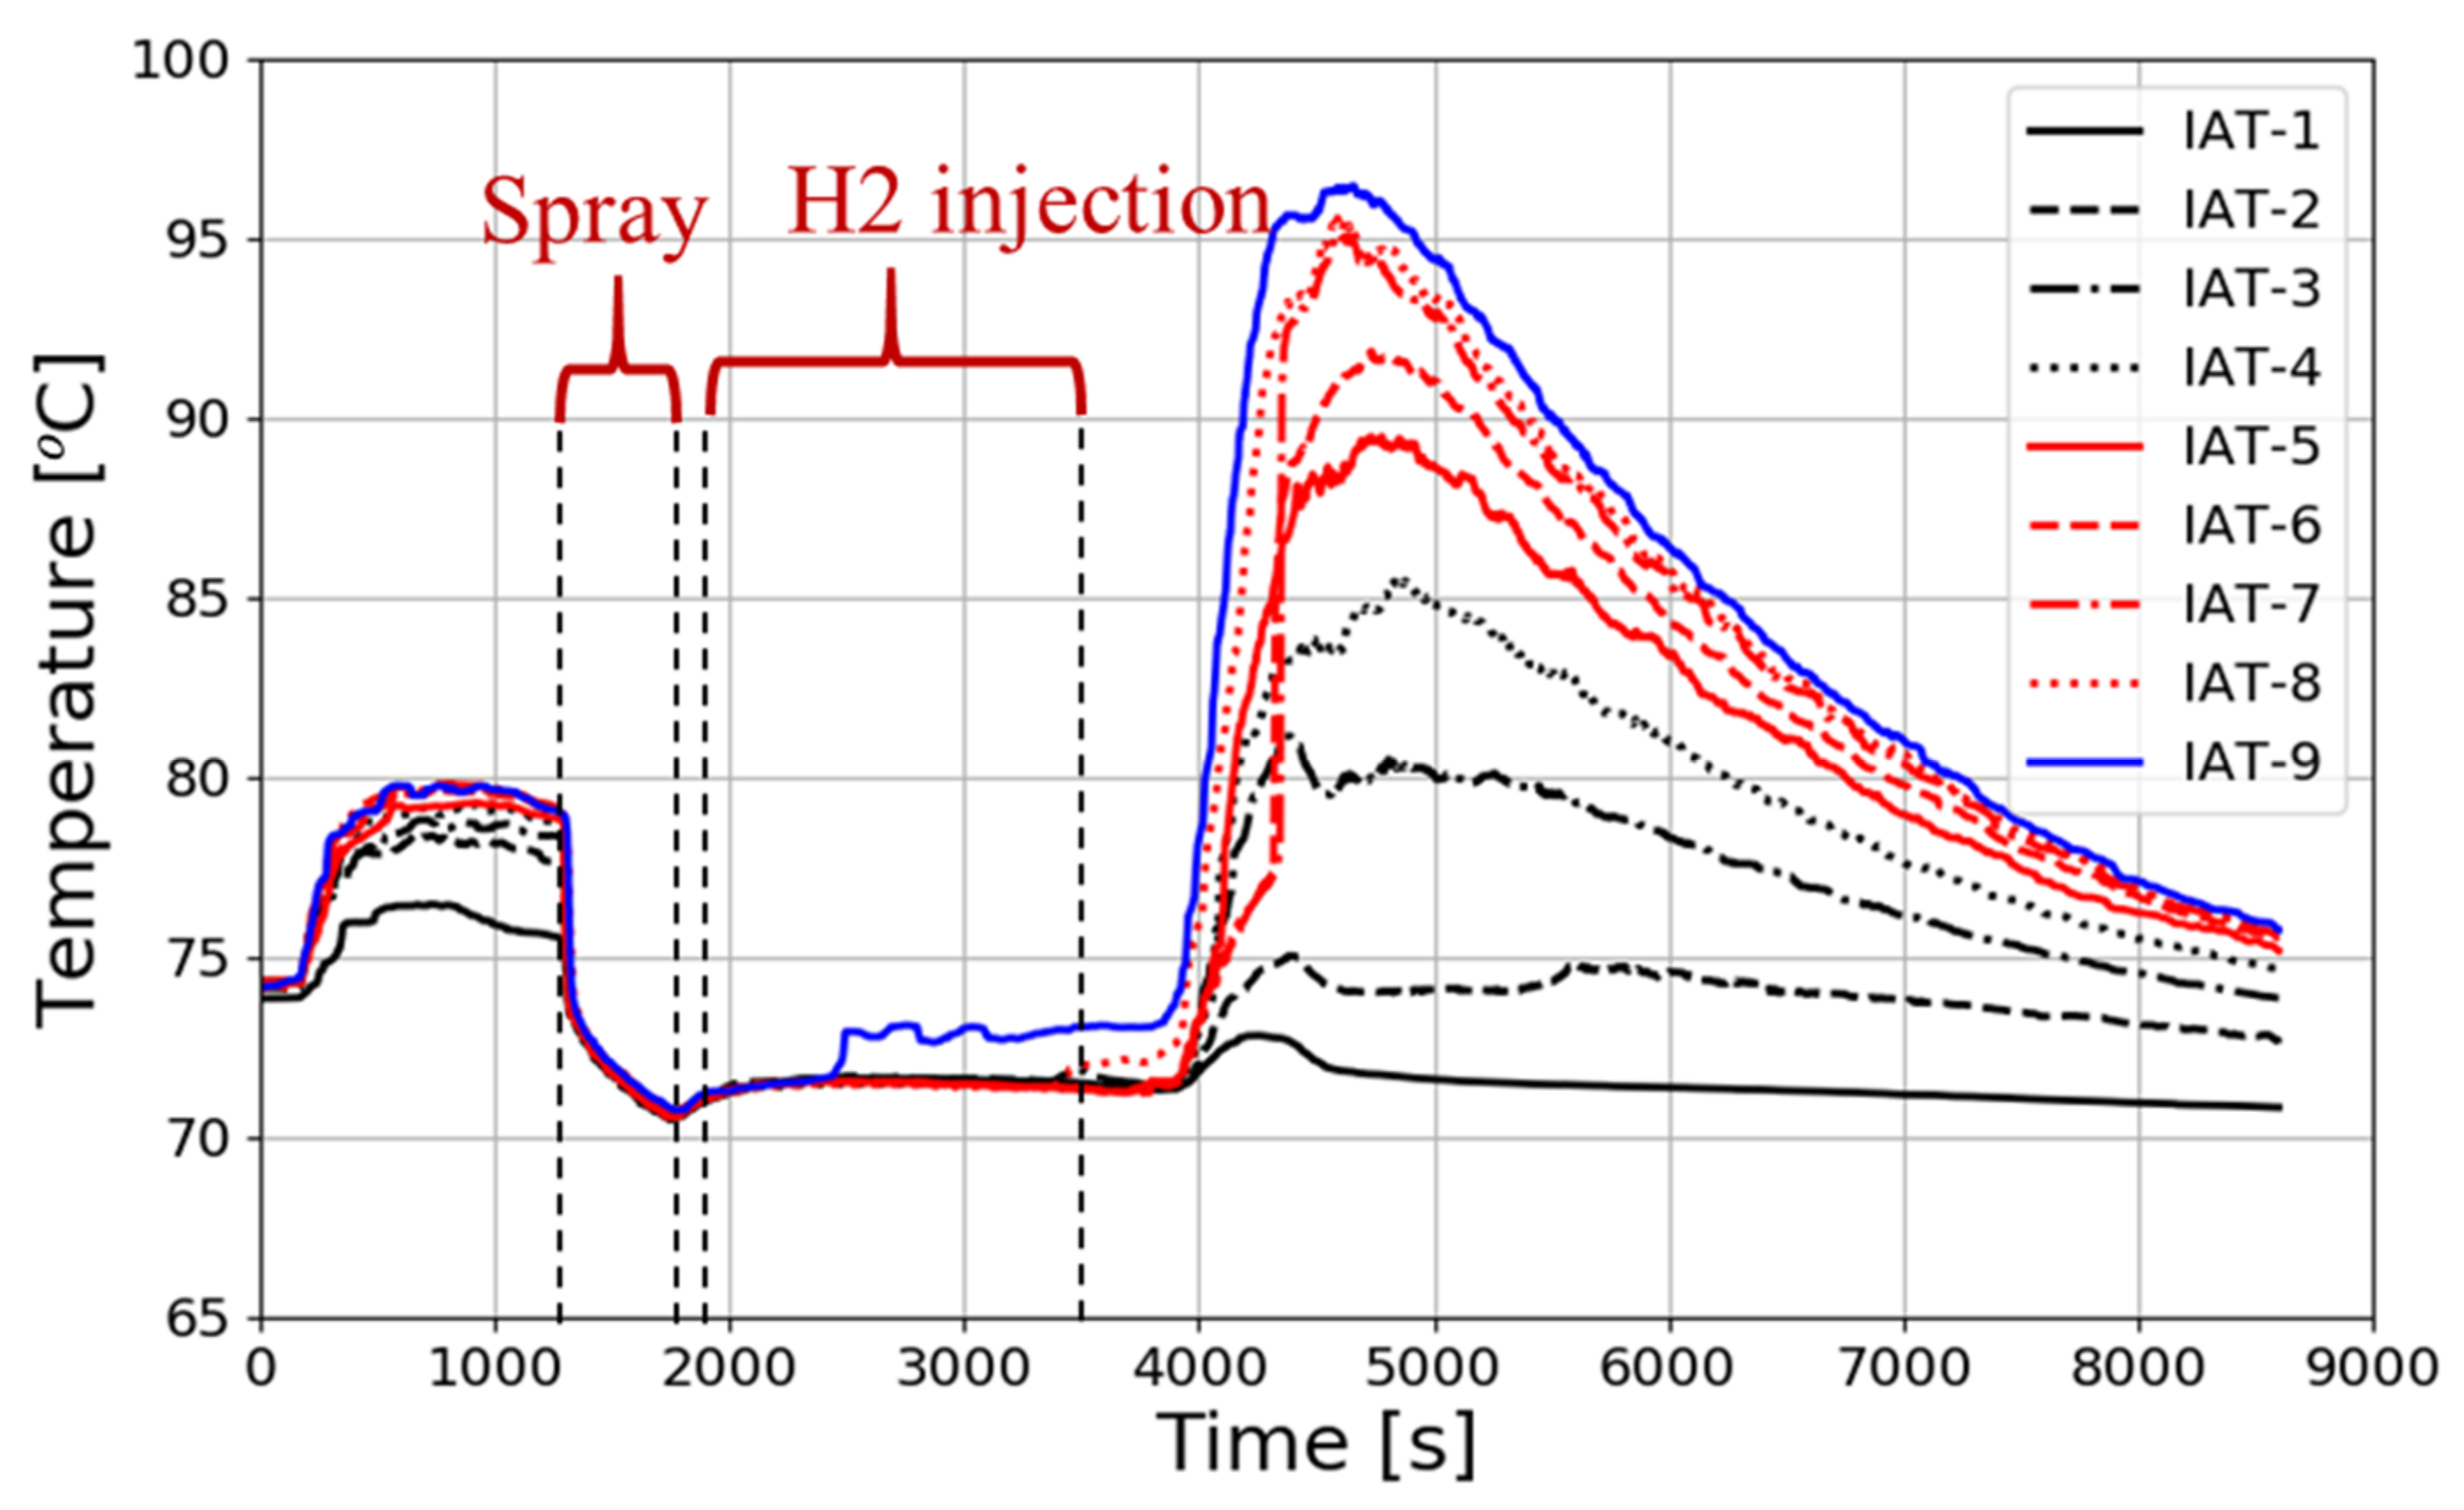
The purpose of this study was to evaluate the effect of a spray on the hydrogen removal by a PAR using the SPARC test facility. For the SPARC-SPRAY-PAR(SSP) experiment, SSP3 and SSP4 tests were performed according to the start time of the spray activation based on the PAR operation. The SSP3 test was an experiment to simulate an accident in which the PAR operated as hydrogen was released after the spray was activated, and the SSP4 test was an experiment to simulate an accident in which the spray began after the operation of the PAR was initiated by a hydrogen release.
A requirement for the installation of spray nozzles on a containment ceiling is to cover the whole area of the containment. Due to the large wetted area, the possibility that the droplet would flow into the top exit of the PAR was very high. In the SSP experiment, the angle of the water spray nozzle and the arrangement of the PAR were designed so that part of the water droplets could flow into the PAR through the PAR exit.
Figure 8 shows a schematic diagram of the SSP3 spray test. The SSP3 test proceeded in the order of steam injection, spray start, stop of steam injection and spray, and initiation of hydrogen injection. The main phenomenon of the SSP3 test was related to the start-up characteristics of the hydrogen recombination of the PAR after exposure to a spray-droplet field.
In high-pressure accidents such as a station blackout accident (SBO), since a large amount of reactor coolant can be discharged to a water storage tank through a pressure-relief valve, the pressure in the containment building hardly rises. When a depressurization system is activated, steam and hydrogen are released into the containment. Thereafter, the pressure inside the containment rises, and the spray can be operated. In such a high-pressure accident, there is a possibility that the PAR will be activated before the spray activation due to the release of hydrogen. SSP4 was an experiment to evaluate the hydrogen-recombination characteristics of a PAR when spraying was operated in a state in which the PAR was operating according to released hydrogen. Figure 9 shows a schematic diagram of the SSP4 test. The SSP4 test proceeded in the order of steam injection, hydrogen injection, and spray start. In this test, it was expected that the spray would be operated when the PAR was actively recombining the released hydrogen. The main purpose of the SSP4 test was to evaluate the effect of spray activation on an operating PAR.

4.2. SSP3 Test

Figure 10 shows the pressure change in the pressure vessel during the SSP3 test. The pressure rose due to the injection of steam, and the pressure decreased as the spray operated. Steam was injected from the start of the test to 1920 s, and the spray was operated from 1290 s to 1790 s.
The steam injection and the spray were stopped, and the hydrogen injection was started shortly thereafter. The hydrogen injection proceeded for 1600 s, from 1890 s to 3490 s. It can be seen in Figure 10 that the pressure gradually increased during this period. The pressure seemed to rise rapidly starting at about 4000 s, and we supposed that the operation of the PAR began from this point. In the SSP3 test, the spray was operated for 500 s at a flow rate of 1 kg/s. The spray water was preheated to a temperature of 50 °C in a water tank and then sprayed using a pump.
In general, during spraying, the droplets and the atmosphere rapidly reached thermal equilibrium, and the atmosphere remained saturated. Figure 11 shows the relative humidity of the gas in the SSP3 test. It can be seen that the gas became saturated as the spray began. After that, when the PAR began to operate, the temperature of the gas rose, and the relative humidity decreased.
Figure 12 shows the progression in time of the gas-temperature distribution on the vertical line at the center of the pressure vessel in the SSP3 test. At the beginning of the experiment, while water vapor was injected, the temperature rose due to mixing with air. For about 2000 s after the spray stopped, the gas-temperature distribution was uniform and almost constant. After that, the temperature rose again with a distribution, indicating that the PAR was operating.
Figure 13 shows the hydrogen-injection flow rate and time-integrated mass of injected hydrogen in the SSP3 test. The hydrogen injection was carried out for 1600 s (1890 s~3490 s) at a mass flow rate of 0.2 g/s, and a total of 318 g of hydrogen was injected.
The distribution of hydrogen concentration along the vertical line at the center of the pressure vessel is depicted in Figure 14, which shows a rather high concentration of hydrogen just above the hydrogen-injection nozzle (H2) while hydrogen was being injected. At the H1 point below the nozzle, the concentration was very low compared to that in other places. The decrease in hydrogen concentrations after 4000 s was mainly due to hydrogen recombination by the PAR.
Figure 15 shows the gas velocity obtained from the vane wheel anemometer installed at the PAR inlet. From the figure, it can be inferred that flow in the PAR chamber was developed twice. The first flow development was due to the spray operation, because its period coincided with the period of the spray operation. From 3890 s, the second flow was observed at the PAR inlet, where hydrogen recombination by the PAR was thought to be initiated.
There are some indications to predict the operation of a PAR. These are the development of a PAR inlet velocity, as shown in Figure 15; a very low hydrogen concentration at the PAR outlet (below 1 %); and a very high temperature of the PAR catalyst. Figure 16 shows the changes in hydrogen concentration at the PAR inlet and outlet. Between 2000 and 3500 s, the hydrogen concentration was higher at the outlet than at the PAR inlet, and the inlet and outlet concentrations were reversed at about 3500 s, leading to a steep decrease in the outlet concentration at 3890 s. That is, the period between 2000 s and 3890 s can be viewed as a start-up delay time of the PAR.
In Figure 17, the bottom and top temperatures of the PAR catalyst and the exhaust gas temperature during the SSP3 test were compared. In the case of SSP3, the exhaust gas temperature rises earlier than the catalyst body during the start-up period of the PAR operation. This seems to be related to wetting by water droplets on the surface of the catalyst body.
Figure 18 shows a comparison of the values obtained using Method-1 and method-2 for the hydrogen-removal rate of the SSP3 test with the correlation equation of the KPAR-40 PAR. In the case of SSP3, when a PAR inlet-velocity correction factor of 0.8 was used, the hydrogen-removal rates of Method-1 and Method-2 were well matched.
Figure 19 shows a comparison of the hydrogen-injection timing and the PAR-operation timing in the SSP3 test. In a typical PAR experiment, the operation of the PAR begins when hydrogen is injected, because some hydrogen easily flows into the PAR inlet. However, in the SSP3 test, at 400 s after the end of the hydrogen injection, hydrogenation recombination by the PAR began. This amounted to 2000 s (33 min) after the start of hydrogen injection.

4.3. SSP4 Test

In the SSP4 test, the spray operated while the hydrogen injection continued. Figure 20 shows the pressure change in the test vessel during the SSP4 test. In the SSP4 test, the steam injection was stopped and the hydrogen injection was started after a rest period of 100 s. The hydrogen injection ran for 2500 s, from 1727 s to 4226 s. It can be seen that the pressure rose due to the injection of steam, the operation of the PAR began at around 2500 s, and the pressure rose again; however, it also can be seen that the pressure decreased sharply when the spray started at 2732 s. After the spray was stopped, the pressure rose again due to the operation of the PAR.
Figure 21 shows progression in time of the gas-temperature distribution on the vertical line at the center of the pressure vessel in the SSP4 test. Similar to the pressure behavior, when the operation of the PAR began at around 2500 s, the temperature of the gas rose, and the temperature decreased during the spray operation for 500 s starting at 2732 s, then the temperature rose again due to the continuous operation of the PAR as the spray stopped. In particular, it seemed that the temperature of the gas dropped rapidly because there was no injection of steam during the spraying-operation period in the SSP4 test.
Figure 22 shows the hydrogen-injection flow rate and time-integrated mass of the injected hydrogen in the SSP4 test. The hydrogen injection was carried out for about 2500 s (1727 s~4226 s) at a mass flow rate of 0.2 g/s, and a total of 496 g of hydrogen was injected.
Figure 23 shows the distribution of hydrogen concentrations on the vertical line at the center of the pressure vessel. It shows a large concentration gradient during the hydrogen injection (1727 s~4226 s). Hydrogen was well mixed by the spray droplets for 500 s, starting at 2732 s when the spray operation was activated, so that the hydrogen concentration was distributed almost uniformly. However, as the spray was stopped, the concentration gradient of hydrogen increased again.
Figure 24 shows the gas velocities obtained from a vane wheel anemometer installed at the PAR inlet. At 565 s after the start of the hydrogen injection, the gas inflow began at the PAR inlet, and as the spray started, the gas velocity entering the PAR inlet rapidly increased and then decreased. This appeared to be influenced by the gas flow induced by the spray droplets. The PAR inflow rate appeared to be stabilized before the end of the spray. That is, it was thought that the spray did not seriously affect the flow induced by the PAR.
Figure 25 shows the changes in hydrogen concentration at the PAR inlet and outlet. After 200 s of hydrogen injection, hydrogen at a concentration of about 0.1% was detected at the PAR inlet, and 327 s after this point, the hydrogen concentration at the PAR outlet dropped quickly, and an inlet flow was formed (Figure 24). In the SSP4 test, the period of 327 s was regarded as the start-up delay time of the PAR. This was 1/6 of the 1890 s found in the SSP3 test. It also can be seen in the figure that the hydrogen concentration at the PAR outlet increased up to 0.5 % during the spray operation. This meant that the spray droplets on the catalytic surface hindered the complete depletion of the hydrogen. However, the effect was thought to be limited because the exit hydrogen concentration began to be quickly reduced before the end of the spray operation.
In Figure 26, the bottom and top temperatures of the PAR catalyst and the exhaust gas temperature of the SSP4 test are compared. Unlike the SSP3 test, the bottom temperature of the catalyst body rose first, and the exhaust gas temperature rose simultaneously with the top temperature of the catalyst body. The temperatures were slightly lowered due to the start of the spray operation, but they continued to rise during the spray operation. Therefore, we confirmed that after the hydrogen recombination of the PAR began, even if the water droplets fell onto the catalyst, a serious quenching of the catalyst body did not occur.
Figure 27 compares the values obtained using Method-1 and Method-2 for the hydrogen-removal rate in the SSP4 test using the KPAR-40 correlation equation. In the case of the SSP4 test, as in SSP3, we used 0.8 as the PAR inlet-velocity correction factor. Until 4500 s, the hydrogen removal rate using Method-2 showed a very irregular behavior, but after that, it showed a value very similar to that of the correlation equation. The reason that the hydrogen-removal rate obtained using Method-1 was lowered at around 3000 s seemed to originate from the fluctuation in the inlet velocity created by the start of the spray operation. After passing through this transient state, the inflow of PAR was restored, and the hydrogen-removal rate was also restored.
Figure 28 compares the hydrogen-injection timing and the PAR-operation timing in the SSP4 test. The hydrogen-removal rate depicted in the figure was obtained using Method-1, and it was confirmed that the PAR was operated a few minutes after the hydrogen injection began, which was similar to a typical start-up delay. The figure also shows that the hydrogen-recombination rate of the PAR was decreased by the initiation of the spray, but recovered rapidly despite the continuous operation of the spray.

5. Conclusions

A spray system is installed in a containment building of a pressurized-water reactor to ensure the integrity of the containment building by maintaining a containment pressure lower than the design pressure in accident conditions. However, during the operation of this pressure-control system, the effectiveness of the hydrogen-control system and the safety of hydrogen in the containment building must be ensured.
In this study, the hydrogen-removal characteristics of a grid-type PAR were experimentally evaluated when the pressure-control system using a spray was operated, and the conclusions were as follows.
In the case when the spray was operated before the hydrogen release, the PAR start-up was significantly delayed by the spray droplets entering the PAR chamber. It is thought that spray water on the surface of a catalyst body hinders the temperature rise of the catalyst body, which is a major parameter of catalytic-surface reactions. On the contrary, the hydrogen-removal rate of the PAR was hardly affected even though the spray droplets entered the PAR chamber in the case where the spray was activated after the PAR operation began.
Regarding accident management for a nuclear power plant in operation, the spray system may be activated before the release of hydrogen in the containment building, and in this case, wetting of the PAR catalysts by the spray droplets may occur. Since wetting of the PAR catalysts can increase the delay time of the start-up of the PARs, it is necessary to review the effects of the PAR start-up delay using a spray operation in the containment for hydrogen safety.

Author Contributions

Conceptualization, J.K.; Methodology, S.H., K.-H.P., J.-H.K. and J.-Y.O.; Software, J.K. and S.H.; Validation, S.H.; Formal Analysis, J.K.; Investigation, K.-H.P., J.-H.K. and J.-Y.O.; Resources, S.H.; Data Curation, S.H.; Writing—Original Draft Preparation, J.K.; Writing—Review and Editing, J.K.; Visualization, J.K.; Supervision, J.K.; Project Administration, J.K.; Funding Acquisition, J.K. All authors have read and agreed to the published version of the manuscript.

Funding

This work was supported by a National Research Foundation of Korea (NRF) grant funded by the Korea government (Ministry of Science, ICT) (No. 2017M2A8A4015277).

Institutional Review Board Statement

Not applicable.

Informed Consent Statement

Not applicable.

Data Availability Statement

The data presented in this study are available within the article. There are no databases associated with this manuscript.

Conflicts of Interest

The authors declare no conflict of interest. The funders had no role in the design of the study; in the collection, analyses, or interpretation of data; in the writing of the manuscript; or in the decision to publish the results.

Nomenclature

AArea (m2)
mMass (kg)
m ˙ Mass flow (kg/s)
NNumber of mole (kmole)
pPressure (Pa)
RUniversal gas constant (J/kmol-K)
R ˙ h 2 Hydrogen recombination rate (kg/s)
RHRelative humidity (−)
TTemperature (K)
UVelocity (m/s)
WMolecular weight (kg/kmole)
xMole fraction of a gas species (−)
YMass fraction of a gas species (−)
ρDensity (kg/m3)
Subscripts
h2oWater vapor (Steam)
h2Hydrogen
o2Oxygen
inInlet
outOutlet
mMixture

References

  1. Korea Institute of Nuclear Safety. Light Water Reactor Nuclear Power Plant Regulatory Standards and Regulatory Guidelines; Korea Institute of Nuclear Safety: Daejeon, Korea, 2015. [Google Scholar]
  2. US-NRC. Combustible Gas Control for Nuclear Power Reactors, NRC Regulations 10CFR 50.44. 2020. Available online: https://www.nrc.gov/reading-rm/doc-collections/cfr/part050/part050-0044.html (accessed on 1 May 2020).
  3. AREVA. AREVA Passive Autocatalytic Recombiner. 2020. Available online: https://us.areva.com/home/liblocal/docs/Solutions/literature/G-008-V1PB-2011-ENG_PAR_reader.pdf (accessed on 3 April 2021).
  4. Kelm, S.; Jahn, W.; Reinecke, E.-A. Operational Behaviour of Catalytic Recombiners—Experimental Results and Modelling Approaches. In Proceedings of the OECD/NEA workshop on the Experiments and CFD Code Application to Nuclear reactor Safety, Grenoble, France, 10–12 September 2008. [Google Scholar]
  5. Bachellerie, E.; Arnould, F.; Auglaire, M.; De Boeck, B.; Braillard, O.; Eckardt, B.; Ferroni, F.; Moffett, R. Generic Approach for Designing and Implementing a Passive Autocatalytic Recombiner PAR-System in Nuclear Power Plant Containments. Nucl. Eng. Des. 2003, 221, 151–165. [Google Scholar] [CrossRef]
  6. Dewit, W.A.; Koroll, G.W.; Sitar, L. Hydrogen Recombiner Development at AECL. In Proceedings of the OECD/NEA/CSNI Workshop on the Implementation of Hydrogen Mitigation Techniques, Winnipeg, MB, Canada, 13–15 May 1996. [Google Scholar]
  7. Passive Autocatalytic Recombiner (PARs), SNC-LAVALIN AECL. 2021. Available online: www.snclavalin.com/nuclear (accessed on 3 April 2021).
  8. Park, J.W.; Koh, B.R.; Suh, K.Y. Demonstrative Testing of Honeycomb Passive Autocatalytic Recombiner for Nuclear Power Plant. Nucl. Eng. Des. 2011, 241, 4280–4288. [Google Scholar] [CrossRef]
  9. Kim, C.H.; Sung, J.J.; Ha, S.J.; Yeo, I.S. Analysis Method for the Design of a Hydrogen Mitigation System with Passive Autocatalytic Recombiners in OPR1000. In Proceedings of the 19th Pacific Basin Nuclear Conference and 38th Annual Student Conference of the Canadian Nuclear Society and Canadian Nuclear Association, Vancouver, BC, Canada, 24–28 August 2014. [Google Scholar]
  10. Reinecke, E.-A.; Bentaib, A.; Kelm, S.; Jahn, W.; Meynet, N.; Caroli, C. Open Issues in the Applicability of Recombiner Experiments and Modeling to Reactor Simulations. Prog. Nucl. Energy 2010, 52, 136–147. [Google Scholar] [CrossRef]
  11. Arnould, F.; Bachellerie, E.; Auglaire, M.; De Boeck, B.; Braillard, O.; Eckardt, B.; Ferroni, F.; Moffett, R.; Van Goethem, G. State of the Art on Hydrogen Passive Autocatalytic Recombiner. In Proceedings of the 9th International Conference on Nuclear Engineering, Nice, France, 8–12 April 2001. [Google Scholar]
  12. Simon, B.; Reinecke, E.-A.; Kubelt, C.; Allelein, H.-J. Start-up Behaviour of a Passive Auto-catalytic Recombiner under Counter flow conditions: Results of a first orienting experimental Study. Nucl. Eng. Des. 2013, 278, 317–322. [Google Scholar] [CrossRef]
  13. Reinecke, E.-A.; Kelm, S.; Heidelberg, D.; Klauck, M.; Steffen, P.-M.; Alleleina, H.-J. Modeling the start-up behavior of passive auto-catalytic recombiners in REKO-DIREKT. In Proceedings of the 8th European Review Meeting on Severe Accident Research—ERMSAR-2017, Warsaw, Poland, 16–18 May 2017. [Google Scholar]
  14. Gupta, S.; Kanzleiter, T.; Pos, G. Passive Autocatalytic Recombiners (PAR) Induced Ignition and the Resulting Hydrogen Deflagration Behaviour in LWR Containments. In Proceedings of the NURETH-16, Chicago, IL, USA, 30 August–4 September 2015. [Google Scholar]
  15. Chakraborty, A.; Reinecke, E.-A.; Meynet, N.; Bentaib, A.; Chaumeix, N.; Allelein, H.-J. Investigation of Ignition Characteristics of Passive Autocatalytic Recombiners. In Proceedings of the ICAPP 2017, Kyoto, Japan, 24–28 April 2017. [Google Scholar]
  16. Gardner, L.; Liang, Z.; Clouthier, T.; MacCoy, R. A Large-scale Study on the Effect of Ambient Conditions on Hydrogen Recombiner-Induced Ignition. Int. J. Hydrog. Energy 2021, 46, 12594–12604. [Google Scholar] [CrossRef]
  17. Kim, J.; Hong, S.; Park, K.H.; Kim, J.H.; Oh, J.Y. Experimental Study on a Hydrogen Stratification Induced by PARs Installed in a Containment. Energies 2020, 13, 5552. [Google Scholar] [CrossRef]
  18. Schmidt, E.; Freitag, M. Passive Autocatalytic Recombiner Operation under Counter Current Flow Conditions (Test Series HR-46–HR-50); Reactor Safety Research Project 1501516; OECD-NEA: Paris, France, 2017. [Google Scholar]
  19. Blanchat, T.K.; Malliakos, A.C. Testing a Passive Autocatalytic Recombiner in the Surtsey Facility. Nucl. Technol. 2000, 129, 356–373. [Google Scholar] [CrossRef] [Green Version]
  20. Klauck, M.; Reinecke, E.-A.; Allelein, H.-J. Effect of par deactivation by carbon monoxide in the late phase of a severe accident. Ann. Nucl. Energy 2021, 151, 107887. [Google Scholar] [CrossRef]
  21. Meynet, N.; Bentaib, A.; Giovangigli, V. Impact of Oxygen Starvation on Operation and Potential Gas-phase Ignition of Passive Auto-catalytic Recombiners. Combust. Flame 2014, 161, 2192–2202. [Google Scholar] [CrossRef]
  22. Kanzleiter, T.; Gupta, S.; Fischer, K.; Ahrens, G.; Langer, G.; Kühnel, A.; Poss, G.; Langrock, G.; Funke, F. Hydrogen and Fission Product Issues Relevant for Containment Safety Assessment under Severe Accident Conditions; Reactor Safety Research Project 1501326; OECD-NEA: Paris, France, 2010. [Google Scholar]
  23. Gupta, S.; Poss, G.; Freitag, M.; Schmidt, E.; Colombet, M.; Von Laufenberg, B.; Kuhnel, A.; Langer, G.; Funke, F.; Langrock, G.; et al. Aerosol and Iodine Issues and Hydrogen Mitigation under Accidental Conditions in Water Cooled Reactors; Reactor Safety Research Project 1501420; OECD-NEA: Paris, France, 2015. [Google Scholar]
  24. Kim, J.; Hong, S.; Park, K.H.; Kim, J.H.; Oh, J.Y. Experimental Study on the Grid-Type Passive Auto-Catalytic Recombiner for Hydrogen Mitigation in a Containment; KAERI Technical Report, TR-9069; KAERI: Daejeon, Korea, 2021. [Google Scholar]
  25. Korea Hydro and Nuclear Power Company (KHNP). Preliminary Safety Analysis Report for Shin-Ulchin 1 and 2 Nuclear Power Plants; Korea Hydro and Nuclear Power Company (KHNP): Gyeongju, Korea, 2007. [Google Scholar]
  26. Na, Y.S.; Hong, S.; Hong, S.W. Commissioning of the SPARC Test Facility; KAERI Technical Report, TR-6392; KAERI: Daejeon, Korea, 2016. [Google Scholar]
Figure 1. SPARC test facility and the vessel specifications.
Hydrogen 03 00013 g001
Figure 2. Measurement points of hydrogen and oxygen concentrations, vapor humidity, and temperature for SPARC tests.
Hydrogen 03 00013 g002
Figure 3. Spray-nozzle test to verify spray angle and droplet-size distribution.
Hydrogen 03 00013 g003
Figure 4. Construction of test PAR using a KPAR-40 PAR.
Hydrogen 03 00013 g004
Figure 5. Schematics for measurement-system installations at PAR inlet: (a) generic installation; (b) revised installation to minimize thermal radiation effect.
Hydrogen 03 00013 g005
Figure 6. Comparison of gas temperatures. SPT13: PAR inlet; IAT-C-2.0: center of the vessel at 2 m height; IAT-E-2.0, IAT-W-2.0, IAT-S-2.0, and IAT-N-2.0: east, west, south, and north from the center of the vessel at 2 m height, respectively; HMT13: inside of the T-type connector (see Figure 5).
Hydrogen 03 00013 g006
Figure 7. Profile of a PAR inlet velocity according to boundaries.
Hydrogen 03 00013 g007
Figure 8. Schematic of the SSP3 test procedure.
Hydrogen 03 00013 g008
Figure 9. Schematic of the SSP4 test procedure.
Hydrogen 03 00013 g009
Figure 10. Time variation in the vessel pressure during the SSP3 test.
Hydrogen 03 00013 g010
Figure 11. Time variations in the relative humidity measured during the SSP3 test.
Hydrogen 03 00013 g011
Figure 12. Time variations in the gas temperatures measured during the SSP3 test.
Hydrogen 03 00013 g012
Figure 13. Injection rate and integrated mass of hydrogen during SSP3 test.
Hydrogen 03 00013 g013
Figure 14. Time variations in the hydrogen concentrations during the SSP3 test.
Hydrogen 03 00013 g014
Figure 15. Time variation in the gas velocity measured at the PAR inlet during the SSP3 test.
Hydrogen 03 00013 g015
Figure 16. Time variations in the hydrogen concentrations at the PAR inlet and outlet during the SSP3 test. H13: PAR inlet; H14: PAR outlet.
Hydrogen 03 00013 g016
Figure 17. Variations in the catalyst and exhaust gas temperatures during the SSP3 test.
Hydrogen 03 00013 g017
Figure 18. Comparison of the hydrogen recombination rates for the SSP3 test.
Hydrogen 03 00013 g018
Figure 19. Changes in hydrogen injection and recombination over time.
Hydrogen 03 00013 g019
Figure 20. Time variation of the vessel pressure during the SSP4 test.
Hydrogen 03 00013 g020
Figure 21. Time variations of the gas temperatures measured during the SSP4 test.
Hydrogen 03 00013 g021
Figure 22. Injection rate and integrated mass of hydrogen during the SSP4 test.
Hydrogen 03 00013 g022
Figure 23. Time variations in the hydrogen concentrations during the SSP4 test.
Hydrogen 03 00013 g023
Figure 24. Time variation of the gas velocity measured at the PAR inlet during the SSP4 test.
Hydrogen 03 00013 g024
Figure 25. Time variations in the hydrogen concentrations at the PAR inlet and outlet during the SSP4 test. H13: PAR inlet; H14: PAR outlet.
Hydrogen 03 00013 g025
Figure 26. Variations in the catalyst and exhaust gas temperatures during the SSP4 test.
Hydrogen 03 00013 g026
Figure 27. Comparison of the hydrogen recombination rates during the SSP4 test.
Hydrogen 03 00013 g027
Figure 28. Changes in hydrogen injection and recombination during the SSP4 test.
Hydrogen 03 00013 g028
Publisher’s Note: MDPI stays neutral with regard to jurisdictional claims in published maps and institutional affiliations.

