Abstract
We performed a hydrogen combustion analysis in the Advanced Power Reactor 1400 MWe (APR1400) containment during a severe accident initiated by a small break loss of coolant accident (SBLOCA) which occurred at a lower part of the cold leg using a multi-dimensional hydrogen analysis system (MHAS) to confirm the integrity of the APR1400 containment. The MHAS was developed by combining MAAP, GASFLOW, and COM3D to simulate hydrogen release, distribution and combustion in the containment of a nuclear power plant during the severe accidents in the containment of a nuclear power reactor. The calculated peak pressure due to the flame acceleration by the COM3D, using the GASFLOW results as an initial condition of the hydrogen distribution, was approximately 555 kPa, which is lower than the fracture pressure 1223 kPa of the APR1400 containment. To induce a higher peak pressure resulted from a strong flame acceleration in the containment, we intentionally assumed several things in developing an accident scenario of the SBLOCA. Therefore, we may judge that the integrity of the APR1400 containment can be maintained even though the hydrogen combustion occurs during the severe accident initiated by the SBLOCA.
1. Introduction
A hydrogen explosion accident, which was started from a station blackout (SBO) induced by the tsunami, occurred at the nuclear power plants (NPP) with a boiling water reactor in Fukushima in 2011 and released a significant amount of radioactive materials into the environment through a broken part of a reactor building containment [1]. As an effect of this accident, Korea Atomic Energy Research Institute (KAERI) evaluated an integrity of the containment of the Advanced Power Reactor 1400 MWe (APR1400) which is operating in the Republic of Korea. The evaluation was first performed by calculating an overpressure buildup owing to a hydrogen flame acceleration using a multi-dimensional hydrogen analysis system (MHAS) for a hypothetical severe accident initiated by the SBO accident [2,3]. The MHAS was developed by combining MAAP [4], GASFLOW [5], and COM3D [6] for simulating hydrogen release, distribution and combustion in the containment of a NPP during the severe accident. In particular, an analysis methodology for the COM3D code was established to accurately calculate the overpressure buildup on the basis of the validation results against several test data [3].
Before the occurrence of the hydrogen explosion accident of the NPP in Fukushima, most evaluations for a hydrogen combustion risk during severe accidents in the NPP containment were conducted to simply check the possibility of hydrogen flame acceleration or the deflagration to detonation transition (DDT) on the basis of some criteria, such as the sigma and d/7λ indexes or the Shapiro diagram, using a hydrogen distribution result in the containment by a 1-dimensional lumped parameter code or a 3-dimensional computational fluid dynamic code [7,8,9,10,11,12,13]. After the hydrogen explosion accident, for an evaluation of the hydrogen combustion risk in the NPP containment, a numerical analysis to calculate the overpressure buildup owing to the hydrogen combustion has been conducted on the basis of the validation results for the hydrogen combustion models to accurately simulate the flame acceleration [14,15,16,17,18].
From the calculation results using the MHAS for the severe accident initiated by the SBO accident in the APR1400 containment, we judged that the integrity of the containment can be maintained because the calculated peak pressure of 510 kPa was lower than the containment fracture pressure of 1223 kPa [3,19]. In the evaluation, a 100% metal-water reaction in the reactor pressure vessel (RPV) was assumed in developing the severe accident scenario to induce a higher hydrogen concentration in the containment according to the safety review guidelines [20]. This calculation result may have resulted from the design features of the APR1400 containment which are a large air free volumes of approximately 88,631 m3 in the cylindrical dome geometry with diameter 45.72 m and height 69.69 m and an opening structure of the steam generator (SG) compartments where the hydrogen was discharged upward to the upper region by the safety depressurization system [3,19]. In addition, the thirty passive auto-catalytic recombiners (PARs) located at several positions in the containment, such as in Figure 1, effectively removed the released hydrogen as the severe accident proceeded [9,10,19].
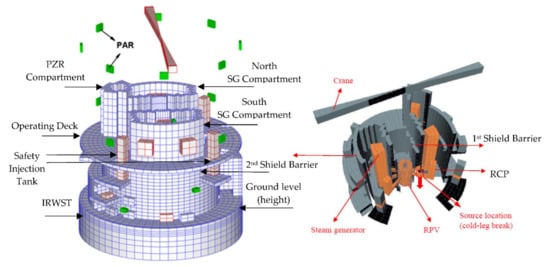
Figure 1.
Internal geometry configuration of the APR1400 containment [9,10].
To additionally confirm the integrity of the APR1400 containment when the hydrogen combustion occurs during the severe accidents, it is necessary to evaluate the peak overpressure due to the flame acceleration when the hydrogen releases downward to a lower region of the SG compartment where the air free volume is small, as shown in Figure 1, compared to the upper region because the reactor coolant pumps (RCPs), component supports and pipes are located in the lower region. A severe accident scenario applicable for the hydrogen discharging to the lower region of the SG compartment is a small break loss of coolant accident (SBLOCA) occurred at a lower part of the cold leg located in the SG compartment. The SBLOCA firstly discharges the high temperature water and vaporized water from the reactor coolant system (RCS) to the lower region in the SG compartment. As the second phase of the scenario, operational failures of the safety injection system and the shutdown cooling system generate the hydrogen gas through a chemical reaction between metals and steam in the RPV. Finally, the generated hydrogen gas is released to the lower region in the SG compartment through the broken lower part of the cold leg. In the accident scenario, we assume 2 inches break over the diameter 30 inches of the cold leg according to the safety review guideline of light water reactors for the design basis accidents such as the loss of coolant accident [19,21,22].
2. Multi-Dimensional Hydrogen Analysis System
2.1. Calculation Method of the Multi-Dimensional Hydrogen Analysis System
The MHAS consists of MAAP, GASFLOW, and COM3D for the hydrogen combustion analysis in the 3-dimensional containment of the NPP during the severe accidents. The MAAP code evaluates the release rate of the high temperature water, steam, and hydrogen generated from the RPV into the containment according to the accident scenario. The GASFLOW calculates the steam, hydrogen, and air distribution in the 3-dimensional containment with the gas sources calculated by the MAAP using a cylindrical grid model with a larger cell length for a long transient time. The COM3D calculates the overpressure buildup owing to the hydrogen flame acceleration in the 3-dimensional containment using the GASFLOW results of the gas concentrations, thermo-hydraulic data, and turbulence quantities as initial conditions through a transferring process of the calculation data and the grid model from the GASLOW to the COM3D. During the transferring work, the cylindrical geometry of the grid model is changed to the cartesian geometry, and its cell size is also changed to a smaller length to accurately analyze the hydrogen flame acceleration and pressure wave propagation along the important small structures in the containment.
2.2. Established Analysis Methodology for the Hydrogen Flame Acceleration
The analysis methodology for the hydrogen flame acceleration using the COM3D version 4.10 was established such as Table 1 on the basis of the validation results against the test data of ENACCEF and THAI, as shown in Figure 2 [3]. This methodology accurately predicted the peak overpressure developed in the hydrogen flame acceleration with an error range of approximately ±10%. The test data of ENACCEF and THAI were chosen through examining a similarity of the gas concentrations and the geometric characteristics between the test facilities and the severe accident scenarios in the APR1400 [3,14].

Table 1.
Proposed COM3D Analysis Methodology for the Hydrogen Flame Acceleration [3].
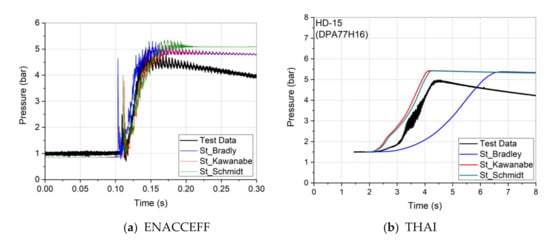
Figure 2.
COM3D validation results against the test data [3].
The combustion model KYLCOM+ in the COM3D code solves the compressible combustion flow using a set of transport equations for every gas species, the total energy, mass, and momentum on the basis of the forest fire algorithm with the burning velocity model for predicting the hydrogen flame propagation [6]. The transport equation (Equation (1)) for the burning velocity model uses a progressive variable f in which f = 0 represents a fresh mixture gas and f = 1 represents a completely combusted gas. The source term (Φ) in the transport equation for the burning velocity model represents the turbulent flame speed using the Kawanabe correlation (St), the gas expansion ratio (σ), and the numerical constant (β) (Equations (2) to (4)). The laminar flame speed (SL) of the burned gas in Equation (4) is obtained from the test data which are dependent of the temperature, pressure, and steam concentration. The combustion energy from the chemical reaction of the hydrogen-air mixture is calculated by the one-step reaction (Equation (5)) and the generated energy is used as the heat source of the energy equation [6]. The turbulent fluctuation velocity (u′) can be obtained by use of the calculated turbulent kinetic energy from the Standard k-ε turbulent model (Equation (6) to (11)) which is a very efficient model for simulating a turbulent flow in the hydrogen combustion [3,23,24]; Cμ = 0.09, C1 = 1.44, C2 = 1.92, Ck = 1.0, and Cε = 1.3.
H2 + 1/2O2 + 1.82N2 → H2O + 1.82N2 + 0.242 MJ
3. The MHAS Analysis for the SBLOCA
3.1. Calculation of the Hydrogen Distribution by GASFLOW and MAAP
The calculated results by the MAAP code for the generation of the water, steam, and hydrogen in the RCS and its release rates to the containment through the break part of the cold leg are shown in Figure 3. According to the steam behavior in Figure 3, the steam generation in the RCS starts at approximately 200 s after the SBLOCA begins because the high pressure 15.5 MPa of the RCS is consistently decreased to the containment pressure, of which initial pressure is approximately 0.1 MPa, as the subcooled and pressurized water in the RCS is discharged to the containment. In addition, the hydrogen release starts from approximately 5000 s and shows its peak at approximately 6300 s as the chemical reaction between the metals and the steam in the RPV proceeds. The total generated mass of the water, steam, and hydrogen in the RPV is 165 ton, 92 ton, and 1.002 ton during the severe accident of 10,000 s on the basis of assumption of the metal water reaction in the RPV [25].
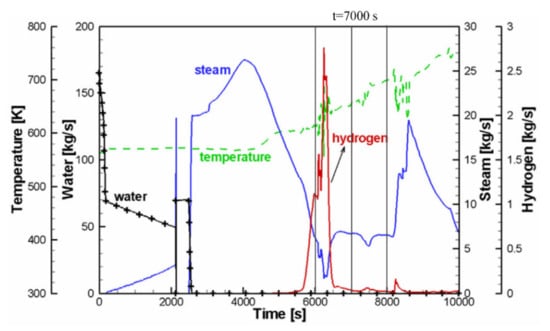
Figure 3.
MAAP results for the SBLOCA.
The GASFLOW code calculates the distribution of the steam, hydrogen, and air in the containment during the severe accident using the MAAP results as the mass and energy source terms (Figure 4 and Figure 5). The initial temperature and pressure of the air in the containment are assumed as 300 K and 0.1 MPa, respectively. The GASFLOW results show that an amount of approximately 50% of the discharged water with high temperature of approximately 700 K from the break part is instantly changed to the steam through the flash evaporation phenomenon in the early stage of the SBLOCA [26]. The vaporized steam mixes with the air while it flows along an air space between structures in the north SG compartment which is driven by a pressure difference between the reactor and the containment. According to Figure 4, as time passes from 110 s to 1100 s, the discharged steam flows out the north SG compartment through the air space between the structures in the lower region of the containment and moves to the south SG compartment after flowing in the circumferential direction along the secondary shield structure. As the momentum of the discharge steam is decreased, the steam located in both SG compartments starts to flow upward to the upper region in the containment by a buoyancy force, and finally higher steam concentrations with approximately 40 to 45% are distributed in the upper containment region such as Figure 4c.
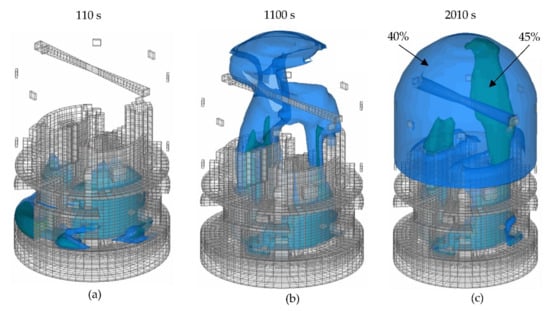
Figure 4.
Iso-surface of steam concentrations according to time variation.
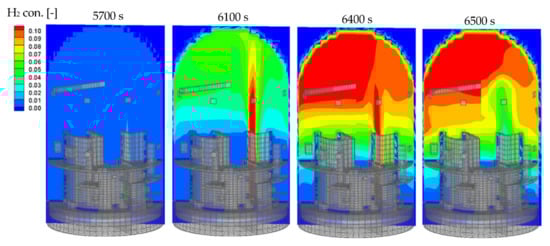
Figure 5.
GASFLOW results for the SBLOCA.
Figure 5 shows that the hydrogen releases upward in the north SG compartment even though the break region is located at the lower part of the cold leg. This upward flow has a different flow pattern when compared to the steam flow from 110 s to 1100 s in the SBLOCA. The difference may be explained by the fact that the decreased pressure difference between the RCS and the containment through the steam release period could not provide the forced convection flow from the break part to the containment. In addition, the hydrogen with a lighter density, approximately 15% of the steam density at the same thermal hydraulic condition [27], could not reach to the south SG compartment through penetrating the steam located in the lower region of the north SG compartment. The calculated hydrogen concentrations at the upper region in the containment by GASFLOW show a higher distribution at 6400 s than other times because the hydrogen release rate was the peak at approximately 6300 s as shown in Figure 3. The amount of hydrogen, oxygen, and steam obtained from the GASFLOW calculation results at 6400 s are 852 kg, 24,221 kg, and 54,012 kg, respectively. In addition, the distributed hydrogen with approximately 10% over a large space along the containment upper region may sufficiently induce the hydrogen flame acceleration which may cause the overpressure buildup [3,9,10].
Thus, the calculated GASFLOW results at 6400 s are transferred as the initial conditions of the gases concentrations, temperature, pressure, and turbulence for the COM3D calculation are shown in Figure 6. The hydrogen, oxygen, and stem concentrations at around the lower region below the break part of the cold leg are approximately 57.6%, 4%, and 50%, respectively. The iso-surfaces of hydrogen 10% drawn by the GASFLOW and the COM3D (Figure 7) show an accurate transfer process from the GASFLOW to the COM3D. The distributed shape of the hydrogen-air mixture from the lower region in the north SG compartment to the upper region in the containment looks similar to a mushroom cloud with approximately 3.0 m diameter and 66 m length. The calculated turbulent kinetic energy (TKE) along the mushroom cloud shows a distribution of approximately 0.2 to 2.0 m2/s2, which value is approximately 10% of those at the SBO accident [3]. The reason of these smaller values of TKE at the SBLOCA case may be explained by the fact that the buoyancy dominated flow in the hydrogen release period produces less turbulence generation when compared to the forced convection flow dominated in the hydrogen discharge period at the SBO accident [3]. The initial pressure in the containment for the COM3D calculation shows approximately 0.22 MPa, which is increased from the initial pressure 0.1 MPa given to the GASFLOW calculation due to the release of the steam and hydrogen through the break park of the cold leg to the containment.
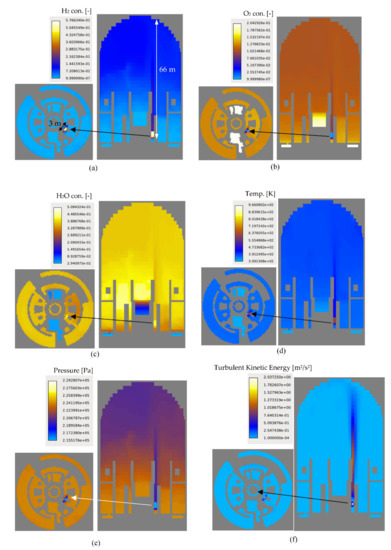
Figure 6.
Initial conditions of the COM3D calculation for the severe accident. (a) Hydrogen Concentration. (b) Oxygen Concentration. (c) Steam Concentration. (d) Temperature. (e) Pressure. (f) Turbulent Kinetic Energy.
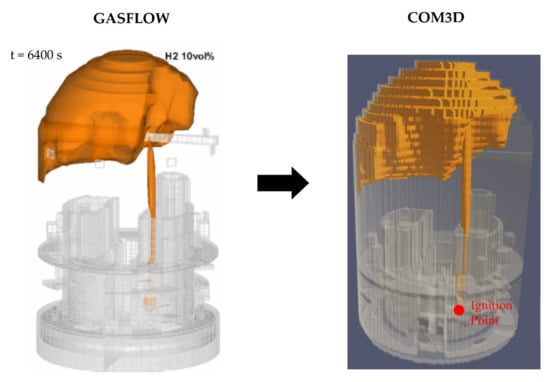
Figure 7.
Iso-surface of H2 10% in the grid model of GASFLOW and COM3D.
Through the transferring process of the grid model from the GASFLOW to the COM3D, a total of 1,453,025 hexahedral cells with the length of approximately 50 cm are generated for the calculation of the hydrogen flame acceleration to accurately resolve the propagation of the pressure and combustion waves through the narrow space between the structures located in the lower region of the containment as well as the large space in the upper region of the containment for a proper computational time [3,28,29]. The cell size of 50 cm for the grid model is determined on the basis of the grid sensitivity calculation results using the cell sizes of 25 cm, 50 cm, and 75 cm when the hydrogen-air mixture is distributed, as a vertical column with 0.5 m diameter and 57 m length, from the bottom of the SG compartment to the containment ceiling under the SBO accident scenario in the APR1400 containment [2,25]. In the grid model sensitivity calculation, the ignition point was also assumed at the bottom of the hydrogen-air mixture.
However, the generated air free volume in the transferred grid model for the COM3D is approximately 92,943 m3 which is approximately 4.8% larger than the design value of the APR1400 containment [19]. This small difference may have resulted from that the GASFLOW’s grid model using the cell length of approximately 100 cm could not accurately model the small size pipes such as the surge line between the hot leg and the pressurizer (PZR). As for the temperature condition to the outer wall of the containment, a constant temperature of 298 K is given to the outer surface of the grid model.
3.2. Calculation of the Hydrogen Flame Acceleration by the COM3D Code
The 3-dimensional calculation of the hydrogen flame acceleration during the severe accident initiated by the SBLOCA in the APR1400 containment was performed by the COM3D code for approximately 25 s using the transferred GAFLOW results and refined grid model on the basis of the established analysis methodology as shown in Table 1. To intentionally induce a high-pressure buildup owing to a fast flame acceleration through an obstacle geometry configuration over a long distance, the ignition point is assumed at around the hydrogen located at the lower region, the bottom position of the mushroom shape cloud, below the cold leg in the north SG compartment (Figure 7) [14,30]. The ignition phenomenon is simulated by use of a model of a hot spot spherical region with a radius of 0.5 m where the hydrogen flame propagation is calculated with the laminar flame speed through the hydrogen-air chemical reaction [6].
According to the calculated temperature distribution as time passes (Figure 8a), the hydrogen flame is propagated to the containment ceiling from the ignition point along the vertical direction, approximately 66 m, in 3.5 s after the start of the ignition. The calculated flame speeds using the flame arrival times and the distance between monitoring points from P1 to P4 (Figure 8b) shows a rapid increase to approximately 120 m/s and then a slightly decrease to approximately 60 m/s. These higher flame speeds compared to the flame speed of approximately 20 m/s at the upper region in the containment, P10 to P14, are resulted from the higher initial hydrogen concentrations and TKEs in the narrow space formed by the SG and the RCP in the north SG compartment. The flame arrival time is defined as the instant when the gas temperature increases to approximately 700 K after taking place of the hydrogen-air chemical reaction [3]. Figure 9a shows that the hydrogen with approximately 2% to 8% is remained at the lower region below the break part of the cold leg such as “A” though the flame is propagating to the upper region from the north SG compartment in the containment. This phenomenon may be explained by the fact that the oxygen with approximately 4% at the same location (Figure 9b) constraints the hydrogen mass consumed in the hydrogen-air chemical reaction such as Equation (5). This oxygen starvation phenomenon may also hinder the flame acceleration when the flame starts to propagate along the narrow space in the lower region.
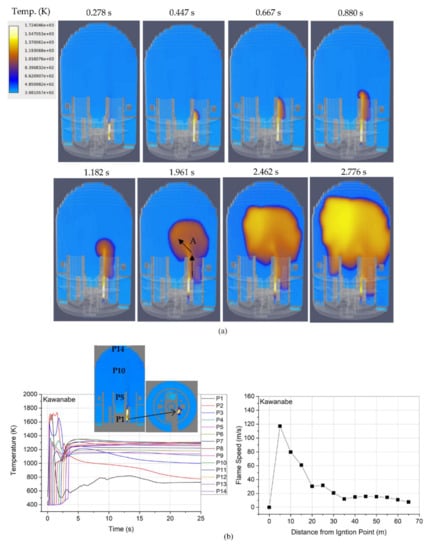
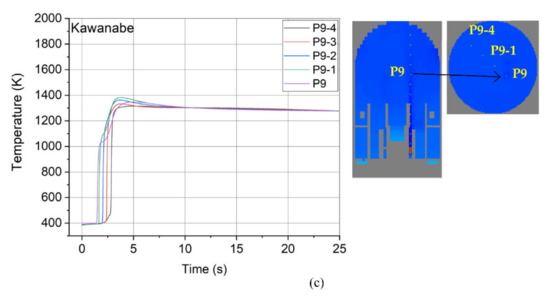
Figure 8.
Calculated temperature for the hydrogen flame acceleration by COM3D. (a) Temperature distribution as time passes. (b) Temperature behaviors and flame speeds from P1 to P14. (c) Temperature behaviors from P9 to P9-4.
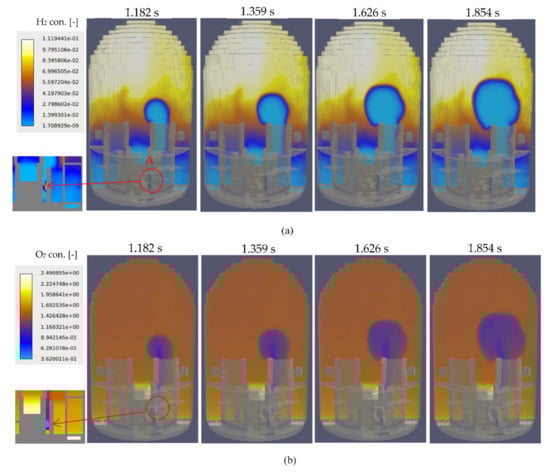
Figure 9.
Calculated gas concentrations according to time variation. (a) Hydrogen. (b) Oxygen.
The hydrogen flame emerging from the north SG compartment moves upward slightly to a left side (Figure 8a, A) where the hydrogen gas with the higher concentration than other sides is located as shown in Figure 9. As a result of this change of the flame direction, the hydrogen flame arrives earlier at the side wall of the containment than the containment ceiling. This can be found by comparing the temperature behaviors at the containment ceiling (P14) and the side wall (P9-4) as shown in Figure 8b,c. The temperature at P9-4 is earlier increased by approximately 0.5 s than that of P14. This direction changes of the flame propagation and the low turbulence generation due to the large space without the small structures at the upper region slows down the flame acceleration along the vertical direction, and the flame speed is finally reduced to approximately 20 m/s at around the containment dome region. If the hydrogen flame first arrives at the containment ceiling and then turns its direction to the side wall along the ceiling wall, the flame speed may be greatly increased owing to the generated turbulence along the walls [25,31].
The increased pressures due to the flame acceleration developed between the lower region in the SG compartment (P1) and the containment ceiling (P14) are approximately 330 kPa from the initial pressure of approximately 225 kPa (Figure 10a), which is imposing on the internal wall of the containment. In Figure 10a, the pressure behaviors at P1 to P14 are almost same except an early time interval from 0.0 s to 1.0 s because the pressure waves generated from the combusted region, where the hydrogen-air chemical reaction takes place, propagate as a hemi-spherical shape to the open and large space in the upper region of the containment, as shown in Figure 10b. In addition, the slow flame propagation with approximately 15 m/s in the upper region could not generate the high strength of the pressure wave. Therefore, it is found that the predicted peak pressure of approximately 555 kPa in the absolute pressure through the hydrogen combustion in the containment is lower than the fracture pressure 1223 kPa of the APR1400 containment [19]. The calculated peak pressure by the COM3D may decrease if the steam condensation phenomenon along the containment wall is simulated in the COM3D calculation [3]. The peak pressure of approximately 555 kPa during the severe accident initiated by the SBLOCA is approximately 45 kPa higher than that of the SBO accident. This difference may be explained by the fact that the more hydrogen mass of approximately 160 kg, which is transferred from the GASFLOW results, is used for the initial condition of the COM3D calculation at the SBLOCA case when compared to the SBO case.
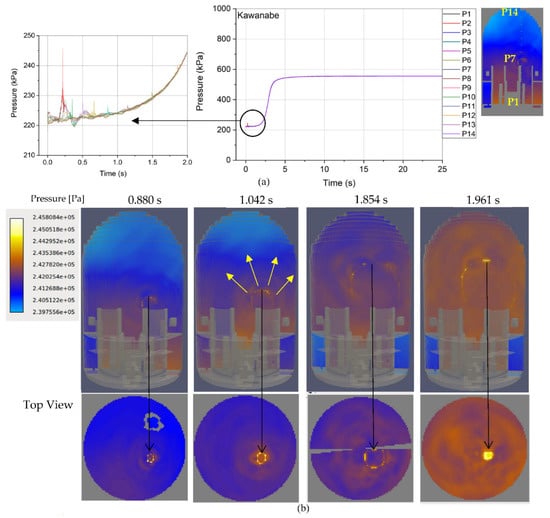
Figure 10.
Calculated pressure results. (a) Pressure behaviors at P1 to P14. (b) Pressure distribution to time variation.
4. Conclusions
We performed the hydrogen combustion analysis in the APR1400 containment during the severe accident initiated by the SBLOCA which occurred at the lower part of the cold leg using the MHAS, which consists of MAAP, GASFLOW, and COM3D, to confirm the integrity of the APR1400 containment. In particular, the buildup of pressure owing to the hydrogen flame acceleration was predicted by the COM3D code using the established analysis methodology, with an error range of approximately ±10%. Through the COM3D calculation for the flame acceleration, we found that the calculated peak pressure of approximately 555 kPa was lower than the fracture pressure 1223 kPa of the APR1400 containment. In the COM3D analysis, the ignition point was assumed at the bottom of the hydrogen-air mixture cloud in the lower region of the SG compartment to induce the strong flame acceleration along the narrow space formed by the components and shielding barrier wall. The reason for this lower peak pressure may have resulted from the design features of the APR1400 containment, including the open structure in the large space, the buoyancy characteristics of the light hydrogen gas, and the oxygen starvation phenomenon which occurred at around the hydrogen release point. Therefore, we may judge that the integrity of the APR1400 containment can be also maintained when the hydrogen combustion occurs during the severe accident initiated by the SBLOCA where the hydrogen discharges to the lower region in the containment.
As for a further work, it is recommended to develop other accident scenarios to distribute higher hydrogen concentrations along the containment walls during the severe accidents, which can induce the stronger flame acceleration in the APR1400 containment. If more dangerous accident scenarios are developed, the MHAS will be effectively used to investigate the integrity of the APR1400 containment.
Author Contributions
Conceptualization, S.-W.H.; methodology, H.-S.K.; software, H.-S.K. and J.K.; validation, H.-S.K.; formal analysis, H.-S.K. and J.K.; investigation, H.-S.K.; resources, H.-S.K. and J.K.; data curation, H.-S.K. and J.K.; writing—original draft preparation, H.-S.K.; writing—review and editing, J.K. and S.-W.H.; visualization, H.-S.K. and J.K.; supervision, S.-W.H.; project administration, S.-W.H.; funding acquisition, S.-W.H. All authors have read and agreed to the published version of the manuscript.
Funding
This work was supported by the National Research Foundation of Korea (NRF) grant (No. 2017M2A8A4015277) funded by the Ministry of Science, ICT, and Future Planning and Ministry of Trade, Industry and Energy and the Korea Institute of Energy Technology Evaluation and Planning (KETEP) grant (No. 20215810100020) funded by the Ministry of Trade, Industry, and Energy of the Republic of Korea.
Conflicts of Interest
The authors declare no conflict of interest.
Nomenclature
| Dt | turbulent diffusion coefficient [m2/s] |
| f | progressive variable [-] |
| k | turbulent kinetic energy [m2/s2] |
| P | pressure [Pa] |
| SL | laminar flame speed [m/s] |
| St | turbulent flame speed [m/s] |
| T | temperature [K] |
| u’ | turbulence fluctuation velocity [m/s] |
| Ui | velocity component [m/s] |
| Greek Letters | |
| α,β | correlation constant [-] |
| ε | turbulent eddy dissipation [m/s2] |
| μ | viscosity [kg/ms] |
| ρ | density [kg/m3] |
| σ | gas expansion coefficient [-] |
| Subscripts | |
| L | laminar |
| tur | turbulence |
| t | turbulence |
References
- International Atomic Energy Agency (IAEA). The Fukushima Daiichi Accident, Vol.1, Description and Context of the Accident; International Atomic Energy Agency (IAEA): Vienna, Austria, 2015. [Google Scholar]
- Kang, H.S.; Kim, J.; Kim, S.B.; Hong, S.W. Numerical analysis for H2 combustion in the APR1400 containment using a multi-dimensional H2 analysis system. In Proceedings of the 11th International Topical Meeting on Nuclear Reactor Thermal Hydraulics, Operational and Safety (UTHOS-11), Gyeongju, Korea, 9–13 October 2016. [Google Scholar]
- Kang, H.S.; Kim, J.; Hong, S.W.; Kim, S.B. Numerical Analysis for Hydrogen Flame Acceleration during a Severe Accident in the APR1400 Containment Using a Multi-Dimensional Hydrogen Analysis System. Energies 2020, 13, 6151. [Google Scholar] [CrossRef]
- Henry, R.E.; Paik, C.Y.; Plys, M.G. MAAP4-Modular Accident Analysis Program for LWR Plants; Fauske and Associates Inc.: Burr Ridge, IL, USA, 1994. [Google Scholar]
- Travis, J.R.; Royal, P.; Xiao, J.; Necker, G.A.; Reflinger, R.; Spore, J.W.; Lam, K.L.; Wilson, T.L.; Muller, C.; Nichols, B.D. GASFLOW: A Computational Fluid Dynamics Code for Gases, Aerosols, and Combustion; Karlsruhe Institute of Technology (KIT): Karlsruhe, Germany, 2011. [Google Scholar]
- Kotchourko, A.; Lelyakin, J.; Yanez, J.; Halmer, G.; Svishchev, Z.; Xu, Z.; Ren, K. COM3D User/Tutorial Guide, Version 4.10; Karlsruhe Institute of Technology (KIT): Karlsruhe, Germany, 2015. [Google Scholar]
- Bentaib, A.; Cataldo, C.; Chaumont, B.; Chevalier-Jabet, K. Evaluation of the impact PARs have on the hydrogen risk in the reactor containment: Methodology and application to PSA level 2. Sci. Technol. Nuclear Install. 2010, 2010, 320396. [Google Scholar] [CrossRef]
- Kim, H.C.; Suh, N.D.; Park, J.H. Hydrogen Behavior in the IRWST of APR1400 following a Station Blackout. Nucl. Eng. Technol. 2006, 38, 195–200. [Google Scholar]
- Kim, J.; Hong, S.W.; Kim, S.B.; Kim, H.D. Three-Dimensional Behaviors of the Hydrogen and Steam in the APR1400 Containment during a Hypothetical Loss of Feed Water Accident. Ann. Nucl. Energy 2007, 34, 992–1001. [Google Scholar] [CrossRef]
- Kim, J.; Hong, S.W.; Kim, S.B.; Kim, H.D.; Lee, U.J.; Royal, P.; Travis, J.R. Analysis of hydrogen behavior in the APR1400 containment with GASFLOW II. In Proceedings of the Tenth International Topical Meeting on Nuclear Reactor Thermal Hydraulics (NURETH-10), Seoul, Korea, 5–9 October 2003. [Google Scholar]
- Royal, P.; Rochholz, H.; Breitung, W.; Travis, J.R.; Necker, G. Analysis of Steam and Hydrogen Distributions with PAR Mitigation in NPP Containments. Nucl. Eng. Des. 2000, 202, 231–248. [Google Scholar] [CrossRef]
- Kudriakov, S.; Dabbene, F.; Studer, E.; Beccantini, A.; Magnaud, J.P.; Paillere, H.; Bentaib, A.; Bleyer, A.; Malet, J.; Porcheron, E.; et al. The TONUS CFD Code for Hydrogen Risk Analysis: Physical Models, Numerical Schemes and Validation Matrix. Nucl. Eng. Des. 2008, 238, 551–565. [Google Scholar] [CrossRef]
- Heitsch, M.; Huhtanen, R.; Techy, Z.; Fry, C.; Kostka, P.; Niemi, J.; Schramm, B. CFD Evaluation of Hydrogen Risk Mitigation Meaures in a VVER-440/213 Containment. Nucl. Eng. Des. 2010, 240, 385–396. [Google Scholar] [CrossRef]
- Bentaib, A.; Bleyer, A.; Meynet, N.; Chaumeix, N.; Schramm, B.; Höhne, M.; Kostka, P.; Movahed, M.; Worapittayaporn, S.; Brähler, T.; et al. SARNET Hydrogen Deflagration Benchmark: Main Outcomes and Conclusions. Ann. Nucl. Energy 2014, 74, 143–152. [Google Scholar] [CrossRef]
- Sathiah, P.; Komen, E.; Roekaerts, D. The Role of CFD Combustion Modeling in Hydrogen Safety-Part I: Validation Based on Small Scale Experiment. Nucl. Eng. Des. 2012, 248, 93–107. [Google Scholar] [CrossRef]
- Hong, S.W.; Kim, J.; Kang, H.S.; Na, Y.S.; Song, J. Research Effort for the Resolution of Hydrogen Risk. Nucl. Eng. Technol. 2015, 47, 33–46. [Google Scholar] [CrossRef]
- Xiao, J.; Travis, J.R.; Royl, P.; Necker, G.; Svishchev, A.; Jordan, T. Three-Dimensional All-Speed CFD Code for Safety Analysis of Nuclear Reactor Containment: Status of GASFLOW Parallelization, Model Development, Validation and Application. Nucl. Eng. Des. 2016, 301, 290–310. [Google Scholar] [CrossRef]
- Yanez, J.; Kuznetsov, M.; Souto-Iglesias, A. An Analysis of the Hydrogen Explosion in the Fukushima-Daiichi Accident. Int. J. Hydrog. Energy 2015, 40, 8261–8280. [Google Scholar] [CrossRef]
- Korea Hydro & Nuclear Power (KHNP). Final Safety Analysis Report of Shin-Kori 1&2; Korea Hydro & Nuclear Power (KHNP): Gyeongju-si, Korea, 2012. [Google Scholar]
- U.S.NRC. Regulation, 10CFR50.34(f), Additional TMI-Related Requirements; U.S.NRC: Rockville, MD, USA, 2015.
- Safety Review Guidelines for Light Water Reactors, Rev.6, KINS/GE-001; Korea Institute of Nuclear Safety (KINS): Daejeon, Korea, 2014.
- KEPCO & KHNP. Small Break Loss of Coolant Accident Evaluation Model, Rev.0, APR1400-F-A-NR-14001-NP, Rev.0; KEPCO & KHNP: Naju-si/Gyeongju-si, Korea, 2014. [Google Scholar]
- Kang, H.S.; NO, H.C.; Kim, S.B.; Kim, M.H. Methodology of CFD Analysis for Evaluating H2 Explosion Accidents in an Open Space. Int. J. Hydrogen Energy 2015, 40, 3075–3090. [Google Scholar] [CrossRef]
- Kang, H.S.; NO, H.C.; Kim, S.B. Application of the Developed CFD Analysis Methodology to H2 Explosion Accidents in an Open Space. Int. J. Hydrogen Energy 2017, 42, 1306–1317. [Google Scholar] [CrossRef]
- Hong, S.W.; Kim, J.; Kim, S.B.; Kang, H.S.; Na, Y.S.; Min, B.T.; Hong, S.H.; Son, D.G.; Song, J.H.; Jung, J.H.; et al. Development of Containment Long-Term Integrity Establishment Technology; Research Report, Report No. 4172/2016; KAERI: Daejeon, Korea, 2017. [Google Scholar]
- Peterson, R.J.; Grewal, S.S.; El-Wakil, M.M. Investigation of Liquid Flashing and Evaporation due to Sudden Depressurization. Int. J. Heat Mass Transf. 1984, 27, 301–310. [Google Scholar] [CrossRef]
- Bejan, A. Convection Heat Transfer, 2nd ed.; John Wiley and Sons Inc.: New York, NY, USA, 1995. [Google Scholar]
- Movahed-Shariat-Panahi, M.A. Recommendation for Maximum Allowable Mesh Size for Plant Combustion Analyses with CFD codes. Nucl. Eng. Design 2012, 253, 360–366. [Google Scholar] [CrossRef]
- Kotchourko, A.; Lelyakin, J.; (KIT, Karlsruhe, Land Baden-Württemberg, Germany). Personal communication, 2016.
- Dorofeev, S.B. Hydrogen Flames in Tubes: Critical Run-Up Distances. Int. J. Hydrogen Energy 2009, 34, 5832–5837. [Google Scholar] [CrossRef]
- Kang, H.S.; Kim, J.; Kim, S.B.; Hong, S.W. Preliminary Hydrogen Combustion Analysis for the APR1400 Containment Using the COM3D Code; Technical Report, Report No. 5312/2014; KAERI: Daejeon, Korea, 2016. [Google Scholar]


Publisher’s Note: MDPI stays neutral with regard to jurisdictional claims in published maps and institutional affiliations. |
© 2022 by the authors. Licensee MDPI, Basel, Switzerland. This article is an open access article distributed under the terms and conditions of the Creative Commons Attribution (CC BY) license (https://creativecommons.org/licenses/by/4.0/).