
Techno-Economic Analysis of a Process to Convert Methane to Olefins, Featuring a Combined Reformer via the Methanol Intermediate Product


Abstract
:1. Introduction
Problem Statement
- Shale gas that consists primarily of methane is an abundant, low-cost, carbon-containing feedstock that is widely available globally. An economically viable route for producing useful chemicals from methane is via the synthesis of gas, followed by various processes to manufacture the required chemicals. In a large-scale industrial plant, the production of syngas represents a sizable part of the total operating costs. Therefore, it is essential to develop efficient methods and cost-effective techniques to convert methane into syngas and to integrate them with downstream chemical processes to produce methanol and ethylene.
- Steam cracking is a well-established industrial process for the production of ethylene. Despite optimization efforts, the procedure still uses a large amount of energy and is a carbon-intensive process.
- Given the considerable progress in these research areas and a significant increase in methane, significant opportunities in the advancement and eventual implementation of intensified ethylene production technologies are available.
2. Approach and Modeling
Design Basis and Assumptions
- All of the inputs to the flow sheet consist of pure components;
- Pressure drop is neglected in the exchange devices (heaters and coolers).
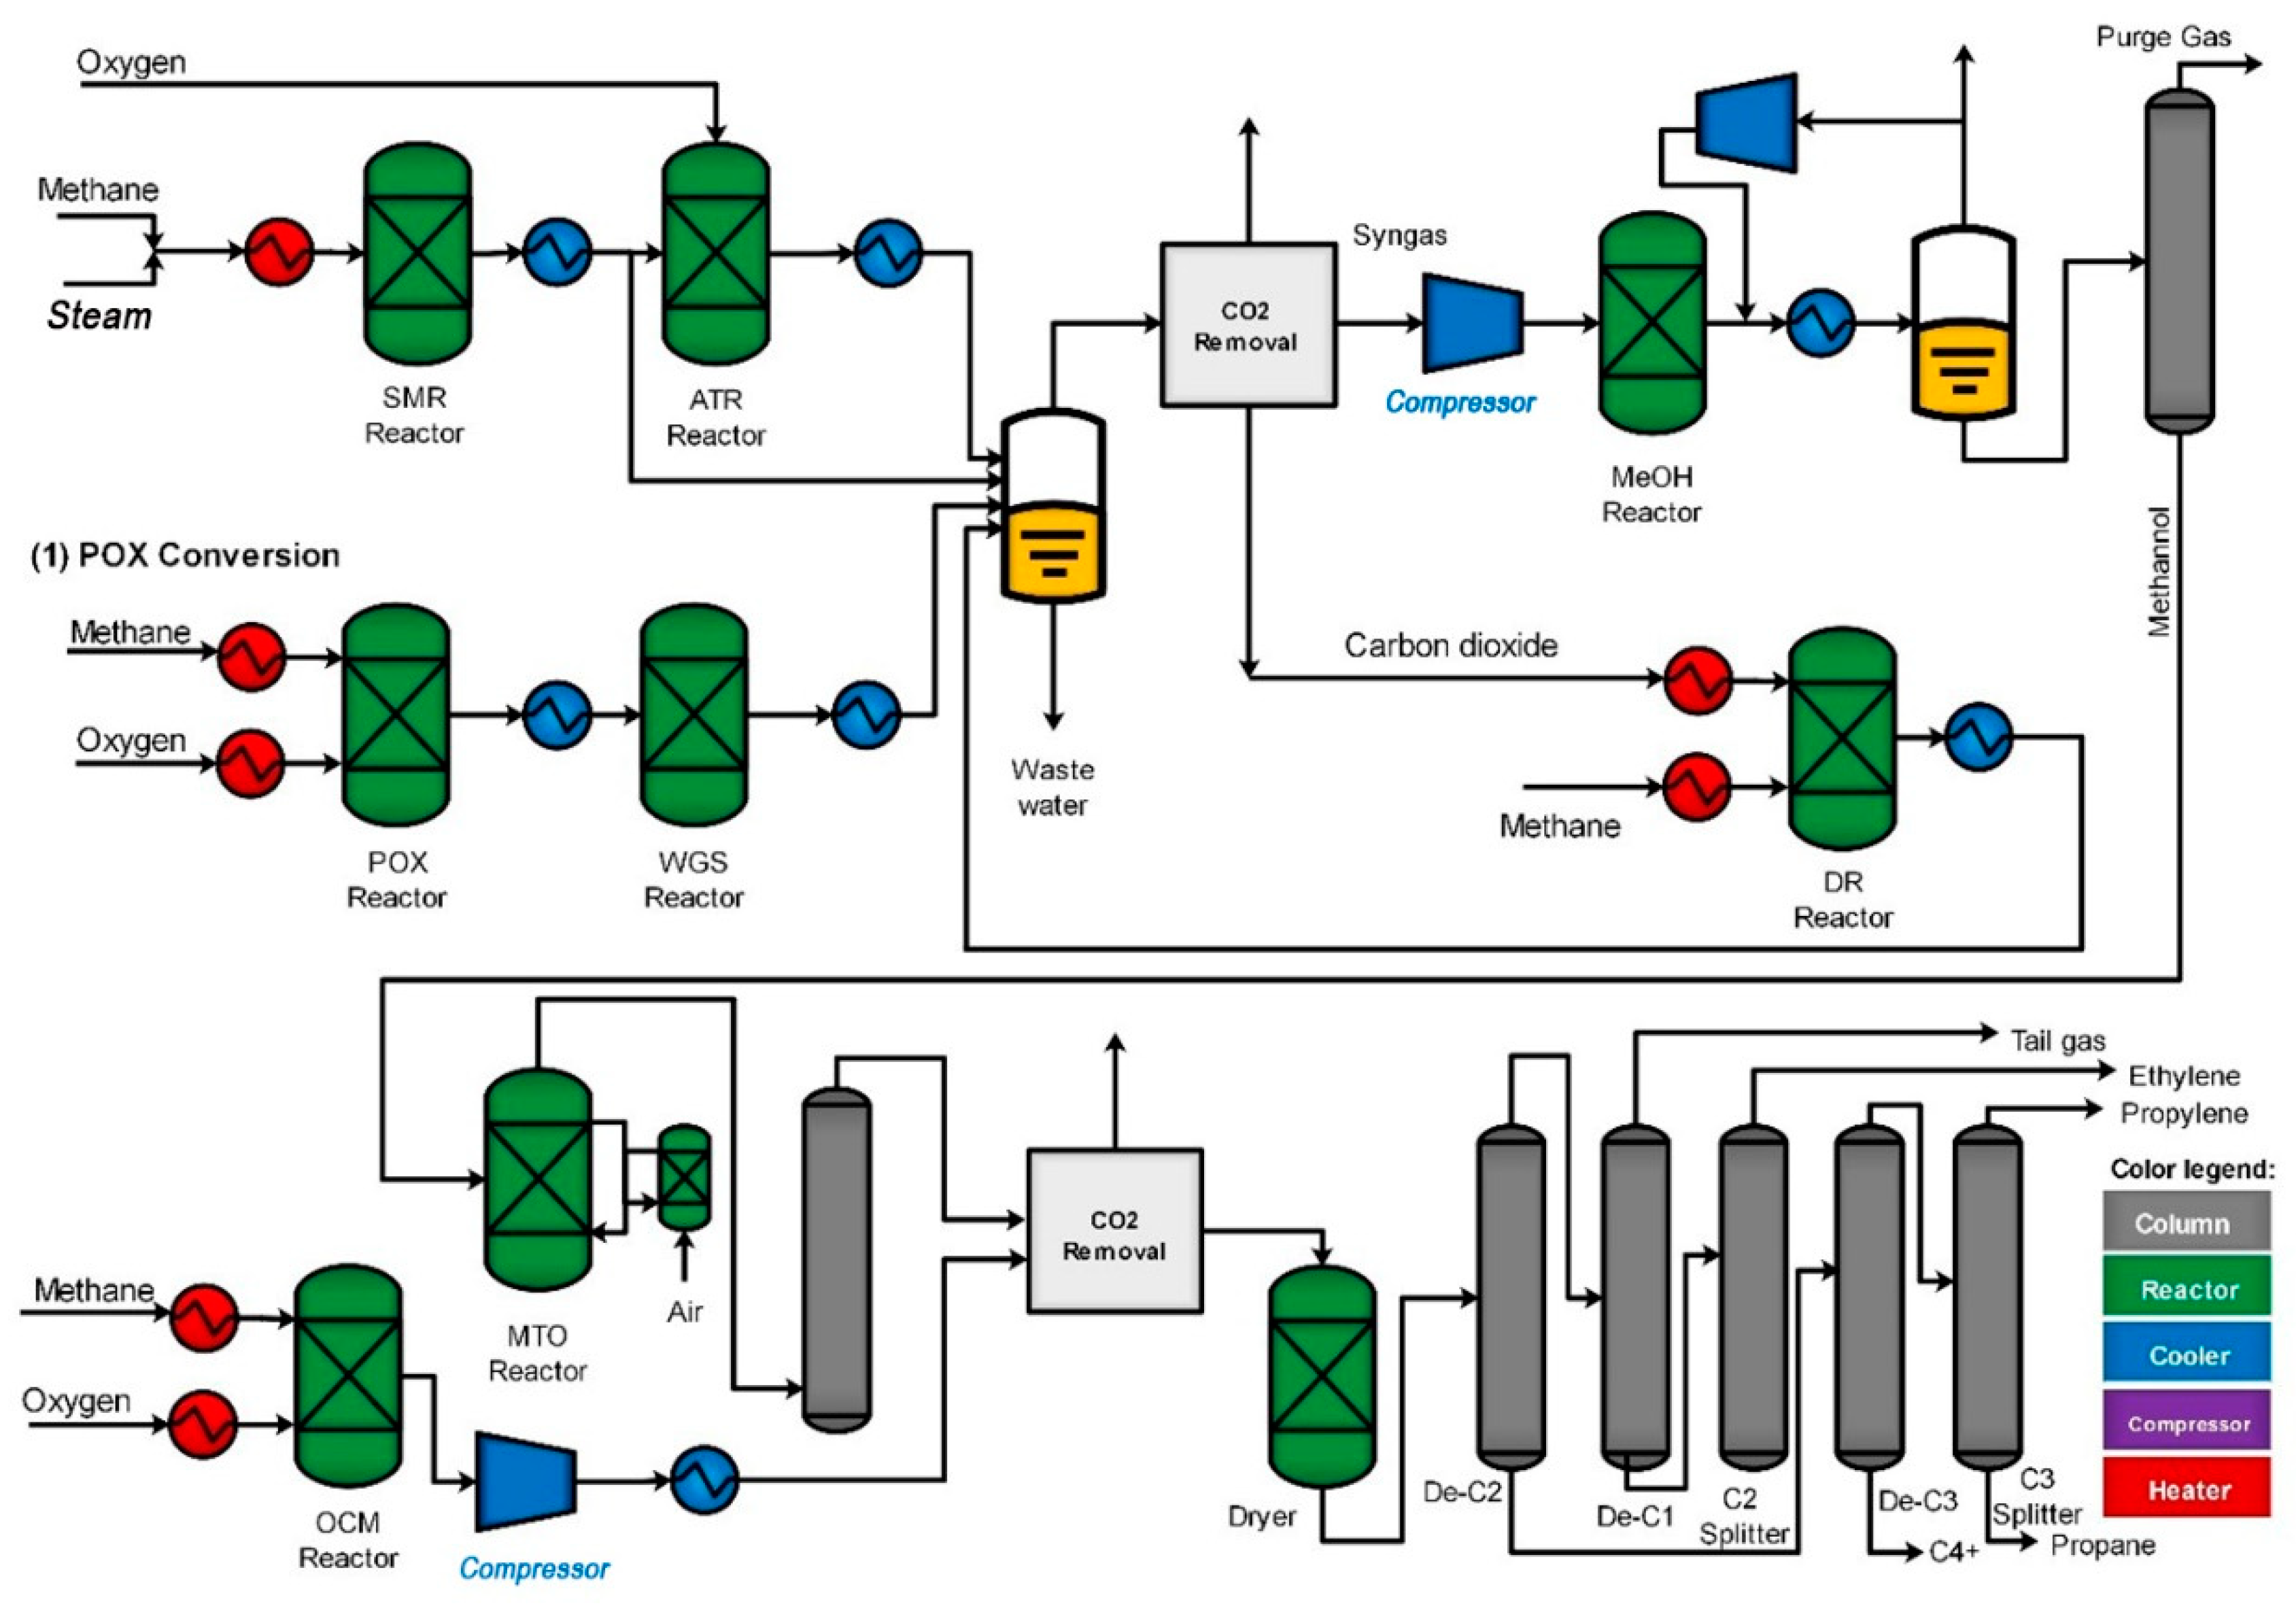
3. Process Description
3.1. Catalytic Conversion
3.1.1. Reforming
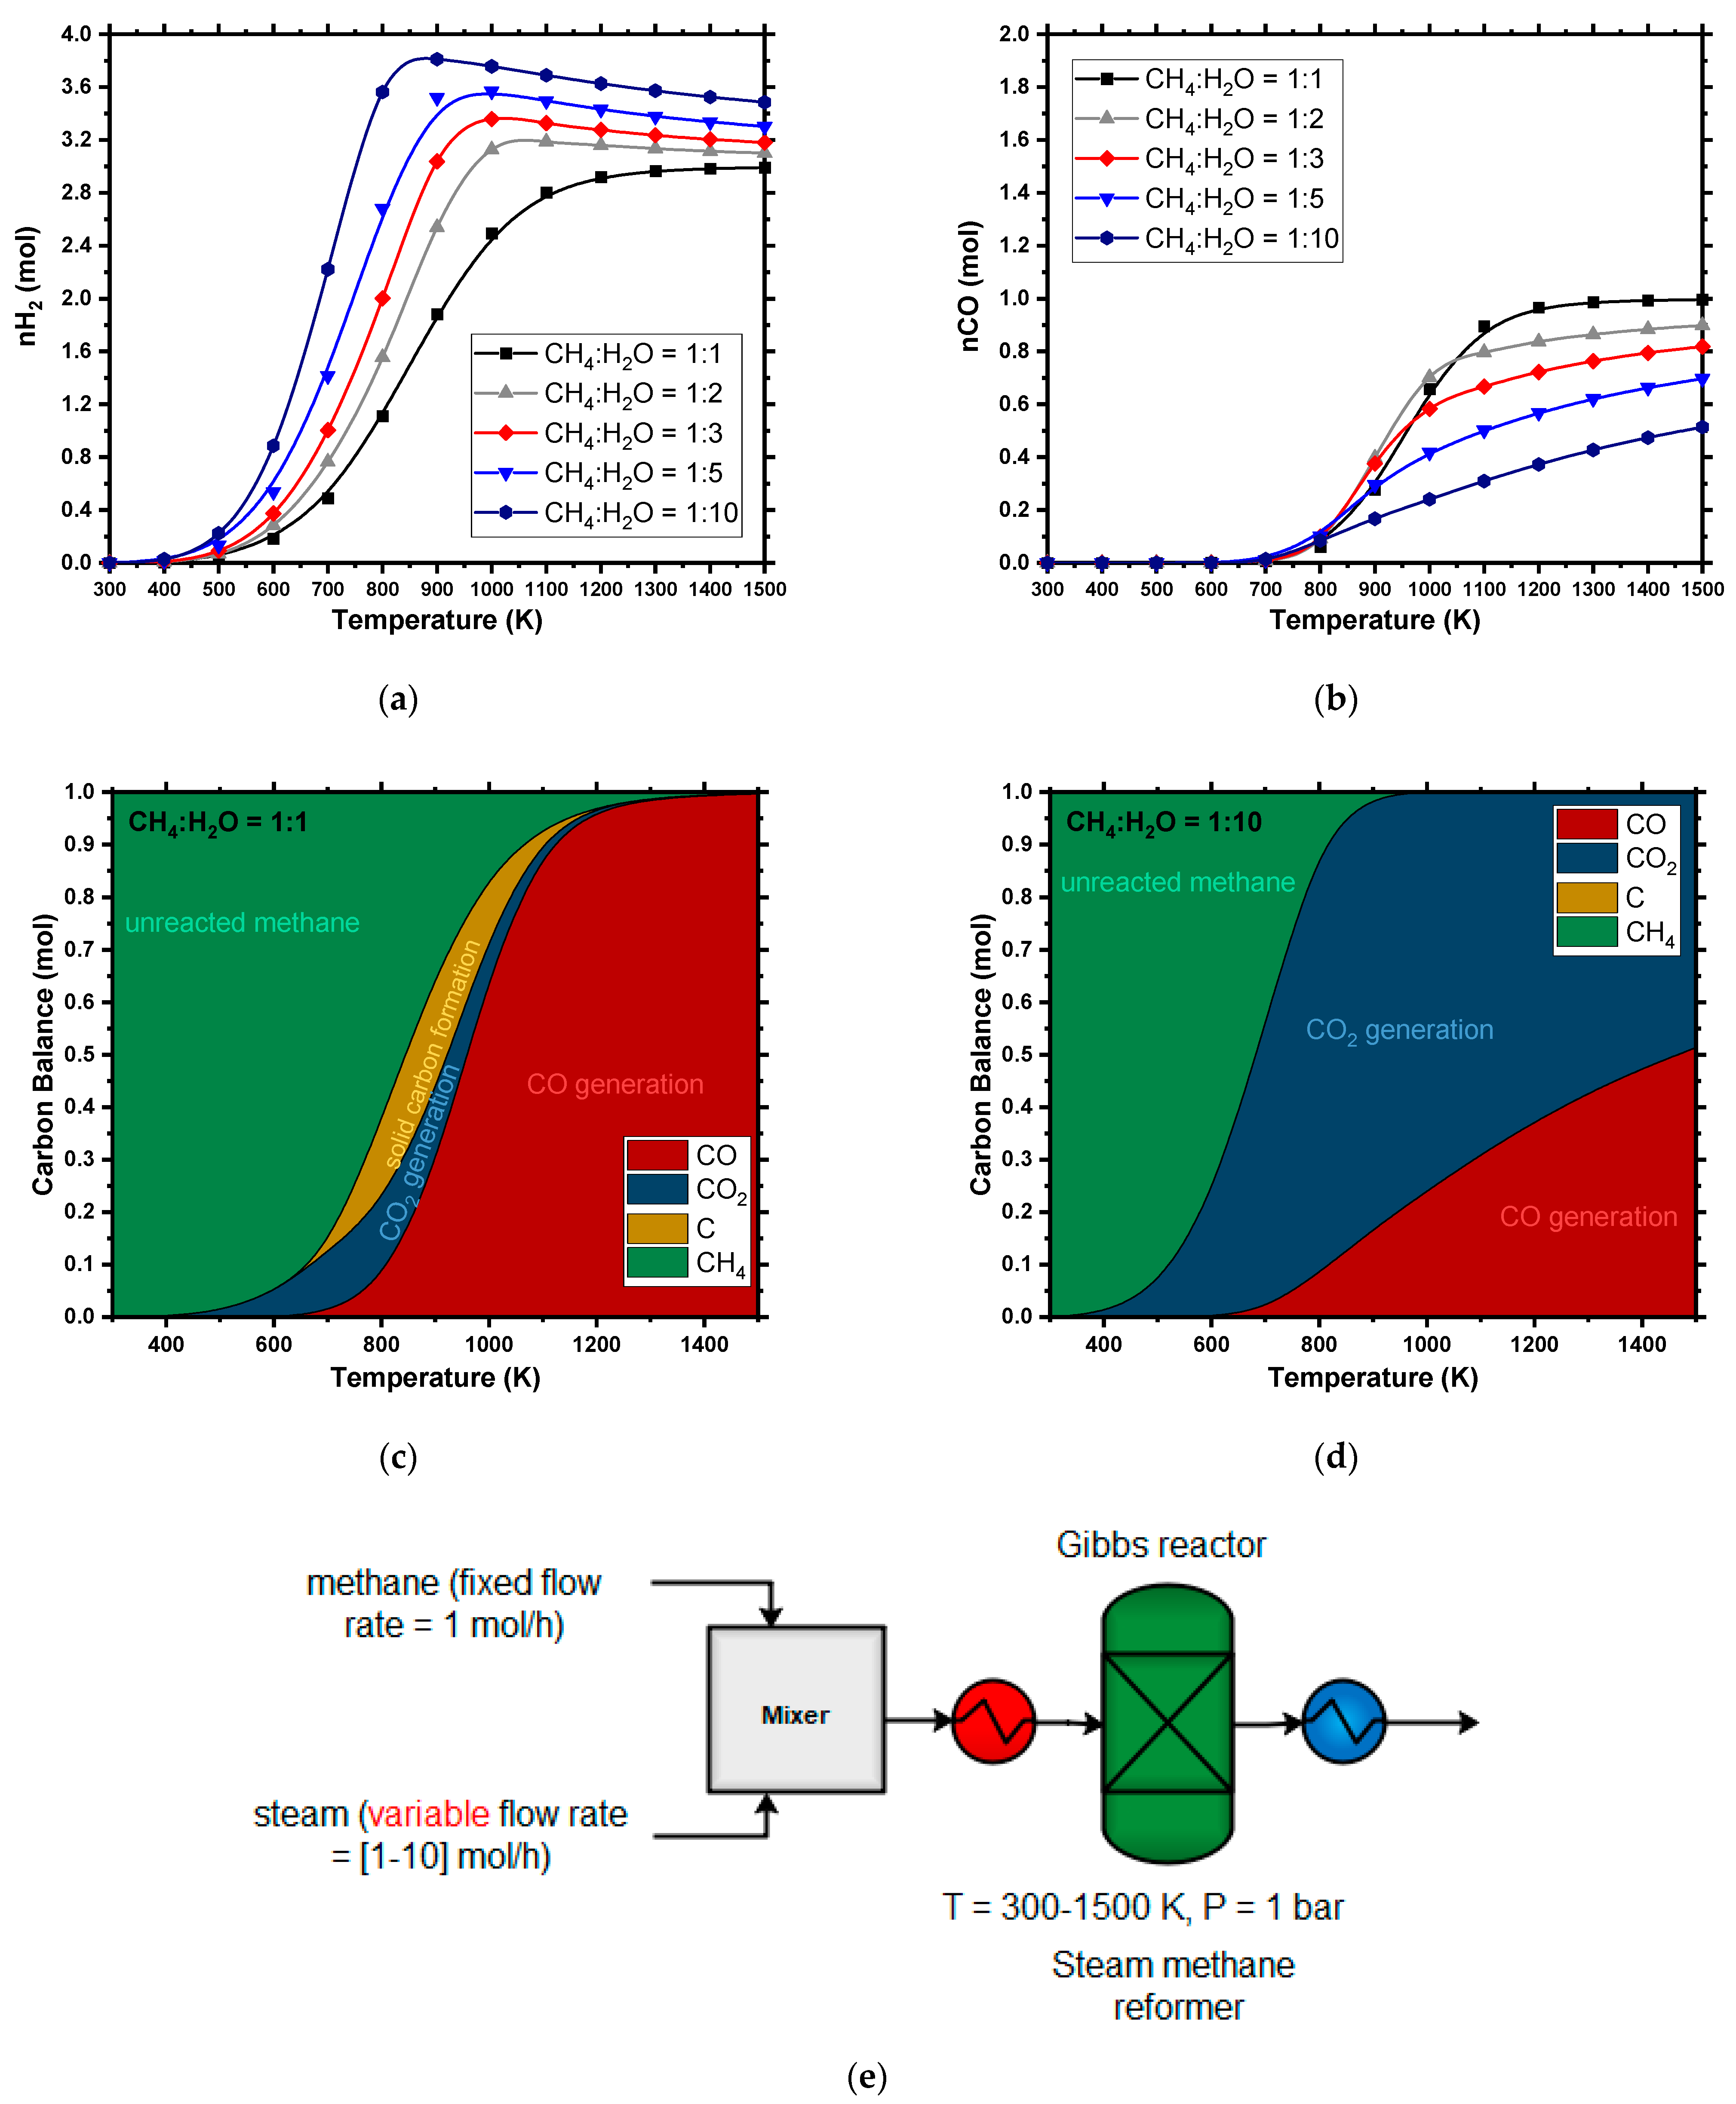
Steam Methane Reforming (SMR)
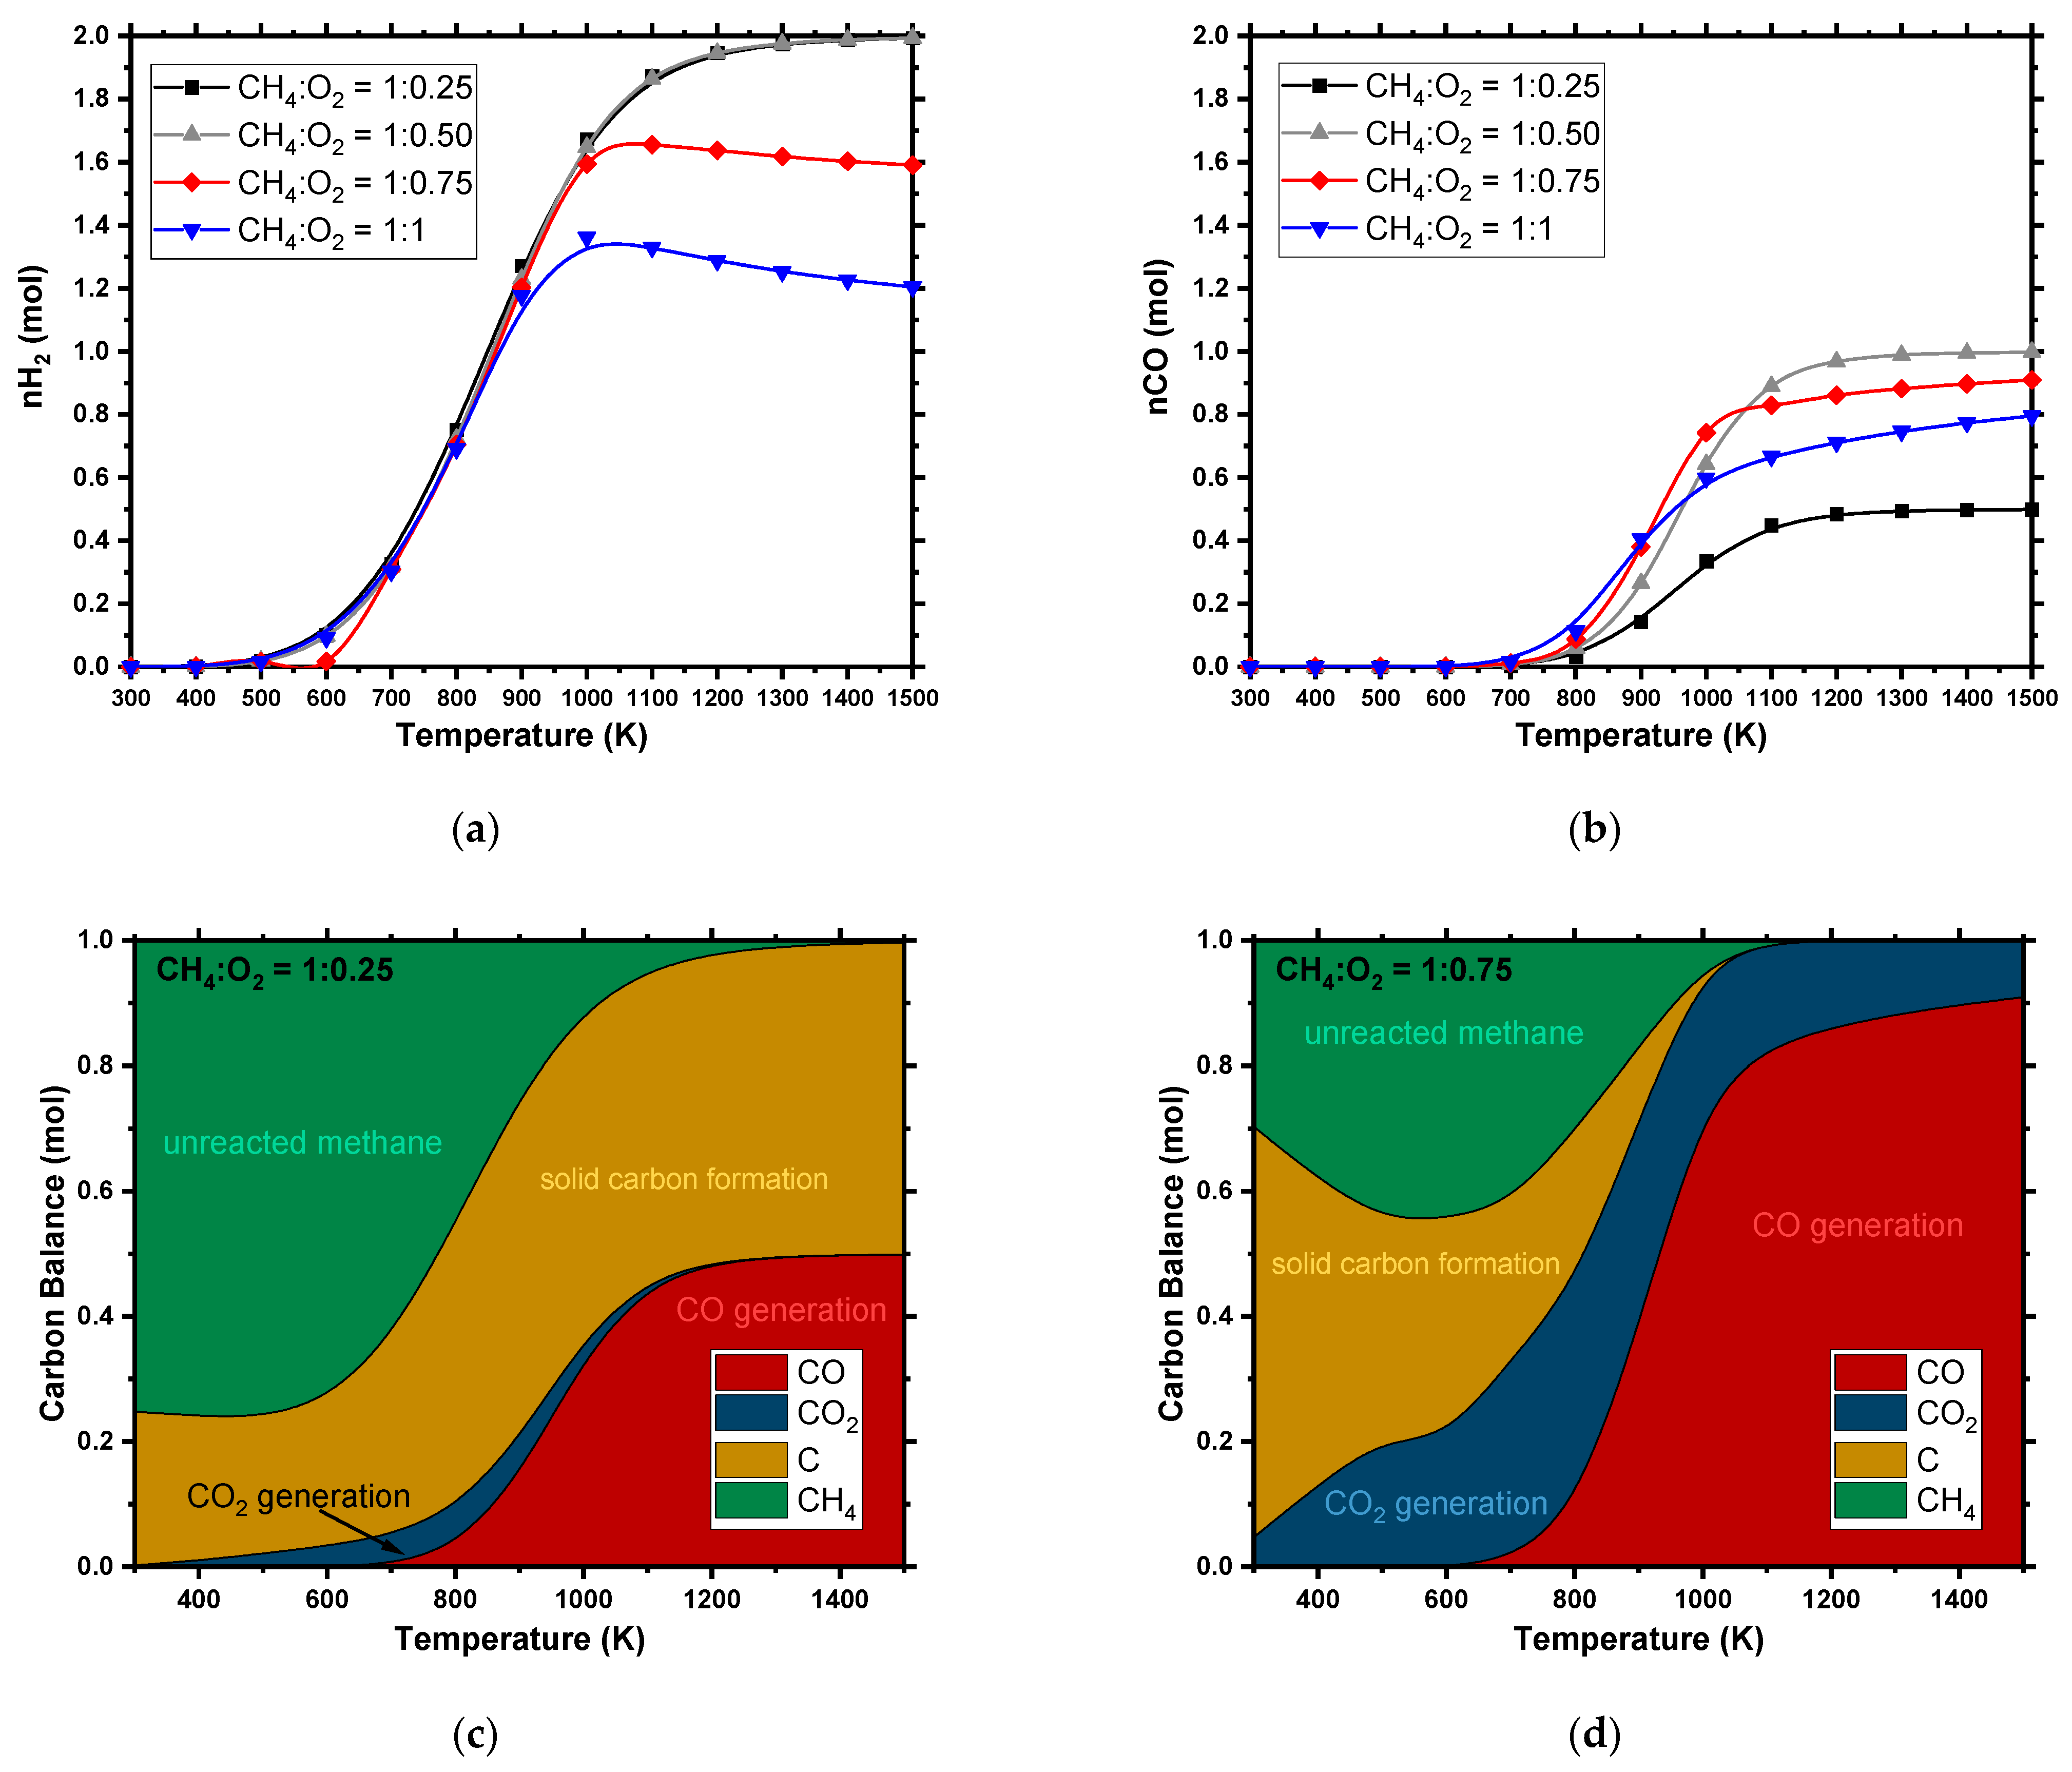
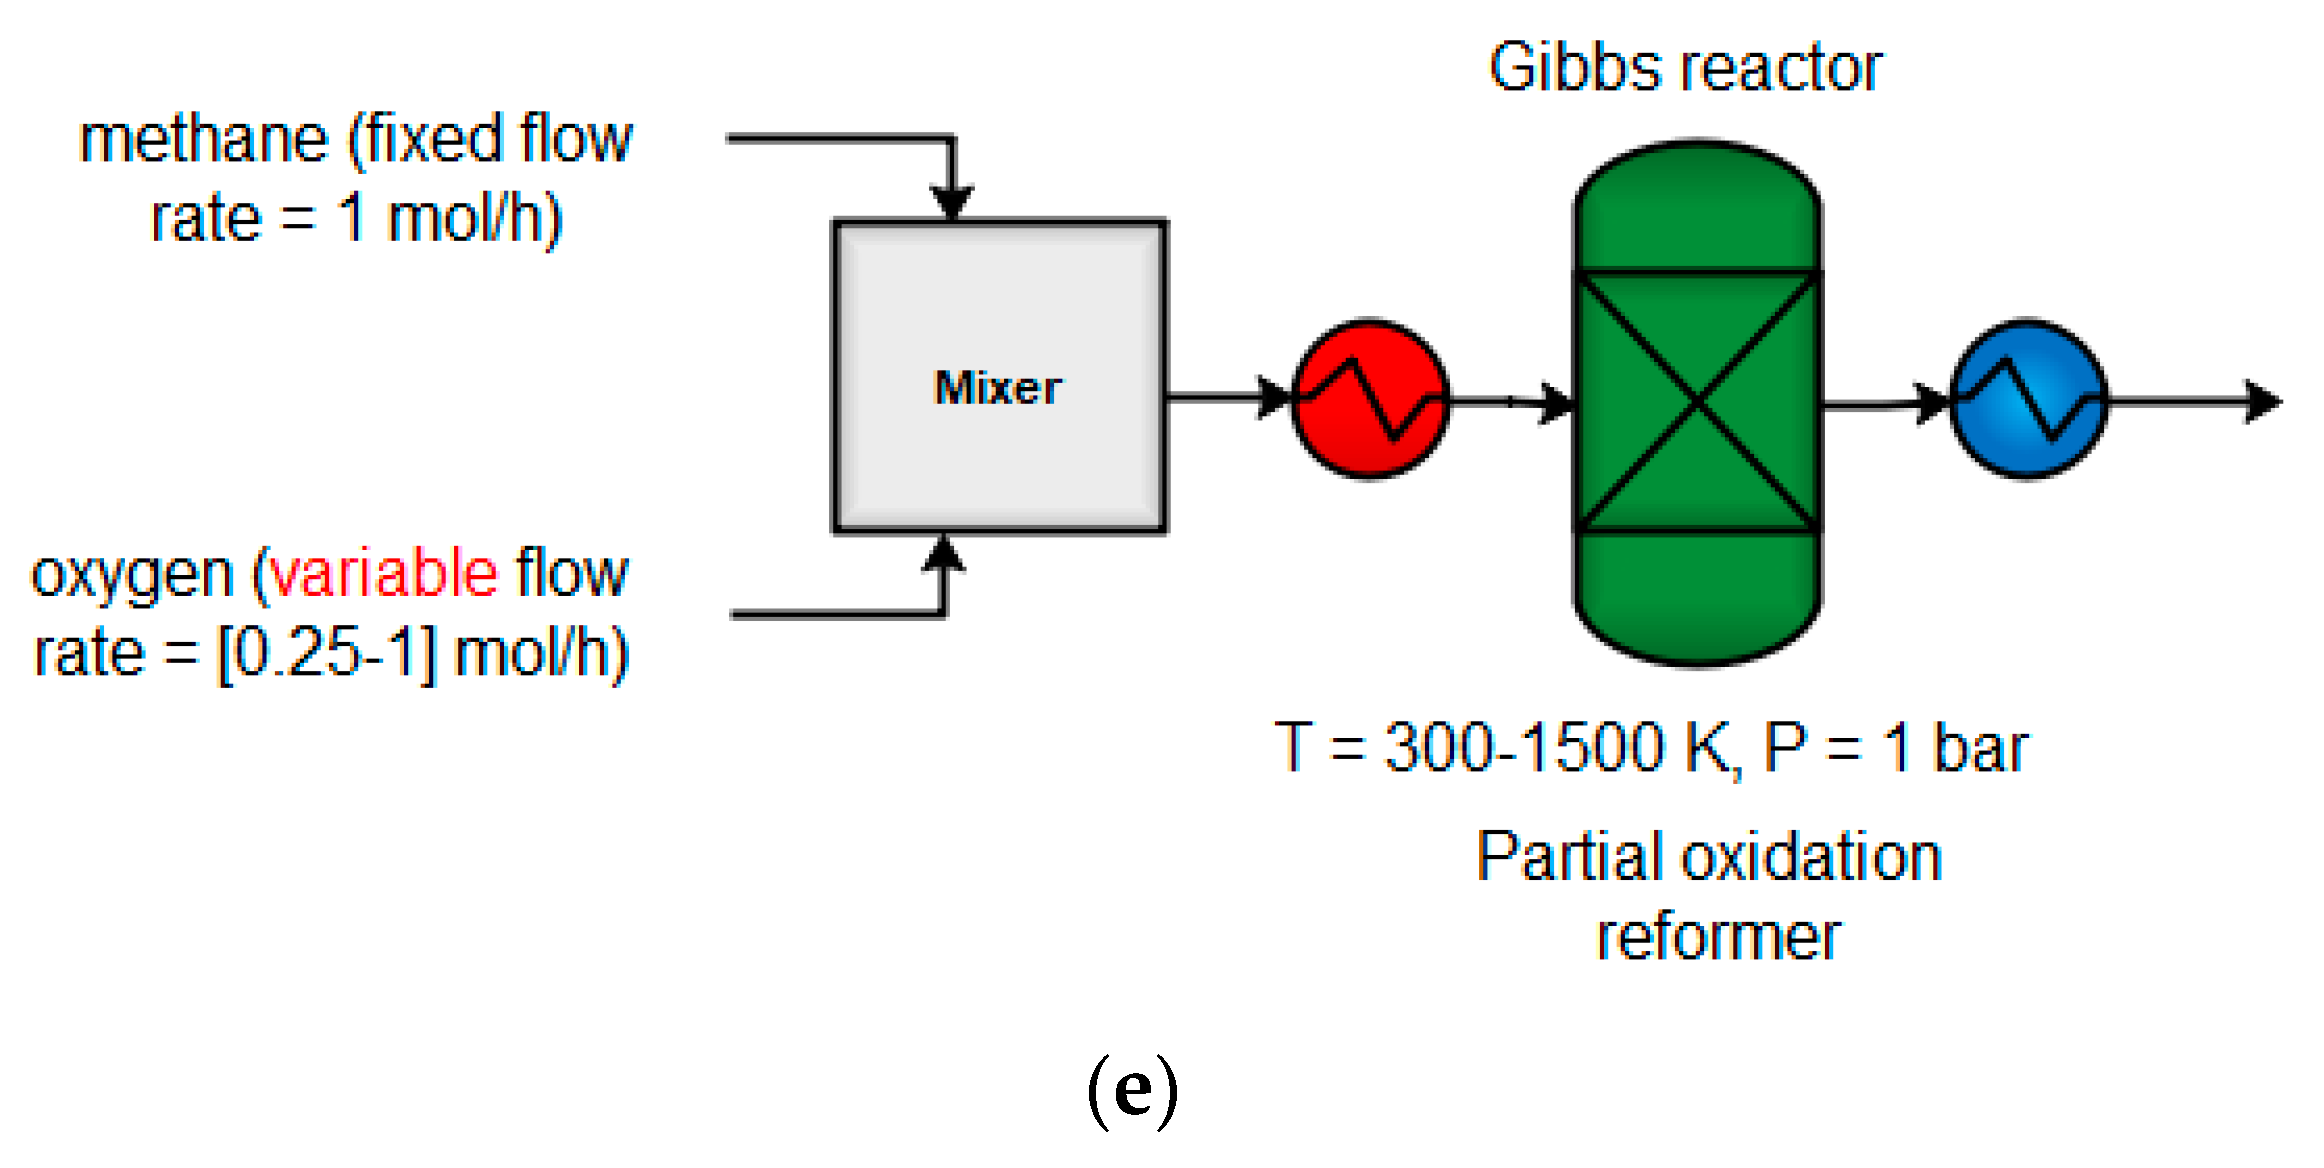
Partial Oxidation (POX)
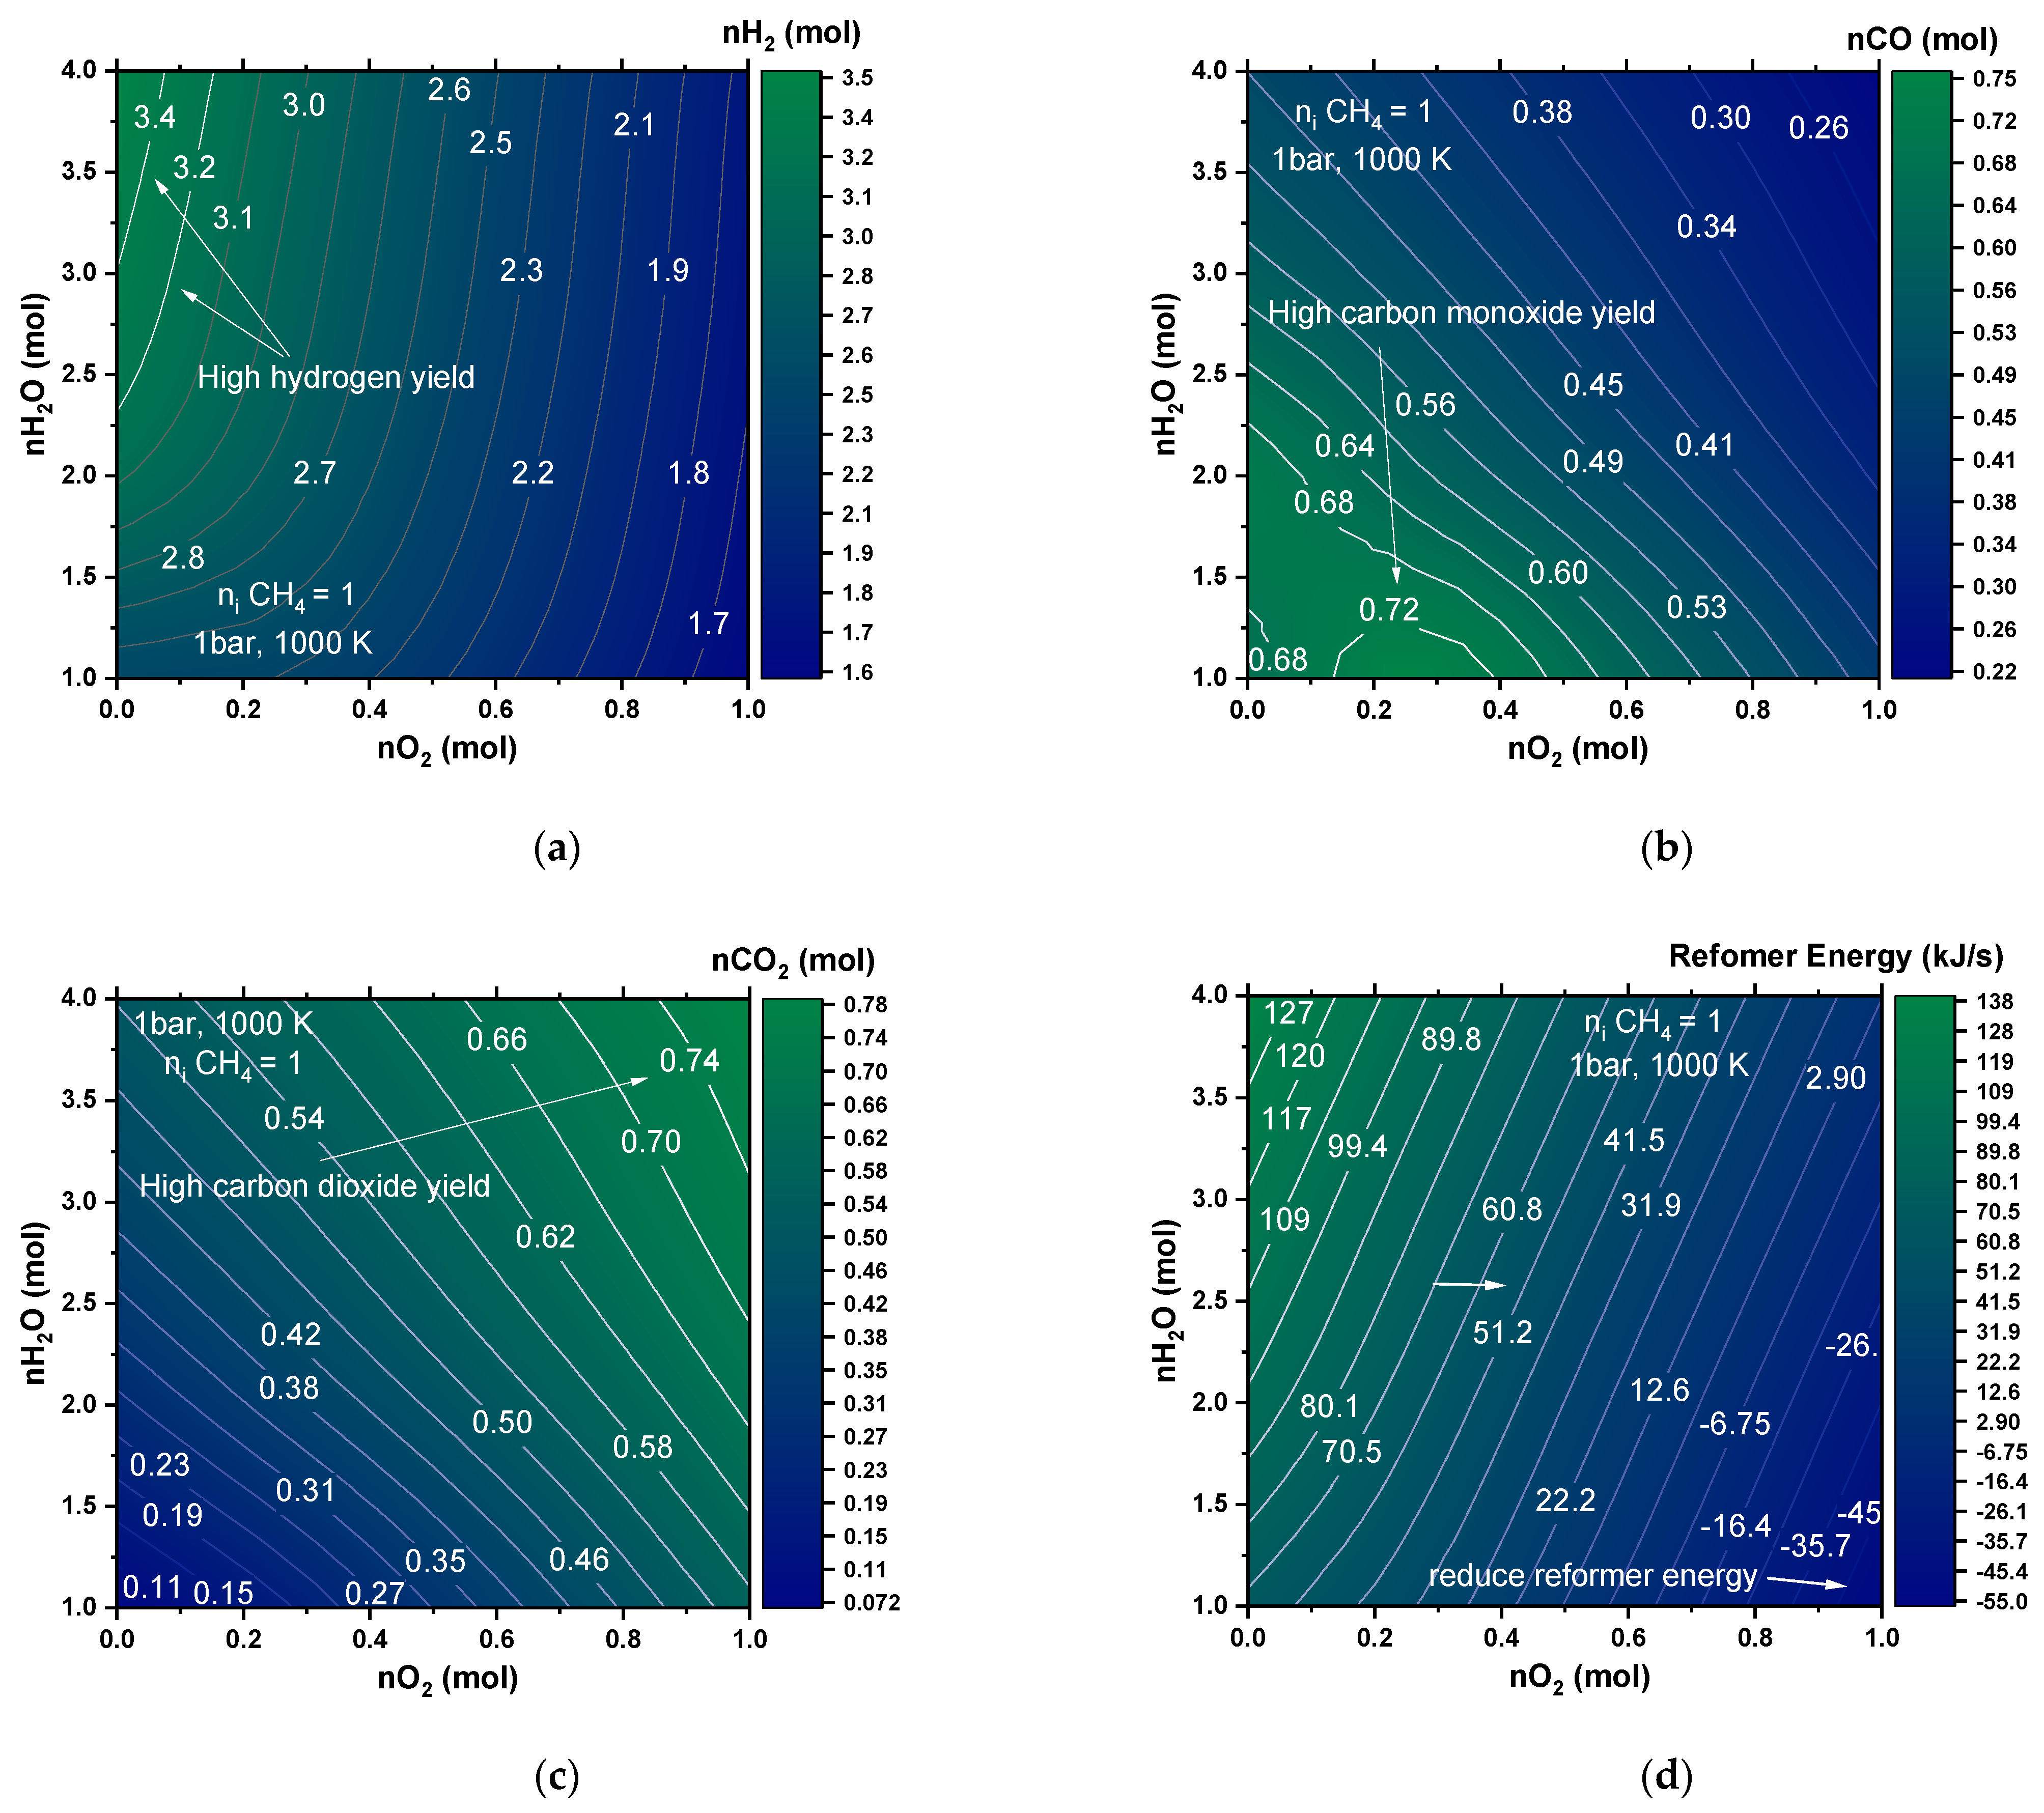
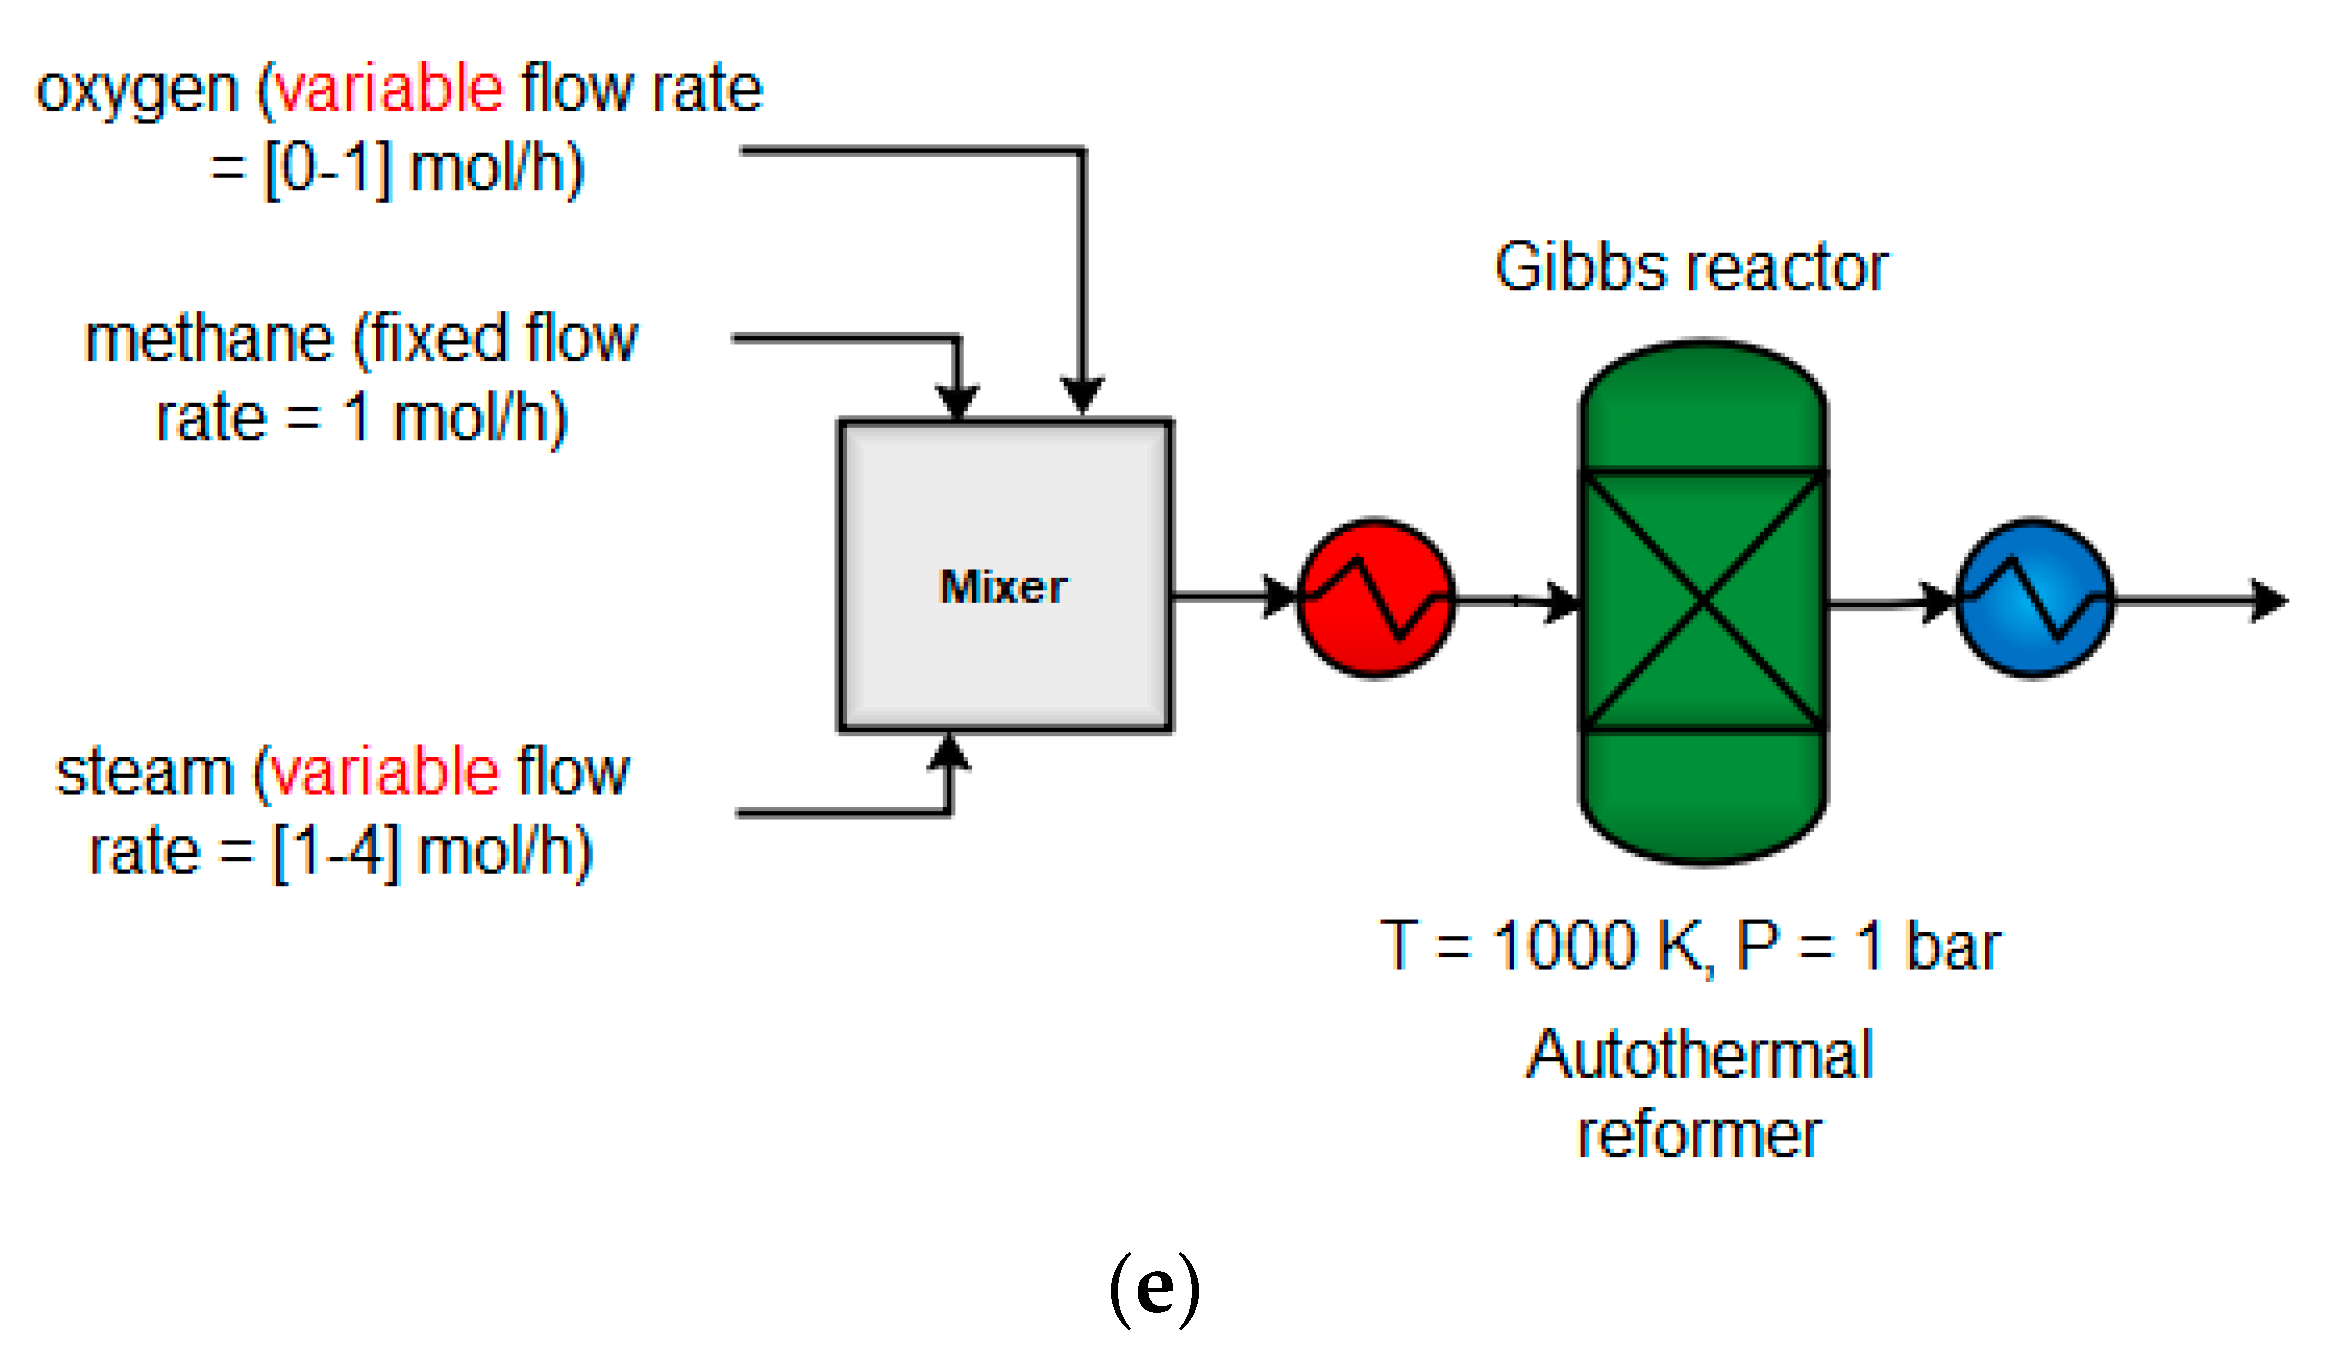
Autothermal Reforming (ATR)
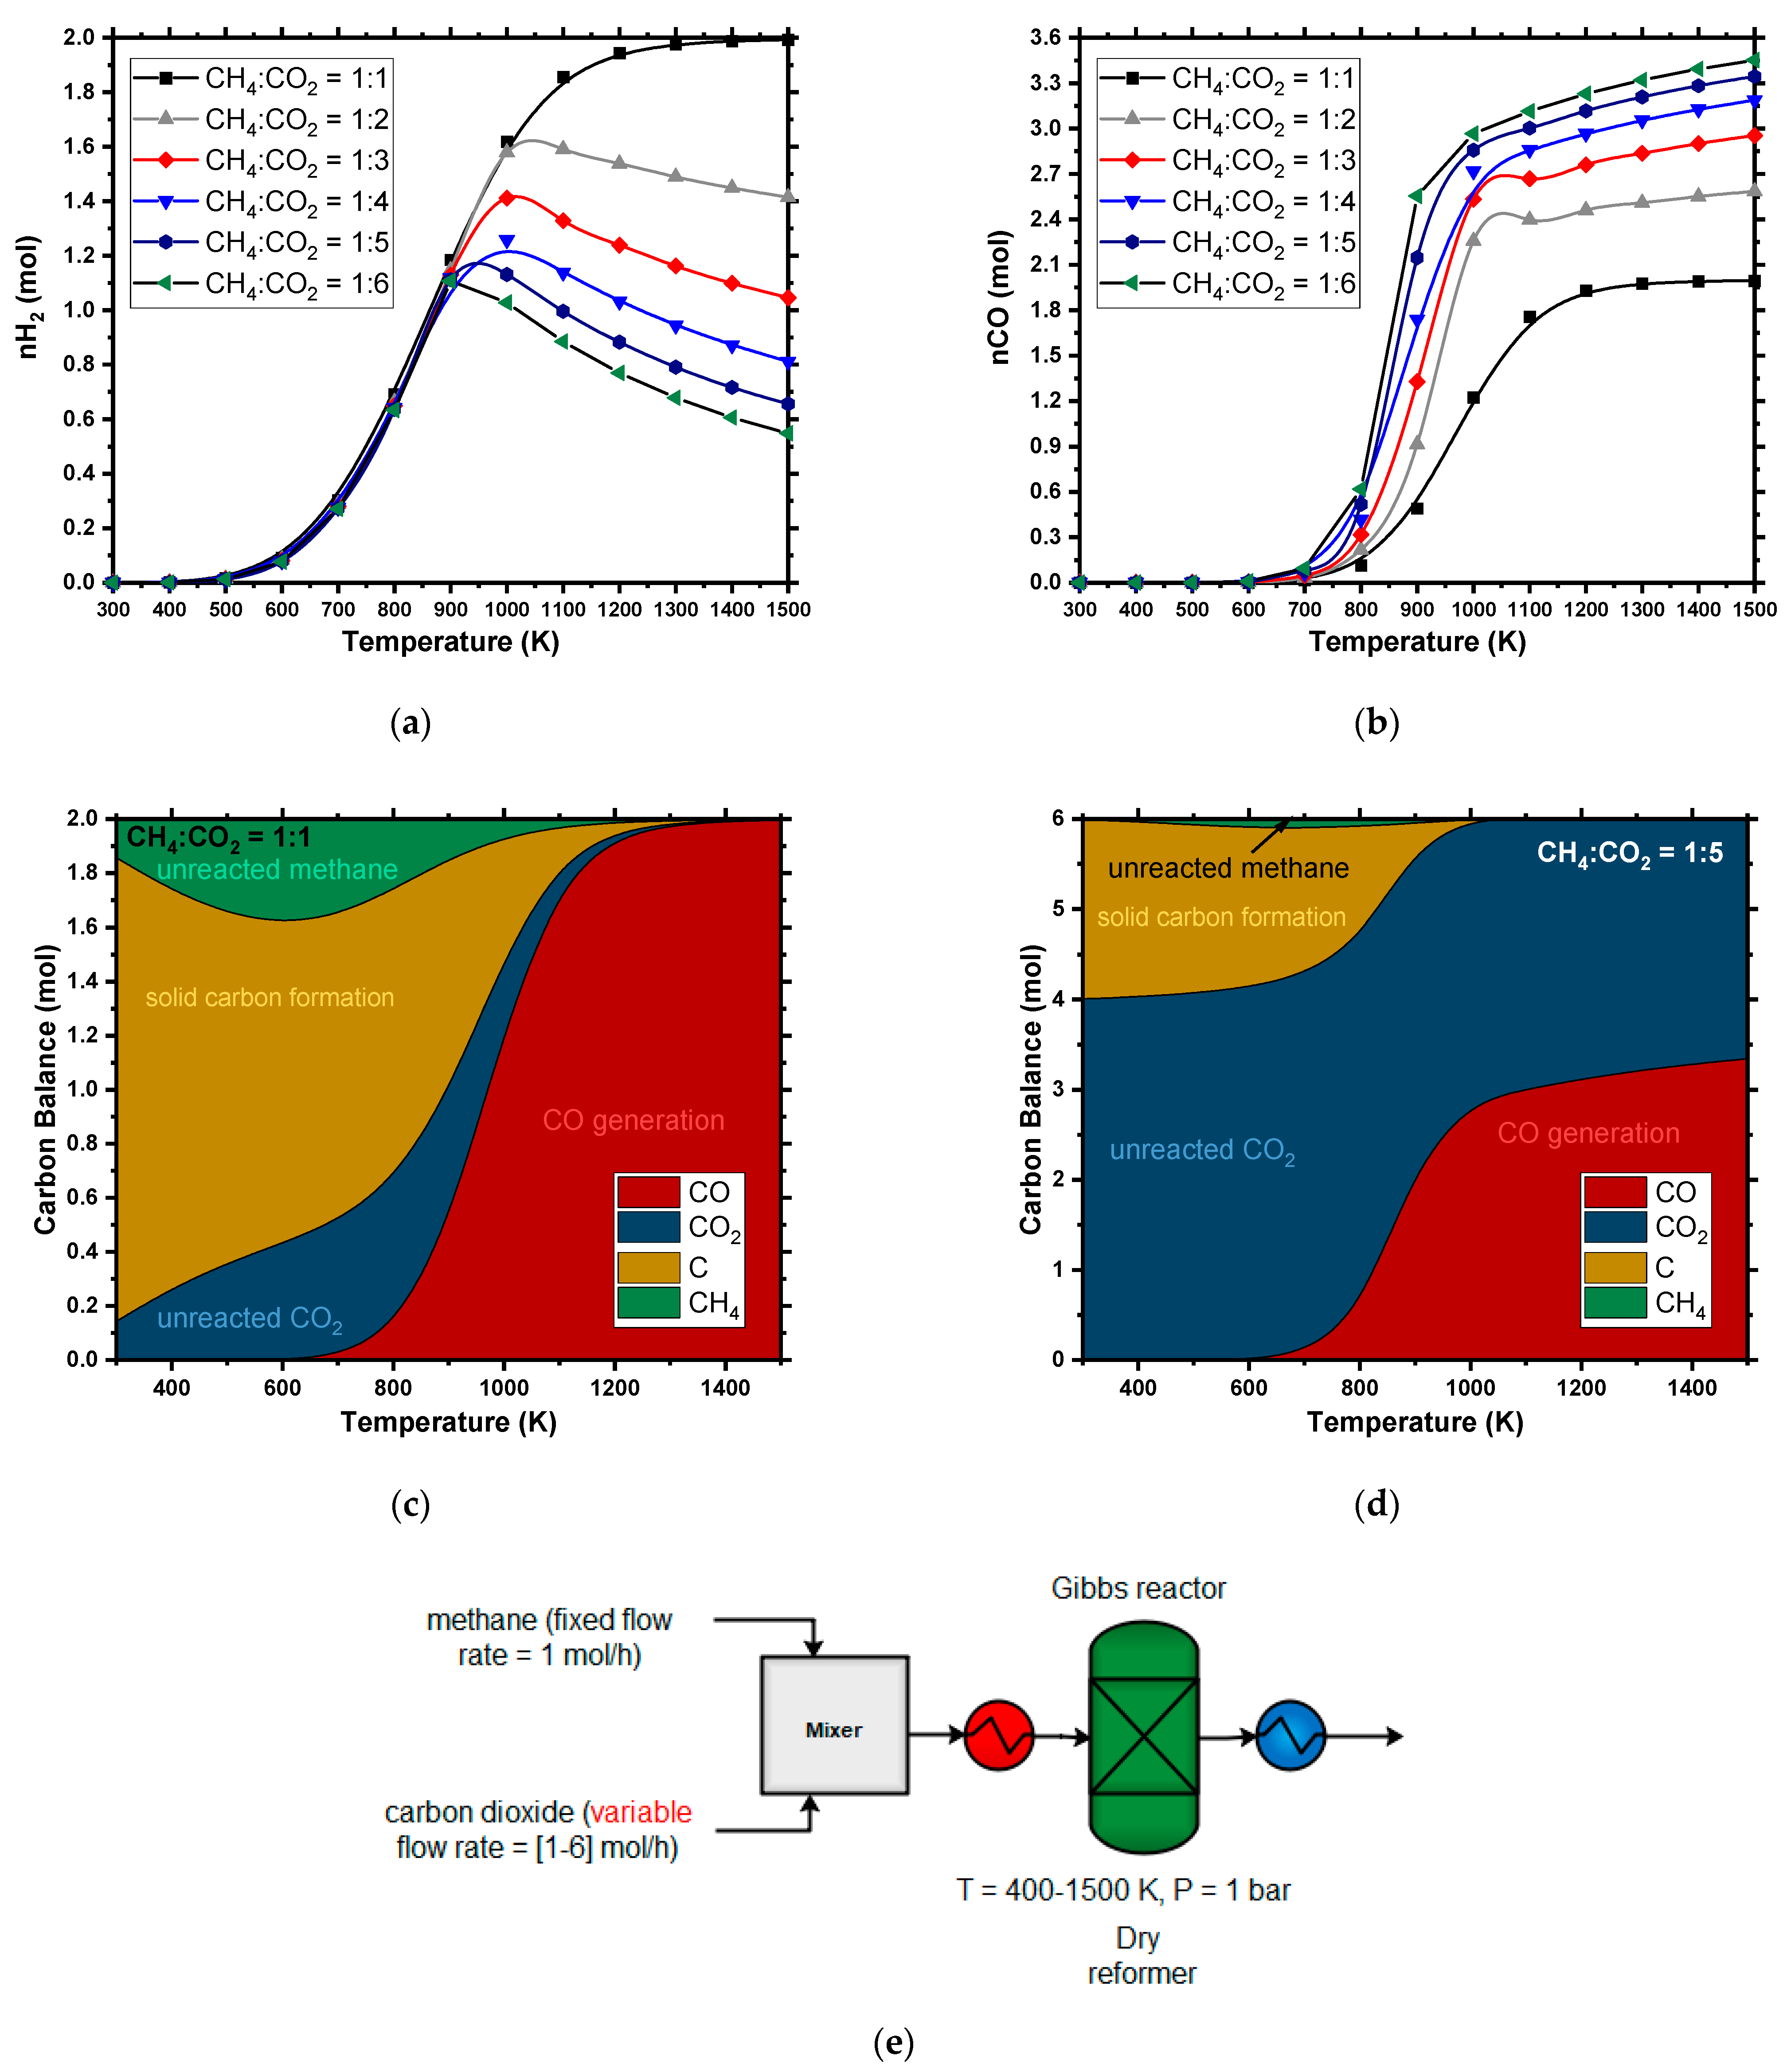
Dry Reforming of Methane (DRM)
3.1.2. Methanol Synthesis
3.1.3. Methanol to Olefins (MTO)
3.1.4. Oxidative Coupling of Methane (OCM)
3.1.5. Ethane Steam Cracking
- k = 0.072 s−1 at 1000 K
- Activation energy, E = 82 kcal/mol
4. Results and Discussion
4.1. Thermodynamic Trends
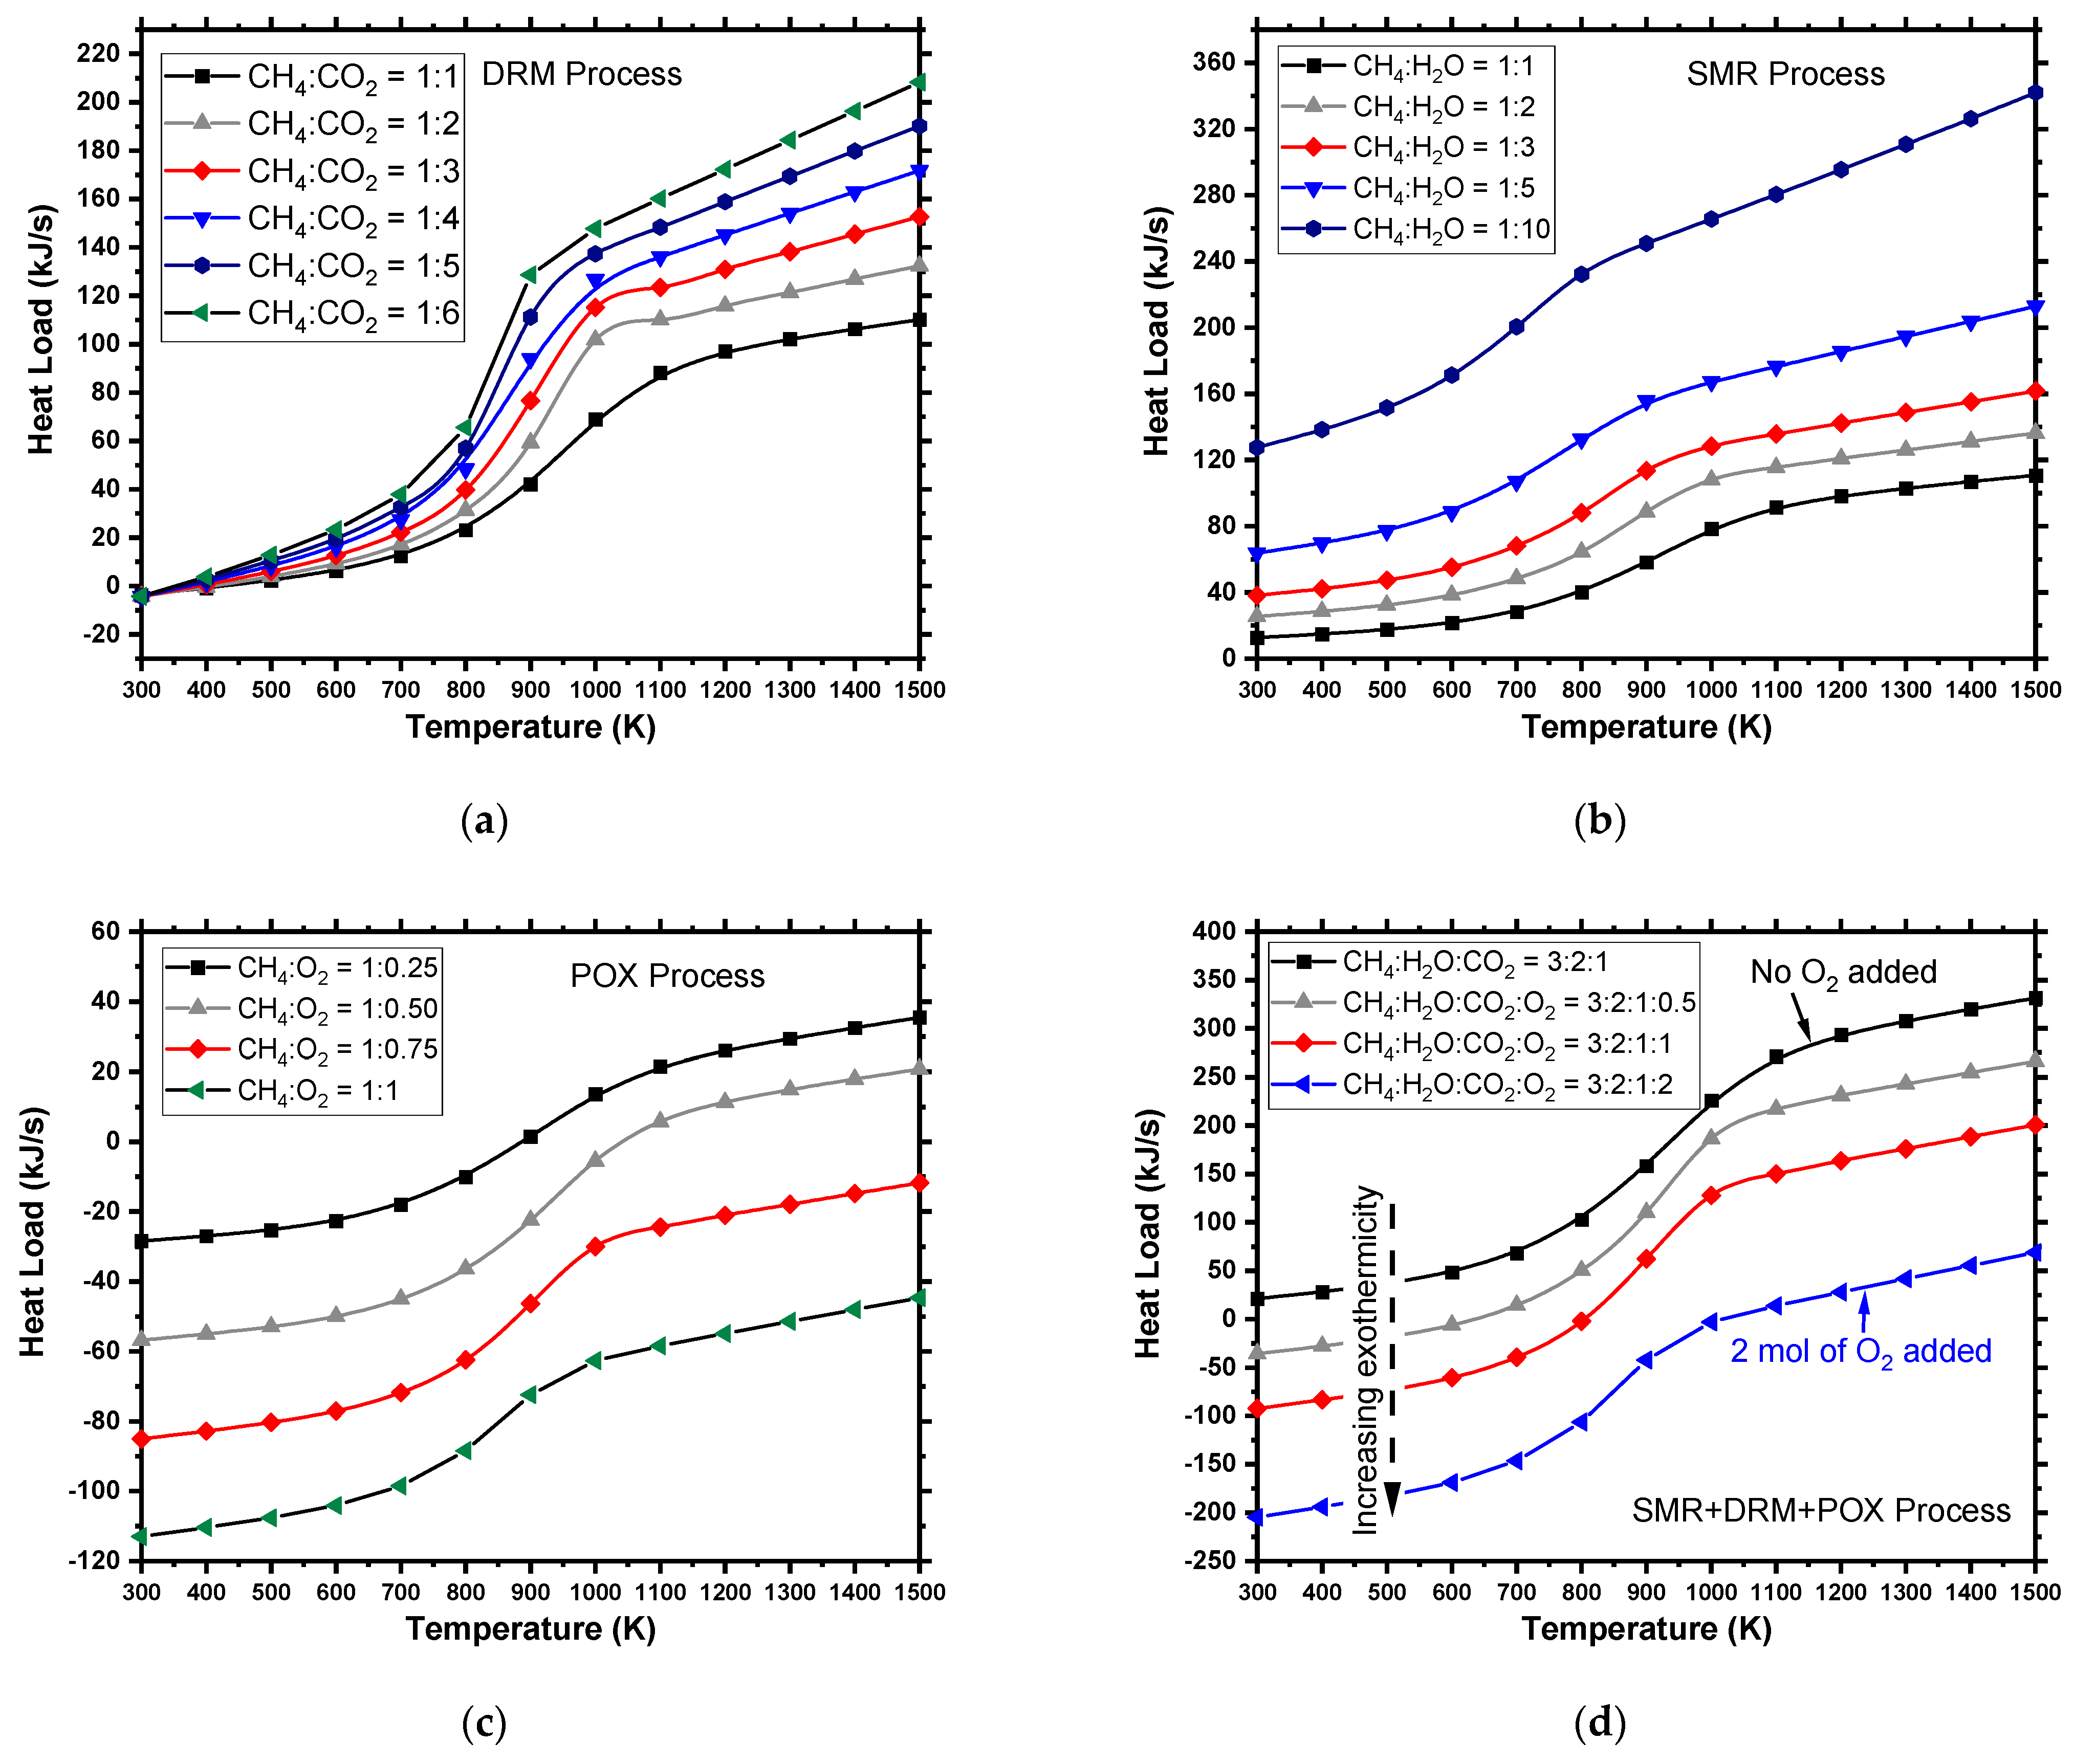
4.1.1. Steam Methane Reforming (SMR)
4.1.2. Partial Oxidation (POX)
4.1.3. Dry Reforming (DR)
4.1.4. Autothermal Reformer (ATR)
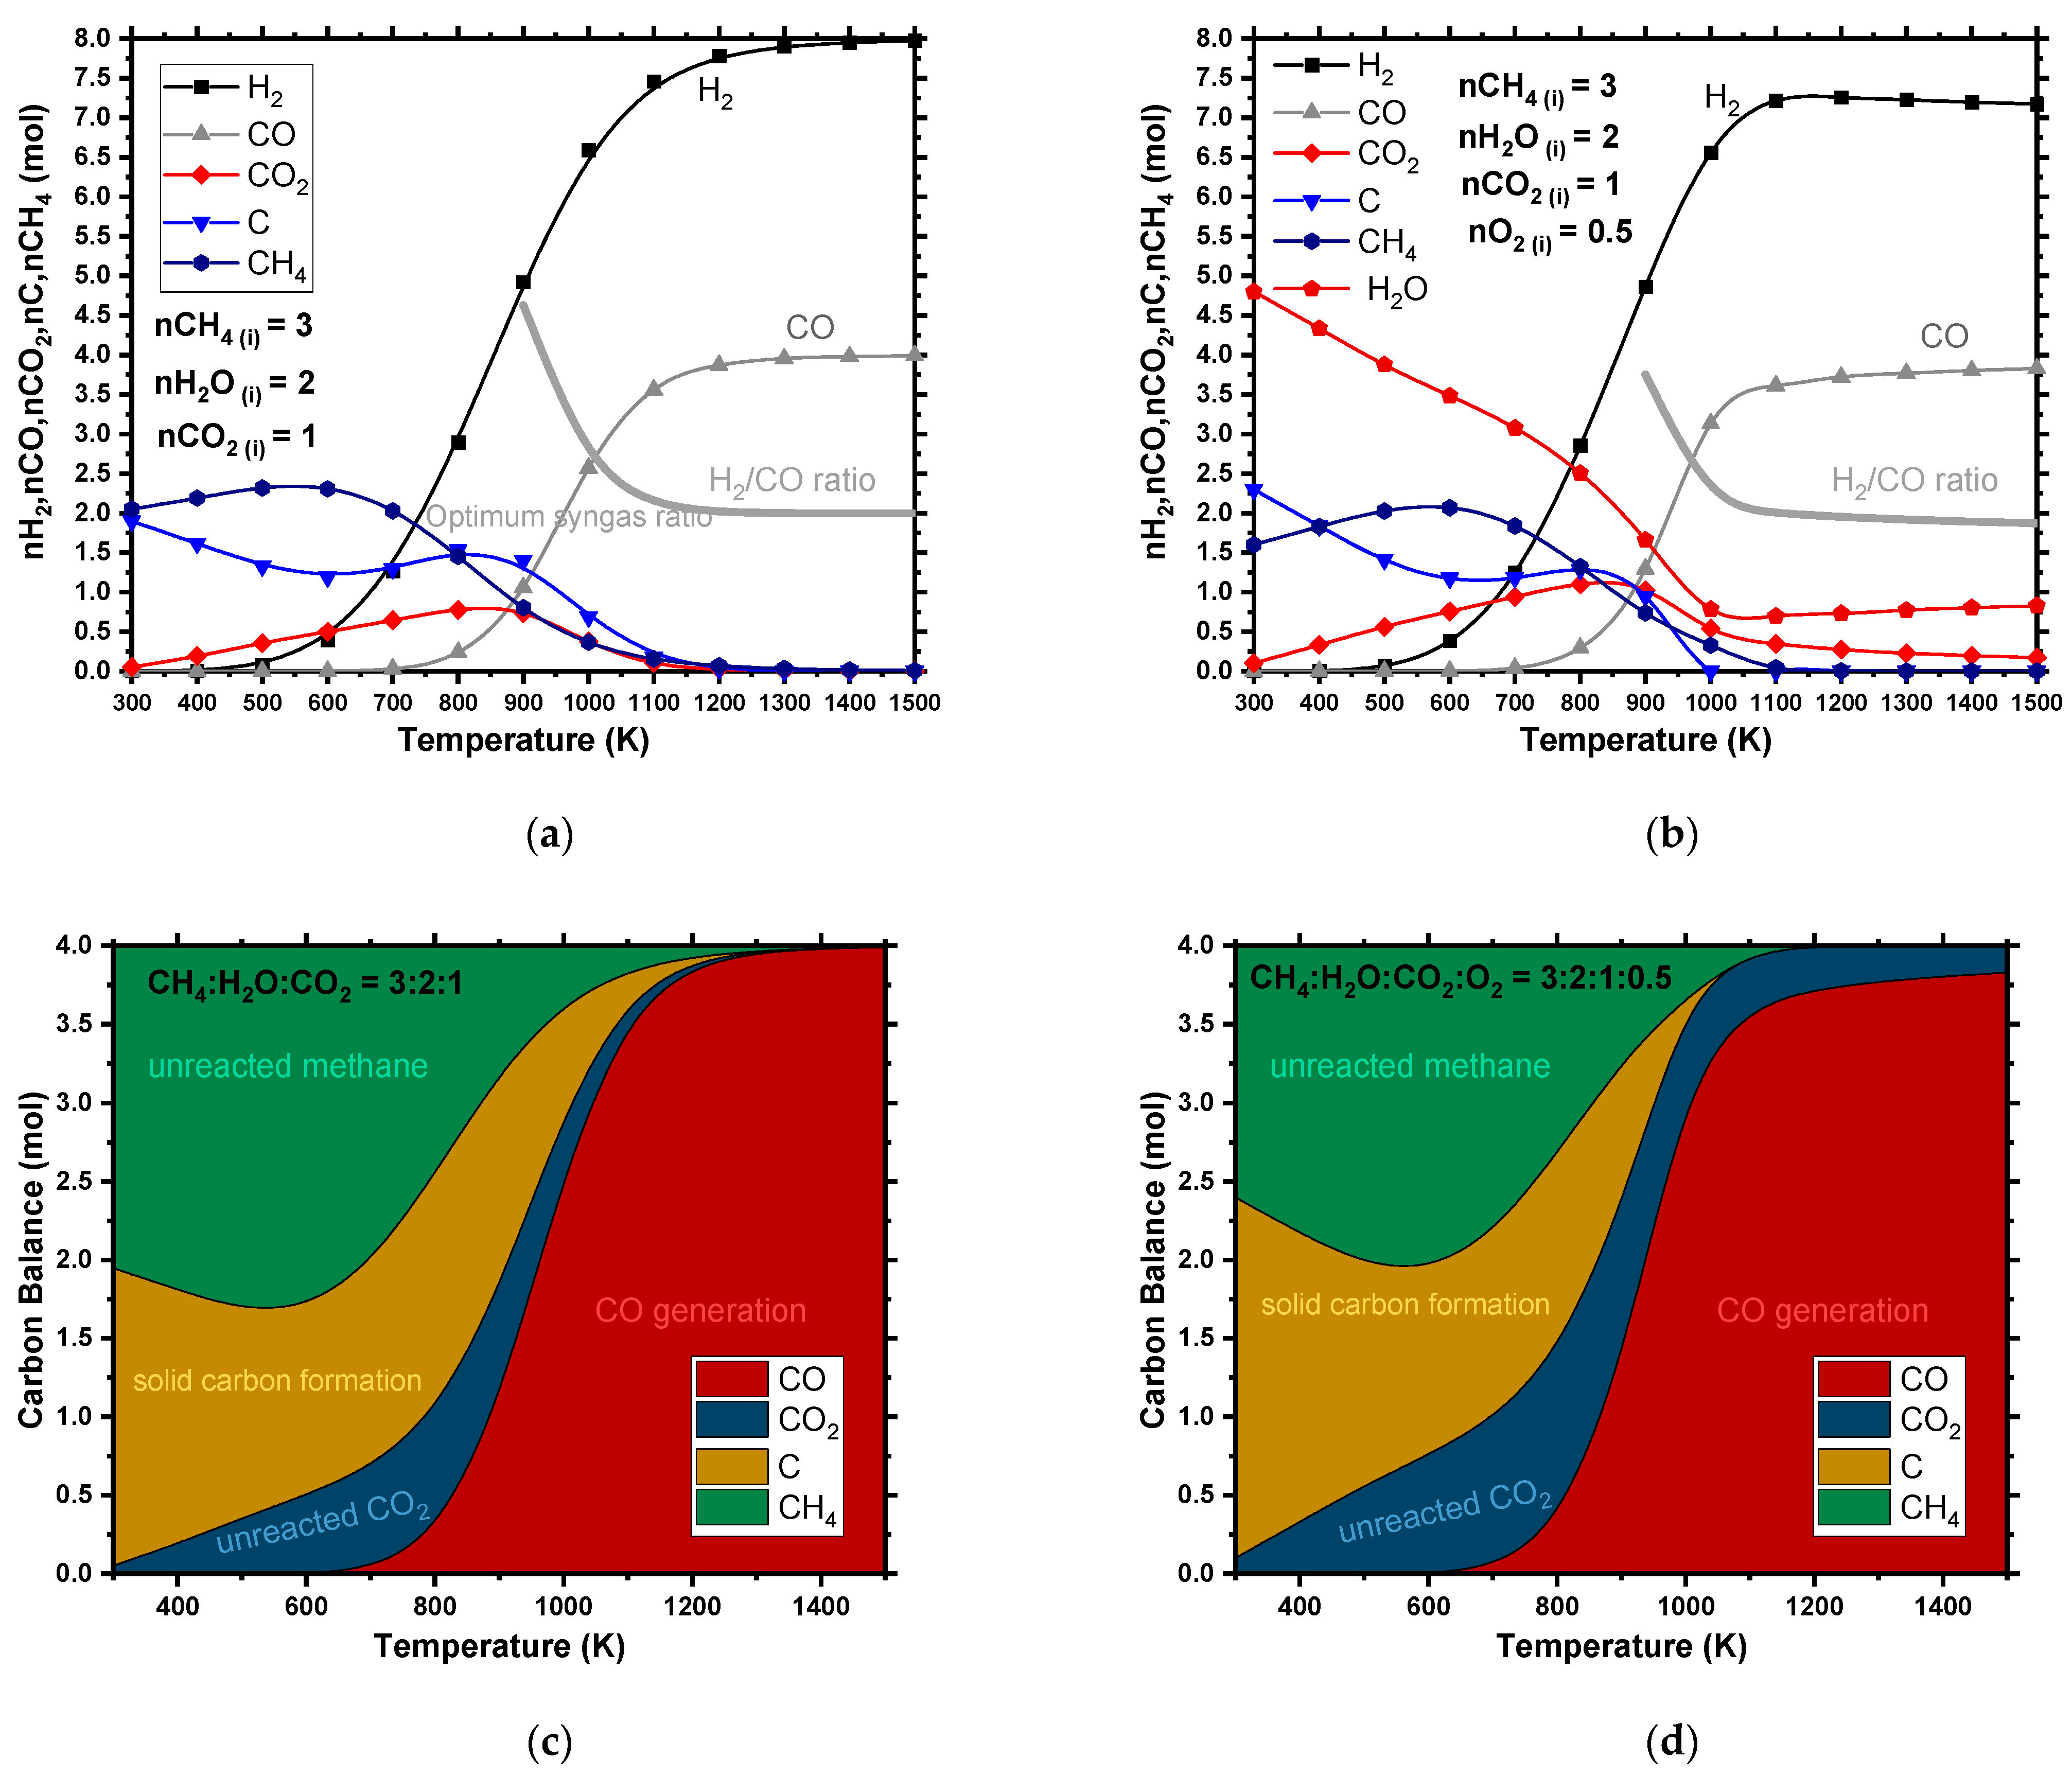
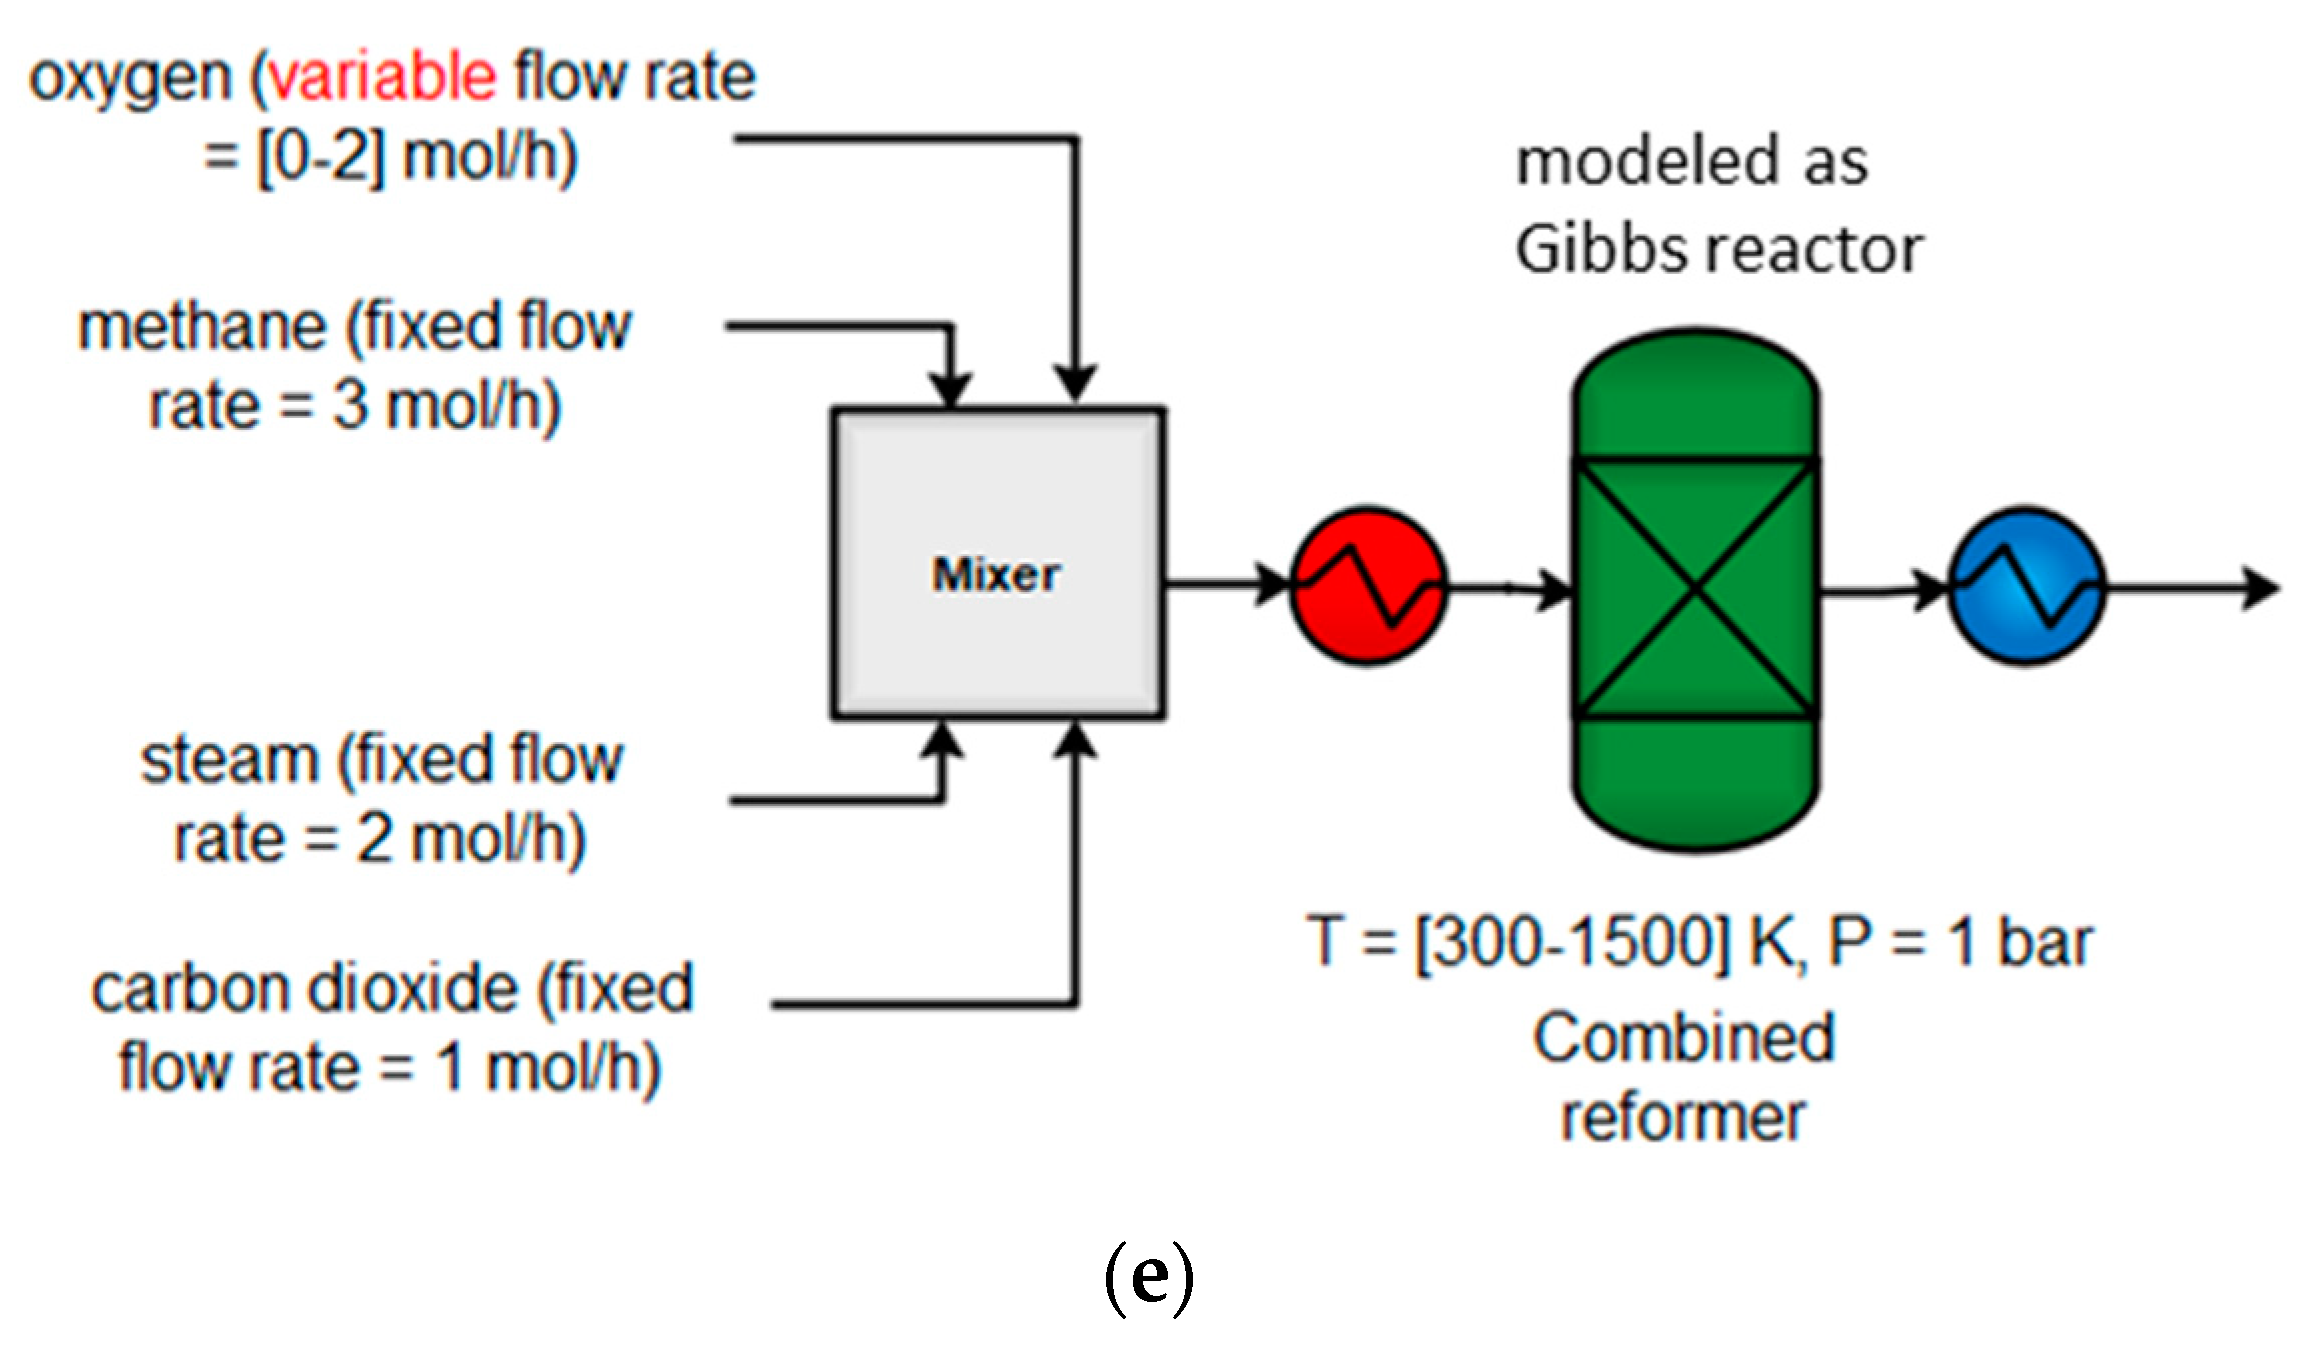
4.1.5. Combined Reforming (CR)
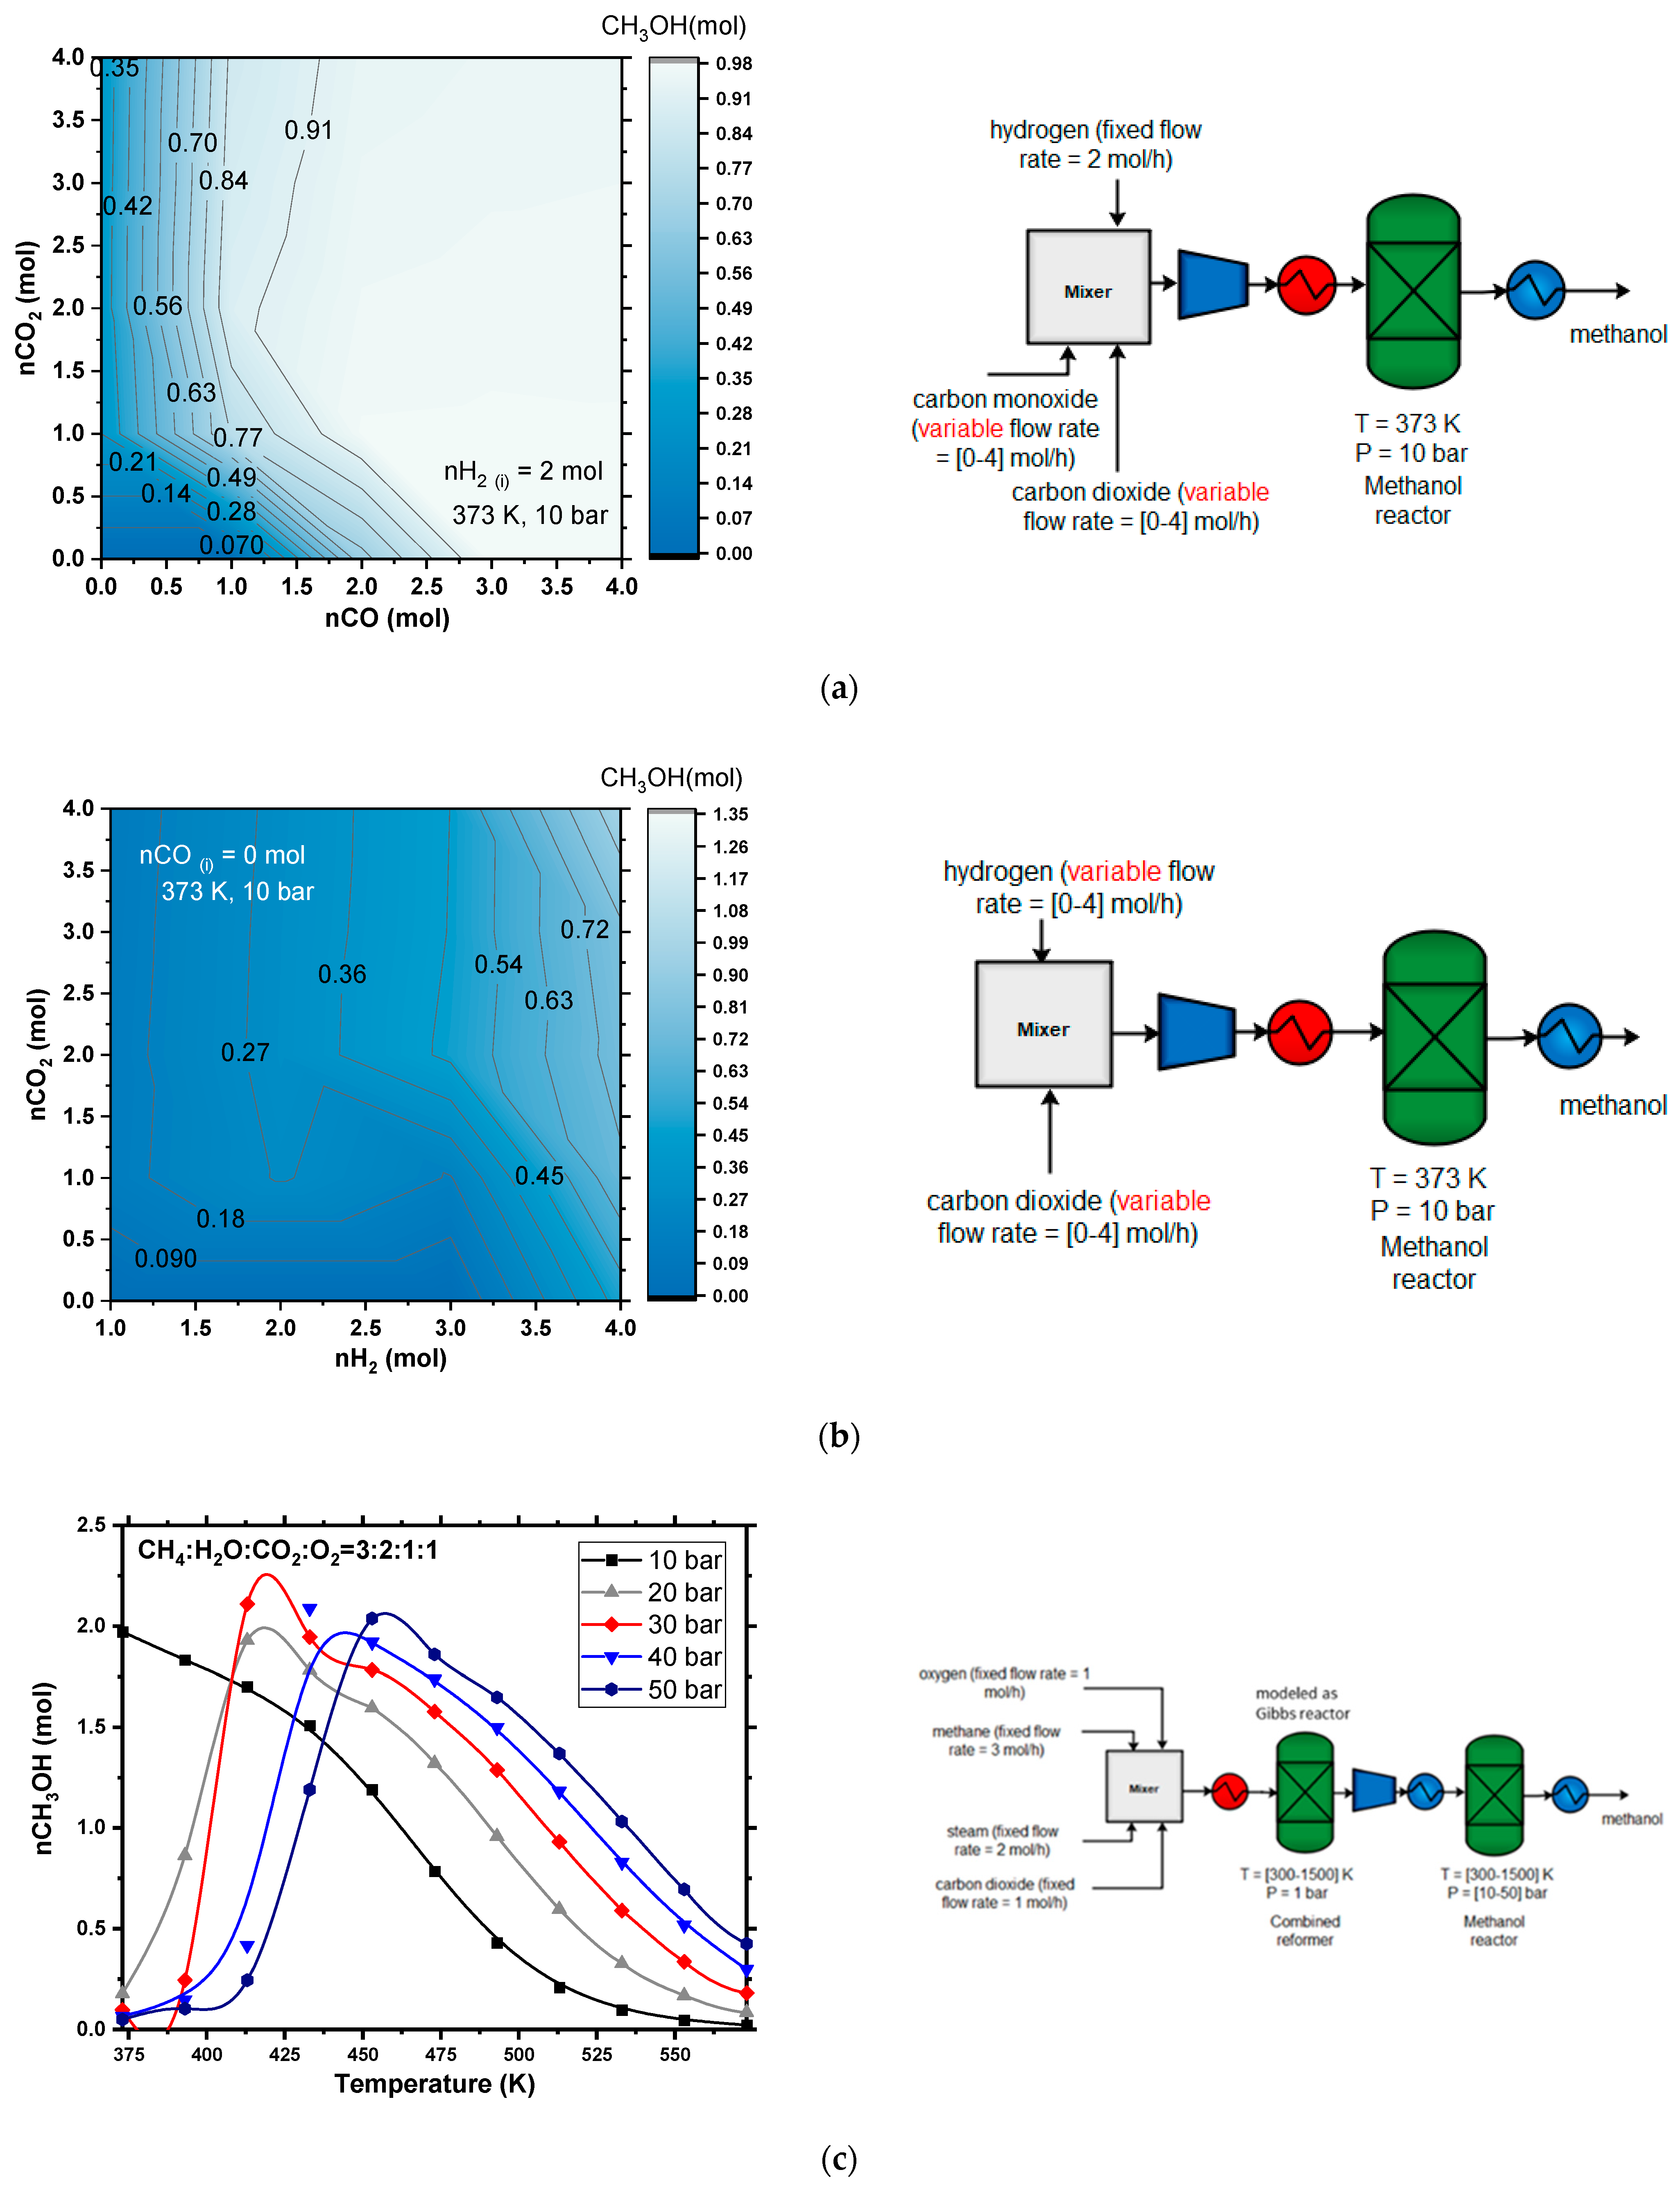
4.1.6. Methanol Production
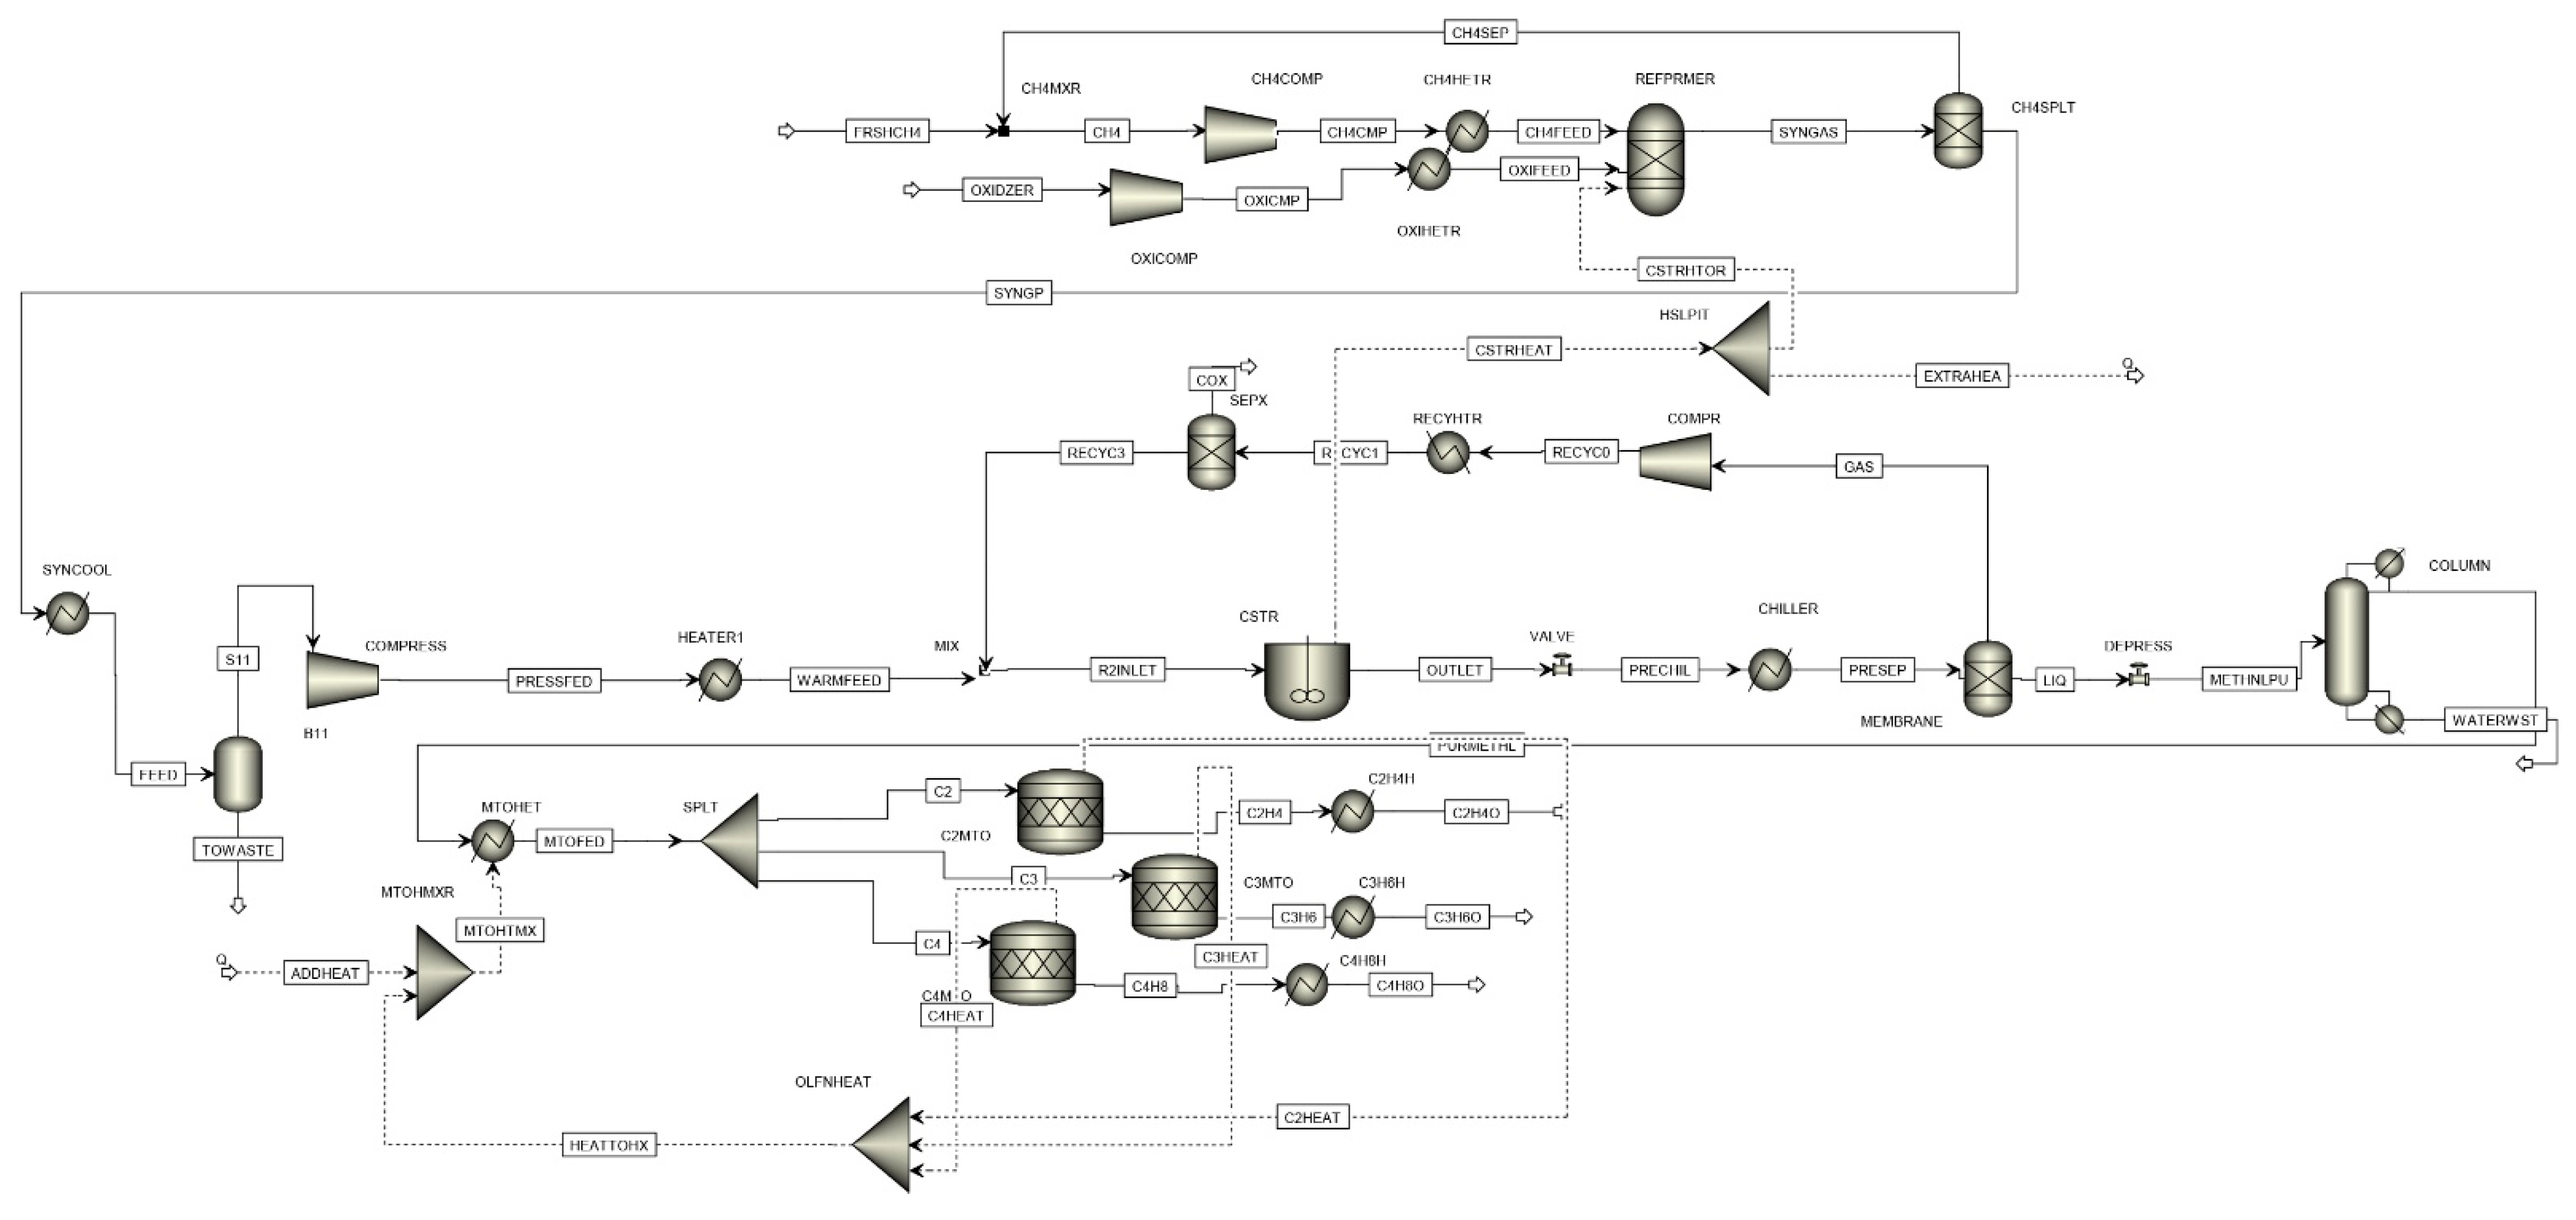
4.2. Material and Energy Balances
4.3. Economic Evaluation
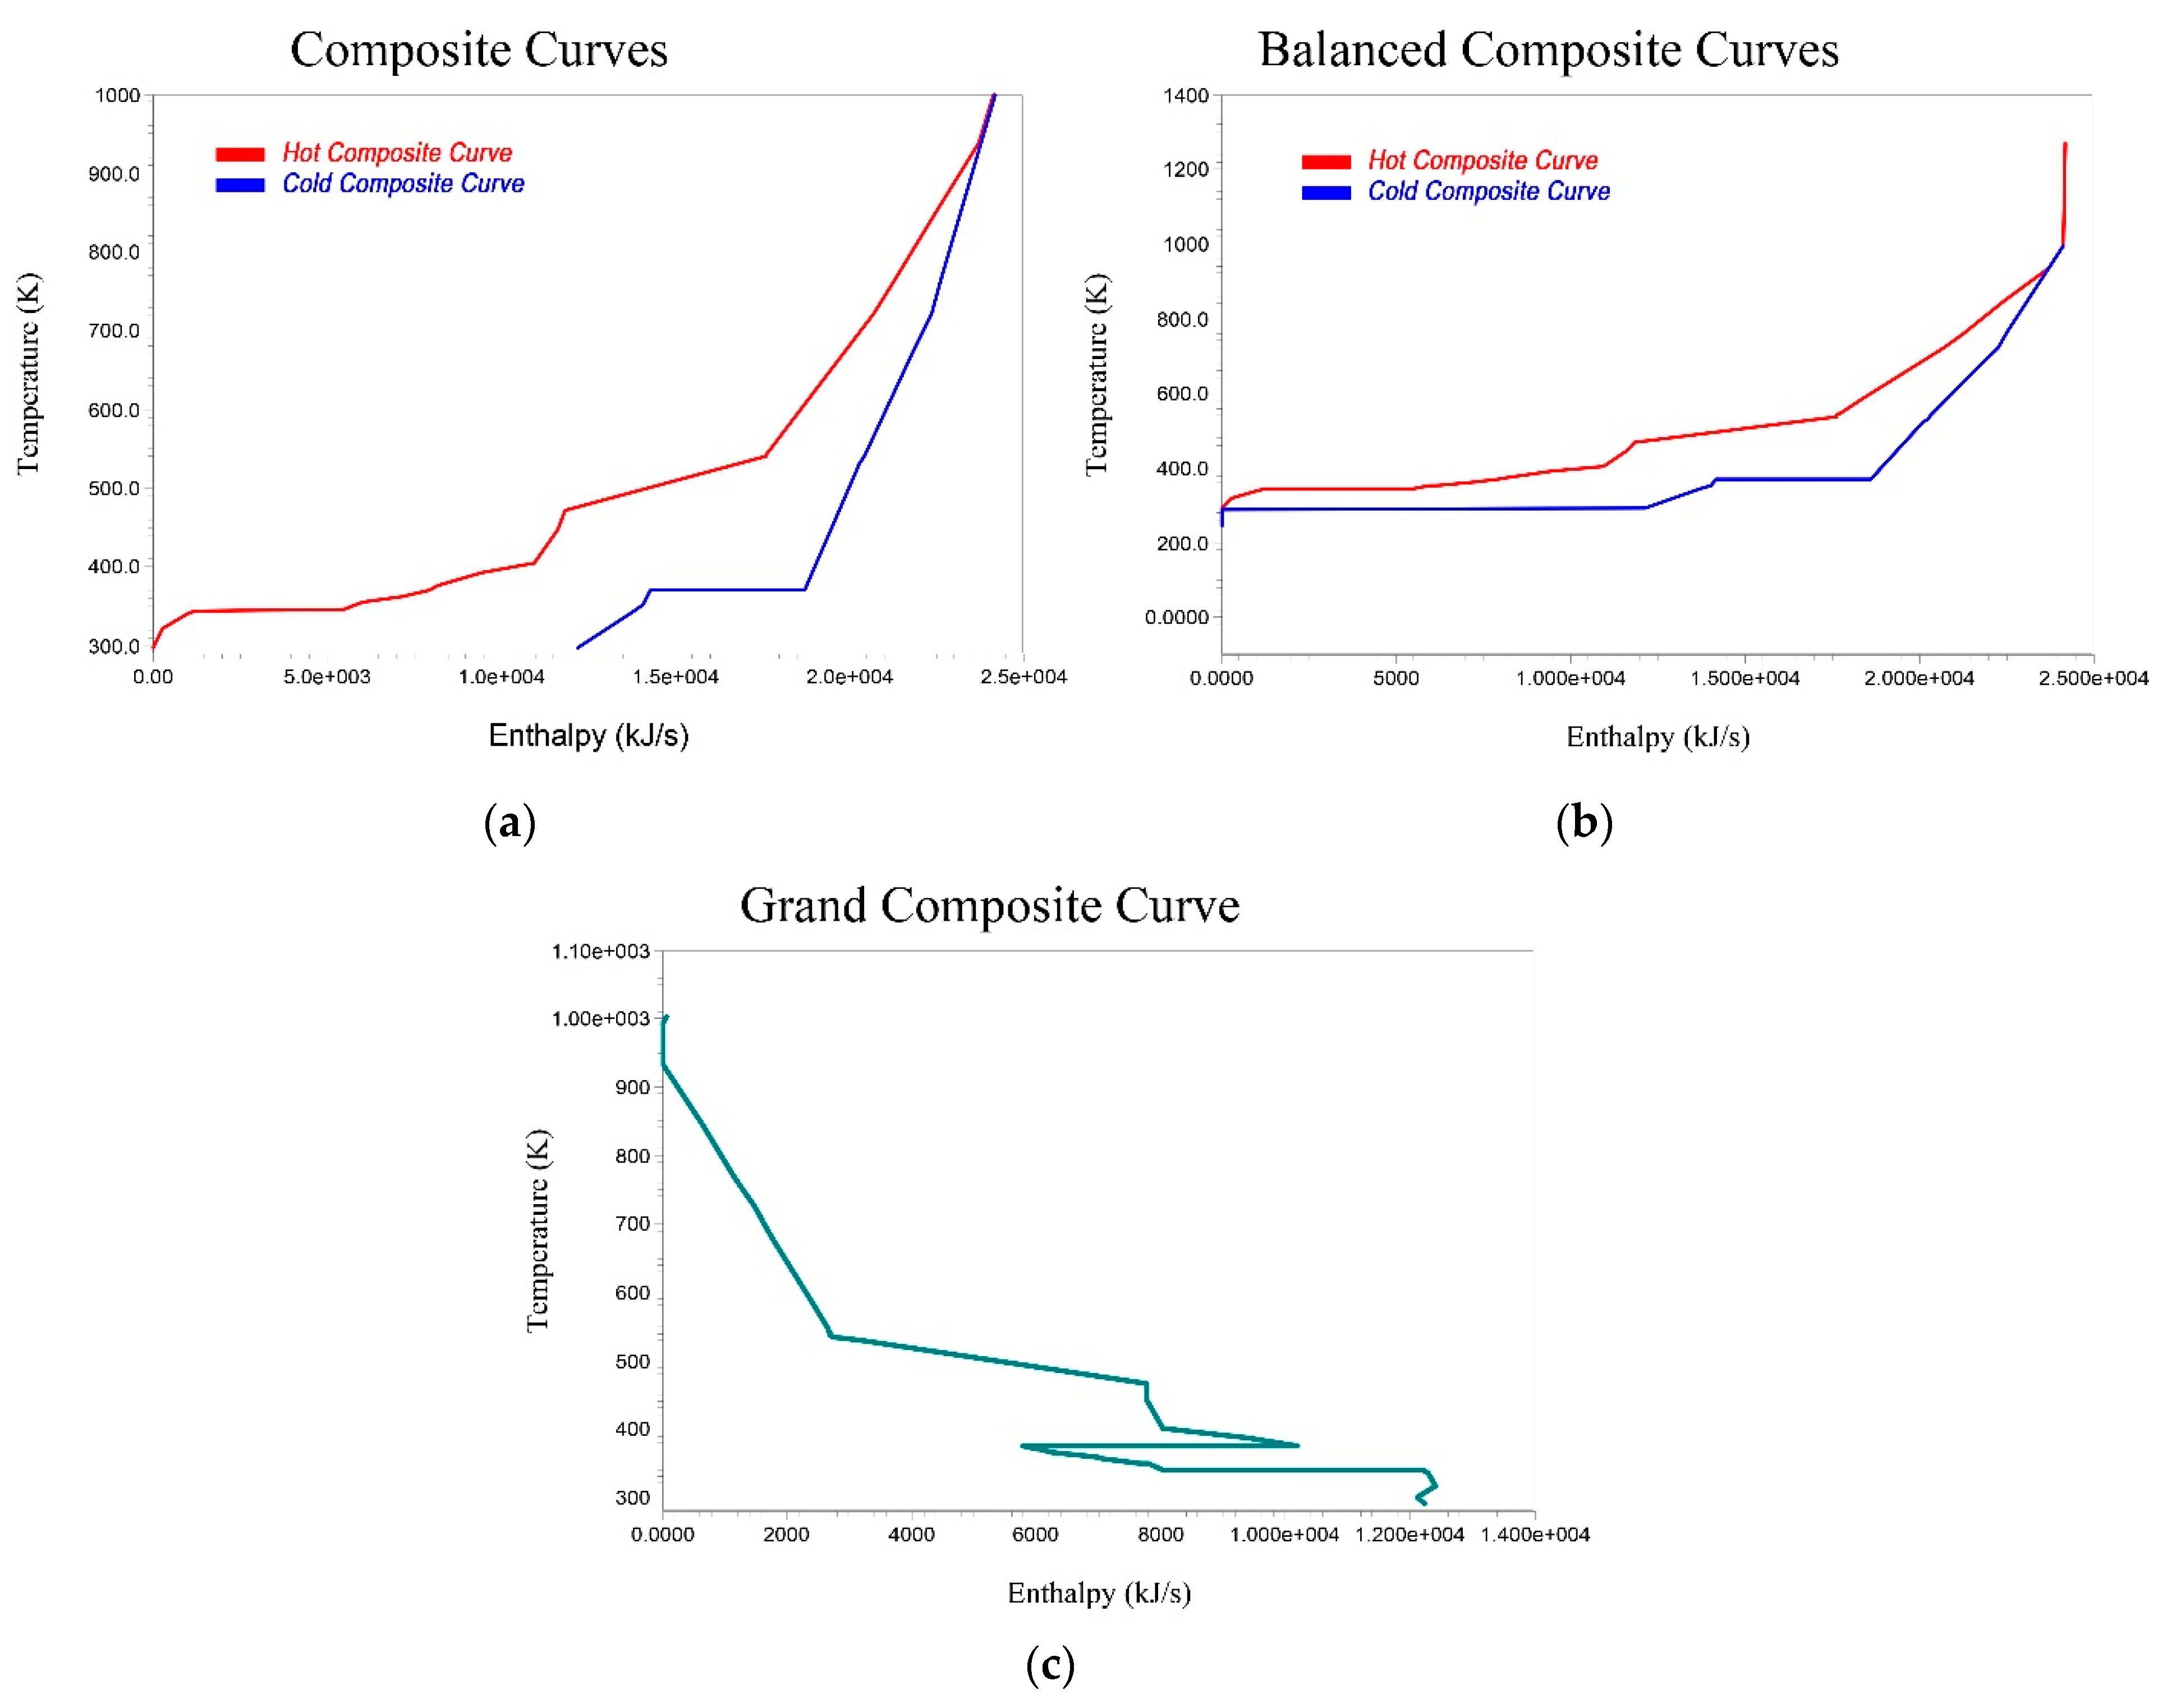
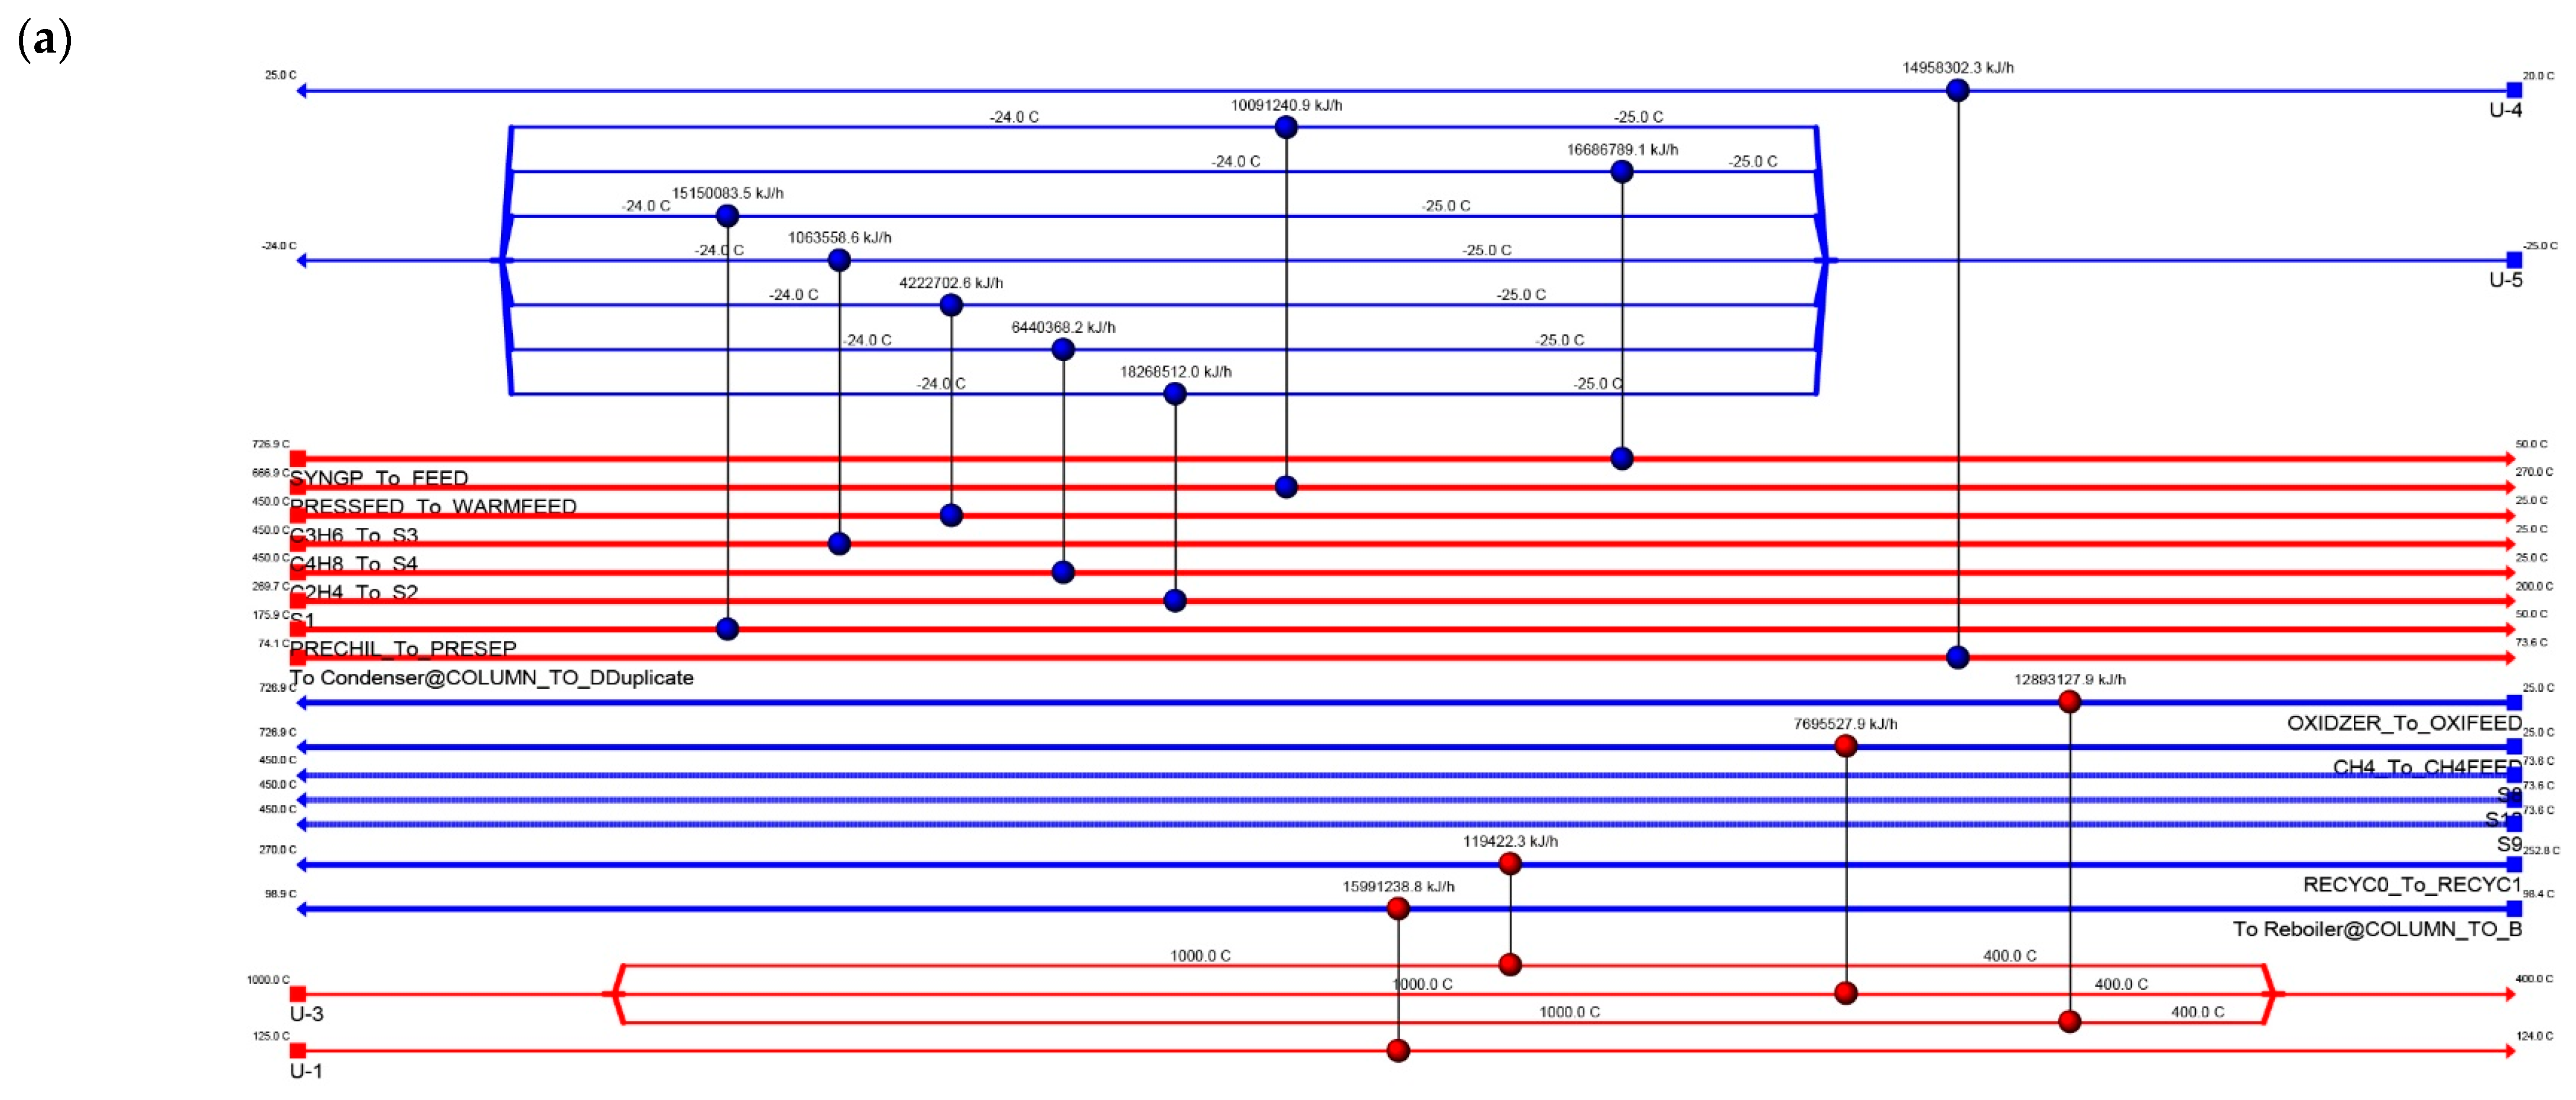
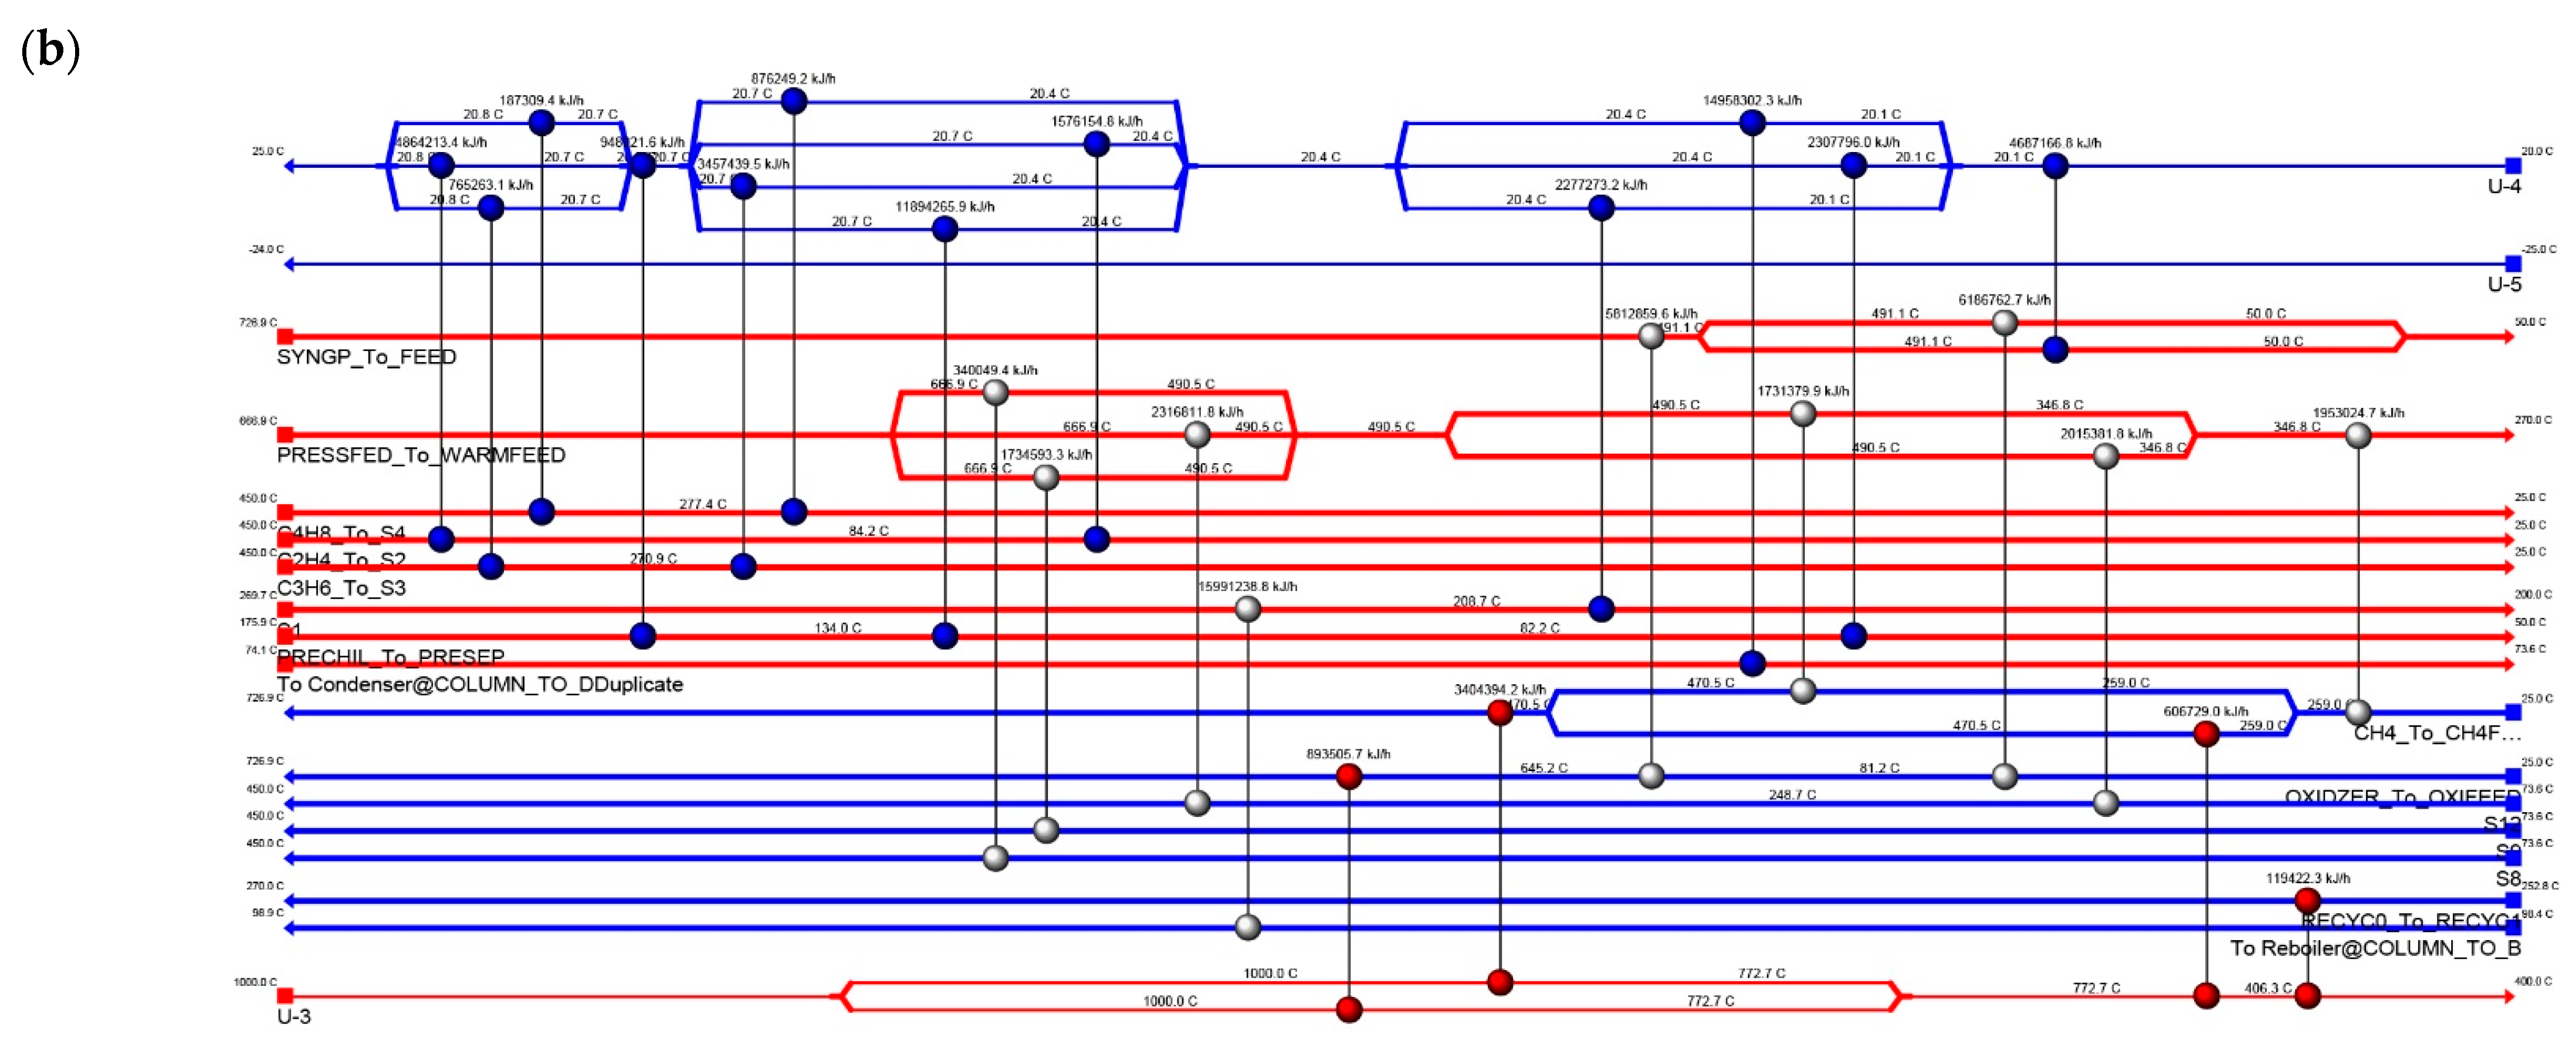
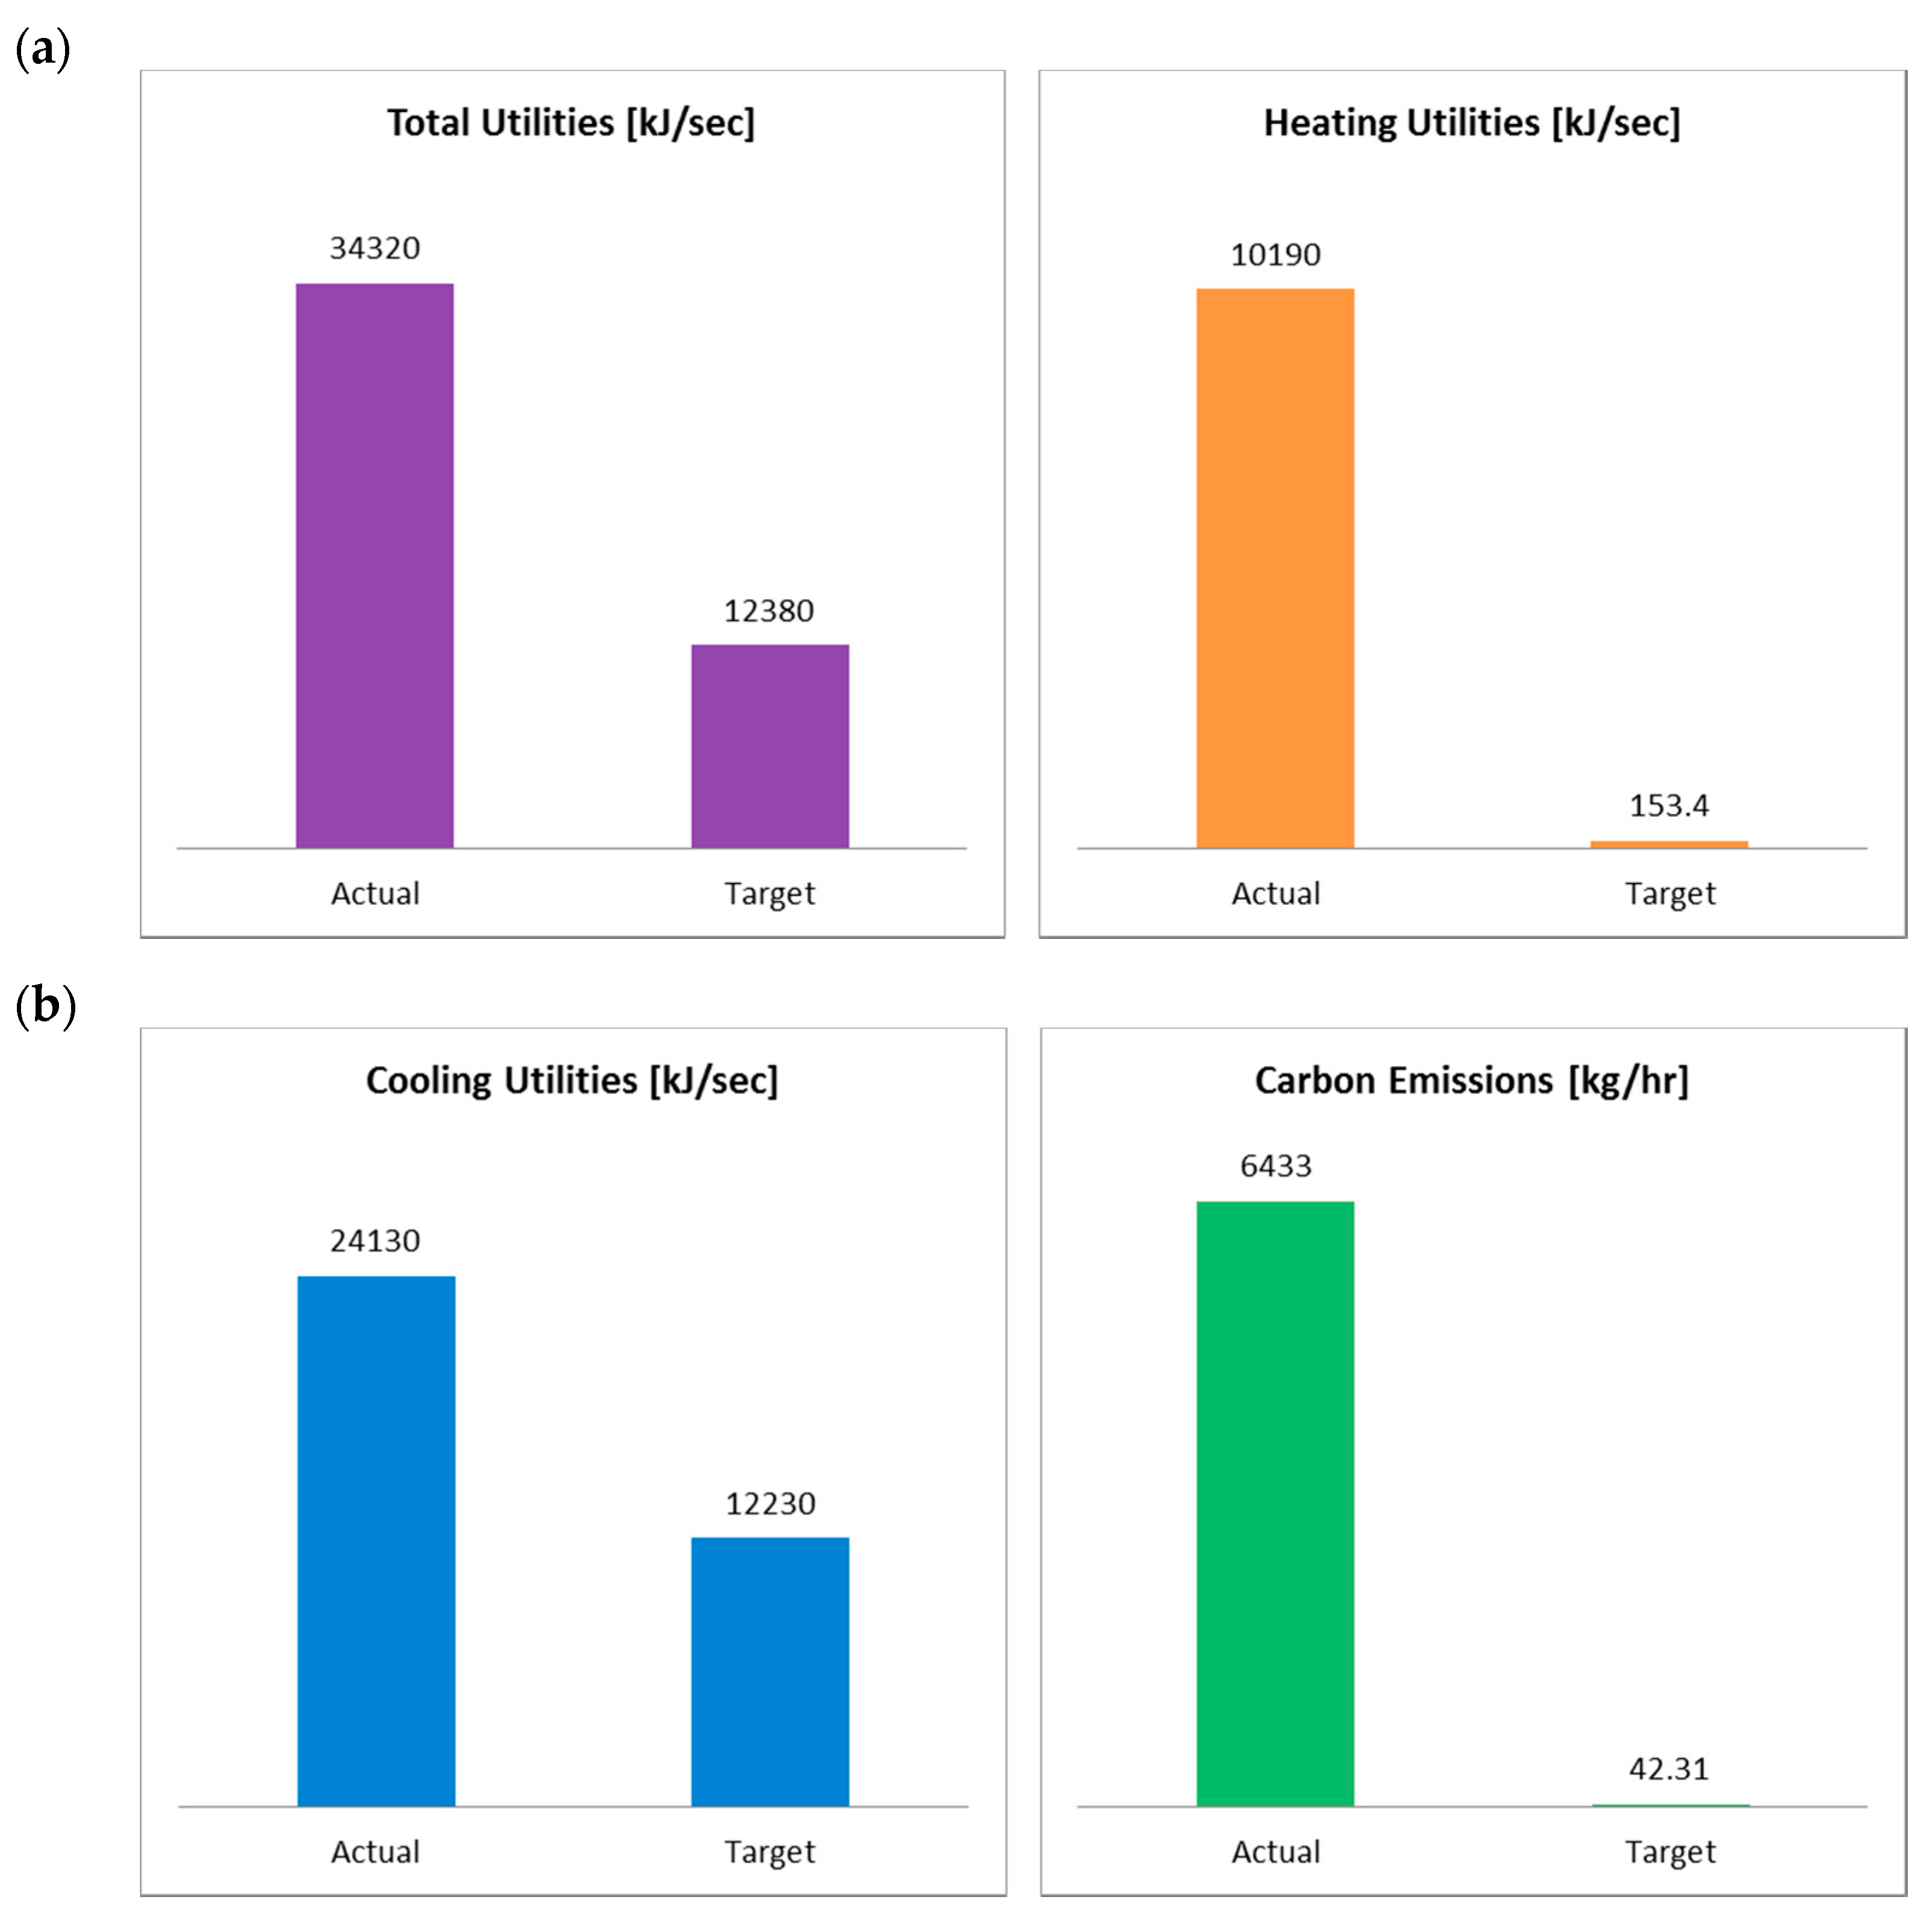
4.4. Energy Integration
4.5. Environmental Impact
5. Conclusions
Funding
Conflicts of Interest
References
- World Energy Outlook 2021; International Energy Agency: Paris, France, 2021. [CrossRef]
- York, A.P.E.; Xiao, T.; Green, M.L.H.; Claridge, J.B. Methane oxyforming for synthesis gas production. Catal. Rev. 2007, 49, 511–560. [Google Scholar] [CrossRef]
- Martinez-Gomez, J.; Sánchez-Ramírez, E.; Quiroz-Ramírez, J.J.; Segovia-Hernandez, J.G.; Ponce-Ortega, J.M.; El-Halwagi, M.M. Involving economic, environmental and safety issues in the optimal purification of biobutanol. Process Saf. Environ. Prot. 2016, 103, 365–376. [Google Scholar] [CrossRef]
- Noureldin, M.M.B.; Elbashir, N.O.; Gabriel, K.J.; El-Halwagi, M.M. A process integration approach to the assessment of CO2 fixation through dry reforming. ACS Sustain. Chem. Eng. 2015, 3, 625–636. [Google Scholar] [CrossRef]
- Gabriel, K.J.; Linke, P.; Jiménez-Gutiérrez, A.; Martínez, D.Y.; Noureldin, M.; El-Halwagi, M.M. Targeting of the water-energy nexus in gas-to-liquid processes: A comparison of syngas technologies. Ind. Eng. Chem. Res. 2014, 53, 7087–7102. [Google Scholar] [CrossRef]
- Ehlinger, V.M.; Gabriel, K.J.; Noureldin, M.M.B.; El-Halwagi, M.M. Process design and integration of shale gas to methanol. ACS Sustain. Chem. Eng. 2014, 2, 30–37. [Google Scholar] [CrossRef] [Green Version]
- Julián-Durán, L.M.; Ortiz-Espinoza, A.P.; El-Halwagi, M.M.; Jiménez-Gutiérrez, A. Techno-economic assessment and environmental impact of shale gas alternatives to methanol. ACS Sustain. Chem. Eng. 2014, 2, 2338–2344. [Google Scholar] [CrossRef]
- Ortiz-Espinoza, A.P.; Noureldin, M.M.B.; El-Halwagi, M.M.; Jiménez-Gutiérrez, A. Design, simulation and techno-economic analysis of two processes for the conversion of shale gas to ethylene. Comput. Chem. Eng. 2017, 107, 237–246. [Google Scholar] [CrossRef]
- Jasper, S.; El-Halwagi, M. A techno-economic comparison between two methanol-to-propylene processes. Processes 2015, 3, 684–698. [Google Scholar] [CrossRef]
- Pérez-Uresti, S.I.; Adrián-Mendiola, J.M.; El-Halwagi, M.M.; Jiménez-Gutiérrez, A. Techno-economic assessment of benzene production from shale gas. Processes 2017, 5, 33. [Google Scholar] [CrossRef]
- Bao, B.; El-Halwagi, M.M.; Elbashir, N.O. Simulation, integration, and economic analysis of gas-to-liquid processes. Fuel Process. Technol. 2010, 91, 703–713. [Google Scholar] [CrossRef] [Green Version]
- An, Y.; Lin, T.; Yu, F.; Yang, Y.; Zhong, L.; Wu, M.; Sun, Y. Advances in direct production of value-added chemicals via syngas conversion. Sci. China Chem. 2017, 60, 887–903. [Google Scholar] [CrossRef]
- Guo, X.; Fang, G.; Li, G.; Ma, H.; Fan, H.; Yu, L.; Ma, C.; Wu, X.; Deng, D.; Wei, M.; et al. Direct, nonoxidative conversion of methane to ethylene, aromatics, and hydrogen. Science 2014, 344, 616–619. [Google Scholar] [CrossRef] [PubMed]
- He, C.; You, F. Toward more cost-effective and greener chemicals production from shale gas by integrating with bioethanol dehydration: Novel process design and simulation-based optimization. AIChE J. 2015, 61, 1209–1232. [Google Scholar] [CrossRef]
- Bao, J.; Yang, G.; Yoneyama, Y.; Tsubaki, N. Significant advances in C1 catalysis: Highly efficient catalysts and catalytic reactions. ACS Catal. 2019, 9, 3026–3053. [Google Scholar] [CrossRef]
- Spivey, J.J.; Hutchings, G. Catalytic aromatization of methane. Chem. Soc. Rev. 2014, 43, 792–803. [Google Scholar] [CrossRef]
- Taifan, W.; Baltrusaitis, J. CH4 conversion to value added products: Potential, limitations and extensions of a single step heterogeneous catalysis. Appl. Catal. B Environ. 2016, 198, 525–547. [Google Scholar] [CrossRef]
- Cho, W.; Song, T.; Mitsos, A.; McKinnon, J.T.; Ko, G.H.; Tolsma, J.E.; Denholm, D.; Park, T. Optimal design and operation of a natural gas tri-reforming reactor for DME synthesis. Catal. Today 2009, 139, 261–267. [Google Scholar] [CrossRef]
- Kalamaras, C.M.; Efstathiou, A.M. Hydrogen production technologies: Current state and future developments. Conf. Pap. Energy 2013, 2013, 1–9. [Google Scholar] [CrossRef] [Green Version]
- Wilhelm, D.J.; Simbeck, D.R.; Karp, A.D.; Dickenson, R.L. Syngas production for gas-to-liquids applications: Technologies, issues and outlook. Fuel Process. Technol. 2001, 71, 139–148. [Google Scholar] [CrossRef]
- Rostrup-Nielsen, J.R.; Bak Hansen, J.H. CO2-reforming of methane over transition metals. J. Catal. 1993, 144, 38–49. [Google Scholar] [CrossRef]
- Song, C.; Pan, W. Tri-reforming of methane: A novel concept for catalytic production of industrially useful synthesis gas with desired H2/CO ratios. Catal. Today 2004, 98, 463–484. [Google Scholar] [CrossRef]
- Noureldin, M.M.B.; Elbashir, N.O.; El-Halwagi, M.M. Optimization and selection of reforming approaches for syngas generation from natural/shale gas. Ind. Eng. Chem. Res. 2014, 53, 1841–1855. [Google Scholar] [CrossRef]
- Godini, H.R.; Xiao, S.; Jašo, S.; Stünkel, S.; Salerno, D.; Son, N.X.; Song, S.; Wozny, G. Techno-economic analysis of integrating the methane oxidative coupling and methane reforming processes. Fuel Process. Technol. 2013, 106, 684–694. [Google Scholar] [CrossRef]
- World Energy Outlook 2019; OECD; International Energy Agency: Paris, France, 2019. [CrossRef]
- Martinez-Gomez, J.; Nápoles-Rivera, F.; Ponce-Ortega, J.M.; El-Halwagi, M.M. Optimization of the production of syngas from shale gas with economic and safety considerations. Appl. Therm. Eng. 2017, 110, 678–685. [Google Scholar] [CrossRef]
- Niziolek, A.M.; Onel, O.; Floudas, C.A. Production of benzene, toluene, and the xylenes from natural gas via methanol. Comput. Aided Chem. Eng. 2016, 38, 2349–2354. [Google Scholar]
- He, C.; You, F. Shale gas processing integrated with ethylene production: Novel process designs, exergy analysis, and techno-economic analysis. Ind. Eng. Chem. Res. 2014, 53, 11442–11459. [Google Scholar] [CrossRef]
- Nematollahi, B.; Rezaei, M.; Khajenoori, M. Combined dry reforming and partial oxidation of methane to synthesis gas on noble metal catalysts. Int. J. Hydrogen Energy 2011, 36, 2969–2978. [Google Scholar] [CrossRef]
- Meissner, H.P.; Kusik, C.L.; Dalzell, W.H. Equilibrium composition with multiple reactions. Ind. Eng. Chem. Fundam. 1969, 8, 659–665. [Google Scholar] [CrossRef]
- Foust, T.D.; Aden, A.; Dutta, A.; Phillips, S. An economic and environmental comparison of a biochemical and a thermochemical lignocellulosic ethanol conversion processes. Cellulose 2009, 16, 547–565. [Google Scholar] [CrossRef]
- Phillips, S.; Aden, A.; Jechura, J.; Dayton, D. Thermochemical Ethanol via Indirect Gasification and Mixed Alcohol Synthesis of Lignocellulosic Biomass; Ethanol Biofuel Production, National Renewable Energy Lab (NREL): Golden, CO, USA, 2010. [Google Scholar]
- Asaro, M.; Smith, R.M.; Davis, B.H. Gas to Liquid Technologies. In Encyclopedia of Sustainability Science and Technology; Meyers, R.A., Ed.; Springer: New York, NY, USA, 2017; pp. 1–48. [Google Scholar] [CrossRef]
- Steynberg, A.; Dry, M. Fischer-Tropsch Technology; Elsevier Science: Amsterdam, The Netherlands, 2004. [Google Scholar]
- Aasberg-Petersen, K.; Dybkjær, I.; Ovesen, C.V.; Schjødt, N.C.; Sehested, J.; Thomsen, S.G. Natural gas to synthesis gas—Catalysts and catalytic processes. J. Nat. Gas Sci. Eng. 2011, 3, 423–459. [Google Scholar] [CrossRef]
- Snoeck, J.W.; Froment, G.F.; Fowles, M. Steam/CO2 reforming of methane. Carbon filament formation by the Boudouard reaction and gasification by CO2, by H2, and by steam: Kinetic study. Ind. Eng. Chem. Res. 2002, 41, 4252–4265. [Google Scholar] [CrossRef]
- Tijm, P.J.A.; Waller, F.J.; Brown, D.M. Methanol technology developments for the new millennium. Appl. Catal. A Gen. 2001, 221, 275–282. [Google Scholar] [CrossRef]
- Vanden Bussche, K.M.; Froment, G.F. A steady-state kinetic model for methanol synthesis and the water gas shift reaction on a commercial Cu/ZnO/Al2O3 catalyst. J. Catal. 1996, 161, 1–10. [Google Scholar] [CrossRef]
- Arora, S.S.; Bhan, A. The critical role of methanol pressure in controlling its transfer dehydrogenation and the corresponding effect on propylene-to-ethylene ratio during methanol-to-hydrocarbons catalysis on H-ZSM-5. J. Catal. 2017, 356, 300–306. [Google Scholar] [CrossRef]
- Lee, Y.J.; Baek, S.C.; Jun, K.W. Methanol conversion on SAPO-34 catalysts prepared by mixed template method. Appl. Catal. A Gen. 2007, 329, 130–136. [Google Scholar] [CrossRef]
- Chen, J.Q.; Bozzano, A.; Glover, B.; Fuglerud, T.; Kvisle, S. Recent advancements in ethylene and propylene production using the UOP/Hydro MTO process. Catal. Today 2005, 106, 103–107. [Google Scholar] [CrossRef]
- Mokrani, T.; Scurrell, M. Gas conversion to liquid fuels and chemicals: The methanol route-catalysis and processes development. Catal. Rev. Sci. Eng. 2009, 51, 1–145. [Google Scholar] [CrossRef]
- Onel, O.; Niziolek, A.M.; Floudas, C.A. Optimal production of light olefins from natural gas via the methanol intermediate. Ind. Eng. Chem. Res. 2016, 55, 3043–3063. [Google Scholar] [CrossRef]
- Khare, R.; Millar, D.; Bhan, A. A mechanistic basis for the effects of crystallite size on light olefin selectivity in methanol-to-hydrocarbons conversion on MFI. J. Catal. 2015, 321, 23–31. [Google Scholar] [CrossRef]
- Vora, B.V.; Marker, T.L.; Barger, P.T.; Nilsen, H.R.; Kvisle, S.; Fuglerud, T. Economic route for natural gas conversion to ethylene and propylene. In Studies in Surface Science and Catalysis; Elsevier: Amsterdam, The Netherlands, 1997; pp. 87–98. [Google Scholar]
- Wilson, S.; Barger, P. The characteristics of SAPO-34 which influence the conversion of methanol to light olefins. Microporous Mesoporous Mater. 1999, 29, 117–126. [Google Scholar] [CrossRef]
- Gao, Y.; Neal, L.; Ding, D.; Wu, W.; Baroi, C.; Gaffney, A.M.; Li, F. Recent advances in intensified ethylene production—A review. ACS Catal. 2019, 9, 8592–8621. [Google Scholar] [CrossRef]
- Gradassi, M.J.; Wayne Green, N. Economics of natural gas conversion processes. Fuel Process. Technol. 1995, 42, 65–83. [Google Scholar] [CrossRef]
- Zaman, J. Oxidative processes in natural gas conversion. Fuel Process. Technol. 1999, 58, 61–81. [Google Scholar] [CrossRef]
- Fogler, H.S. Essentials of Chemical Reaction Engineering. Focus on Catalysts; Pearson Education: London, UK, 2017. [Google Scholar]
- Fan, M.S.; Abdullah, A.Z.; Bhatia, S. Catalytic technology for carbon dioxide reforming of methane to synthesis gas. ChemCatChem 2009, 1, 192–208. [Google Scholar] [CrossRef]
- O’Connor, A.M.; Ross, J.R.H. The effect of O2 addition on the carbon dioxide reforming of methane over Pt/ZrO2 catalysts. Catal. Today 1998, 46, 203–210. [Google Scholar] [CrossRef]
- Souza, M.M.V.M.; Schmal, M. Combination of carbon dioxide reforming and partial oxidation of methane over supported platinum catalysts. Appl. Catal. A Gen. 2003, 255, 83–92. [Google Scholar] [CrossRef]
- Tomishige, K.; Nurunnabi, M.; Maruyama, K.; Kunimori, K. Effect of oxygen addition to steam and dry reforming of methane on bed temperature profile over Pt and Ni catalysts. Fuel Process. Technol. 2004, 85, 1103–1120. [Google Scholar] [CrossRef]
- Neal, L.M.; Haribal, V.P.; Li, F. Intensified ethylene production via chemical looping through an exergetically efficient redox scheme. iScience 2019, 19, 894–904. [Google Scholar] [CrossRef] [Green Version]
- Ahari, J.S.; Sadeghi, M.T.; Zarrinpashne, S. Effects of operating parameters on oxidative coupling of methane over Na-W-Mn/SiO2 catalyst at elevated pressures. J. Nat. Gas Chem. 2011, 20, 204–213. [Google Scholar] [CrossRef]
- Elkins, T.W.; Hagelin-Weaver, H.E. Characterization of Mn–Na2WO4/SiO2 and Mn–Na2WO4/MgO catalysts for the oxidative coupling of methane. Appl. Catal. A Gen. 2015, 497, 96–106. [Google Scholar] [CrossRef]
- El-Halwagi, M.M. Overview of process economics. In Sustainable Design Through Process Integration; El-Halwagi, M.M., Ed.; Butterworth-Heinemann: Oxford, UK, 2012. [Google Scholar] [CrossRef]
- Peters, M.S.; Peters, J.I. Plant Design and Economics for Chemical Engineers. Engineering Economist; McGraw-Hill: New York, NY, USA, 1959. [Google Scholar]
- Davis, R.; Tao, L.; Scarlata, C.; Tan, E.C.D.; Ross, J.; Lukas, J.; Sexton, D. Process Design and Economics for the Conversion of Lignocellulosic Biomass to Hydrocarbons: Dilute-Acid and Enzymatic Deconstruction of Biomass to Sugars and Biological Conversion of Sugars to Hydrocarbons. National Renewable Energy Laboratory-NREL. Available online: http://www.osti.gov/servlets/purl/1107470/ (accessed on 14 January 2020).
- Linnhoff, B.; Boland, D. A User Guide on Process Integration for the Efficient Use of Energy; Elsevier: Amsterdam, The Netherlands, 1982. [Google Scholar] [CrossRef]
- Albina, D.O.; Themelis, N.J. Emissions from Waste-to-Energy: A Comparison with Coal-fired Power Plants. In Proceedings of the ASME 2003 International Mechanical Engineering Congress and Exposition, Washington, DC, USA, 15–21 November 2003; pp. 169–184. [Google Scholar] [CrossRef]


| Yield (%) | Yield on C Basis (%) | |
|---|---|---|
| Ethylene | 21.5 | 49.0 |
| Propylene | 14.0 | 32.0 |
| Butene | 4.30 | 10.0 |
| Methane | 0.93 | 2.18 |
| Ethane | 0.18 | 0.42 |
| Pentane | 0.95 | 2.00 |
| Hydrogen | 0.38 | 0.90 |
| Coke | 1.33 | 3.00 |
| CO2 | 0.21 | 0.50 |
| Water | 56.2 | - |
| Item | Best Value (USD) |
|---|---|
| Shale gas | 5.6/MMbtu |
| Ethane | 0.50/gal |
| Ethylene | 1200/ton |
| Propane | 1.00/ga |
| Butene | 1.60/ga |
| Hydrogen | 1.76/kg |
| Propylene | 1340/ton |
| Electricity | 0.07/kwh |
| Methane purchase price (USD kscf−1) [60] | 3.5 |
| Grade 1 refrigerant | 2.74 × 10⁻⁶ |
| Cooling water (USD kg−1) a | 3.08 × 10⁻⁵ |
| Steam, 100 PSI (USD kg−1) a | 0.0179 |
| Fired heater, 1273 K (USD kJ−1) a | 4.2 × 10⁻⁶ |
| Electricity (USD kg−1) a | 0.0775 |
| Total Capital Cost (USD MM) | 17.54 |
| Total Operating Cost (USD MM/Year) | 55.31 |
| Total Raw Materials Cost (USD MM/Year) | 7.23 |
| Total Utility Cost (USD MM/Year) | 4.92 |
| Desired Rate of Return (Percent/Year) | 20 |
| Equipment Cost (USD MM) | 6.76 |
| Total Installed Cost (USD MM) | 9.50 |
| Equipment | Heat Load | Unit |
|---|---|---|
| COMPR | 522.2 | kWh |
| COMPRESS | 5968 | |
| OXIHETR | 12.22 | MMBtu |
| CH4HETR | 7.29 | |
| RECYHTR | 0.11 | |
| C3H6H | 4.00 | |
| HEATER1 | 9.56 | |
| SYNCOOL | 15.81 | |
| C2H4H | 6.10 | |
| C4H8H | 1.01 | |
| CHILLER | 14.36 |
| Current (kJ/s) | Target (kJ/s) | Saving Potential (kJ/s) | Energy Cost Savings (USD/Yr) | Energy Cost Savings (%) | ΔTmin (K) | |
|---|---|---|---|---|---|---|
| LP Steam | 4442 | 0 | 4442 | 266,340 | 100.00 | 10.0 |
| Fired Heater | 5752 | 153.4 | 5599 | 750,922 | 97.33 | 25.0 |
| Total Hot Utilities | 1.02 × 10⁴ | 153.4 | 1.00 × 10⁴ | 1,017,263 | 98.02 | - |
| Cooling Water | 4155 | 1.22 × 10⁴ | −8043 | −53,808 | −193.56 | 5.0 |
| Refrigerant | 1.99 × 10⁴ | 29.87 | 1.99 × 10⁴ | 1,724,930 | 99.85 | 3.0 |
| Total Cold Utilities | 2.41 × 10⁴ | 1.22 × 10⁴ | 1.19 × 10⁴ | 1,671,122 | 95.20 | - |
Publisher’s Note: MDPI stays neutral with regard to jurisdictional claims in published maps and institutional affiliations. |
© 2021 by the author. Licensee MDPI, Basel, Switzerland. This article is an open access article distributed under the terms and conditions of the Creative Commons Attribution (CC BY) license (https://creativecommons.org/licenses/by/4.0/).
Share and Cite
Alturki, A. Techno-Economic Analysis of a Process to Convert Methane to Olefins, Featuring a Combined Reformer via the Methanol Intermediate Product. Hydrogen 2022, 3, 1-27. https://doi.org/10.3390/hydrogen3010001
Alturki A. Techno-Economic Analysis of a Process to Convert Methane to Olefins, Featuring a Combined Reformer via the Methanol Intermediate Product. Hydrogen. 2022; 3(1):1-27. https://doi.org/10.3390/hydrogen3010001
Chicago/Turabian StyleAlturki, Abdulaziz. 2022. "Techno-Economic Analysis of a Process to Convert Methane to Olefins, Featuring a Combined Reformer via the Methanol Intermediate Product" Hydrogen 3, no. 1: 1-27. https://doi.org/10.3390/hydrogen3010001
APA StyleAlturki, A. (2022). Techno-Economic Analysis of a Process to Convert Methane to Olefins, Featuring a Combined Reformer via the Methanol Intermediate Product. Hydrogen, 3(1), 1-27. https://doi.org/10.3390/hydrogen3010001