Article

Aspects of Hydrogen and Biomethane Introduction in Natural Gas Infrastructure and Equipment

by
Filipe M. Quintino
1,2,*,
Nuno Nascimento
2 and
Edgar C. Fernandes
1
1
Center IN+, Instituto Superior Técnico, University of Lisbon, 1049-001 Lisbon, Portugal
2
Galp Gás Natural Distribuição, 1600-209 Lisbon, Portugal
*
Author to whom correspondence should be addressed.
Hydrogen 2021, 2(3), 301-318; https://doi.org/10.3390/hydrogen2030016
Submission received: 22 June 2021 / Revised: 12 July 2021 / Accepted: 27 July 2021 / Published: 10 August 2021
(This article belongs to the Special Issue Feature Papers in Hydrogen)

Abstract

:
The injection of green hydrogen and biomethane is currently seen as the next step towards the decarbonization of the gas sector in several countries. However, the introduction of these gases in existent infrastructure has energetic, material and operational implications that should be carefully looked at. With regard to a fully blown green gas grid, transport and distribution will require adaptations. Furthermore, the adequate performance of end-use equipment connected to the grid must be accounted for. In this paper, a technical analysis of the energetic, material and operational aspects of hydrogen and biomethane introduction in natural gas infrastructure is performed. Impacts on gas transmission and distribution are evaluated and an interchangeability analysis, supported by one-dimensional Cantera simulations, is conducted. Existing gas infrastructure seems to be generally fit for the introduction of hydrogen and biomethane. Hydrogen content up to 20% by volume appears to be possible to accommodate in current infrastructure with only minor technical modifications. However, at the Distribution System Operator (DSO) level, the introduction of gas quality tracking systems will be required due to the distributed injection nature of hydrogen and biomethane. The different tolerances for hydrogen blending of consumers, depending on end-use equipment, may be critical during the transition period to a 100% green gas grid as there is a risk of pushing consumers off the grid.

1. Introduction

The quest for a full-blown renewable energy mix has motivated the investment in green gaseous fuels. This movement has been supported by national and supra-national institutions that see in renewable gas a crucial vector for the decarbonization of the economy [1,2]. The focus has mostly been on biogas (and biomethane) and hydrogen, although for different reasons. Whereas biogas is a fuel, consisting mostly of methane and carbon dioxide and produced through the anaerobic digestion of organic waste, hydrogen is a gas that can be produced both by fossil and renewable pathways. In recent years, hydrogen has been considered by some as the next stage of gas usage, as the increasing renewable electricity share enhances the possibility of its production through electrolysis, with an otherwise curtailed power supply or dedicated energy generation. The introduction of these renewable gases in the energy mix can be achieved through several strategies; however, injection in existing natural gas infrastructure has been widely proposed as the first step towards a full-blown green gas sector. The use of existing gas grids presents several advantages, of which the main one is circumventing the need to develop new infrastructure from scratch, reducing overall cost. Throughout the world, several projects are already underway to assess the impact of small injections of hydrogen on pipelines and on end consumption [3,4,5,6], whereas biomethane is already widely used in some countries. However, critical questions remain. Even though it is clear that the system can cope with small injections of renewable gases, with hydrogen presenting the most significant bottlenecks due to its material and energetic impacts, operational aspects of large-scale use of hydrogen and biomethane in gas grids are still not clarified. Several authors have investigated the impact of the introduction of renewable gases, mainly hydrogen, on the natural gas pipeline infrastructure. In the United Kingdom, the HyDeploy project [7], started in 2019, assesses the safety of blending hydrogen up to 20% with natural gas in cooking and heating appliances. To date, results have demonstrated that a hydrogen content of 15% causes no disruption for consumers. The HIGGS (Hydrogen in Gas Grids) project [8] covers the gaps in knowledge on the impact of hydrogen on high-pressure gas grids. The project is underway and final conclusions are expected in December 2022. In regard to gas consumption, the THyGA project is testing the impact of hydrogen admixture in gas applications [9,10]. The research of THyGA has focused on hydrogen admixture levels under 30% by volume, concluding that there can be a decrease in power output of up to 12% at this level and the first occurrences of flashback at 20%, with the risk depending on the appliance type. In 2018, Speirs et al. evaluated options for a greener gas grid. They conducted a systematic review of evidence and concluded that both hydrogen and biomethane were feasible but less competitive options to replace natural gas at that time [11]. However, recent reports have shown that renewable gases, particularly green hydrogen, will be a cost-competitive technology once economies of scale lower costs [12] and that pipelines are the most viable technology for transport and distribution [13]. Haeseldonckx and D’haeseleer evaluated the material and energetic impacts of hydrogen transport in natural gas distribution in a changing market structure scenario [14]. It was found that, generally, volumes of up to 17% of H2 should not cause problems, with modifications in equipment required when this limit is surpassed. Melania et al. assessed key issues of hydrogen blending in natural gas pipeline networks, concluding that concentrations of less than 5–15% of H2 by volume are viable even though evaluations on a case-by-case basis will be required [15]. Similar conclusions were drawn by Altfeld and Pinchbeck in an analysis of hydrogen admixture in natural gas systems [16]. Even though it is stated by the authors that an admixture of up to 10% by volume of hydrogen is possible, there are still significant limitations in steel tanks of natural gas vehicles and gas engines; both are restricted to H2 concentrations of 2 vol.%. These results are in line with recent research. In an investigation of the impact of hydrogen in power-to-gas networks where the entire system was analysed from a material aspect standpoint, Gondal states that only a 2% of H2 by volume can be blended in the networks with negligible effects, particularly due to the impacts on specific end applications such as gas turbines and engines [17]. Recently, Pellegrini et al., in a study assessing the potential of green hydrogen blending in the Italian natural gas network, concluded that grid adaptations in critical components and adjustments to the end-user will be necessary to deliver the ambitious goals of the European hydrogen strategy [18].
Even though existing research has provided relevant insights on the use of renewable gases in natural gas infrastructure, there is still a lack of information on the combined use of hydrogen and biomethane for the decarbonization of gas grids, as existing research often decouples both gases. Furthermore, there is still a need to evaluate the challenge of renewable gas injection in networks from a holistic perspective, where not only the issues on transmission and distribution or final use are assessed, but also the dynamics in which these areas affect each other are analysed.
Figure 1 exhibits a schematic of a generic gas system. It is composed of three main areas: upstream, midstream and downstream. Regulation and metering also have a crucial role, even though they impact every one of the areas mentioned above. Currently, most of these systems run on natural gas but the aim is to introduce hydrogen and biomethane to decarbonize the grid. Therefore, considering the existent systems, the main question is to which degree are biomethane and hydrogen interchangeable with natural gas. For this purpose, we consider gas interchangeability as the ability to substitute natural gas by hydrogen and biomethane with no significant modifications to the system and without impacting operational performance. The introduction of renewable gases in the gas system has to be analysed from an energetic, material and operational standpoint. Overall, available literature has mainly focused on each of these aspects individually, failing to provide a holistic picture of the impacts of hydrogen and biomethane in the gas system.
In this study, a technical analysis of the energetic, material and operational aspects of hydrogen and biomethane introduction in natural gas infrastructure is performed. The impact on transmission and distribution is evaluated, considering the limitations of critical system components as well as the changes in network management required to accommodate these renewable gases. Furthermore, existing gas interchangeability criteria are assessed in light of hydrogen and biomethane introduction. Implications for current equipment are discussed and an interchangeability analysis, based on 1-D numerical simulations of laminar flame speed, is conducted for domestic appliances.

2. Means and Methods

In Section 3, a literature review is performed on the subject of gas interchangeability. For each analysed area (transmission, distribution and end-use), key information regarding the impact of hydrogen and biomethane on natural gas infrastructure was, as far as it was available, collected and summarized. A review of the relevant gas pipeline management literature was also conducted. This served as the basis for a technical analysis of the effects of hydrogen and biomethane on pipeline management. Key parameters were evaluated and quantified for various blends through an analytical approach, developed with the state-of-the-art equations described in Section 3. Finally, an interchangeability analysis was performed to evaluate the impact of hydrogen and biomethane on combustion devices. A review of relevant combustion theory was conducted to model the impact of these gases on appliance performance. To feed this model, numerical simulations were conducted to compute the burning velocity of various blends in different conditions. These simulations are described in detail in Section 2.
Natural gas varies in composition, often depending on its source. Due to this, each country/region exhibits a different NG blend composition. Each blend is constituted by hydrocarbons (methane, ethane, propane and butane), diluents (e.g., carbon dioxide, nitrogen) and contaminants. Nevertheless, the largest share of its composition is methane, accounting for around 90–95% (v/v) in an average NG [19,20]. The Portuguese NG, which is received via an LNG terminal in Sines and via a pipeline from north Africa, was adopted in this analysis. Its average molar composition is: CH4: 90.0505%, C2H6: 6.4485%, C3H8: 1.7445%, i−C4H10: 0.234%, n−C4H10: 0.2695%, i−C5H12: 0.0105%, n−C6H14: 0.01%, N2: 0.5795, CO2: 0.633% [21]. This NG blend presents a molecular weight of M = 17.919 kg / kmol , a density of ρ = 0.8019 kg / m 3 , a higher heating value of HHV = 42.8 MJ / m 3 and a Wobbe Index of WI = 54.4 MJ / m 3 . Furthermore, pure CH4 is also used throughout the paper to provide a reference point to other NG compositions. Biomethane was also considered to be pure CH4. Relevant properties of these gases, considered in Section 3, are summarized in Table 1.

Modelling

Simulations for the determination of the laminar flame speed were performed with the CANTERA solver [22] in Python programming language. A freely propagating flame routine (FPF) in 1D was employed to simulate the laminar flame speed S L of CH4/H2/air premixed flames. In these simulations, pure CH4 was used instead of NG to simplify simulations as the S L of NG is similar to that of CH4 [23]. The USC Mech 2.0 [24] combustion mechanism, consisting of 111 species and 784 reactions, was used to feed the routine. It was developed in the University of Southern California for the combustion of H2/CO/C1−C4 based blends. Furthermore, previous research has found that this mechanism copes well with biogas and hydrogen blends [25,26,27]. Every simulation assumed uniform inlet conditions and a steady state, with an unburned gas temperature of T u = 298   K and atmospheric pressure of p = 1 atm . The domain was set at a size large enough to ensure that boundary effects are negligible.

3. Results and Discussion

The analysis performed here is divided into two sections. In Section 3.1, the impacts of hydrogen and biomethane introduction for gas transmission and distribution are discussed. Material limitations of critical network components are discussed as well as energetic aspects of the introduction of renewable gases. Operational differences caused by the distributed nature of hydrogen and biomethane production are also addressed. Section 3.2 analyses the impact of a changing gas market structure on gas consumption. The adequacy of existing interchangeability criteria to this reality is assessed and a detailed interchangeability analysis for domestic appliances is performed.

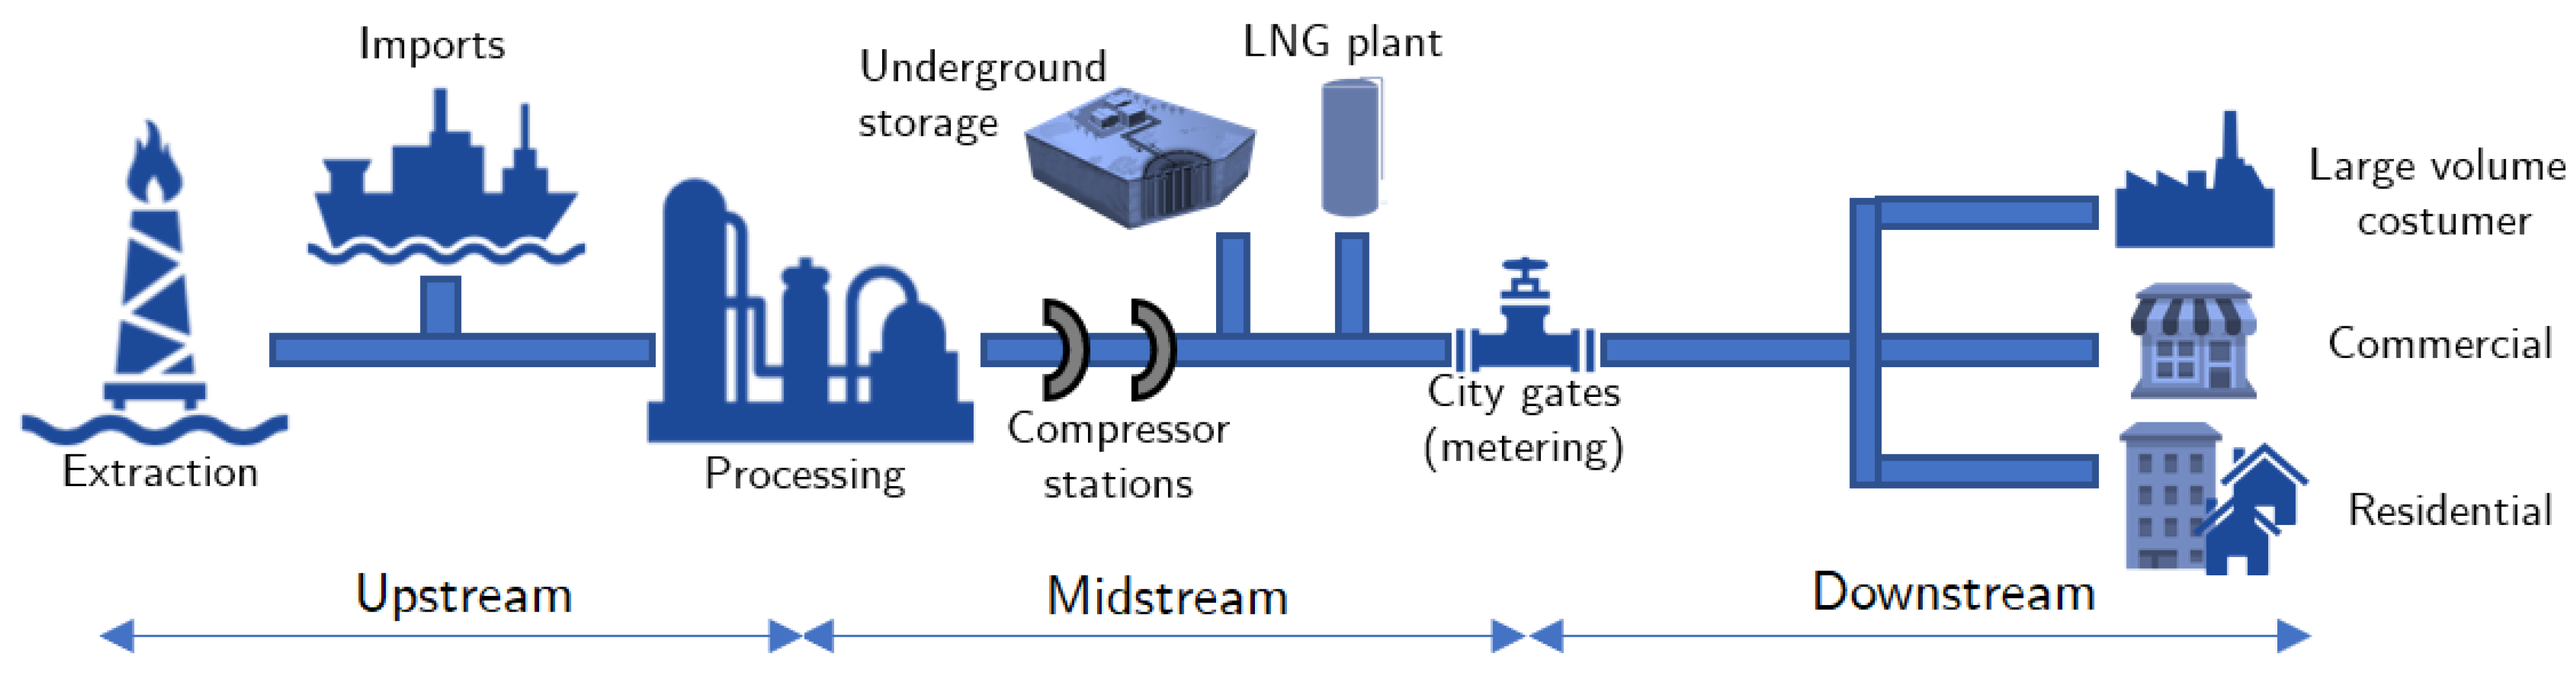
3.1. Transmission and Distribution

3.1.1. Material Aspects

Gas transmission lines connect the gas source (refinery, LNG terminal, etc.) with the distribution mains. There are two main components in gas transmission: the pipeline itself and compression stations.
Transmission lines are mainly built with steel, which can be prone to hydrogen embrittlement if hydrogen appears in high concentrations. Even though carbon steel or stainless steel have been used for hydrogen pipelines, the issue with transmission mains is that hydrogen is transported at high pressures (> 40 bar). This may require a case by case evaluation to assess the amount of hydrogen that can be blended with NG without risking security, depending on the pipeline age and steel type or finishing used [15,28]. To resolve this issue, the use of new composite-based materials when it comes to long distance pipelines has been suggested [29]. Nevertheless, a 30% hydrogen volume content is generally safe for most cases [17].
The connection between transmission lines operated at higher pressures and distribution mains is made with pressure reduction stations where gas is expanded. With natural gas, this expansion causes a temperature decrease due to the Joule–Thompson effect, which requires NG to be pre-heated before expansion to avoid hydrate formation. The rate of temperature change with pressure, for a given gas, is given by the Joule–Thompson coefficient ( μ J T ), typically expressed in ° C / bar or K / bar :
μ J T = T p H = V C p ( α T 1 )
where T and p are temperature and pressure, V is the volume, C p is the heat capacity at constant pressure, H is the enthalpy and α is the coefficient of thermal expansion. Whereas for NG and biomethane the Joule–Thompson coefficient is positive at typical pipeline conditions, hydrogen’s is negative. This entails that hydrogen, contrary to biomethane and NG, warms when expanded in pressure reduction stations valves. Thus, hydrogen injection not only does not cause issues in expansion but may also reduce operating costs in pressure reduction stations by requiring less pre-heating [30].
Gas storage is also affected by the presence of hydrogen and biomethane. It is a common NG pipeline management practice to rely on large Underground Storage (UGS) facilities which store gas, then readily available to be supplied when demand peaks. This storage capacity is built on top of linepack, which is higher when the gas flow rate is lower. Usually, UGS is ensured either with salt caverns or aquifers. Whereas biomethane is not a problem for either, hydrogen cannot be stored in aquifers because it reacts in the presence of bacteria to form hydrogen sulphides [31]. In salt caverns, biomethane and hydrogen should be possible to blend with NG up to 100% [32,33] if connecting structures are guarded against steel embrittlement [34]. Several authors have also proposed the use of depleted oil and gas fiels, wherever available, for large-scale hydrogen storage [35,36].
Pressurization in compression stations is usually powered by turbines that run on the fuel transported in the pipeline, which can be a limiting factor to the injection of renewable gases. Gas turbines exhibit a very limited tolerance to changes in fuel feed, particularly with hydrogen blended in natural gas. Manufacturers are conservative in the amount of alternative fuels that can be blended in NG while keeping safety standards. Generally, and considering minor technical adjustments, it is expected that gas turbines may operate with up to 10% (v/v) of H2 blended in NG [37]. The injection of higher H2 quantities depends on the manufacturer, even though there are new models in development that should provide more flexibility in fuel composition, with quantities of up to 30% (v/v) of H2 blended with NG [38]. Nevertheless, even if the gas turbine bottleneck is solved, compression stations have other limitations. The blending of H2 and biomethane with NG significantly reduces the energy density ( kWh / m 3 ) of the fuel, which requires an increase in flow rates to maintain a stable energy supply. There will be a limit to the flow rate increase compression stations will be able to accommodate, which will require replacing equipment at some point. Gondal estimates that current compression stations might accommodate flow rate increases in the order of 20% [39], which would not allow for H2 blending up to 100%. Similar results were presented by Alban, in an evaluation of the impact of hydrogen blending on compressor system design [40]. It was found that a compressor designed for methane can cope with hydrogen admixtures up to 20 vol.% as long as no other restrictions are imposed. However, if operators intend to maintain a constant energy capacity, this limit lowers to around 5%.
Regarding the impact of hydrogen blending on materials, gas distribution systems seem to be the less problematic link in the value chain due to their low operating pressure and extensive use of polyethylene pipes. A relevant issue to consider at the distribution level is leakage. Current systems can ensure minimal NG leakage; however, with the introduction of a high diffusivity, low-density molecules such as H2, the risk increases. This will be more problematic in older systems, where steel or cast iron pipelines may still be in use. For current systems, however, leakage should be manageable as pipelines are mostly built-in polyethene (PE). Even though hydrogen diffusion through PE pipe walls is higher than that of NG, leakage is estimated to be under 0.001% of the total transported volume of gas [41,42]. On top of material pipeline concerns, other elements of distribution mains will have to be tested on a case by case basis, particularly fittings, sealants and connectors. Nevertheless, for low amounts of H2 blended in NG (< 30 % v/v), these are not expected to be a critical aspect [17]. To achieve a full-blown renewable gas distribution system there would be a need to retrofit the existent networks in critical components, which would still carry a significantly lower cost, by at least an order of magnitude, than building new H2/biomethane-tailored networks [11,43]. The impact of H2 blending on flow meters, generally diaphragm flow meters, must also be considered. Jaworski et al. [44] investigated the impact of hydrogen content up to 15% on the durability of diaphragm flow meters. The authors found no significant metrological differences caused by hydrogen presence, which indicates that concentrations up to 15% in volume should cause no issues. However, further studies will be required to evaluate the impact for higher H2 content.
Generally, both in transmission and distribution, biomethane is not expected to cause any issues as its composition is very similar to natural gas, of which the biggest component is CH4. To ensure no significant material impacts on pipelines and pipeline components, it must be guaranteed that no hazardous species such as H2S and H2O are present in the biomethane that is injected into the gas grid.

3.1.2. Energetic Aspects

The energy transported and distributed in pipelines is a result of the volumetric flow rate and calorific value of the gas in the system. The flow rate in a gas pipeline is controlled by the imposed pressure drop; however, if this is maintained, the flow rate will vary with the blend composition [14]. Assuming a steady-state flow and negligible pipeline slope, a flow rate expression can be derived from a momentum balance equation [45]:
Q = k · T s c p s c · D 2.5 · e · ( p 1 2 p 2 2 ) d · Z · T · L · f
where Q is the normal flow rate (Nm3/h), k is a proportionality constant (dimensionless), T s c (K) and p s c (kPa) are the temperature and pressure at standard conditions, D is the pipeline inner diameter (m), e is the pipeline efficiency, p 1 and p 2 are the inlet and outlet pressures (kPa), d is the relative density to air, Z is the gas compressibility, T is the average gas temperature (K), L is the pipeline length (m) and f is the friction factor. If a scenario where the same pipeline is used and the pressure drop is kept as if there were no changes in fuel feed, one can estimate the energy content variation when biomethane and hydrogen are blended with natural gas. Figure 2 exhibits the impact of hydrogen admixture in the pipeline energy flow in the above-mentioned conditions. Two baseline compositions were used: NG, with the composition and characteristics described in Section 2, and CH4, which emulates biomethane or other NG compositions.
To compensate for the loss in flow energy content observed in Figure 2, there is a need to increase the pipeline flow rate in an equivalent proportion. In fact, if no compensation is performed for energy flow losses, the volumetric flow rate in the pipeline will increase by a factor of 3 when compared to a 100% NG flow. Additionally, if the drop in energy flow has to be compensated (by, for instance, a higher pipeline operating pressure), then the volumetric flow rate will be about 3.4 times higher.
The curves shown in Figure 2 demonstrate that hydrogen blending produces losses in energy flow if the pressure drop is the same and pipeline dimensions remain unchanged. However, this would only be possible if there is a reduction in energy demand occurring in tandem with the increase in hydrogen concentration in the pipeline. If the energy demand is maintained, or even increases, the drop shown in Figure 2 will have to be compensated. One way to do this is to increase the pipeline diameter. However, as it is intended to retrofit existing natural gas pipelines to accommodate hydrogen, this would not be a cost-effective option. If pipeline dimensions are not increased, then the pressure drop will necessarily increase as a result of the gas demand. If gravity effects are neglected and a steady state is assumed, the pressure drop d p along a pipeline distance d x can be estimated with Darcy’s Equation [46]:
d p = 0.5 ρ v 2 f D d x
where ρ is the gas mass density (kg/m3), v is the average flow velocity (m/s), f is the friction factor and D is the pipeline diameter (m). Figure 3 shows the impact of hydrogen blending on the pressure drop for a constant gas demand in a pipeline with unchanged dimensions. These results exhibit the expected pressure drop increase if instead of a reduced pipeline energy flow (Figure 2) it remained constant. The curves were computed for both CH4 and NG with the application of Equation (3).
These results show that the impact of H2 blending on the pressure drop can be as high as 53% for the case of NG and 47% for CH4. These maxima are located at around 80% of H2 blending by volume. Even though 80% of H2 in gas pipelines is not to be expected soon, the impact of lower hydrogen concentrations cannot be neglected. For instance, an injection of 20% of H2 by volume, currently being discussed as a possibility in several countries in the medium-term, would cause a pressure drop increase of 11.4% for NG and 10.8% for CH4. These results are in line with other estimates in the literature. Abd et al. [47], in a simulation conducted with Aspen Hysys Version 9, estimated a pressure drop of 5.39% for a 10% H2 content in a 94 km length transmission pipeline. For Transmission System Operators (TSOs), if pipeline dimensions are unchanged, this effect may require a general increase in pipeline operation pressure (which could also worsen hydrogen embrittlement effects) or the addition of new compression stations. For distribution systems operators (DSOs), the increase in pressure drop may be compensated via a pressure increase in distribution mains or, wherever possible, network meshing to increase the number of pressure reduction stations supplying gas to a particular area. However, in cases where networks operate at a significant higher pressure than that required at the delivery points, there may be no need of adjustments to accommodate for a higher pressure drop. A case by case evaluation will be required to assess where interventions will be necessary.
The impact of hydrogen blending effects on energy flow and pressure drop discussed above are not a significant problem when considering the introduction of biomethane, as it presents a similar composition and properties to those of natural gas. However, these impacts rule out the use of biogas (CH4/CO2) in natural gas infrastructure. The presence of high CO2 quantities, which is an inert gas, would significantly reduce the transported energy and cause an increase in pressure drop without directly decarbonising gas systems, as CO2 molecules transported in the pipeline would not displace any natural gas consumption.

3.1.3. Operational Aspects

Similarly to what will happen in gas transmission management, distribution operators will have to adjust gas flow rates to supply a stable energy delivery to consumers, as the energy flow will be reduced when H2 and biomethane are blended with NG [48] (Figure 2). However, the systemic changes caused by the introduction of hydrogen and biomethane will likely produce their greatest impact on DSO operation.
The decentralized nature of hydrogen and biomethane production implies that producers will often be closer to distribution networks than to transport pipelines. Due to this, DSOs will have to manage not only the gas supplied by the TSO, but also the hydrogen and biomethane injected directly into distribution mains. With this model of distributed injection, gas composition will significantly vary along distribution networks, with customers located closer to renewable gas injection sites receiving a different gas composition than that of those located farther away from these sources. A schematic to illustrate this effect is provided in Figure 4.
The variation in composition will produce changes in the gas calorific value, which must be precisely determined for each customer to ensure that billing is fair and complies with regulations. Several countries already have a significant number of biomethane plants injecting into their distribution networks. In the past, a common practice to circumvent this issue was to blend the injected biomethane with propane or LPG in order to bring the gross calorific value (GCV) up to the standard of natural gas. With this approach, even though gas composition is not constant throughout the distribution network, GCV is the same and no significant system modification is required. However, the propane of LPG used in this method is obtained from fossil sources, which hinders the positive environmental impact of biomethane injection in the pipelines. Furthermore, due to the significant difference between the GCV of H2 and natural gas (around 3 times lower), this is not a one size fits all approach, as it can only be employed for biomethane injection sites. Therefore, in a distributed injection-based system, DSOs will require gas quality tracking methods to determine the GCV of the gas supplied to each customer. Abeysekera et al. [49], with a steady-state simulation of a low-pressure gas network with distributed injection of hydrogen and biomethane, showed that this approach can be used for this purpose. In the near future, DSOs will likely require similar gas quality tracking systems to support network management and ensure fair billing for consumers.

3.2. Consumption

A significant challenge in the regulation forefront is that, so far, it has been specifically tailored to natural gas. This has impacted the entire value chain since regulation on gas composition set the standard not only for distribution but also for consumption, which affects equipment design. In most cases, national or regional legislation has determined the acceptable gas composition in networks considering the NG blend of what was commercialized at the time the norms were drafted. Generally, norms on gas composition are based on three gas families, of which the second family corresponds to natural gases. Even though this approach is convenient if the market structure does not change significantly, it becomes an issue when we face a scenario of gradual transition towards a green gas grid. By blending hydrogen and biomethane with natural gas, the obtained blends gradually fall out of the scope of the second gas family, but not to the point where it lies within the scope of the other two. By not falling inside any of these legal boundaries, and since equipment has been designed by this principle, it is clear that the current regulatory framework will have to adapt to this new reality. However, considering current limitations, it is possible to estimate to what extent the current regulatory framework can respond to this reality, which will be crucial in the first phase.
On top of determining acceptable intervals for the chemical composition of NG blends, the regulation also relies on interchangeability parameters. Typically, two characteristics are used for this purpose: specific gravity ( S G ) and the Wobbe index ( W I ). If the two parameters are within acceptable intervals for a determined blend, it is usually considered that the blend is adequate for natural gas distribution [50,51]. S G refers to the gas relative density to air and can be calculated through Equation (4):
S G = M m i x M a i r = χ i M i M a i r
where M i and χ i are the molar weight and molar fraction, respectively, of species i in the gas blend. The Wobbe index is the most common measurement for gas interchangeability. It is proportional to the thermal input to an appliance, which is a crucial aspect of performance. The W I is defined as the ratio between the higher heating value ( H H V ) and the square root of the specific gravity ( S G ), as described in Equation (5):
W I = H H V b l e n d S G b l e n d = χ i H H V i S G b l e n d
Across the world, both S G and W I have served to evaluate, from a regulatory standpoint, the suitability of NG blends for grid injection. The EU standard EN 437:2003+A1 aims to harmonize test gases in the European single market and thoroughly relies on S G and W I [52]. For the second gas family (the first family defines city gas and the third family encompasses gases derived from oil such as LPG), which encompasses natural gas, these parameters are used to define the following boundaries for any gas blend: 0.433 S G 0.684 and 39.1 MJ / m 3 W I 54.7 MJ / m 3 . These are defined for dry gas at p = 1 atm and T = 15 ° C . By looking at these boundaries, and considering the gas properties exposed in Table 1, it is clear that pure CH4 complies with them. However, in this regulatory framework, we must assess the point of hydrogen and/or biomethane blending that would require new norms. Therefore, for the blends described in Section 2, both the S G and W I were calculated and plotted against current regulatory limitations. The results are exhibited in Figure 5 and Figure 6.
An analysis of Figure 5 demonstrates that in light of current limitations, hydrogen concentration is limited by the lower S G limit. The higher density of NG, when compared to CH4, provides a higher limit for H2 blending. However, if biomethane and hydrogen injection are combined in a determined network, the lower S G threshold can appear at significantly lower H2 contents.
The results from Figure 6 indicate that both CH4 and NG, regardless of the hydrogen blended, can comply with current W I limits. This is an important takeaway, as if W I is below a certain level it can not be guaranteed that consumers will receive an energy input within the contracted limits set with their suppliers [53]. However, the use of S G and W I as interchangeability criteria fail to consider other important characteristics for equipment operation that can change significantly through H2 blending.
The lack of steady gas properties and adequate interchangeability criteria may make consumption the most significant bottleneck for the path towards a greener gas grid. Currently, NG is consumed in equipment and/or appliances specifically tailored to operate with NG, often with low tolerance for changes in fuel feed. Furthermore, whereas transmission and distribution are centralized areas of the value chain, where pipeline management is performed by a handful of companies, consumption occurs in a decentralized manner. This decentralization implies not only the use of varied conversion devices, but also a great number of separated consumers with different characteristics (residential, commercial or industrial). The problem with equipment not prepared to operate with H2 blended in NG is two-fold. On the one hand, the presence of molecules not usually found on NG may have a non-negligible negative impact on materials. Hydrogen embrittlement, particularly in steel tanks used in mobility applications, may be critical, as these are typically limited to 2 vol.% [16,54]. This problem will mostly likely require the retrofitting of some technologies to increase the tolerance for renewable gases. On the other hand, H2 and biomethane will also change the nature of energy conversion occurring in appliances, particularly combustion processes. To this end, interchangeability criteria such as the Wobbe index have been widely used previously. However, their scope is limited when dealing with blends that can significantly change composition, such as those addressed in this paper. Several devices, such as engines, cookers or water heaters, will suffer from interchangeability issues. The W I fails to provide information on the methane number (MN), which indicates the fuel knock resistance. The higher the MN, the higher the knock resistance of the fuel is expected to be. Methane presents an MN = 100, while the blending of H2 can significantly lower this value. Thus, the presence of renewable gases, particularly hydrogen, can significantly affect engine performance, mostly through an impact on engine knocking. This can negatively affect go-generation plants and transport applications. Furthermore, a temperature increase resulting from hydrogen blending can also cause higher NOx emissions in these sectors [55]. On the other hand, it has been reported that H2 may increase engine fuel economy by improving thermal output [56]. The combined adoption of biomethane can mitigate the negative effects in NOx emissions and engine knocking caused by H2 blending. However, this beneficial impact is limited if H2 content is higher than 5%. Therefore, engine performance will necessarily have to be evaluated depending on equipment and H2 blending proportion with NG.
Domestic appliances, such as water heaters and cookers, have the potential to be a major bottleneck for the decarbonization of gas grids. The decentralized nature of domestic gas consumption originates a unique obstacle in this process, as convenience for the customer is of the utmost importance. If the introduction of renewable gases in the gas grid is not safe and a hassle for the consumer, it may shift towards non-gas alternatives powered with electricity. Because of this, it has been suggested that burner heads that can run on an entire range of blends of NG with renewable fuels must be employed, to face the new scenario of a changing market structure [57]. However, given the existing equipment, it is necessary to assess which blend compositions would be tolerable with no or minimal modifications to in-operation domestic appliances.
Gas blends are interchangeable if they can replace each other while maintaining operation performance without the requirement of significant appliance modifications. Thus, to evaluate the degree to which hydrogen can be blended with NG and biomethane while ensuring adequate domestic device performance, an interchangeability analysis is required. For this purpose, an appliance will be considered to be performing adequately if it can fulfil its fundamental purpose in a convenient way for the consumer while maintaining safety standards. Nevertheless, as devices vary in type and design, changes in performance are not necessarily symmetrical for every case. Essentially, to ensure safe operability, it is necessary to maintain the combustion process within its stability limits. Otherwise, flames anchored in burner heads may suffer from blow-off (process in which the flame lifts off the burner to a point it extinguishes) or flashback (process in which the flame propagates into the fuel and air feed channel) phenomena. Domestic appliances, typically based on the Bunsen burner concept, are designed to attain the maximum operating window possible. This equates to higher flexibility both in eventual fuel feed changes and equipment turnover [58].
Most burners in domestic appliances behave similarly to Bunsen tubes, in the sense that they use a Venturi construction in which fuel jet momentum draws air into the burner [59]. Then, air and fuel mix before reaching the burner head where flames anchor. Due to this, the burner’s geometry is designed to maintain a fairly constant air–fuel ratio (or equivalence ratio, ϕ ), which is the most important parameter in determining flame behaviour [60]. Regarding stability limits, the equivalence ratio’s most important impact is on burning velocity S L , which is the critical property for burner design. A higher burning velocity requires a higher flow velocity and vice versa. According to Glassman, empirical evidence indicates that the average flow velocity u a v g must meet the 2 S L < u a v g < 5 S L criteria [61]. Furthermore, the limitation of flashback and blowoff must be accounted for, while ensuring that the flow is kept laminar ( R e = u a v g · d / ν < 2000 ). If these criteria are used to determine a tube diameter (d) that provides maximum flexibility for natural gas, we obtained a result of around 1 cm, as determined by Glassman in a u a v g vs. d diagram [61]. In the interchangeability analysis performed in the following section, Glassman’s approach is used as a baseline to evaluate the effect of blending H2 with CH4.

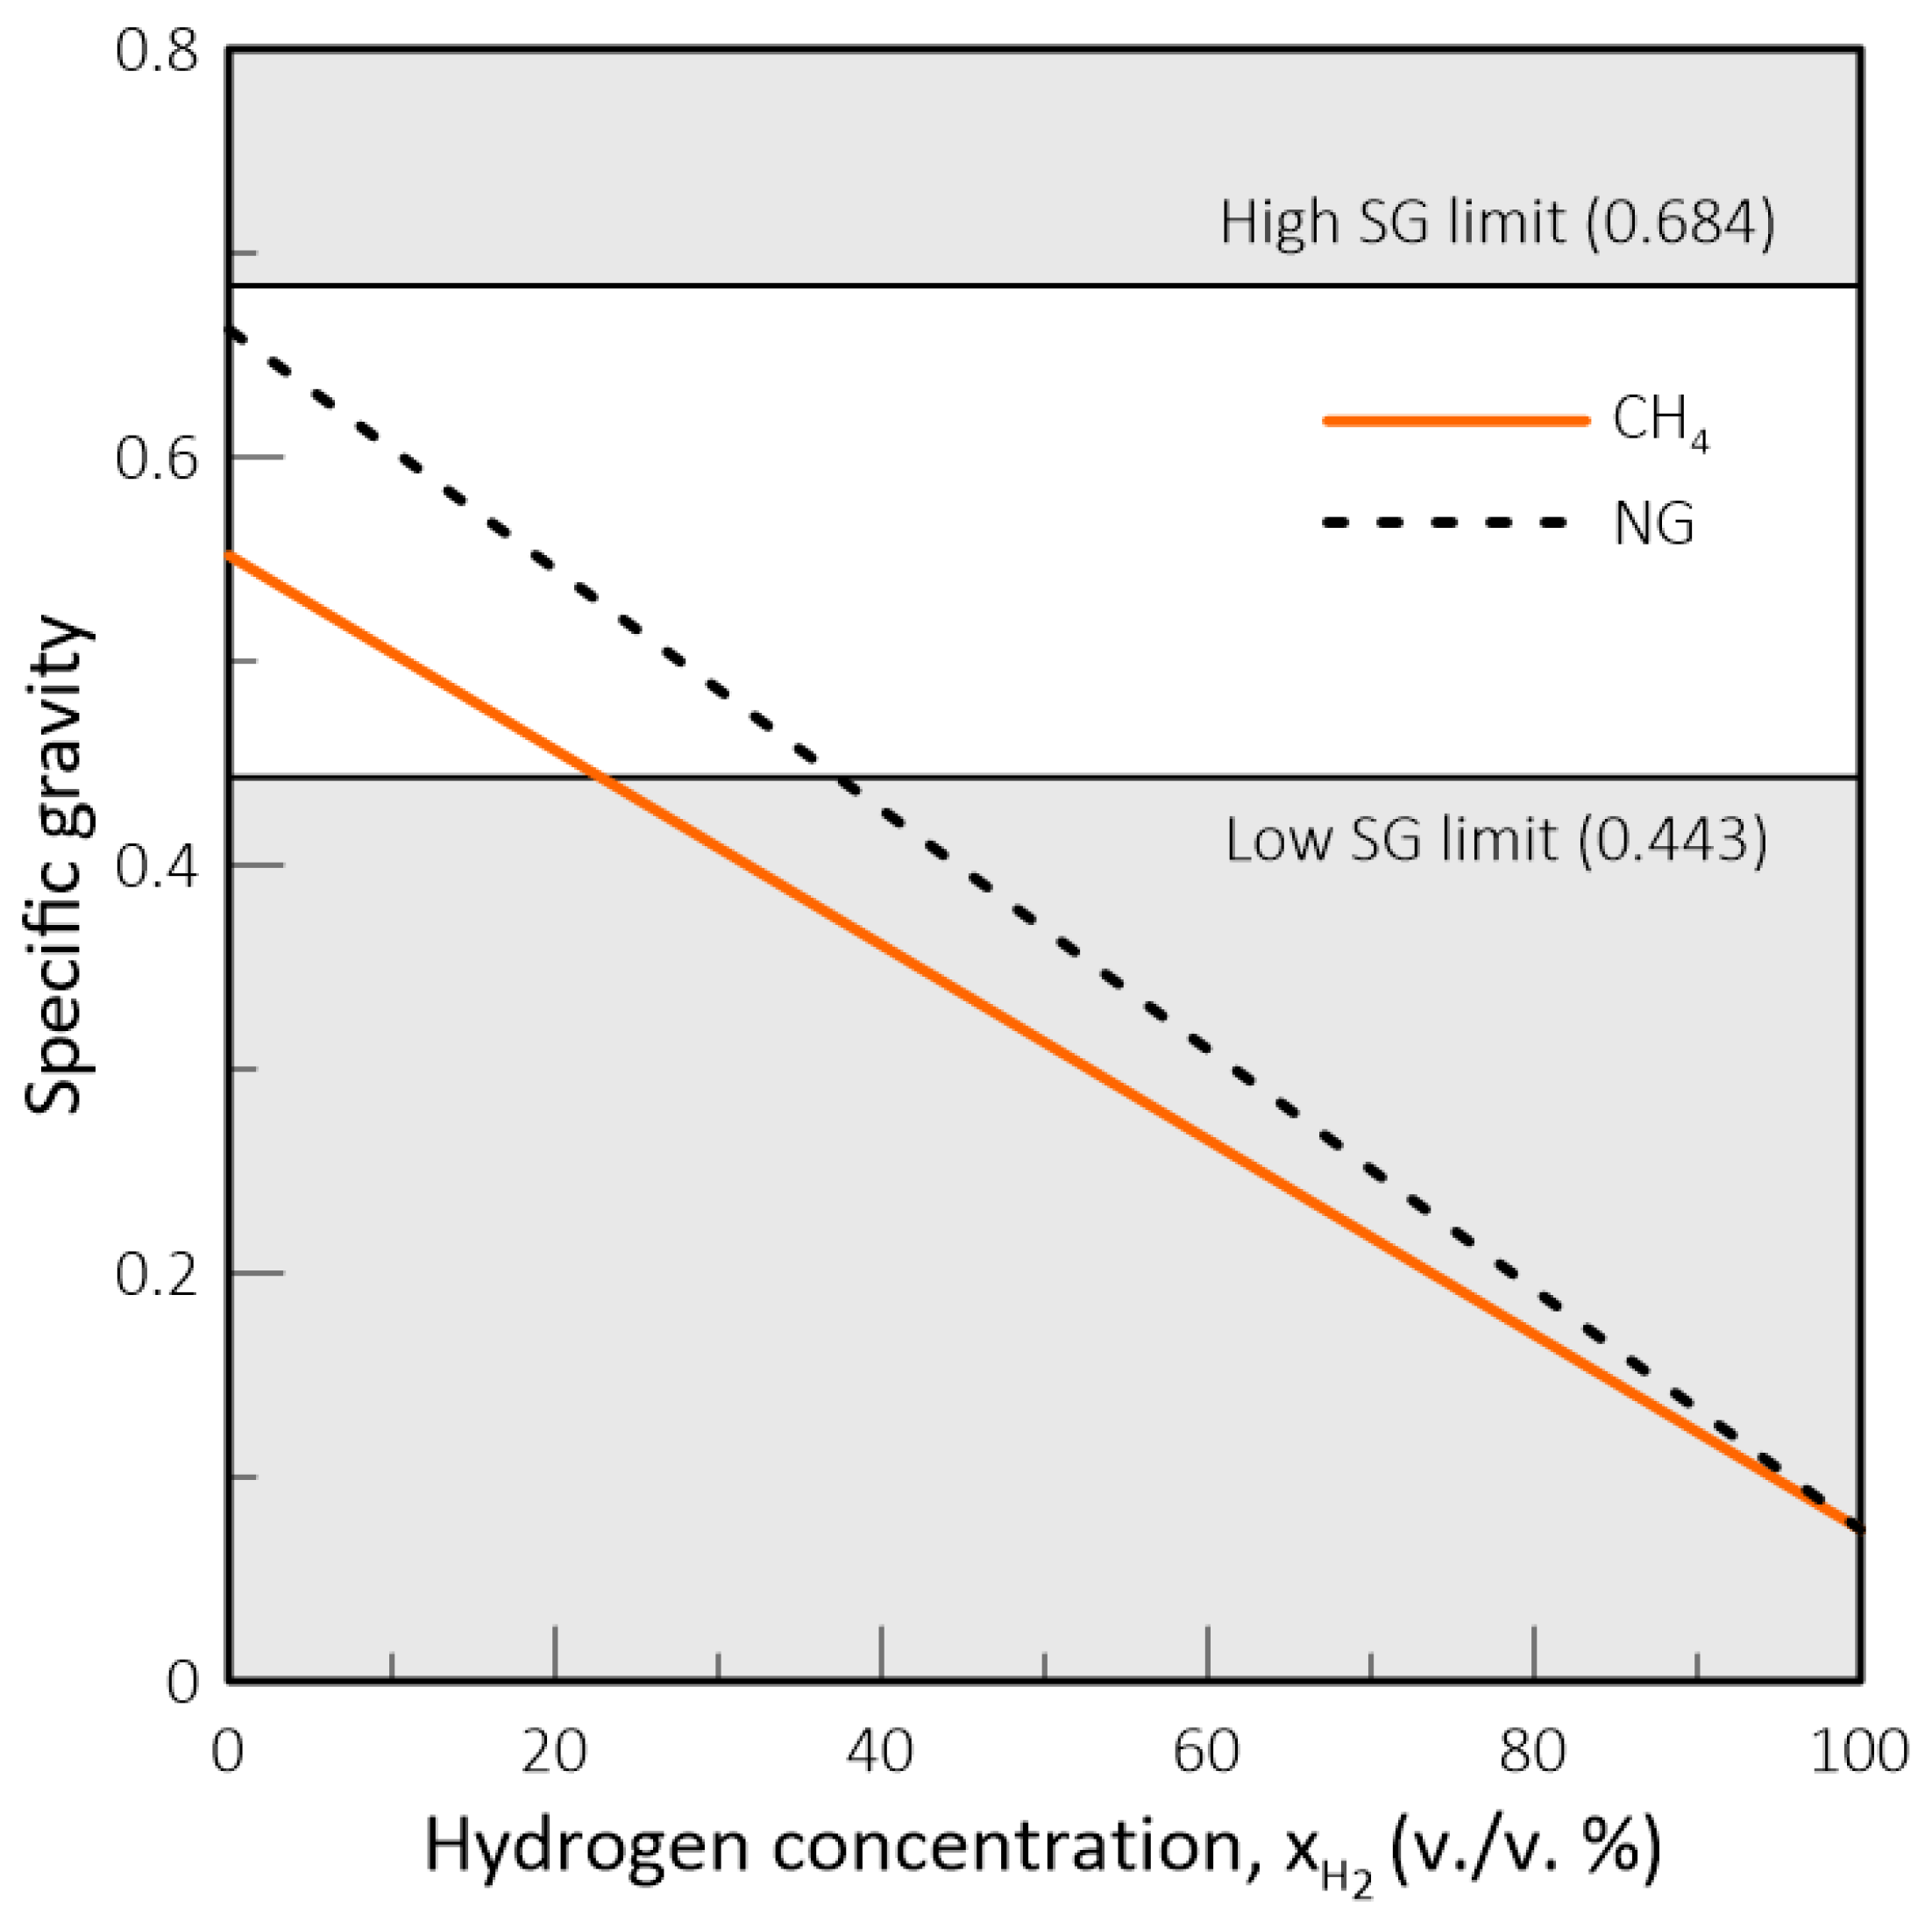
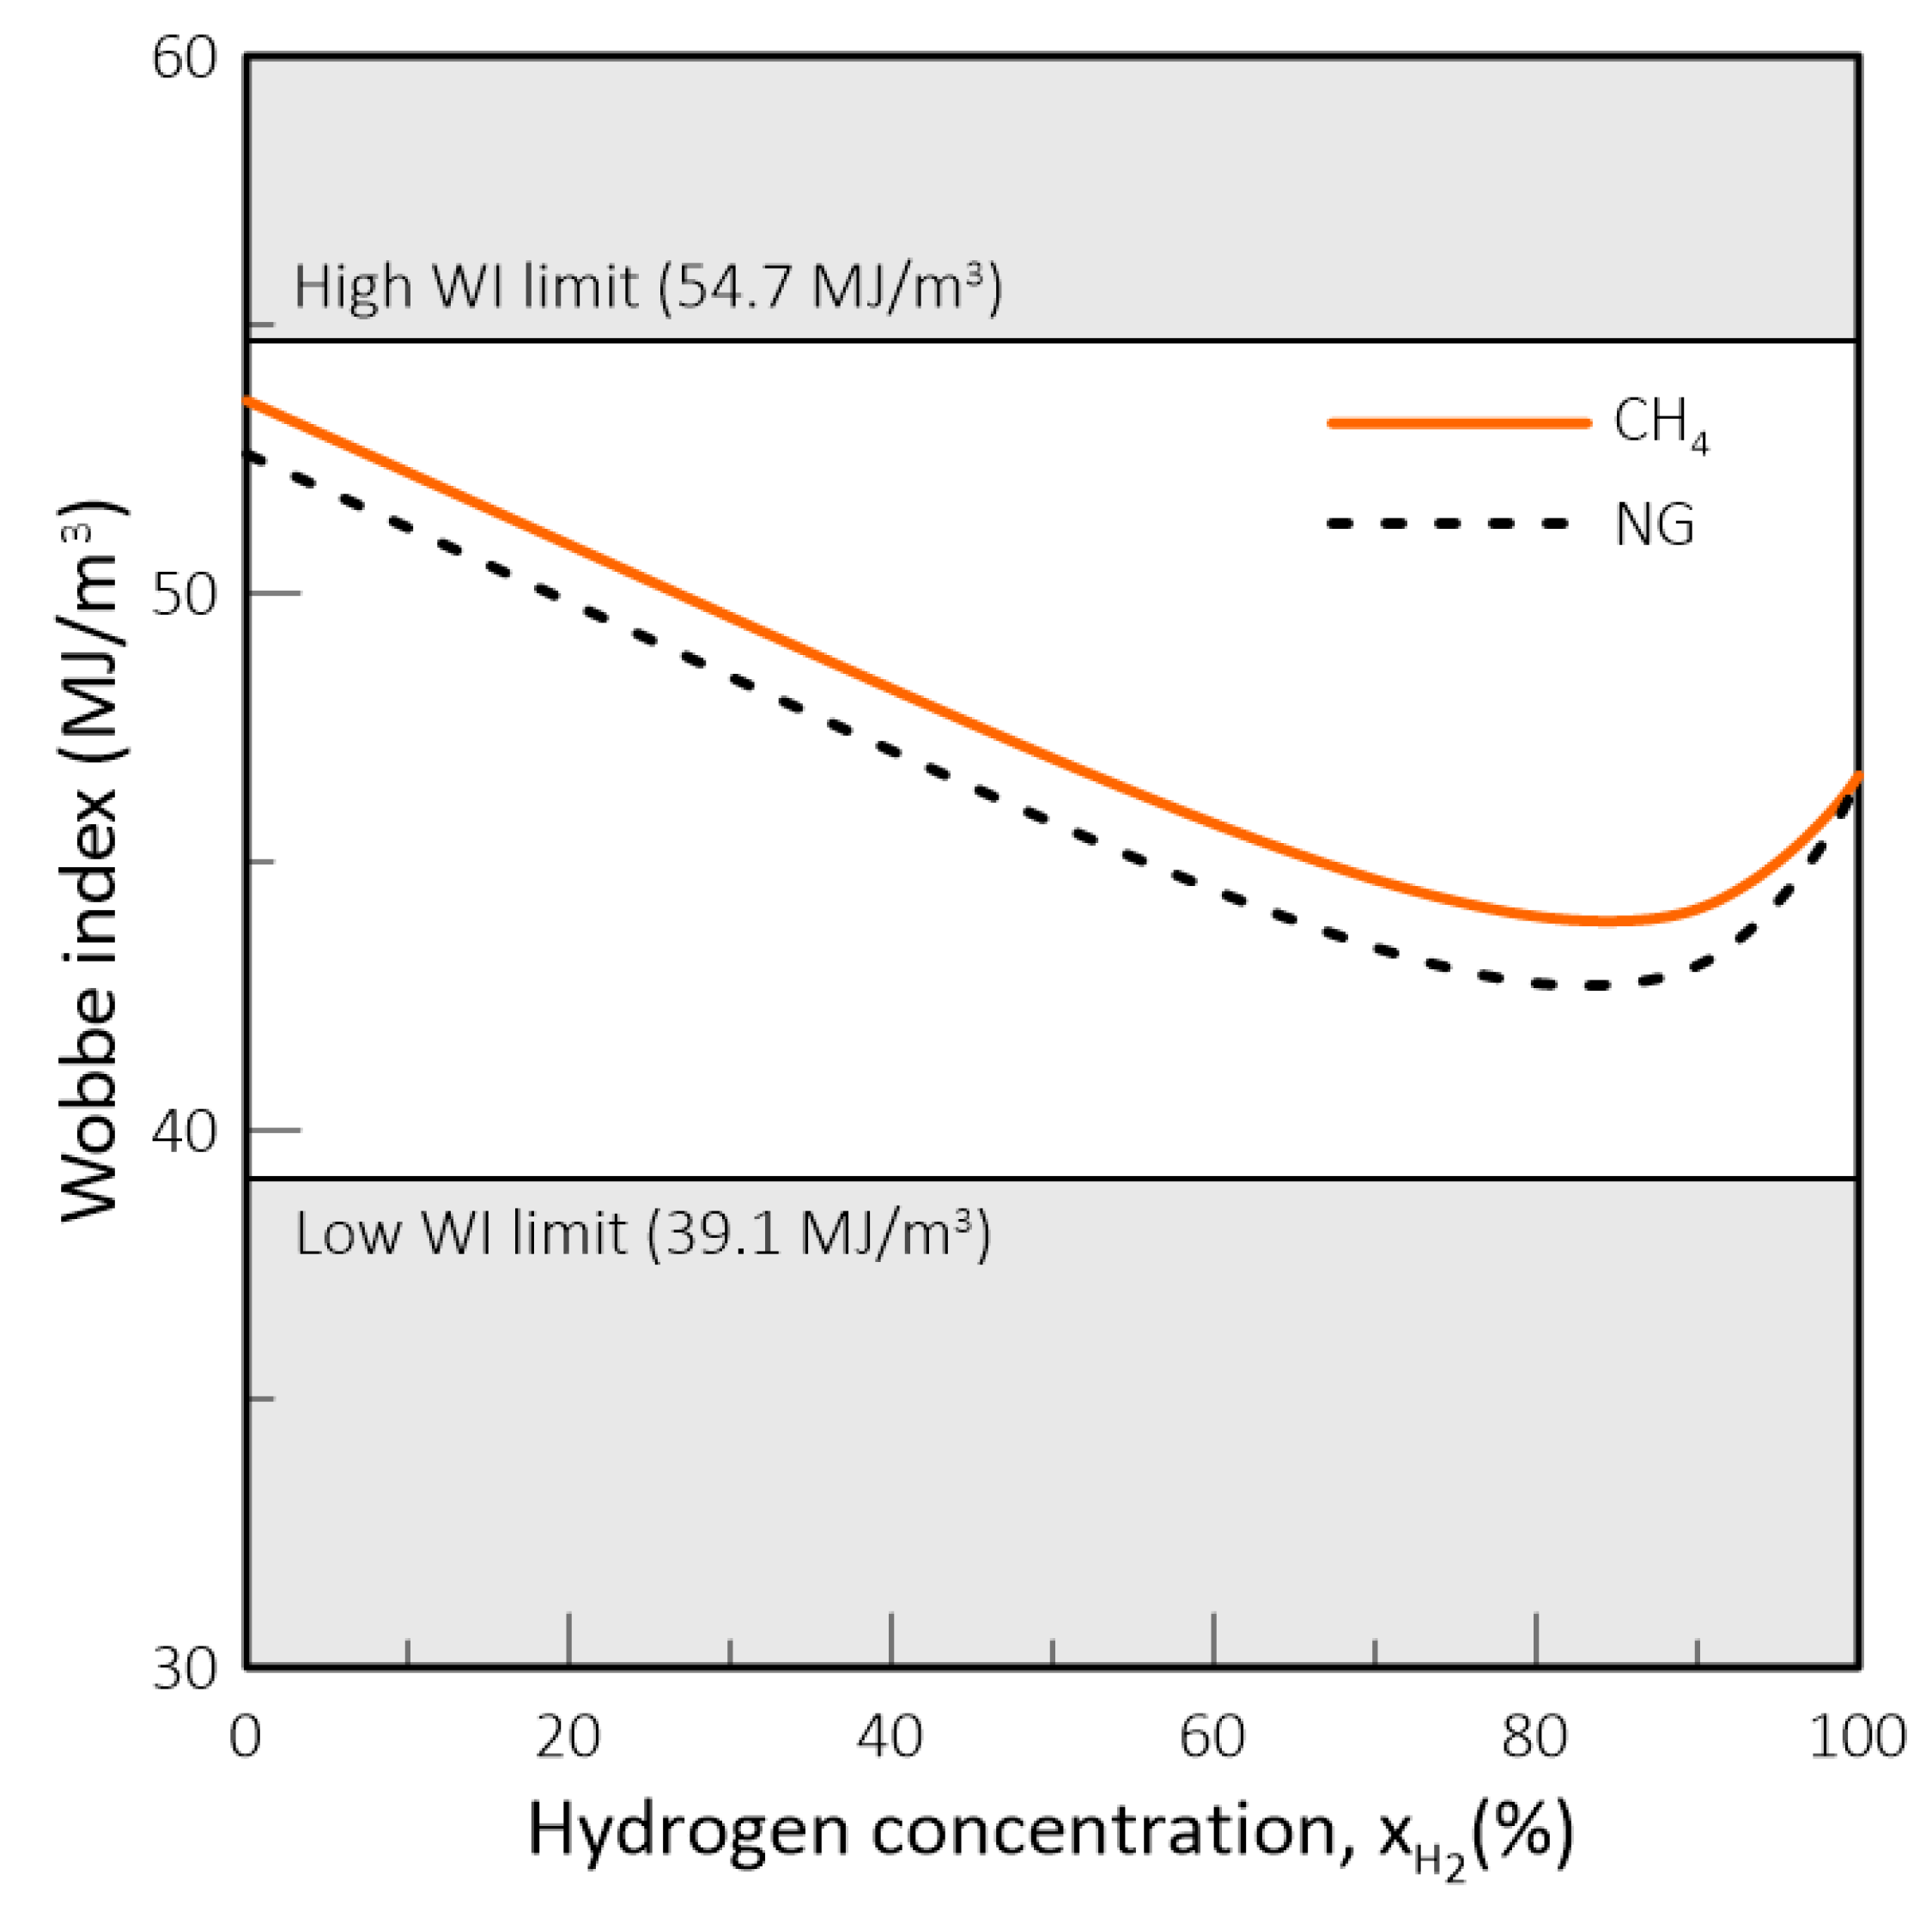
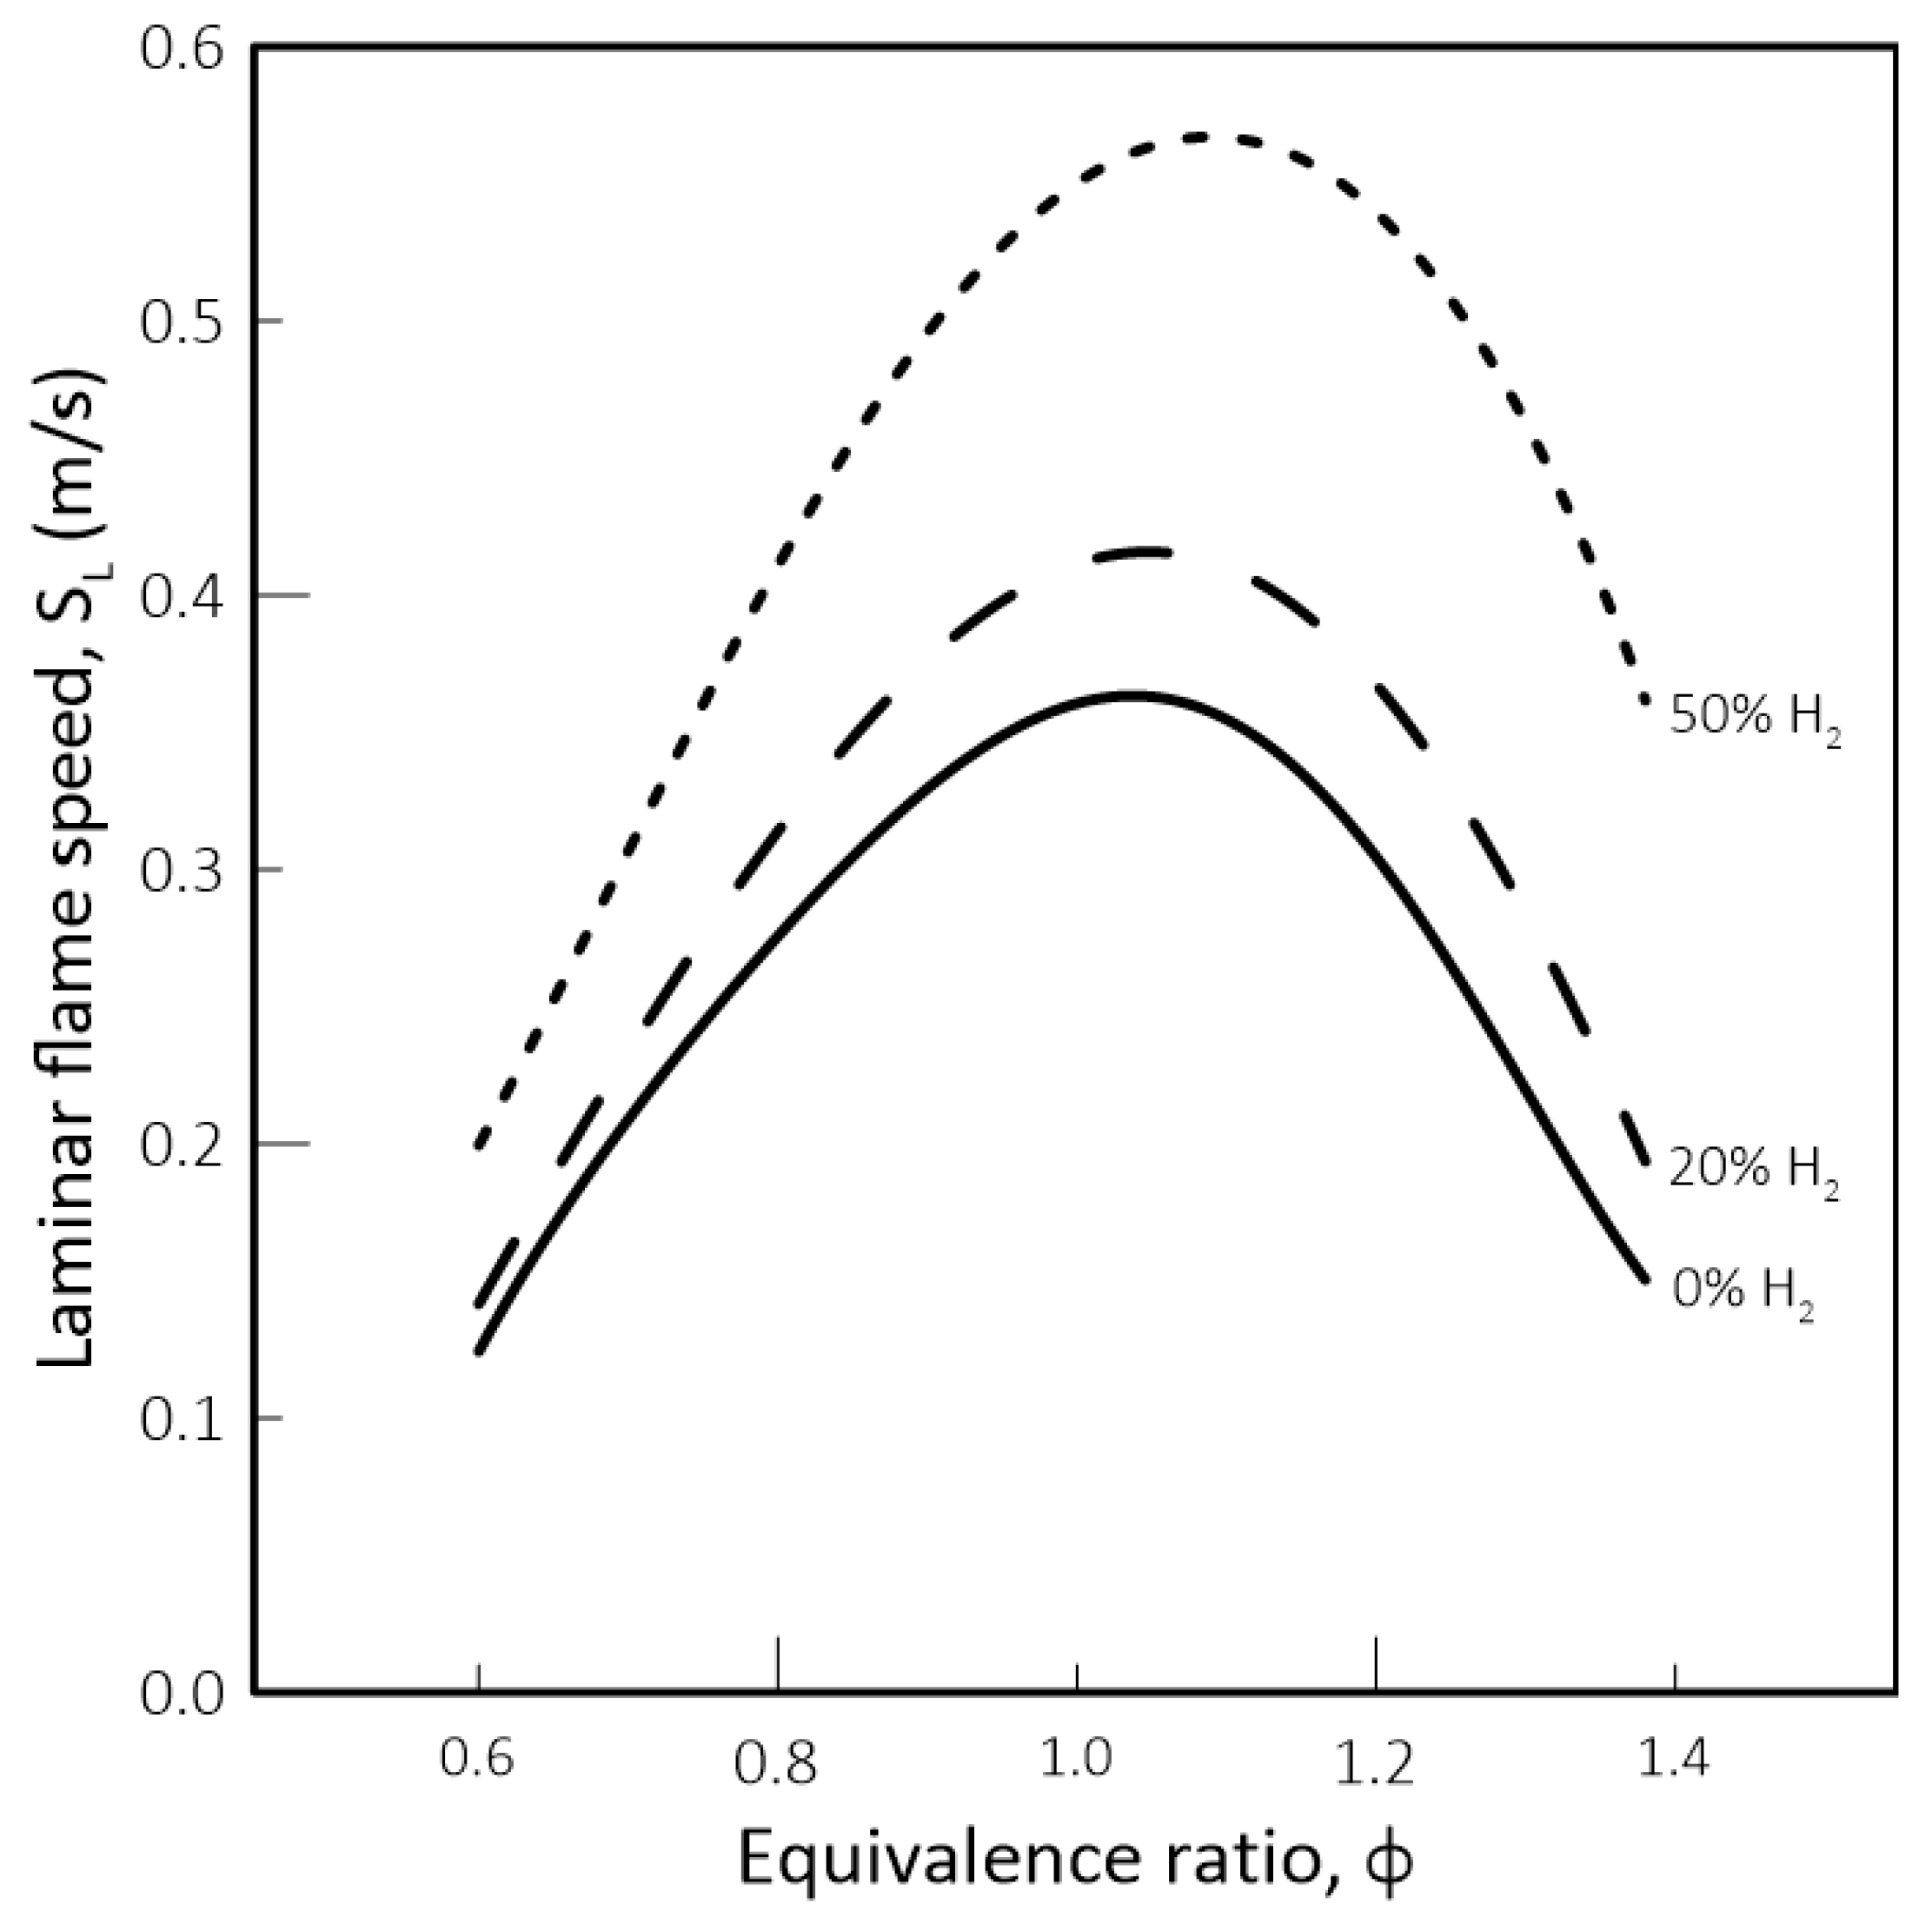
Interchangeability Analysis

As stated above, the critical property in burner design is the burning velocity or laminar flame speed. Thus, numerical simulations were performed to quantify the burning velocity of NG/biomethane flames blended with hydrogen. NG was approximated as CH4, leading to CH4/H2/air flames. Every simulation was performed considering atmospheric pressure and an unburned gas temperature T u = 298   K . To the base CH4 blend, three levels of H2 blending on a volume basis were added ( x H 2 ( % ) = 0 ,   20 ,   50 ). The results are displayed in Figure 7.
These results demonstrate that the effect of H2 blending in S L can be very significant, as well as non-linear with the amount blended. The curves attained from the simulations show that the S L increase for a blending of up to 20% is much milder than that verified when x H 2 is raised to 50%. This effect is observed regardless of the baseline blend used. Therefore, whereas small amounts of hydrogen blending (< 20 % v/v) have an effect on S L that is possible to manage, going further than that may require an overhaul of existing domestic appliances.
Typically, domestic appliances operate under fuel-rich conditions, at about ϕ = 1.25 , which is obtained from a burner geometry that leads to the highest flexibility for natural gas. As stated earlier, these devices use a venturi construction where air is drawn into a tube due to the fuel jet momentum. At a constant supply pressure, established by the gas distribution operator, the air drawn into the burner will remain fairly constant [50]. Naturally, if the properties of the injected fuel blend change, the nature of the combustion process will change as well. For different blends, gas properties will vary, as well as the air required for complete reaction. Thus, a change in fuel will produce a change in the reaction equivalence ratio, which can be calculated with Equation (6) [62]:
Δ ϕ = ϕ 2 ϕ 1 = ϕ 1 × L d V 2 L d V 1 · d 1 d 2 1
where ϕ i is the equivalence ratio for fuel blend i, L d V i is the stoichiometric air requirement for fuel blend i and d i are the relative density of the fuel blend i. Considering a baseline ϕ of 1.25 , for the standard scenario of a fuel blend of pure CH4, the implication of H2 blending on the equivalence ratio is presented in Table 2.
The results obtained show that, when evaluating gas interchangeability and effects on burning velocity, not only the impact of the fuel blend must be considered, but also the impact on reaction stoichiometry. Combining the results of Table 2 with the S L simulations exhibited in Figure 7, one can evaluate the impact of these changes in blend composition in domestic appliance flame stability. To employ Glassman’s approach, on top of what is mentioned above, we must consider the blowoff and flashback gradient ( g B , g F ) curves [61]. These are a function of the tube diameter d and the average flow velocity u a v g , and are given by Equation (7) [63]:
g B , g F = 8 · u a v g d
By plotting these curves for the blends of Table 2, and combining them with the requirements of laminar flow and 2 S L < u a v g < 5 S L , we obtain the following stability diagram, displayed in Figure 8:
The highlighted area with vertical lines in Figure 8 corresponds to the appliance design area for CH4. By Glassman’s hypothesis, the geometry that provides the maximum flow rate range without causing flame stability issues is at d = 1 cm . By considering the possibility of using the blends specified in Table 2, we reduced this design area. The new design area is filled with a chequered pattern. These results show that for the geometry that maximizes flexibility, the introduction of the new blends produces a loss of around 30% in the design area. For existing equipment, this would mean that some may have to see its turnover reduced since the range of admitted flow rates will be smaller. The risk with the introduction of these new blends lays not with blowout phenomena, but rather with flame flashback. As seen in Figure 8, the introduction of hydrogen does not tamper with the original blowoff limitations, where the limiting factor remains the 100% CH4 blend. Since problems arise with flashback, it means that devices which operate in the lower end of the design area may not be able to operate with low flow rates. However, the 30% loss in the design area is not critical, and most domestic devices currently in operation should be able to cope with hydrogen blending up to 20% without any issues. These results are in line with the conclusions of the THyGA project, which concluded that the first occurrences of flashback should only occur when H2 content reaches 20 vol.% [9,10].

4. Conclusions

In the near future, hydrogen and biomethane will be blended with natural gas and distributed in the current infrastructure in several countries. For this reason, a holistic understanding of the impacts of this in the entire natural gas value chain is paramount.
In this work, we provide an overview of the impacts of hydrogen and biomethane introduction on natural gas infrastructure and equipment considering energetic, material and operational aspects. The impact on transmission (TSO) and distribution (DSO) system operators is presented and discussed. An analysis of the suitability of existing gas interchangeability criteria was performed and an interchangeability analysis for domestic appliances based on 1-D numerical simulations of laminar flame speed was conducted. The main findings are summarized below:
  • The introduction of renewable gases in gas pipelines, particularly hydrogen, will produce a significant increase in volumetric flow rate due to their lower heating values ( kWh / m 3 ). Thus, compression stations and pressure reduction stations will have to be adapted to accommodate the expected flow rate increase. Furthermore, for hydrogen concentrations above 30%, steel pipelines may suffer from hydrogen embrittlement. For distribution networks, sections built in cast iron and steel will likely have to be replaced by polyethylene to reduce H2 leakage when hydrogen admixture is above 30% by volume.
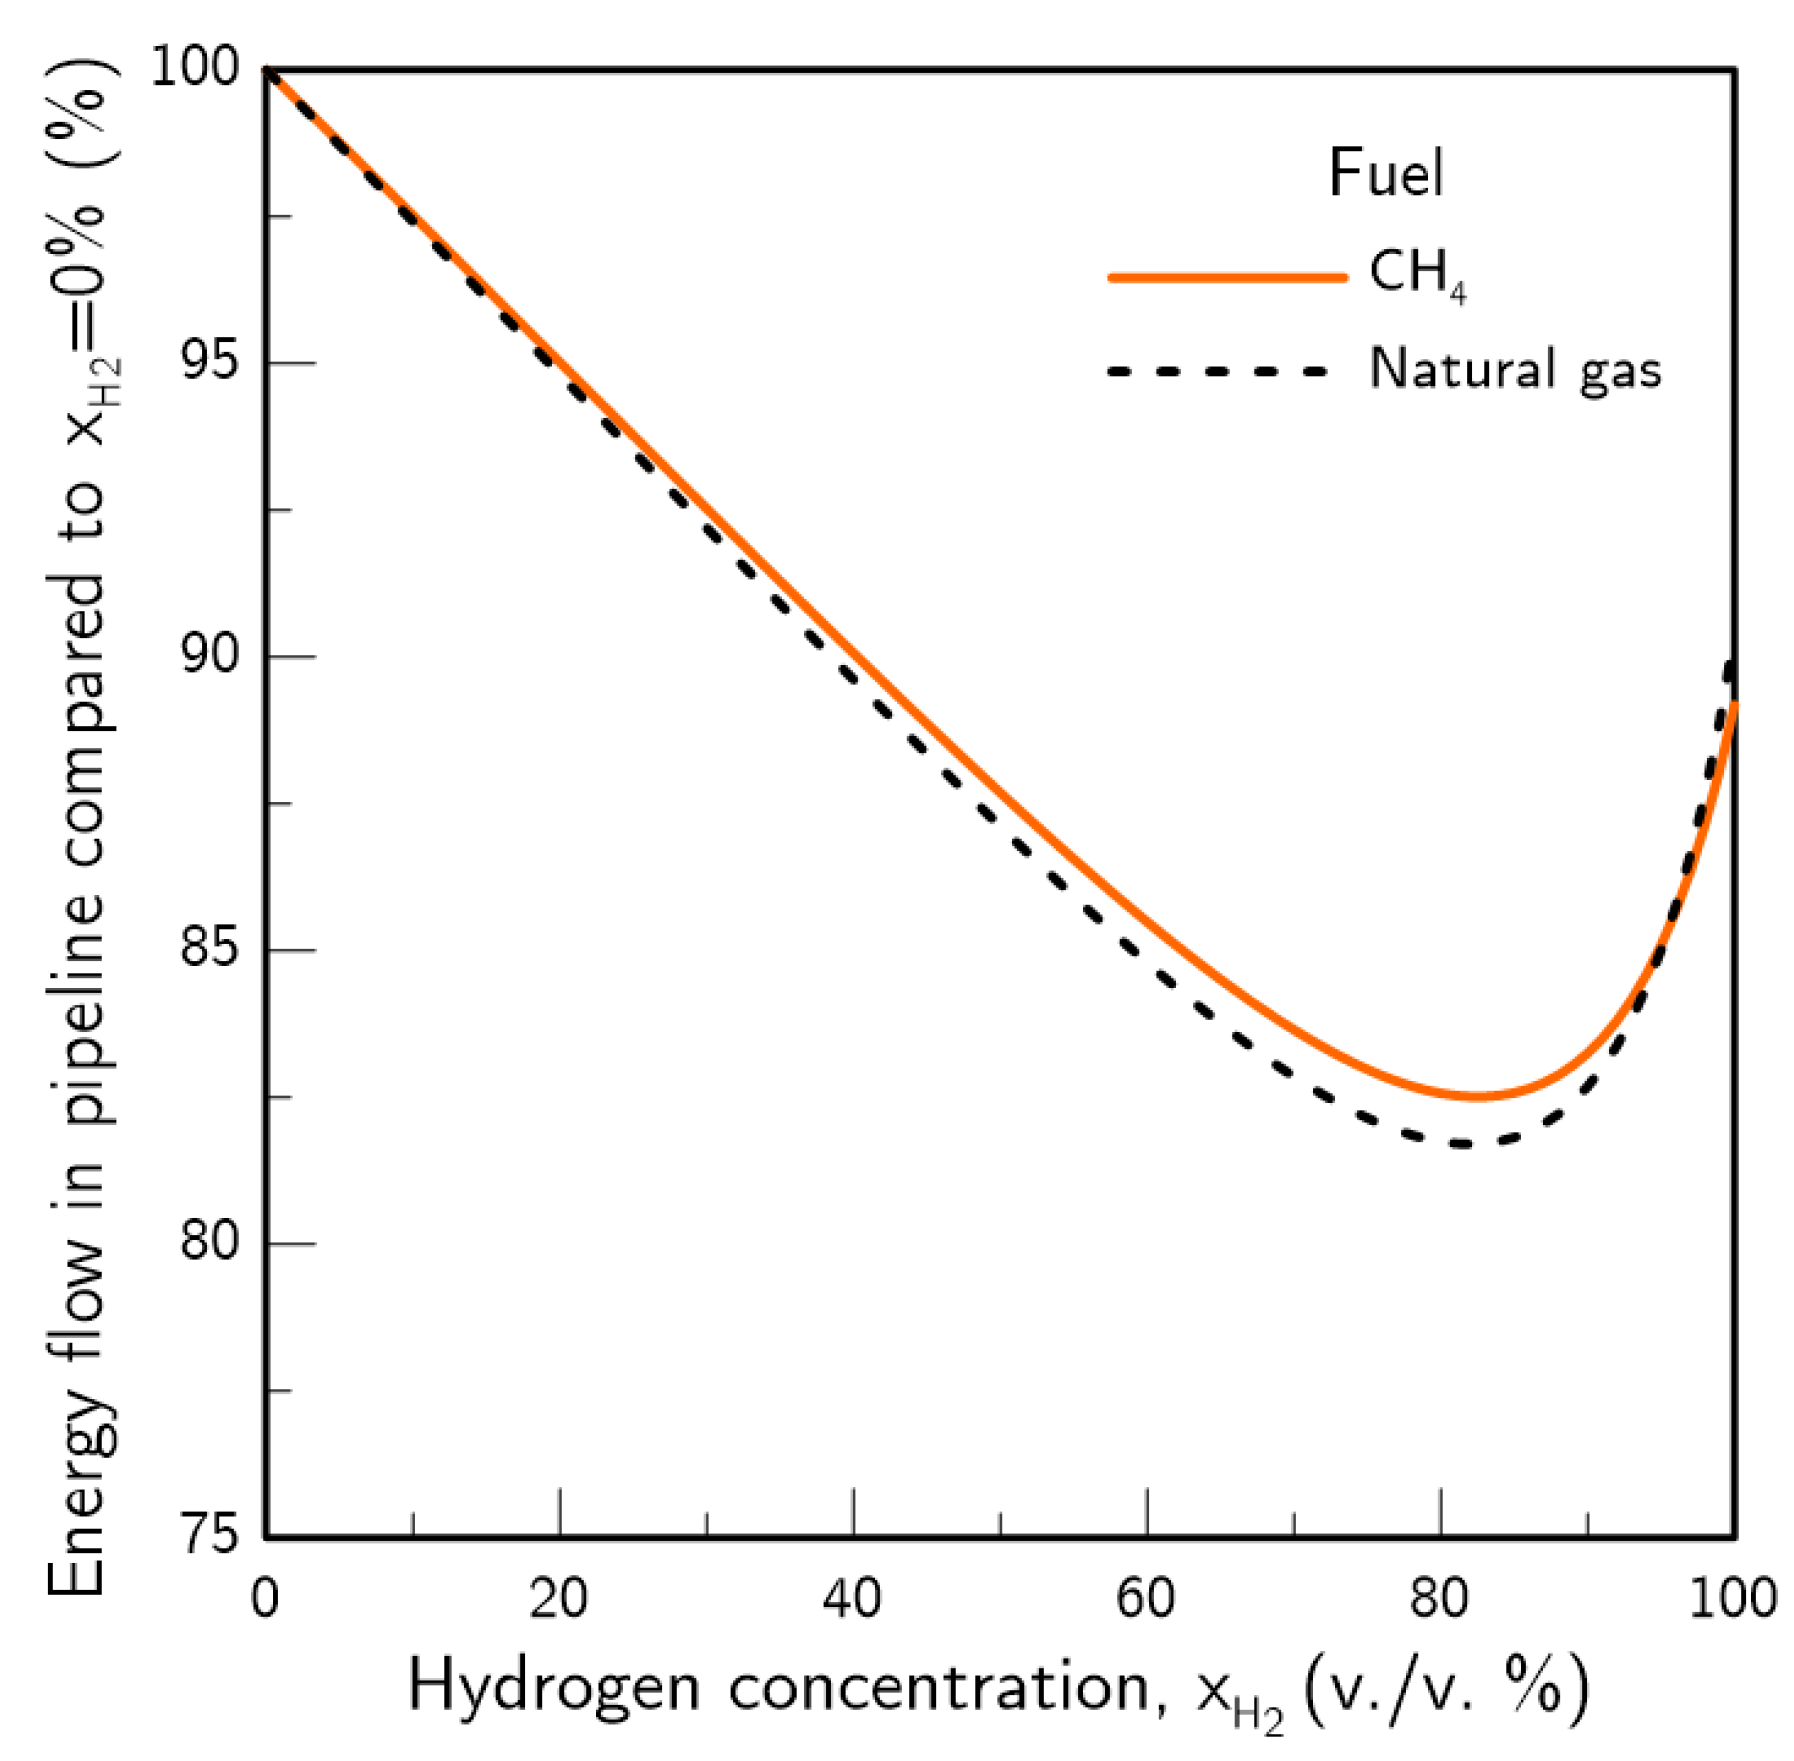
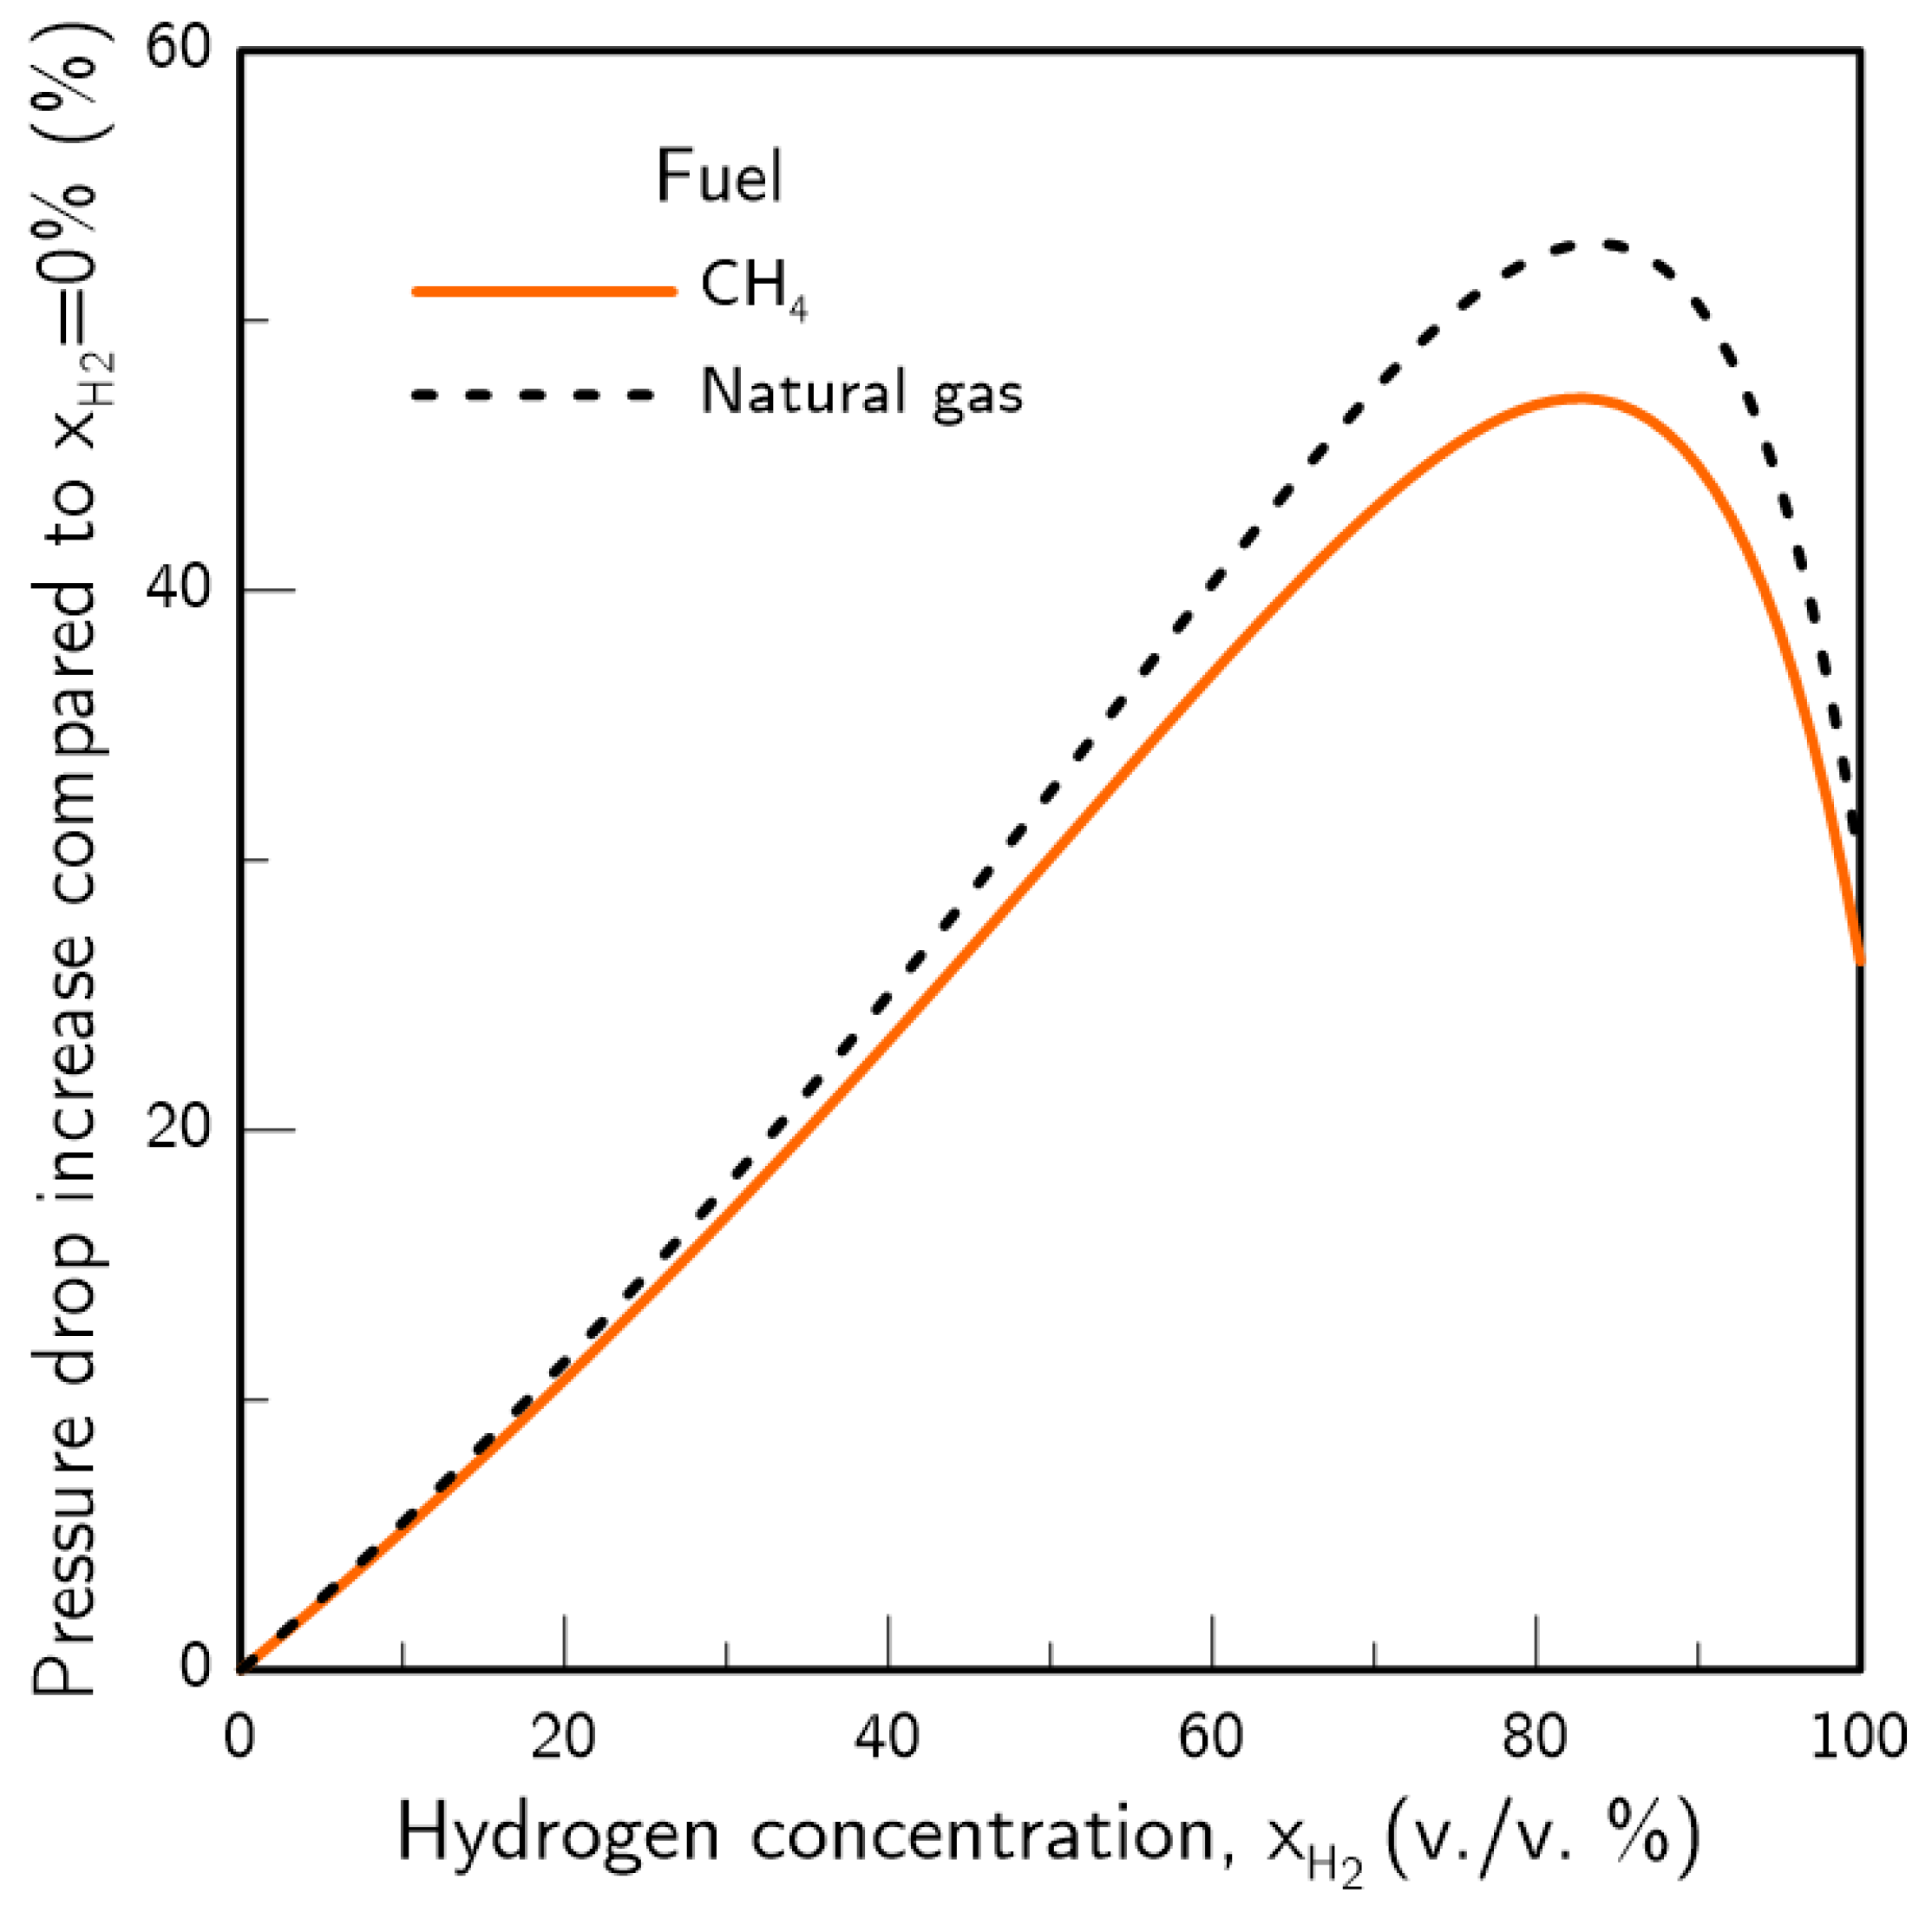
  • If pipeline dimensions and pressure drop are maintained, the introduction of hydrogen will reduce the amount of energy transported in the system. A shift towards a grid with 100% hydrogen would produce an estimated loss of 10% in the transported energy. If energy demand and pipeline dimensions are maintained, an increase in pipeline pressure drop will occur, which will be around 11% for a 20% H2 content in the pipeline. For TSOs, this may force an increase in pipeline operating pressure or additional compression stations. For DSOs, the increase in pressure drop may be compensated by increasing pipeline pressure or through network meshing.
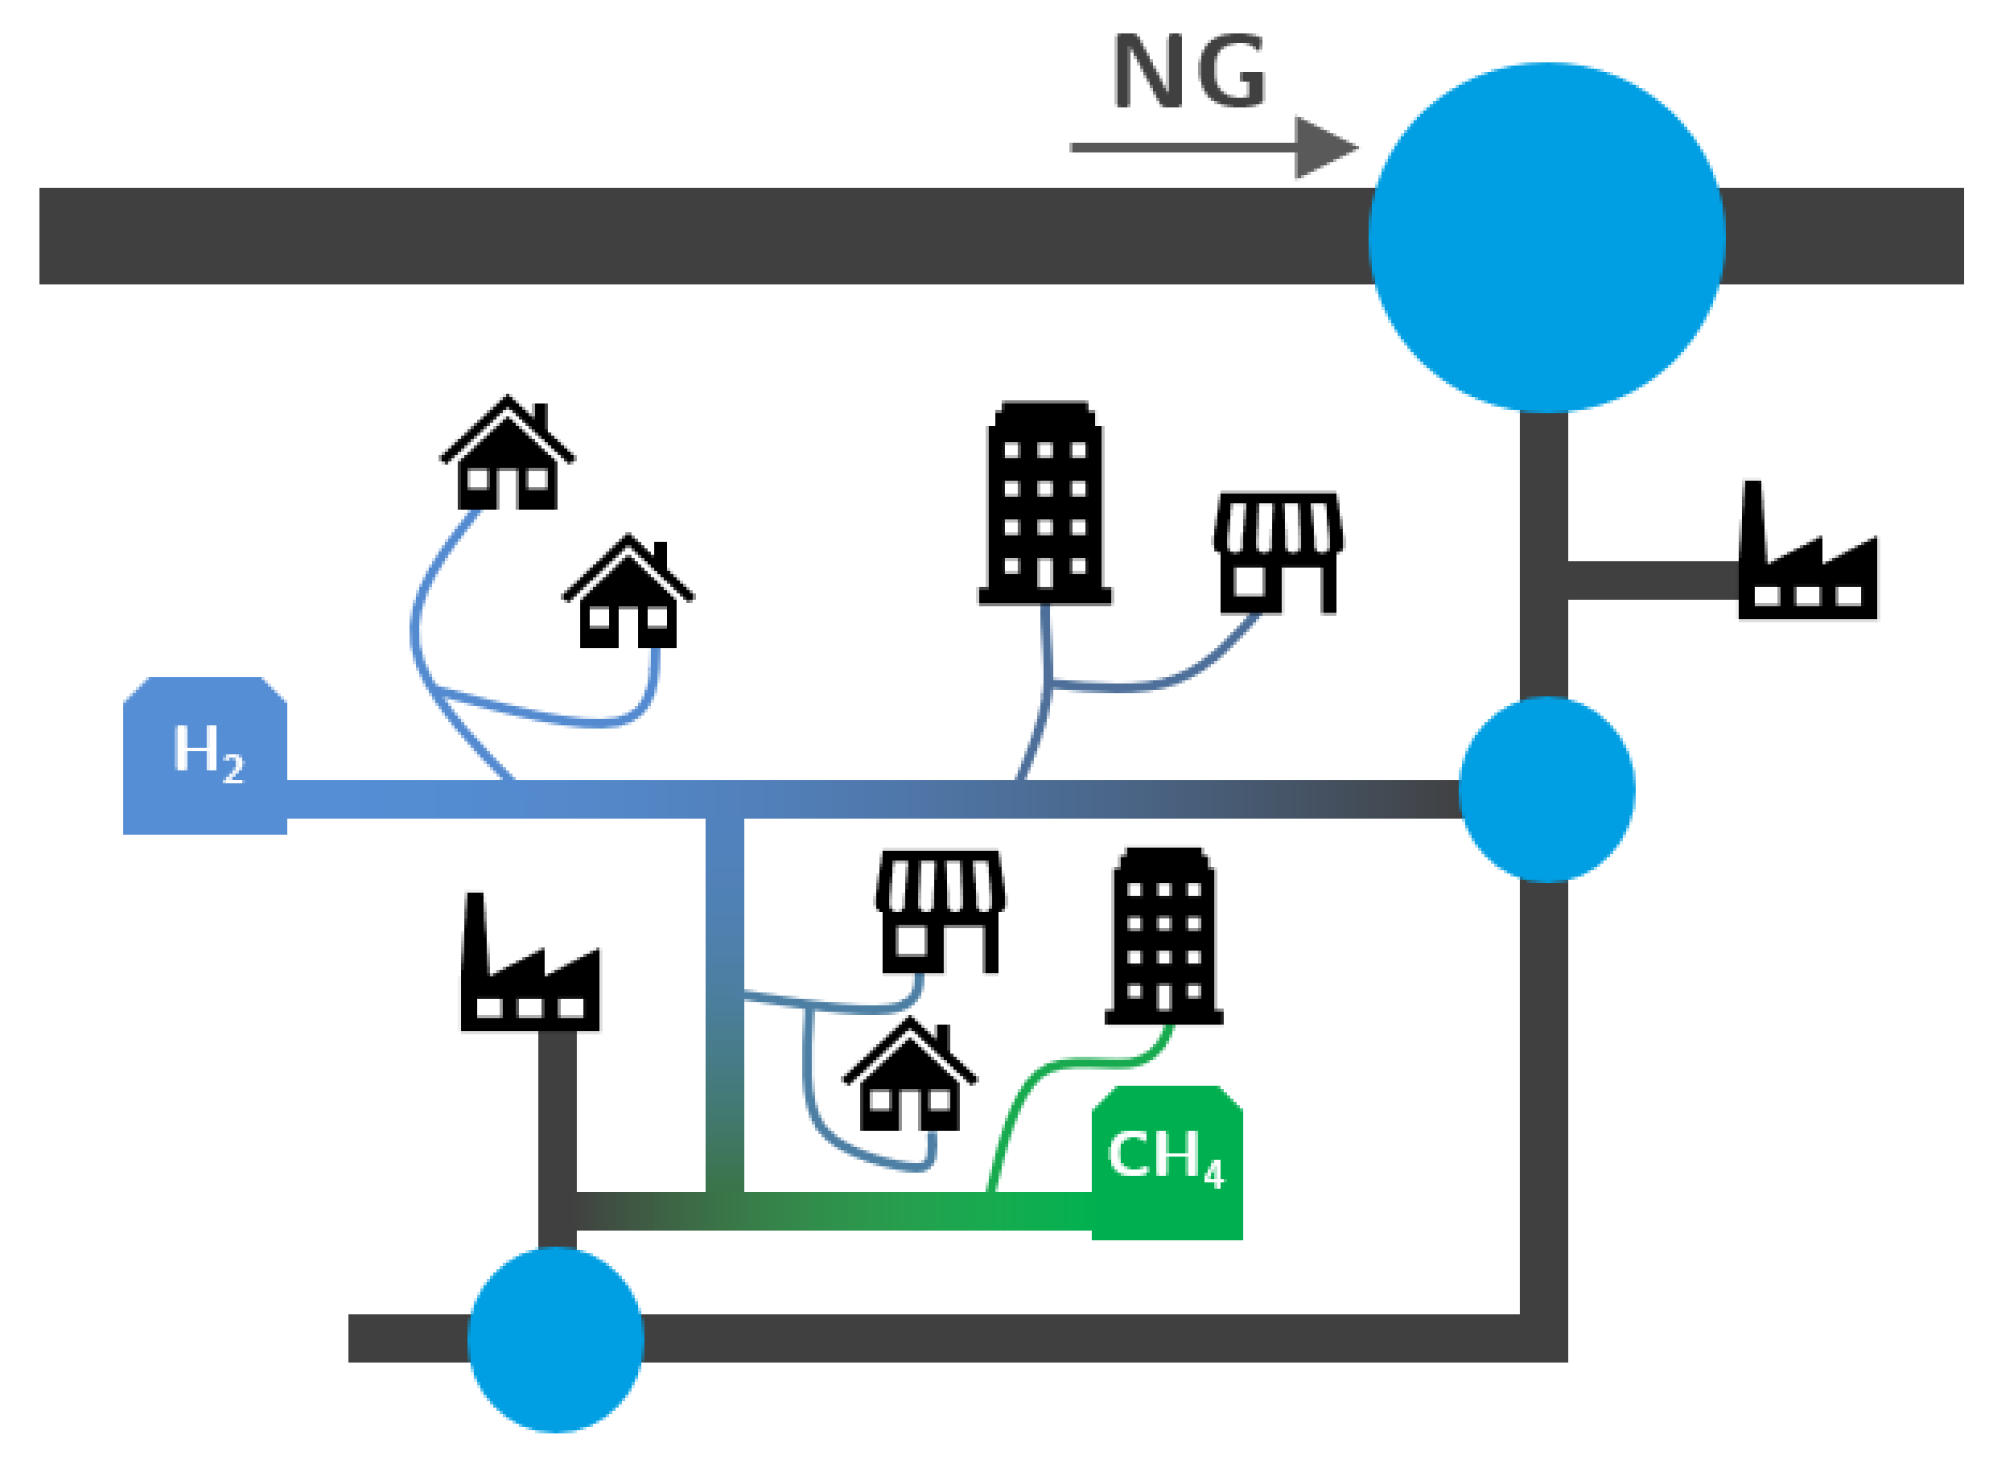
  • The decentralized nature of hydrogen and biomethane production will produce a distributed injection system, with several renewable gas injection points across distribution networks. To track gas composition and determine the GCV of the gas consumed by each customer (fair billing), DSOs will require numerical methods to support network management. Such a system has already been tested by Abeysekera et al. [49] with good results.
  • In natural gas systems, the Wobbe Index (WI) and Specific Gravity (SG) have been widely adopted as interchangeability criteria and gas quality measurements form a regulatory standpoint. However, these criteria fail to capture the impact of hydrogen on parameters such as the methane number, critical for co-generation equipment and engines in general, and the burning velocity, important in gas equipment design and domestic appliances. Thus, in a changing market structure scenario where hydrogen and biomethane are often blended with natural gas, criteria other than WI and SG will have to be used to assess the suitability of a determined gas composition to each application.
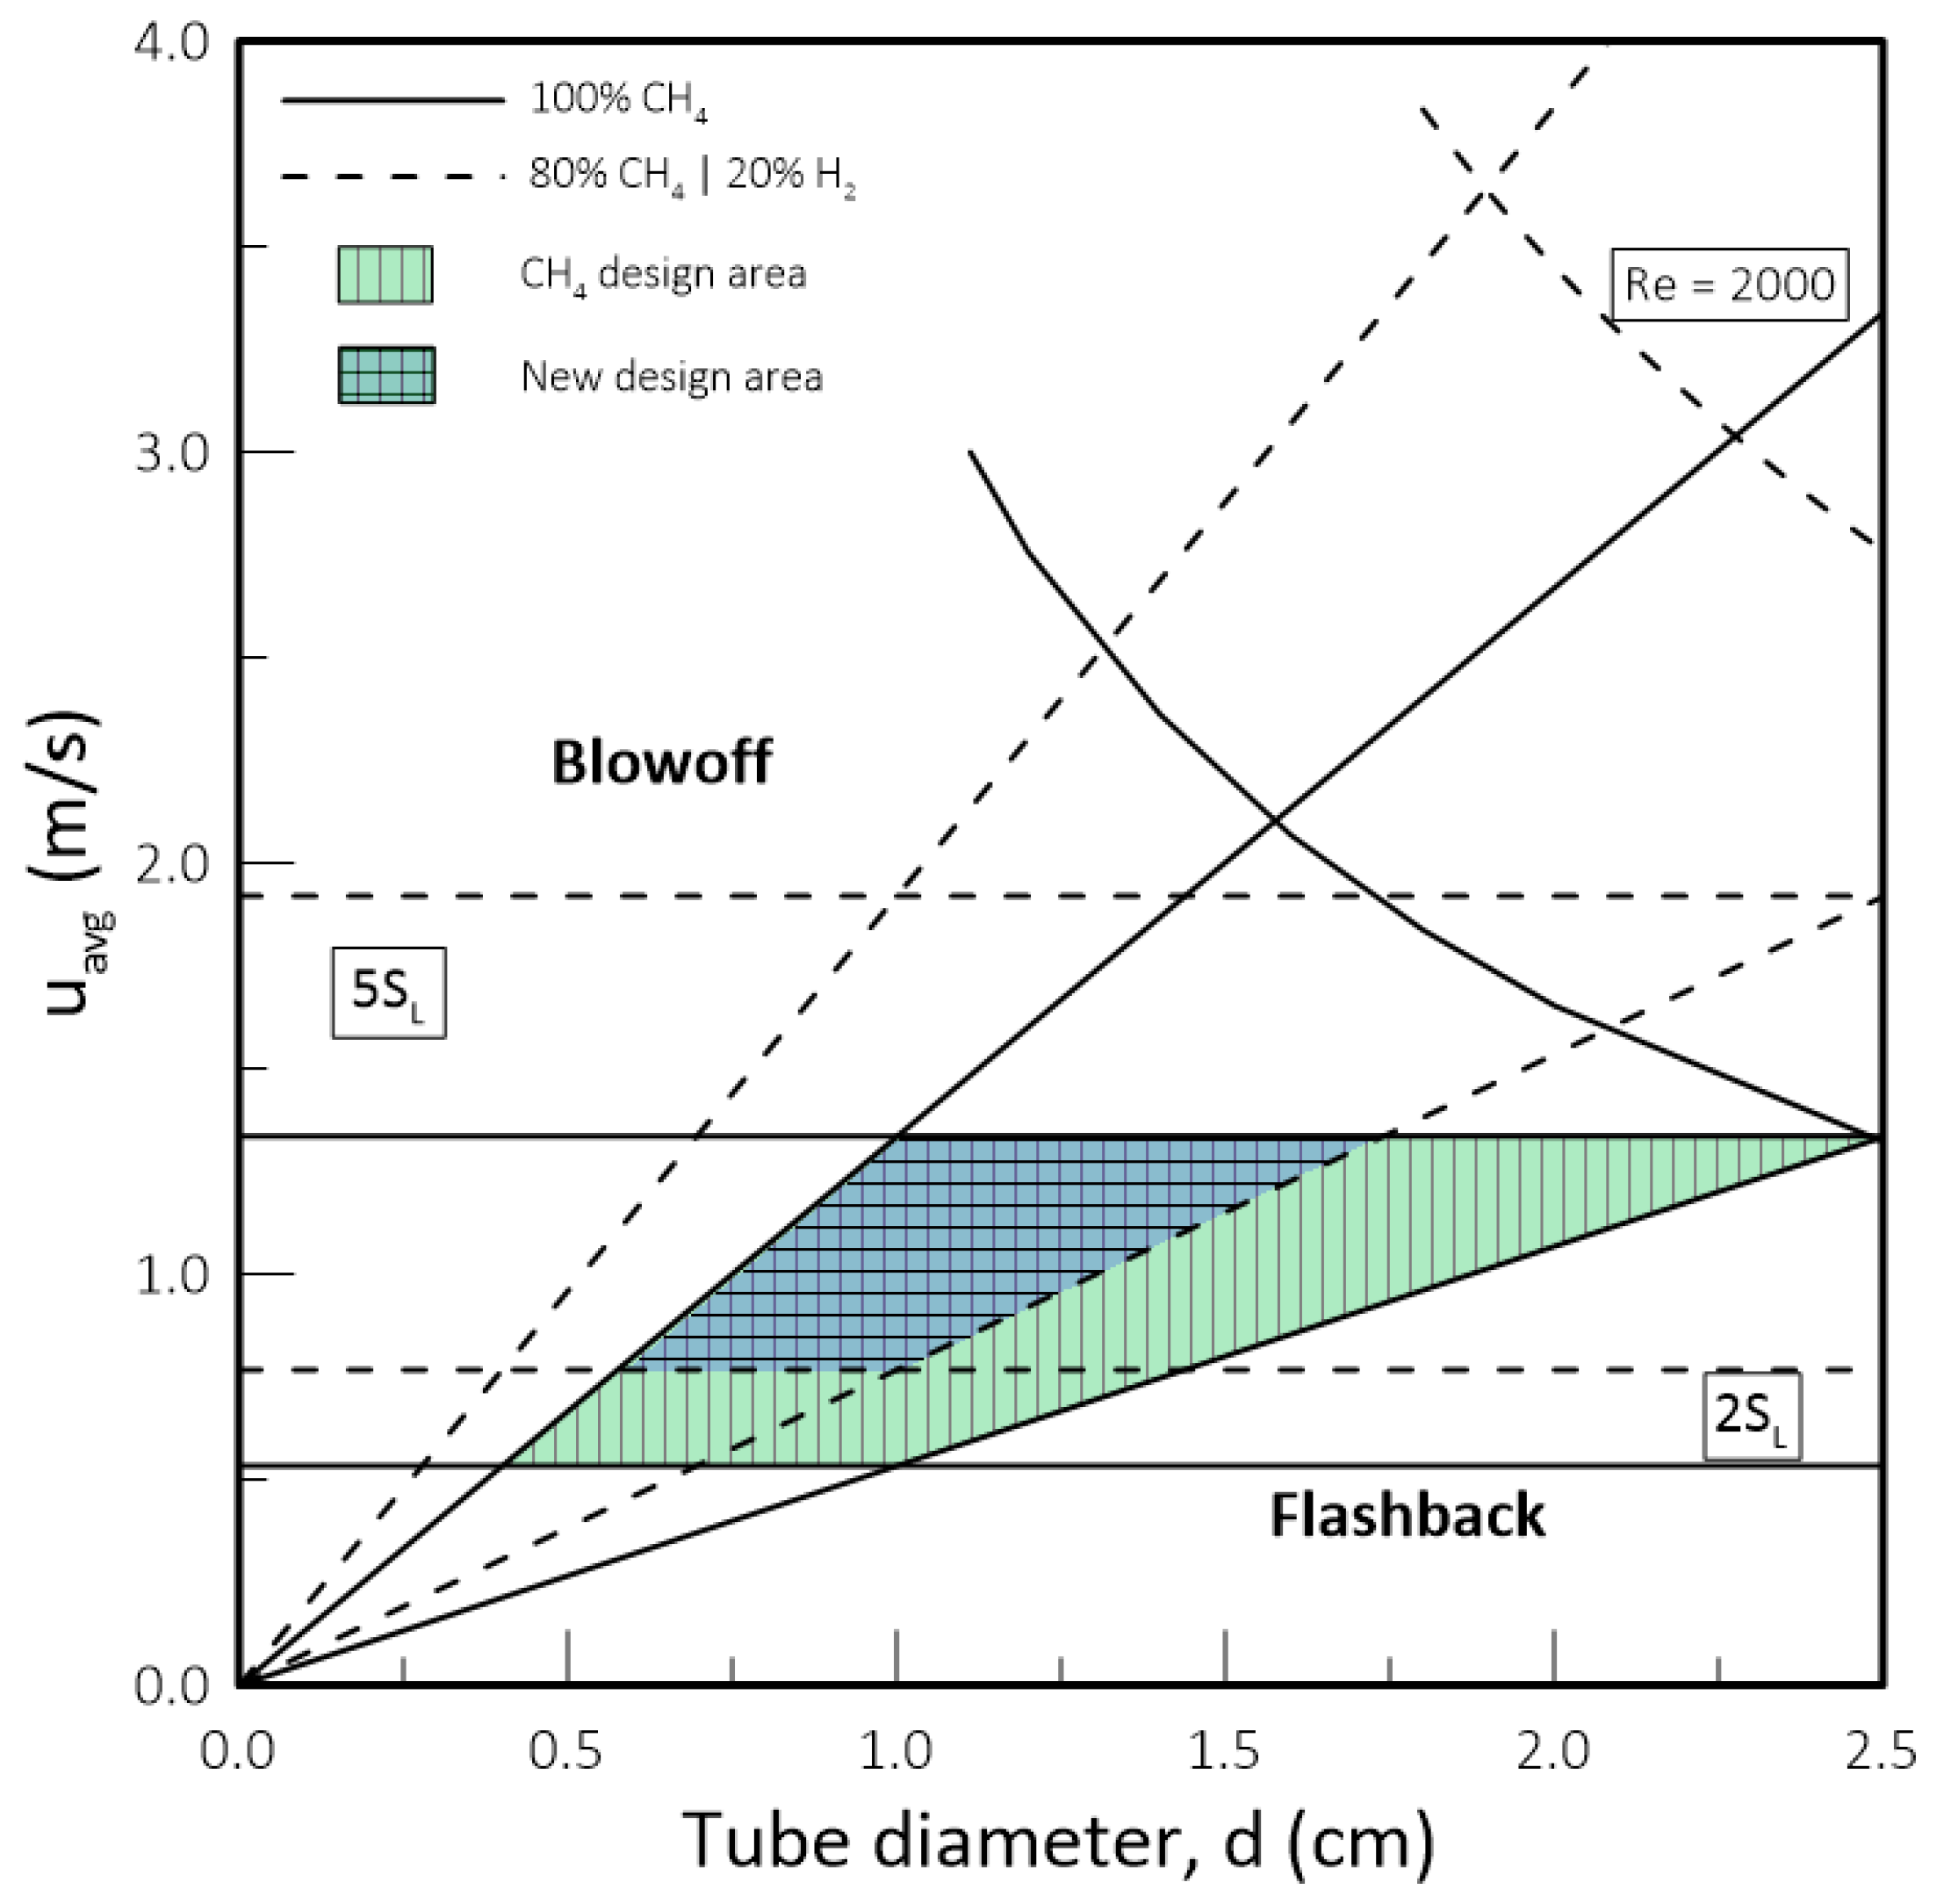
  • While biomethane is interchangeable with natural gas, hydrogen is not. The interchangeability analysis performed for domestic appliances showed that the admixture of 20% of H2 by volume, often mentioned as tolerable for most applications, produces a reduction of around 30% in design area for appliances currently in operation. This result indicates that for this level of blending, some appliances may see their turnover reduced for lower power settings. Nevertheless, most domestic equipment is expected to cope well with this level of H2 content.
Overall, it was found that the current gas infrastructure is fit for the introduction of hydrogen and biomethane. Whereas the introduction of biomethane is straightforward, hydrogen raises additional challenges. Hydrogen contents between 20 and 30% should not require dramatic modification in the current gas infrastructure, but end-use applications will likely limit hydrogen blending to around 20% by volume. However, the greatest risk of a gradual transition towards a fully blown green gas grid may be consumption. Consumers, depending on their nature, use different types of equipment. Due to this, consumers present different tolerances for the amount of hydrogen that they can receive without incurring technical modifications or acquiring new equipment. Therefore, without system and regulatory modifications accounting for this reality, there is a risk of pushing consumers off the grid as the hydrogen admixture is gradually increased. It is not self-evident how this issue will play out in the future and new solutions will be required at the risk of making the use of current infrastructure for hydrogen and biomethane distribution impracticable.

Author Contributions

Conceptualization, F.M.Q., N.N. and E.C.F.; methodology, F.M.Q.; software, F.M.Q.; validation, F.M.Q., N.N. and E.C.F.; formal analysis, F.M.Q.; investigation, F.M.Q.; resources, N.N. and E.C.F.; data curation, F.M.Q.; visualization, F.M.Q.; writing—original draft preparation, F.M.Q.; writing—review and editing, N.N. and E.C.F.; supervision, E.C.F. All authors have read and agreed to the published version of the manuscript.

Funding

F. M. Quintino acknowledges Fundação para a Ciência e Tecnologia for the provision of the scholarship PD/BD/140184/2018.

Conflicts of Interest

The authors declare no conflict of interest.

Abbreviations

The following abbreviations are used in this manuscript:
1DOne dimensional
DSODistribution System Operator
TSOTransmission System Operator
NGNatural Gas
LNGLiquefied Natural Gas
HHVHigher Heating Value
LHVLower Heating Value
GCVGross Calorific Value
UGSUnderground Storage
LPGLiquefied Petroleum Gas
SGSpecific Gravity
WIWobbe Index
MNMethane Number
FPFFreely propagating flame
USCUniversity of Southern California

References

  1. European Union. Hydrogen Roadmap Europe: A Sustainable Pathway for the European Energy Transition; Technical Report; Publications Office of the European Union: Brussels, Belgium, 2019. [Google Scholar]
  2. IEA. World Energy Outlook—China and India Insights; Technical Report; OECD/IEA: Paris, France, 2007. [Google Scholar]
  3. Scott, M.; Powells, G. Blended Hydrogen: The UK Public’s Perspective; Newcastle University: Newcastle upon Tyne, UK, 2019. [Google Scholar]
  4. Rotunno, P.; Lanzini, A.; Leone, P. Energy and economic analysis of a water scrubbing based biogas upgrading process for biomethane injection into the gas grid or use as transportation fuel. Renew. Energy 2017, 102, 417–432. [Google Scholar] [CrossRef]
  5. Urban, W. Biomethane injection into natural gas networks. In The Biogas Handbook; Elsevier: Amsterdam, The Netherlands, 2013; pp. 378–403. [Google Scholar]
  6. Liemberger, W.; Halmschlager, D.; Miltner, M.; Harasek, M. Efficient extraction of hydrogen transported as co-stream in the natural gas grid—The importance of process design. Appl. Energy 2019, 233, 747–763. [Google Scholar] [CrossRef]
  7. Isaac, T. HyDeploy: The UK’s first hydrogen blending deployment project. Clean Energy 2019, 3, 114–125. [Google Scholar] [CrossRef] [Green Version]
  8. Cells, F.; Undertaking, H.J. Hydrogen in Gas GridS: A Systematic Validation Approach at Various Admixture Levels into High-Pressure Grids. Available online: https://www.higgsproject.eu/ (accessed on 10 July 2021).
  9. Leicher, J.; Schaffert, J.; Carpentier, S.; Albus, R.; Görner, K. Impact of Hydrogen Admixture on Combustion Processes—Part I: Theory; THyGA Project: Brussels, Belgium, 2020. [Google Scholar]
  10. Schaffert, J.; Fischer, A.; Leicher, J.; Burmeister, F.; Flayyih, M.; Cigarida, H.; Albus, R.; Görner, K.; Milin, P.; Carpentier, S.; et al. Impact of Hydrogen Admixture on Combustion Processes—Part II: Practice; THyGA Project: Brussels, Belgium, 2020. [Google Scholar]
  11. Speirs, J.; Balcombe, P.; Johnson, E.; Martin, J.; Brandon, N.; Hawkes, A. A greener gas grid: What are the options. Energy Policy 2018, 118, 291–297. [Google Scholar] [CrossRef]
  12. IRENA. Green Hydrogen Cost Reduction: Scaling up Electrolysers to Meet the 1.5C Climate Goal; Technical Report; International Renewable Energy Agency: Abu Dhabi, United Arab Emirates, 2020. [Google Scholar]
  13. Gas for Climate. European Hydrogen Backbone: Analysing Future Demand, Supply, and Transport of Hydrogen; Technical Report; Guidehouse: Utrecht, The Netherlands, 2021. [Google Scholar]
  14. Haeseldonckx, D.; D’haeseleer, W. The use of the natural-gas pipeline infrastructure for hydrogen transport in a changing market structure. Int. J. Hydrogen Energy 2007, 32, 1381–1386. [Google Scholar] [CrossRef]
  15. Melaina, M.W.; Antonia, O.; Penev, M. Blending Hydrogen into Natural Gas Pipeline Networks: A Review of Key Issues; National Renewable Energy Laboratory: Golden, CO, USA, 2013. [Google Scholar]
  16. Altfeld, K.; Pinchbeck, D. Admissible hydrogen concentrations in natural gas systems. Gas Energy 2013, 2103, 1–2. [Google Scholar]
  17. Gondal, I.A. Hydrogen integration in power-to-gas networks. Int. J. Hydrogen Energy 2019, 44, 1803–1815. [Google Scholar] [CrossRef]
  18. Pellegrini, M.; Guzzini, A.; Saccani, C. A Preliminary Assessment of the Potential of Low Percentage Green Hydrogen Blending in the Italian Natural Gas Network. Energies 2020, 13, 5570. [Google Scholar] [CrossRef]
  19. Lee, S.; Speight, J.G.; Loyalka, S.K. Handbook of Alternative Fuel Technologies; CRC Press: Boca Raton, FL, USA, 2014. [Google Scholar]
  20. Faramawy, S.; Zaki, T.; Sakr, A.E. Natural gas origin, composition, and processing: A review. J. Nat. Gas Sci. Eng. 2016, 34, 34–54. [Google Scholar] [CrossRef]
  21. Gasodutos, R. Specification M-00000-SPC-MI-0002-Rev6; Technical Report; Gas Properties: Setúbal, Portugal, 2021. [Google Scholar]
  22. Goodwin, D.G.; Moffat, H.K.; Speth, R.L. Cantera: An Object-Oriented Software Toolkit for Chemical Kinetics, Thermodynamics, and Transport Processes; Caltech: Pasadena, CA, USA, 2009. [Google Scholar]
  23. Amirante, R.; Distaso, E.; Tamburrano, P.; Reitz, R.D. Laminar flame speed correlations for methane, ethane, propane and their mixtures, and natural gas and gasoline for spark-ignition engine simulations. Int. J. Engine Res. 2017, 18, 951–970. [Google Scholar] [CrossRef]
  24. Wang, H.; You, X.; Joshi, A.V.; Davis, S.G.; Laskin, A.; Egolfopoulos, F.; Law, C.K.; Version, U.M., II. High-Temperature Combustion Reaction Model of H2; Technical Report; CO/C1-C4 Compounds. 2007. Available online: http://ignis.usc.edu/USC_Mech_II.htm (accessed on 10 July 2021).
  25. Zhang, Y.; Jiang, X.; Wei, L.; Zhang, J.; Tang, C.; Huang, Z. Experimental and modeling study on auto-ignition characteristics of methane/hydrogen blends under engine relevant pressure. Int. J. Hydrogen Energy 2012, 37, 19168–19176. [Google Scholar] [CrossRef]
  26. Quintino, F.; Fernandes, E. Analytical correlation to model diluent concentration repercussions on the burning velocity of biogas lean flames: Effect of CO2 and N2. Biomass Bioenergy 2018, 119, 354–363. [Google Scholar] [CrossRef]
  27. Quintino, F.M.; Fernandes, E.C. Numerical Investigation of the Impact of H2 Enrichment on Lean Biogas/Air Flames: An Analytical Modelling Approach. Energies 2021, 14, 369. [Google Scholar] [CrossRef]
  28. Mohitpour, M.; Solanky, H.; Vinjamuri, G.K. Materials selection and performance criteria for hydrogen pipeline transmission. In Proceedings of the ASME/JSME 2004 Pressure Vessels and Piping Conference, San Diego, CA, USA, 25–29 July 2004; pp. 241–251. [Google Scholar]
  29. Moradi, R.; Groth, K.M. Hydrogen storage and delivery: Review of the state of the art technologies and risk and reliability analysis. Int. J. Hydrogen Energy 2019, 44, 12254–12269. [Google Scholar] [CrossRef]
  30. Vanderoost, T.; Vannoppen, G. Ontwerp van een Roadmap Voor de Omschakeling van een Aardgaseconomie Naar een Waterstofeconomie: Production, Transport, Stockage, Eindconversie en Veiligheidsaspecten van Waterstof. Master’s Thesis, KU Leuven, Department of Applied Thermodynamics and Energy, Leuven, Belgium, 2004. [Google Scholar]
  31. Kölle, W.; Strebel, O.; Böttcher, J. Reduced sulphur compounds in sandy aquifers and their interactions with groundwater. In Groundwater Monitoring and Management; IAHS-AISH Publication: Wallingford, UK, 1990; pp. 23–30. [Google Scholar]
  32. Ozarslan, A. Large-scale hydrogen energy storage in salt caverns. Int. J. Hydrogen Energy 2012, 37, 14265–14277. [Google Scholar] [CrossRef]
  33. Preuster, P.; Alekseev, A.; Wasserscheid, P. Hydrogen storage technologies for future energy systems. Annu. Rev. Chem. Biomol. Eng. 2017, 8, 445–471. [Google Scholar] [CrossRef]
  34. Gillette, J.; Kolpa, R. Overview of Interstate Hydrogen Pipeline Systems; Technical Report; Argonne National Lab. (ANL): Argonne, IL, USA, 2008. [Google Scholar]
  35. Lemieux, A.; Sharp, K.; Shkarupin, A. Preliminary assessment of underground hydrogen storage sites in Ontario, Canada. Int. J. Hydrogen Energy 2019, 44, 15193–15204. [Google Scholar] [CrossRef]
  36. Hemme, C.; Van Berk, W. Hydrogeochemical modeling to identify potential risks of underground hydrogen storage in depleted gas fields. Appl. Sci. 2018, 8, 2282. [Google Scholar] [CrossRef] [Green Version]
  37. Taamallah, S.; Vogiatzaki, K.; Alzahrani, F.M.; Mokheimer, E.M.; Habib, M.; Ghoniem, A.F. Fuel flexibility, stability and emissions in premixed hydrogen-rich gas turbine combustion: Technology, fundamentals, and numerical simulations. Appl. Energy 2015, 154, 1020–1047. [Google Scholar] [CrossRef]
  38. Ando, Y.; Oozawa, H.; Mihara, M.; Irie, H.; Urashita, Y.; Ikegami, T. Demonstration of SOFC-micro gas turbine (MGT) hybrid systems for commercialization. Mitsubishi Heavy Ind. Tech. Rev. 2015, 52, 47–52. [Google Scholar]
  39. Gondal, I. Hydrogen transportation by pipelines. In Compendium of Hydrogen Energy; Elsevier: Amsterdam, The Netherlands, 2016; pp. 301–322. [Google Scholar]
  40. Alban, T. Blending Hydrogen into Existing Gas Grid: Opportunities and Challenges for Pipeline e-Motor Compressor System Design. In Proceedings of the Pipeline Technology Conference 2020, Berlin, Germany, 30 March–2 April 2020. [Google Scholar]
  41. Scholten, F.L.; Wolters, M. Hydrogen diffusion through plastic pipes. In Proceedings of the 17th International Plastic Fuel-Gas Pipeline Symposium, San Francisco, CA, USA, 20–23 October 2002; pp. 280–284. [Google Scholar]
  42. Miyake, H.; Matsuyama, M.; Ashida, K.; Watanabe, K. Permeation, diffusion, and solution of hydrogen isotopes, methane, and inert gases in/through tetrafluoroethylene and polyethylene. J. Vac. Sci. Technol. A Vac. Surf. Film 1983, 1, 1447–1451. [Google Scholar] [CrossRef]
  43. Sadler, D.; Cargill, A.; Crowther, M.; Rennie, A.; Watt, J.; Burton, S.; Haines, M. H21 Leeds City Gate; Northern Gas Networks: Leeds, UK, 2016. [Google Scholar]
  44. Jaworski, J.; Kułaga, P.; Blacharski, T. Study of the effect of addition of hydrogen to natural gas on diaphragm gas meters. Energies 2020, 13, 3006. [Google Scholar] [CrossRef]
  45. Ouyang, L.B.; Aziz, K. Steady-state gas flow in pipes. J. Pet. Sci. Eng. 1996, 14, 137–158. [Google Scholar] [CrossRef]
  46. Schouten, J.; Michels, J.; Janssen-van Rosmalen, R. Effect of H2-injection on the thermodynamic and transportation properties of natural gas. Int. J. Hydrogen Energy 2004, 29, 1173–1180. [Google Scholar] [CrossRef]
  47. Abd, A.A.; Naji, S.Z.; Thian, T.C.; Othman, M.R. Evaluation of hydrogen concentration effect on the natural gas properties and flow performance. Int. J. Hydrogen Energy 2021, 46, 974–983. [Google Scholar] [CrossRef]
  48. Ogden, J.; Jaffe, A.M.; Scheitrum, D.; McDonald, Z.; Miller, M. Natural gas as a bridge to hydrogen transportation fuel: Insights from the literature. Energy Policy 2018, 115, 317–329. [Google Scholar] [CrossRef]
  49. Abeysekera, M.; Wu, J.; Jenkins, N.; Rees, M. Steady state analysis of gas networks with distributed injection of alternative gas. Appl. Energy 2016, 164, 991–1002. [Google Scholar] [CrossRef] [Green Version]
  50. Zhang, Y.; Gao, W.; Yu, Y.; Wang, M.; Chen, C. Primary air ratio change and gas interchangeability index correct for domestic gas cooker burning multi-source natural gases. J. Nat. Gas Sci. Eng. 2016, 35, 276–282. [Google Scholar] [CrossRef]
  51. Klimstra, J. Interchangeability of Gaseous Fuels—The Importance of the Wobbe-Index; SAE Transactions: New York, NY, USA, 1986; pp. 962–972. [Google Scholar]
  52. European Committee for Standardization. EN 437:2003+A1, Test Gases–Test Pressures–Appliance Categories; Technical Report; European Union: Brussels, Belgium, 2009. [Google Scholar]
  53. Che, D.; Liu, Y.; Gao, C. Evaluation of retrofitting a conventional natural gas fired boiler into a condensing boiler. Energy Convers. Manag. 2004, 45, 3251–3266. [Google Scholar] [CrossRef]
  54. Durbin, D.; Malardier-Jugroot, C. Review of hydrogen storage techniques for on board vehicle applications. Int. J. Hydrogen Energy 2013, 38, 14595–14617. [Google Scholar] [CrossRef]
  55. Sofianopoulos, A.; Assanis, D.; Mamalis, S. Effects of hydrogen addition on automotive lean-burn natural gas engines: Critical review. J. Energy Eng. 2016, 142, E4015010. [Google Scholar] [CrossRef]
  56. Park, C.; Kim, C.; Choi, Y. Power output characteristics of hydrogen-natural gas blend fuel engine at different compression ratios. Int. J. Hydrogen Energy 2012, 37, 8681–8687. [Google Scholar] [CrossRef]
  57. Gondal, I.A. Infrastructure Analysis for Renewable Hydrogen Production in Pakistan; Technical Report; Department of Mechanical Engineering, Faculty of Mechanical and Aeronautical Engineering, University of Engineering and Technology: Taxila, Pakistan, 2012. [Google Scholar]
  58. Turns, S.R. Introduction to Combustion; McGraw-Hill Companies: New York, NY, USA, 1996; Volume 287. [Google Scholar]
  59. Jones, H.R.N. The Application of Combustion Principles to Domestic Gas Burner Design; Taylor & Francis: Abingdon, UK, 1989. [Google Scholar]
  60. Lewis, B.; Von Elbe, G. Combustion, Flames and Explosions of Gases; Elsevier: Amsterdam, The Netherlands, 2012. [Google Scholar]
  61. Glassman, I.; Yetter, R.A.; Glumac, N.G. Combustion; Academic Press: Cambridge, MA, USA, 2014. [Google Scholar]
  62. De Vries, H.; Mokhov, A.V.; Levinsky, H.B. The impact of natural gas/hydrogen mixtures on the performance of end-use equipment: Interchangeability analysis for domestic appliances. Appl. Energy 2017, 208, 1007–1019. [Google Scholar] [CrossRef]
  63. Hindasageri, V.; Vedula, R.P.; Prabhu, S.V. Blowoff Stability of Methane-Air Premixed Flame on Tube Burners. Int. J. Emerg. Multidiscip. Fluid Sci. 2011, 3, 209–225. [Google Scholar] [CrossRef]
Figure 1. Schematic of the natural gas system.
Hydrogen 02 00016 g001
Figure 2. Energy content of gas blends in pipeline flow relative to the energy content of pure CH4 and NG assuming an unchanged pressure drop and same pipeline dimensions.
Hydrogen 02 00016 g002
Figure 3. Impact of hydrogen blending on pipeline pressure drop for constant energy demand and unchanged pipe diameter.
Hydrogen 02 00016 g003
Figure 4. Schematic of a distribution gas network with distributed injection of hydrogen and biomethane.
Hydrogen 02 00016 g004
Figure 5. Specific gravity of NG and CH4 for varying H2 blending.
Hydrogen 02 00016 g005
Figure 6. Wobbe index of NG and CH4 for varying H2 blending.
Hydrogen 02 00016 g006
Figure 7. Laminar flame speed of CH4/air flames at three levels of hydrogen blending by volume: 0%, 20% and 50%. Conditions were set at T u = 298   K , p = 1 atm and 0.6 < ϕ < 1.4 .
Hydrogen 02 00016 g007
Figure 8. Stability and operation limits of Bunsen-based combustion devices fuelled by the blends described in Table 2. Horizontal lines delineate the upper ( 5 S L ) and lower ( 2 S L ) boundaries for u a v g . Lines starting from the origin of the plot correspond to the blowoff and flashback limits. Limitations for laminar flow are delineated by the curves on the top right-hand side of the graph.
Hydrogen 02 00016 g008
Table 1. Relevant properties of CH4, NG and H2.
PropertyCH4NGH2
M (kg/kmol)16.04317.9192.016
ρ (kg/m3)0.6680.8020.0899
d (adm)0.5540.6200.075
LdV (adm)9.5210.232.38
HHV (MJ/m3)39.842.812.7
LHV (MJ/m3)35.838.810.8
WI (MJ/m3)53.554.446.4
Table 2. Estimated equivalence ratio for appliance operation with different fuel blends.
Fuel Blend ϕ
100% CH41.25
80% CH4/20% H21.17
Publisher’s Note: MDPI stays neutral with regard to jurisdictional claims in published maps and institutional affiliations.

