Abstract
The hydrogen economy relies on effective and environmentally friendly processes for energy conversion and storage. To this end, hydrogen is progressively holding the role of preferred energy vector. Within this frame, electrochemical science and technology is actively contributing in developing advanced fuel cells and water electrolyzers to be integrated in (i) energy parks to decouple production and consumption; (ii) exploit renewable sources; (iii) favour the progressive reduction of fossil fuels and reduce the greenhouse effect via decarbonization. The exploitation of the relevant processes and devices call for the sound control over the environmental impact from production to end-of-life steps. Here, life-cycle analyses were performed and discussed focusing on both acid and alkaline fuel cells, i.e., proton exchange membrane fuel cells (PEMFC) and anion-exchange membrane fuel cells (AEMFC), and assessing their contribution to key environmental impact categories such as, for example, global warming and ozone layer depletion. Within these premises, the study points to the benefits of replacing platinum by low load Pd/CeO2 bifunctional electrocatalyst on electrochemical hydrogen production and usage.
1. Introduction
The concern about global warming bound to CO2 emissions has shifted the attention of the scientific, industrial, and social communities from the mere use of cheap and abundant energy sources (in primis fossil fuels) to the exploitation of renewable energies and the expansion of the relevant transmission network.
Within this frame, H2 is progressively assuming the role of preferred energy vector, thanks to the double role of water as a main H2 source and H2 combustion product.
In this context, the scientific community is actively contributing to implementing the use of H2 focusing on the most effective devices for water-to-hydrogen and hydrogen-to-energy conversions.
Among the various processes, electrochemical cells are increasingly playing a leading role in the two-way hydrogen ⇆ electricity conversion exploiting water electrolysis and fuel cells, in combination with the parallel exploitation of renewable energy sources, harvested by e.g., photo-, wind- and hydro-converters.
Fuel cells and water electrolyzers mostly adopt proton exchange membranes (PEM), and PGM’s (platinum group metals) catalysts, which allow for high power densities and stabilities, the main drawback being related to the use of platinum and iridium, an issue for both economic and environmental reasons.
One route to reduce the impact related to the use of Pt is suggested by Duclos and Chattot (2020) [1] via alloying and appropriate recycling. In their study, Pt3Co/C fuel cell undergoes a post-end of life treatment, separating Co and Pt from the membrane electrode assembly (MEA) and recycling platinum in a new Pt/C based fuel cell. This is a feasible route, provided that both recycling and preparation steps are optimised.
The adoption of alkaline fuel cells, based on anion exchange membranes (AEM), could effectively overcome the limitations related to PEMFC. Accordingly, anion-exchange membrane fuel cells (AEMFC) are a primary focus of international researchers.
AEMFCs require a noble metal for one electrode only, and commercial AEMs are usually cheaper than the cationic ones, usually based on perfluorinated chains (e.g., DuPont’s Nafion®) [2].
Notwithstanding their attractiveness, the development of effective AEMFCs requires solving key aspects such as (i) the chemical stability of AEMs under alkaline working conditions and (ii) the selection of adequate electrode materials to improve the rate of the hydrogen oxidation reaction (HOR) [3].
Recent studies suggest that both H and OH adsorption sites are necessary for improving the HOR rate, as exhibited by the bifunctional catalyst Pd@CeO2/C, that can be used as both cathode and anode as reported by Vizza et al. [4,5]. Its excellent stability and activity for the hydrogen oxidation reaction (HOR) under alkaline conditions is bound to the unique structure of palladium deposited on a mixed support of Vulcan XC-72 and CeO2, and to the preferable location of Pd on the ceria regions. The CeO2–Pd interaction leads to enhanced HOR kinetics, increased stability, and optimized activity at 10 wt% Pd loadings. Note that Pd-doped CeO2 surface is active also in CO oxidation and promotes the cleavage of the first C−H bond in methane, highlighting a new structure of Pd-doped CeO2 (111), in which Pd adopts a square planar configuration [6].
Hydrogen pumping and fuel cell experiments based on Pd@CeO2/C catalyst show higher activities than a Pd/C sample without ceria (see, e.g., the seminal paper of Gregory Jerkiewicz [7]). Metal dissolution tests and identical location transmission microscopy experiments show that the catalyst stability under harsh potential cycling experiments in alkaline medium is significantly improved as compared to Pd/C, making this material one of the best options for the HOR in anion exchange membrane fuel cells.
To further support the adoption of this catalyst, we analyse with a life-cycle assessment (LCA) study the environmental impact of an AEMFC, and discuss the results in comparison with an LCA study on a PEMFC stack made by Simons and Bauer in 2015 [8] and by Civelli [9].
Life-cycle assessment (LCA) is a powerful, quantitative analysis tool used for:
- Comparing clearly defined end product alternatives;
- Ecolabeling: an environmental performance certification and labelling practiced around the world, on a voluntary basis, to identify products or services proven to be environmentally preferable within their specific product or service category;
- Improving the environmental performance of products at various stages of their life by identifying those activities (the so-called hot spots) that have a significant environmental impact. Protocol implies the compilation and evaluation of the inputs/outputs, and the relevant potential environmental impacts, of a product system throughout its life cycle (ISO 2006a).
2. Methodology
Life-cycle assessment (LCA) is an effective analytical tool to assist in environmentally relevant decisions concerning product systems [10]. The ISO 14040:2006 norm describes the principles and framework for LCA studies and reports.
LCA studies are structured in terms of: goal and scope, inventory analysis and impact assessment. These three building blocks are at the basis of the Interpretation step, whose outcomes have direct application in product development and improvement, marketing (e.g., ecolabeling, environmental product declaration), public policy, and strategic planning.
- Goal and scope: describes the intended application, i.e., the investigated product, the data sources and the system boundaries. It clarifies the goal of the analysis and defines the functional unit. In addition, the goal defines the methods, the assumptions, the limitations and the reasons of the decisions taken during the study; the scope defines the functional unit, the system boundaries, the impact assessment categories, the data quality and the differences between the analyzed scenarios.
- Inventory analysis (LCI): accounts for all the relevant steps that are contained in the system boundaries, models the interactions of the product system with the environment using a dedicated LCA software tools (SimaPRO® in this study).
- Impact assessment: the input/output flows contained in LCI strikes in the impact categories according to the characterization factors, i.e., the factors linked to both physical and chemical properties of the substances and the destination of the outcoming flows to the environment.
- Interpretation: the results achieved in each phase are collected and analyzed in order to evaluate the completeness, precision and accuracy of the data used.
2.1. Goal and Scope
The present LCA study aims to:
- evaluate the impact of catalyst with respect to the impact of the whole fuel cell;
- compare an AEMFC exploiting a Pd@CeO2/C anode with a classic PEMFC;
- verify if other improvements on materials/processes are possible.
This LCA analysis is based on SimaPRO version 9.0.0 (SimaPro is a registered trademark of PRé Sustainability B.V., Amersfoort, The Nederlands) This sustainability tool possesses eight databases containing both regional and global data. Ecoinvent 3.5. was the most frequently used.
2.1.1. System Boundaries
The system boundaries (Figure 1) define the unit processes to be included in the system. Ideally, the product system should be modelled in such a manner that inputs and outputs at its boundary are elementary flows. The analysis is from gate to gate, i.e., the system boundary starts from the raw material at the plant, includes transportation, and ends with the finished product at plant.
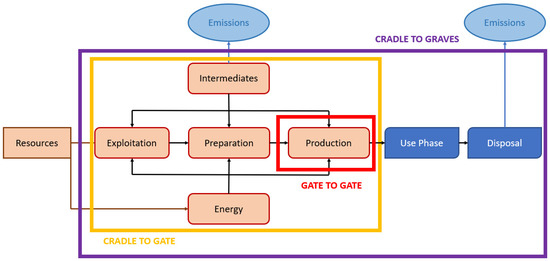
Figure 1.
General system boundaries scheme for life-cycle assessment (LCA) studies.
In this study, two different fuel cell types are considered.
Scenario A considers the production of a PEMFC, and the finished product is the fuel cell stack. This approach allows to identify the hot spots of the entire apparatus.
Scenario B concerns an alkaline fuel cell and specifically focuses to the Pd@CeO2/C anode.
Scenario C consider the same alkaline fuel cell of Scenario B, with the cathode of Scenario A. The “use stage” is not accounted for any scenarios, because the obtained MEA could be exploited for many different applications.
2.1.2. Functional Unit
The functional unit defines the relevant quantifiable properties and the technical/functional performances of the system [11]. The primary purpose of a functional unit is to provide a reference to which the inputs and outputs are related. This reference is necessary to ensure comparability of LCA results, a particularly critical process when different systems are under evaluation, to ensure that such comparisons are made on a common basis.
The aim of PEMFCs is the production of energy; hence, the functional unit is usually related to the energy per unit of time, i.e., power, of the manufactured cell. Here, the functional unit is assumed to be 1 kg/W and the system is defined in terms of “total weight of device/cell power”.
2.1.3. Impact Categories
Life-cycle impact assessment (LCIA) aims at “understanding and evaluating the magnitude and significance of the potential environmental impacts” [12,13]. In this study, the 11 impact categories listed in Table 1 were selected in order to be consistent with the goal of the analysis and the relevant applications of the results. These impact categories cover all the main environmental issues related to the system: climate change, nature and biodiversity, environmental health and quality of life, Natural resources and wastes. The most relevant impact categories for FCs are reported in the FC-Hy Guide which refers to the International Reference Life-Cycle Data System (ILCD) [11]. All the analysed midpoint indicators have been selected by the method CML-IA [14]. Nine out of 11 indicators are taken from the CML-IA baseline version 3.05 and 2 from CML-IA non-baseline version 3.04.

Table 1.
The impact categories analyzed in this study.
3. Inventory Analysis
Figure 2 represents the fuel cell stack components.

Figure 2.
Scheme of the components to assembly a fuel cell stack.
Scenario A: the finished product is the PEMFC stack: i.e., MEA, bipolar plates, collector/end plates and tie rods;
Scenario B: only the orange boxes, which correspond to the MEA production and assembly, are accounted for.
The characterization factors are from version 4.4 of in http://cml.leiden.edu/software/data-cmlia.html (accessed on 1 April 2013) The CML-IA method is developed by a group of scientists under the lead of the Center of Environmental Science of Leiden University [14]. The set of impact categories and characterization method are defined for the midpoint approach and, in addition, the opportunity of a normalization step is provided.
The inventory analysis is a systematic, stepwise and objective procedure performed in order to quantitatively determine the input and output data for all the materials and processes involved in the life cycle. The input/output data cover energy and raw material requirements, atmospheric emissions, waterborne emissions, solid wastes and other releases for the entire life cycle of a product.
Scenario A: PEMFC, this stage focuses on the production of a proton exchange membrane fuel cell stack. It has been chosen to replicate a Pt-based FC exploiting a Nafion® membrane. The simulation on SimaPRO® is performed according to the paper “A life-cycle perspective on automotive fuel cells” by Simons and Bauer in 2015 [8]. This study was performed with the same software, but with a previous version of the Ecoinvent database. The transportations of most materials accounted in this section are based on standard Ecoinvent freight transport distances in Europe. The distances performed by boat are calculated exploiting the site “Ports.com, accessed on 31 October 2019”, which compute the nautical miles necessary for sailing from one port to another.
Each acidic fuel cell component is analyzed individually, in order to facilitate the hot spots evaluation and the one-at-a-time sensitivity analysis.
The PEMFC components are:
- Catalyst layer.
- Nafion® membrane.
- Gas diffusion layer (GDL).,
- Bi-polar plates.
- Collector/end plates and tie rods.
Catalyst layer, Nafion® membrane and gas diffusion layer are then assembled together, by a thermoforming process, in the MEA. Finally, MEA, bi-polar plates and collector/end plates with tie rods lead to the assembled fuel cell stack.
3.1. Catalyst
Scenario A: PEMFC catalysts are usually based on noble metal active phases, supported on carbon black. The most widely used metals are platinum for the anode, thanks to its significant activity also at low temperatures, and iridium (i.e., IrOx) for the cathode. In both cases, the main drawbacks are both economic and environmental. Acid fuel cells, operating at low pH, provide high power densities but necessitate a remarkable amount of Ir for the cathode, where the oxygen reduction reaction occurs. In this study, Ir compounds have been approximated with Pt compounds. At the negative pole, HOR requires a very small amount of Pt, here fixed at 0.15 mg/cm2. The catalysts are dispersed onto a carbon black powder (Vulcan XC-72, Cabot Corporation-NYSE: CBT, Cabot Italiana SpA, Ravenna, Italy) which provides both high conductivity and adequate porosity.
Scenario B: the AEMFC limitations are mainly related to the anode, since HOR has a slow kinetic on Pt [5]. Here we selected the new catalysts: Pd@CeO2/C with excellent performances under both alkaline and acid conditions. Data related to the electrode synthesis and performances were taken from the study performed at the Istituto di Chimica dei Composti Organometallici, in Sesto Fiorentino (Italy) Figure 3 [5].
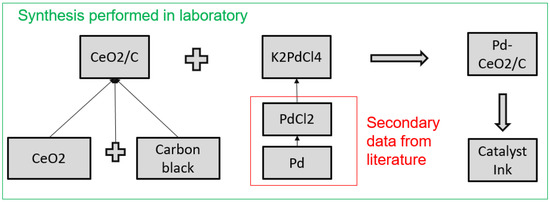
Figure 3.
Synthesis of Pd@CeO2/C: the syntheses contained in the green box have been performed in Sesto Fiorentino, the syntheses in the red box had to be inserted in SimaPRO, in order to obtain K2PdCl4 which was not present in the database.
3.1.1. CeO2/C
Carbon black was treated for 3 h in a 4 M HNO3 solution to functionalize the carbon surface with oxygen bearing groups. This material was then dispersed in ethanol by sonication and a tetrahydrofurane (THF) solution of Ce(C10H21O)4 was added dropwise to obtain a final CeO2 loading of 45 wt%. After 30 min of sonication, a 10% vol. solution of H2O in ethanol was added dropwise to hydrolyse the alkoxide and form the C-supported amorphous CeO2, which was then further sonicated. The solid product was collected by filtration through a 0.45 μm PTFE (polytetrafluoroethylene) filter and washed thoroughly with ethanol. The solid material thus obtained was dried to constant weight [5].
In the Simapro database, the only cerium compound present is CeO2. In fact, most of the cerium was obtained from bastnäsite, a mineral with high rare-earths content. Bastnäsite is then treated with concentrated sulfuric acid in order to provide rare-earth oxides, included CeO2. For this reason, to simulate the support synthesis, an assembly of carbon black and CeO2 is performed. Another possibility would have been to start from CeO2, obtaining a cerium precursor then using it to obtain again CeO2.
3.1.2. Synthesis of Pd@CeO2/C
The CeO2/C support material was suspended in water by vigorous stirring and sonicated. An aqueous solution of K2PdCl4 was added under stirring, followed by continued stirring for 1 h. To this solution, aqueous KOH and ethanol were added before heating at 80 °C. After cooling to room temperature, the solid product was collected by filtration, washed with water until neutral pH, and then dried to constant weight at 60 °C in air. The wt.% ratio of the three components in the catalyst Pd:CeO2:C was 1:4:5 [5].
3.1.3. Catalyst Ink Preparation and Deposition
Scenario A: the supported catalyst (Pt/C) was mixed with a Nafion suspension (5 wt% of the total ink weight), ultrapure water (50 wt% of the total ink weight) and ethylene glycol (5 wt% of the total ink weight). After the mixing stage, the ink preparation involved a distillation step and a viscosity reduction step. The ink was then deposited onto the gas diffusion layer with a coating process (e.g., blade coating). Electrode area: 700 cm2, Pt load 105 mg (0.15 mg/cm2), Pt/C ratio 4:6 by weight, which implies the use of 160 mg of carbon black.
Scenario B: cathode: Pt/C (Alfa Aesar, Johnson Matthey HiSpec 4000, 40 wt.% Pt) and anion exchange ionomer powder (AEI) (20 wt.% of the total solid mass) were mixed together with 1 mL mQ® water and 9 mL 2-propanol. The cathode catalyst ink was sonicated and sprayed onto a Toray TGP-H-60 carbon paper gas diffusion support (Alfa Aesar, non-teflonated), and dried in air. Anode: Pd@CeO2/C 20 wt.% AEI. The 5 cm2 GDEs were loaded with 0.25 ± 0.02 mg cm−2 Pd and 0.40 ± 0.02 mg cm−2 Pt for anode and cathode electrodes, respectively. The propanol used was 90%recycled.
AEI powder was made by irradiating ethylene-tetrafluoroethylene (ETFE) [15] that is then submerged in a water solution containing vinylbenzyl-chloride (VBC), 2-propanol and Surfadone LP-100 (Ashland, Rheinfall, Switzerland). After N2 purging and heating treatment at 60 °C, the resultant ETFE-g-poly (VBC) grafter powder was washed with toluene and subsequently submerged in a aqueous trimethylamine (TMA) solution. The product was recovered after numerous washing steps with water. ETFE was not present in SimaPRO, therefore, its synthesis was simulated using ethylene and tetrafluoroethylene as monomers. VBC was not present in SimaPRO, therefore its synthesis was simulated starting from toluene. N-Methyl-2-pyrrolidone has been used as a proxy for surfadone® (wetting agents Ashland Industries).
3.2. Membrane
The membrane is a thin polymer film located between the cathode and the anode; it is an ionic conductor and prevents the mixing of gases.
Scenario A: In PEMFCs, the membrane is usually a sulphonated fluoropolymer, like functionalised perfluoroethylene. The functionalisation imparts the ion exchange capacity, which in turn determines the relevant conduction properties. The ideal cationic polymer must have excellent proton conductivity, chemical and thermal stability, mechanical strength, flexibility, low gas permeability, low water drag, low cost, and good availability.
In this study, Nafion® membrane was adopted: a sulfonated perfluoroethylene-based fluoropolymer-copolymer produced since the late 1960s by DuPont de Nemours (now Chemours®,1007 Market Street P.O. Box 2047 Wilmington, Delaware 19899 USA). This cation-conducting polymer film exploits sulfonic acid groups. The polymer conductivity depends on its equivalent weight, hydration degree, and membrane pre-treatment. For instance, the conductivity drops by several orders of magnitude as the water content decreases. The Nafion perfluorinated-sulphonic acid (PFSA) membrane is produced via the co-polymerisation of an unsaturated perfluoroalkyl sulfonyl fluoride (PSF) with tetrafluoroethylene. In the Ecoinvent database the PSF is not present, so sulphuric acid was used as a proxy for the fluoride. The product manufacturing is represented by the “extrusion of plastic film” process. The relative amounts are 57.4 wt.% TFE to 42.6 wt.% PSF [16].
Scenario B: in AEMFCs, the most commonly used membranes are polymers functionalised by covalently bound cations that act as ion-exchange sites to transport a wide range of anions. In this study, the exploited anion exchange membrane is polyethylene-based. The process implies the irradiation of LDPE (Low Density Polyethylene) in air with an electron beam unit and then immersion in a vinylbenzyl chloride aqueous solution containing 1-octyl-2-pyrrolidone. The mixture is purged with N2 and the grafting process is performed at 40 °C. After a washing step with toluene, the intermediate membrane is submerged in a trimethylamine (TMA) aqueous solution. The resulting crude radiation grafted (RG) AEM is washed with ultrapure water and heated at 60 °C [17]. The last step is the immersion of the RG-AEM in aqueous NaCl for assuring the Cl− anion form of the membrane. VBC was not present in SimaPRO, for this reason his synthesis has been simulated starting from toluene. N-Methyl-2-pyrrolidone was used as a proxy for 1-octyl-2-pyrrolidone.
3.3. Gas Diffusion Layer (GDL)
The GDL plays a very important role in PEMFC, deeply affecting the relevant performances [18]. GDL is usually based on carbon fibers or cloths, and its carefully designed structure has the role of:
- providing a physical micro-porous support for the catalyst layer;
- allowing the reactant gas flow to the catalyst layer;
- assisting in the removal of the produced water from the reaction sites;
- have low electric resistance, i.e., provide an easy path to both electrons and ions, and low contact resistance at the various interfaces.
The excess of liquid water in the cathode layer can negatively affect the cell on a microscopic scale, liquid water covers the catalyst particles, thereby increasing the mass transfer resistance and reducing oxygen access to the catalyst sites. Macroscopically, liquid water may fill the pore network within the gas diffusion layer support and hinder the effective oxygen diffusion through the layer. Hence, a hydrophobic treatment of GDL is necessary to prevent water flooding and facilitate oxygen transport at the cathode.
Scenario A: GDL has a two-layer structure (Figure 4): a microporous layer (MiPL) and a macroporous layer (MaPL) in sequence. The MiPL contains carbon black powder and hydrophobic agent (PTFE in this study). It primarily manages the two-phase water flow, so that water produced at the cathode reaches the membrane through the gas diffusion layer. The MiPL pore size must be smaller than the diameter of the catalyst particles. The MaPL is in contact with the gas flow duct, acting as both gas distributor and current collector.
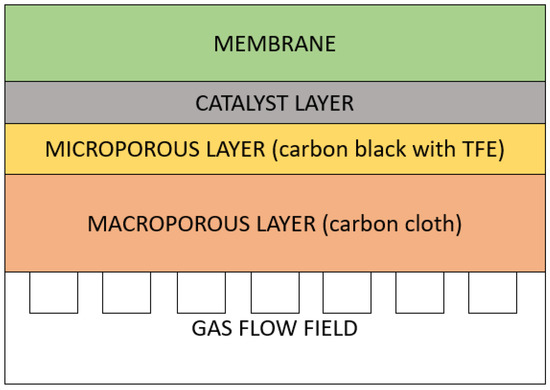
Figure 4.
Scenario A structure of the membrane electrode assemblies (MEA) focusing on the gas diffusion layer (GDL) components.
In this study, in lieu of the MaPL woven carbon cloth, not present in SimaPRO, a carbon fibre tissue in polyacrylonitrile [19] has been used as a proxy; hence the energy consumption of the weaving process for obtaining the cloth from the fibre is omitted, since unlike carbon paper, it does not need a resin binder. The hydrophobic agent (PTFE) is applied also at the MaPL by dipping the cloth into an aqueous PTFE solution, followed by drying and sintering [2]. In SimaPRO, thermoforming process is used to account for this procedure.
Scenario B: Toray TGP-H-60 carbon paper gas diffusion substrate (Alfa Aesar, non-teflonated). In SimaPRO simulation, a carbon fibre made with polyacrylonitrile has been used as a proxy. On this assumption, the energy consumption of the weaving process for obtaining the cloth from the fibre is omitted.
3.4. Membrane Electrode Assemblies (MEA)
Scenario A: the membrane electrode assembly was performed by hot-pressing the membrane to the GDL, the catalyst ink being already deposited on the GDL in order to achieve the optimal surface area. The hot-pressing operation was accounted for in SimaPRO exploiting the “thermoforming” process. The cell components were assembled under controlled compressive loads. If the compression was not sufficiently high, gas leakage would occur, causing poor performance and leading to potentially dangerous situations; while over-compressing the GDL increases mass transfer resistance, thus decreasing cell performance [16].
Scenario B (Figure 5): all electrodes and AEMs were immersed in aqueous KOH solution and then washed thoroughly in water before assembling into a 5 cm2 fuel cell fixture using 5 Nm torque.
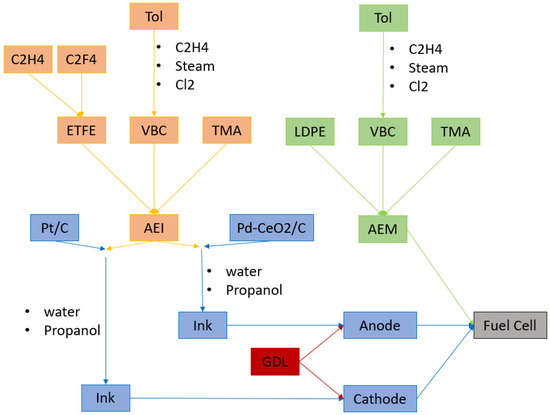
Figure 5.
Scenario B: Scheme of the fuel cell preparation, focusing on the anion exchange ionomer (AEI) and anion exchange membrane (AEM). Since ethylene-tetrafluoroethylene (ETFE) and vinyl benzyl chloride (VBC) are not present in the database, a synthesis, based on literature, has been simulated on SimaPRO: ETFE is obtained by polymerization of ethylene and tetrafluoro-ethylene, VBC is synthetized starting from Toluene (Tol).
3.5. Bi-Polar Plates
The bipolar plates (BPs) have a key role in the PEMFC stack, and account for about 80% of total weight and 45% of stack costs [19]. BPs have to:
- help the distribution of fuel and oxidant within the cell;
- facilitate heat and water management;
- separate individual cells in the stack;
- carry electrical current.
BP materials are broadly divided into metallic and carbon-based. Graphite is widely used thanks to its corrosion resistance, low interfacial contact resistance and poisoning resistance. Graphite drawbacks are gas permeability and poor mechanical properties. In the case of metal BPs, the main problem is corrosion. For this reason, stainless steel and titanium are widely used thanks to the protective oxide film which is formed in the presence of oxygen [20,21]. In this study BPs are 1.3 mm thick stainless-steel plates with a graphite and titanium coating. The first and last cells of the fuel cell stack will each need a plate of the same composition and fulfilling the same role as the bi-polar plates but without bi-polarity need. These two plates are accounted as the equivalent of one bi-polar plate [6]. The production process is simulated in SimaPRO exploiting the inventory data: “selective coat, sputter deposition”.
3.6. Collector/End Plates and Tie Rods
The end plates at the outer sides of the stack provide the proper pressure, and are compressed using specific connecting techniques such as tie-rods. These components must exhibit good mechanical resistance and be electrochemically stable. In most cases, end plates are made of aluminum, titanium and stainless-steel alloys [22]. In this work, the end plates were 10 mm-thick aluminum alloy and the tie-rods are 10 mm-diameter stainless steel. Each stack needed eight tie-rods.
4. Results
In order to have a correct interpretation of the LCA results, a sensitivity analysis is mandatory, especially if the process is under optimization and several variables have significant uncertainties, see e.g., Scenario B. A one-at-a-time (AOT) approach was adopted, by varying one at a time the input parameters that could sensibly affect the final result. For this reason, the sensitivity analysis was performed on key elements, i.e., platinum catalyst and the components with high uncertainty values, solvents and the energy consumption of the synthesis step in Scenario B [23].
4.1. Fuel Cell Testing
The operating conditions (Table 2) are mild for both cells: temperature is very similar, while PEMFC works at higher pressure. Current density is fixed at 1 A/cm2. The voltage is slightly higher for the PEMFC even though a larger amount of Pt is used in the AEMFC cathode.
Table 2.
Operating conditions and outputs of the tested fuel cell. For Scenario A the complete stack has been tested, for scenario B only a single cell.
4.2. Hot Spots in Fuel Cell Stack Scenario A
The complete PEMFC stack has been simulated in SimaPRO in order to highlight the contribution of MEA with respect to the other stack components, see Figure 6. In particular, MEA heavily affects “Acidification”, “Ozone Layer Depletion”, and exhibits a consistent impact also on “Global Warming”. The other components that have an impact comparable to MEA are the bi-polar plates, specifically on “Human toxicity”, “Terrestrial Ecotoxicity” and “Land Competition”. As concerns MEA, the element that leads to its high impact is the platinum content of the catalyst layer. In the case of the bi-polar plates, the considerable impact is related to the huge amount of steel employed.

Figure 6.
Impact of PEMFC components on the 11 impact categories. AD = Abiotic Depletion (elem., reverse base); LC = Land Competition; HTP = Human Toxicity Potential 100a; FAETP = Freshwater Aquatic Eco Toxicity Potential 100a; MAETP = Marine Aquatic Eco Toxicity Potential 100a; TETP = Terrestrial Eco Toxicity Potential 100a; AP = Acidification Potential (fate not incl.); EP = Eutrophication Potential (incl. fate); IR = Ionising Radiation; OLD = Ozone Layer Depletion (including NMVOC average); GWP = Global Warming Potential 100a (incl. NMVOC av.).
In AEMFC, see Figure 7, cathode has a major influence for all the analysed impact categories, and, together with the anode, accounts for almost the total environmental impact: 80% of the impact is given by the Pt/C cathode @0.4 mg/cm2 loading and 10% by the Pd@CeO2/C used in the anode (Pd loading 0.25 mg/cm2). The propanol, used in the electrode’s assembly, impacts for 5%, assuming a recycling of 90%. Without recycling, its impact on global warming would be 34%. The Ozone Layer Depletion (OLD) is also mostly influenced by Pt, Pd and propanol, together with the anion exchange ionomer (34%), due to presence of tetrafluoroethylene in its synthetic pathway. The noble metal content (Pt and Pd) represents the main contribution to the high impact of cathode and anode.

Figure 7.
Impact of AEMFC components on the midpoint impact categories. AD = Abioti Depletion (elem., reverse base); LC = Land Competition; HTP = Human Toxicity Potential 100a; FAETP = Freshwater Aquatic Eco Toxicity Potential 100a; MAETP = Marine Aquatic Eco Toxicity Potential 100a; TETP = Terrestrial Eco Toxicity Potential 100a; AP = Acidification Potential (fate not incl.); EP = Eutrophication Potential (incl. fate); IR = Ionising Radiation; OLD = Ozone Layer Depletion (incl. NMVOC av.); GWP = Global Warming Potential 100a (incl. NMVOC av.).
4.3. Monte Carlo Analysis
In Scenario B complete sensitivity analysis has been performed, not only with a one at a time approach, but also with a global method, i.e., via Monte Carlo analysis. With this approach, the software selects a random variable for each value within the uncertainty range and recalculates the results. This procedure is repeated at least 1000 times. For some impact categories, like Global Warming (Figure 8), the uncertainty obtained is acceptable, because most of the values fall into the 95% confidence interval. In other cases, like Ionizing Radiation, the uncertainty is rather high.
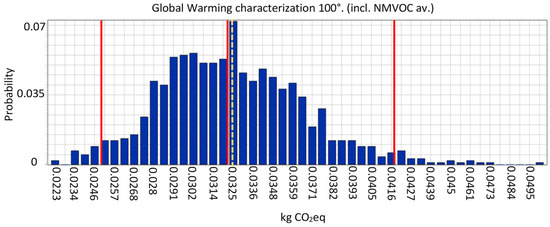
Figure 8.
Monte Carlo graphical representation of distribution for the impact category “Global warming”. The horizontal axis displays the value of the calculation, the vertical axis displays the probability that a certain value is reached. The first and the last red lines represent the boundaries of the 95% confidence interval. The dotted orange line and the red line next to it are respectively the mean and the median values.
4.4. Comparison between Proton Exchange Membrane Fuel Cells (PEMFC) and Anion-Exchange Membrane Fuel Cells (AEMFC)
For comparing acid and alkaline cells (see Figure 9), the current density has been fixed ad 1 A/cm2. PEMFC exhibited a maximum voltage of 0.69 V, higher than the 0.56 V exhibited by the AEMFC. PEMFC also shows power values higher than AEMFC, due to the large difference in the cell size; nonetheless, this factor is compensated for by the different amount of substances needed for the MEA.
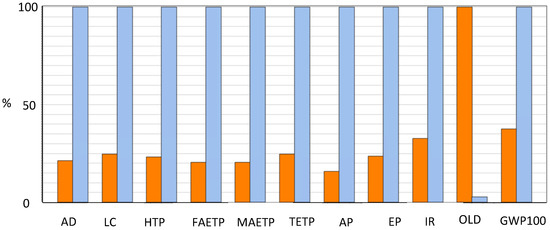
Figure 9.
Midpoint indicators for PEMFC (Orange) and AEMFC (Light blue). AD = Abiotic Depletion (for elements, reverse base); LC = Land Competition; HTP = Human Toxicity Potential 100a; FAETP = Freshwater Aquatic Eco Toxicity Potential 100a; MAETP = Marine Aquatic Eco Toxicity Potential 100a; TETP = Terrestrial Eco Toxicity Potential 100a; AP = Acidification Potential (fate not incl.); EP = Eutrophication Potential (incl. fate); IR = Ionising Radiation; OLD = Ozone Layer Depletion (incl. NMVOC av.); GWP = Global Warming Potential 100a (incl. NMVOC av.).
4.5. Ozone Layer Depletion (OLD)
This impact category is analysed in order to understand why it is the only category for which PEMFC impacts more than AEMFC. As discussed in the previous section, this category is primarily influenced by GDL and membrane, with a relevant effect in Scenario A. Consequently, the presence of TFE impacts for 99% in OLD. In the database, TFE is obtained by chlorodifluoromethane, a class II ozone-depleting substance.
4.6. Scenario C
The cathode employed in Scenario B has a very high amount of platinum, since it was used for the fuel cell tests focusing on the Pd anode. Therefore, in Scenario C, the cathode of Scenario A is used in the AEMFC with a Pt loading of 0.15 mg/cm2. This cathode has a Pt content lower than that exploited in Scenario B, hence the impact of the AEMFC is greatly reduced. Nonetheless, also for Scenario C, AEMFC impact is higher than for PEMFC for 10 out of 11 impact categories, see Figure 10.

Figure 10.
Midpoint indicators: comparison between PEMFC Scenario A (Orange), AEMFC Scenario B (Light blue) and AEMFC Scenario C (Green). AD = Abioti Depletion (elem., reverse base); LC = Land Competition; HTP = Human Toxicity Potential 100a; FAETP = Freshwater Aquatic Eco Toxicity Potential 100a; MAETP = Marine Aquatic Eco Toxicity Potential 100a; TETP = Terrestrial Eco Toxicity Potential 100a; AP = Acidification Potential (fate not incl.); EP = Eutrophication Potential (incl. fate); IR = Ionising Radiation; OLD = Ozone Layer Depletion (incl. NMVOC av.); GWP = Global Warming Potential 100a (incl. NMVOC av.).
4.7. Normalization
The results obtained for each impact category have different measure units. For this reason, a normalization step is required. This operation consists in dividing the impact categories values by a reference value. The latter is related to the normalization factor, which, for this study, was chosen to be EU25, i.e., the reference value is the average environmental load in 25 European countries in 2006, divided by the total number of inhabitants.
Figure 11 shows that for all the analysed fuel cells, the environmental load is mainly caused by three impact categories: Freshwater aquatic ecotoxicity, Marine aquatic ecotoxicity and Acidification. In Scenario C, the marine aquatic ecotoxity impact is given for more than 50% by the sulfidic tailling wasting process necessary for Zambia’s platinum extraction.
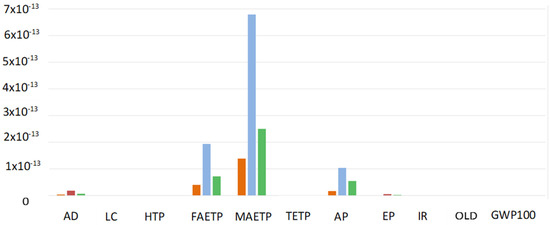
Figure 11.
Normalized midpoint indicators: comparison between PEMFC Scenario A (Orange), AEMFC Scenario B (Light blue) and AEMFC Scenario C (Green). AD = Abiotic Depletion (elem., reverse base); LC = Land Competition; HTP = Human Toxicity Potential 100a; FAETP = Freshwater Aquatic Eco Toxicity Potential 100a; MAETP = Marine Aquatic Eco Toxicity Potential 100a; TETP = Terrestrial Eco Toxicity Potential 100a; AP = Acidification Potential (fate not incl.); EP = Eutrophication Potential (incl. fate); IR = Ionising Radiation; OLD = Ozone Layer Depletion (incl. NMVOC av.); GWP = Global Warming Potential 100a (incl. NMVOC av.).
5. Discussion
5.1. Impact Categories Survey
The analysis performed on PEMFC confirmed that MEA and bi-polar plates are the components with the higher environmental impact. The use of platinum in the catalyst layer is an issue that must be addressed for improving PEMFC impact and costs. As for the comparison between the two fuel cells, Figure 10 clearly shows that AEMFCs have a significantly higher impact than PEMFC in 10 out of 11 midpoint impact categories. Keeping in mind that the catalyst has the major contribution for almost all impact categories, the different values for the two cells are easily explained by underlining that the AEMFC cathode has a Pt loading of 0.4 mg/cm2, whereas in PEMFC it is 0.15 mg/cm2 for both cathode and anode. The only midpoint indicator in which PEMFC has a higher impact is “Ozone layer depletion”, in fact, as is evidenced in Figure 6, this indicator is mostly affected by the GDL and the membrane. As concerns the gas diffusion layer, qualitatively it does not significantly differ, since both cells use carbon cloth. Nonetheless, there is a quantitatively huge discrepancy: in PEMFC the weight of the GDL is ≈140 times higher than that of the catalysts, on the other hand in AEMFC the GDL’s weight is only ≈4 times higher with respect to the catalyst. A similar reasoning is applicable to the membrane, which, in turn, differs also qualitatively, nonetheless the quantitative factor may still be the dominant one. In fact, in MEA Scenario A the membrane weight is ≈39 times the catalyst weight. Whereas in the MEA Scenario B membrane weight is ≈0.4 times with respect to the catalyst’s weight. In Section 4.5, it was shown that in Scenario A tetrafluoroethylene is the substance with the highest influence on OLD. TFE impact is bound to his synthetic pathway, since it is mainly obtained from chlorodifluoromethane. This hydrochlorofluorocarbon has an atmospheric lifetime of 12.1 years, and even though its impact on OLD is significantly lower with respect to chlorofluorocarbons it is classified as a class II ozone-depleting substance [24].
The normalization of the midpoint indicators reveals that the aquatic marine ecotoxicity is the most concerning environmental load for all the analysed fuel cells. The impact on this category is given mostly by the sulfidic tailing processes which occurs during the platinum extraction. Therefore, this is a further indicator supporting the statement that the platinum amount reduction has the priority for the improvement of all cells.
5.2. Conclusions
Scenario B is based on a lab scale synthesis and preliminary FC tests. Therefore, there are still large possibilities to minimize the AEMFC impact. The one-at-a-time sensitivity analysis underlines that a special focus on solvent nature, amount and recycling are required. The key route for reducing the fuel cells environmental load is bound to achieving better performances while reducing the noble metal load.
This gate-to-gate study represents the first stage of a life-cycle analysis. The analysis will be further extended by considering a use phase and performing an end of life scenario.
As concerns scenario A, Simons and Bauer propose different solution for the optimization of PEMFC like the reduction of platinum employed and the substitution of the chromium steel (plate material of bi-polar plates) with graphite. Another possible upgrade of Scenario A resulting from this study is about the impact on “Ozone layer depletion” from the membrane and GDL. A reduction of this impact could be done by susbstituting tetrafluoroethylene with a greener compound.
Author Contributions
Conceptualization, S.R. and S.M.; methodology, M.C.; software, S.M. and M.C.; validation, S.R., A.V., A.M. formal analysis, S.M. & M.C.; investigation, S.R. & S.M.; resources, S.R., A.V., A.M.; data curation, S.M. and M.C.; writing—original draft preparation, S.M. and M.C.; writing—review and editing, S.R., A.V., A.M.; visualization, S.M. and M.C.; supervision, S.R.; project administration, S.R.; funding acquisition, S.R. All authors have read and agreed to the published version of the manuscript.
Funding
This research was funded by Miur-PRIN 2017, Prot. 2017YH9MRK and by The University of Milan (Italy).
Acknowledgments
The contribution of Miur-PRIN 2017, Prot. 2017YH9MRK: “Novel Multilayered and Micro-Machined Electrode Nano-Architectures for Electrocatalytic Applications (Fuel Cells and Electrolyzers)”, is gratefully acknowledged.
Conflicts of Interest
The authors declare no conflict of interest. The funders had no role in the design of the study; in the collection, analyses, or interpretation of data; in the writing of the manuscript, or in the decision to publish the results.
References
- Duclos, L.; Chattot, R.; Dubau, L.; Thivel, P.-X.; Mandil, G.; Laforest, V.; Bolloli, M.; Vincent, R.; Svecova, L. Closing the loop: Life cycle assessment and optimization of a PEMFC platinum-based catalyst recycling process. Green Chem. 2020, 22, 1919–1933. [Google Scholar] [CrossRef]
- Arges, C.G.; Ramani, V.; Pintauro, P.N. Anion Exchange Membrane Fuel Cells. Interface; The Electrochemical Society: Pennington, NJ, USA, 2010. [Google Scholar]
- Durst, J.; Siebel, A.; Simon, C.; Hasché, F.; Herranz, J.; Gasteiger, H.A. New insights into the electrochemical hydrogen oxidation and evolution reaction mechanism. Energy Environ. Sci. 2014, 7, 2255–2260. [Google Scholar] [CrossRef] [Green Version]
- Bellini, M.; Pagliaro, M.V.; Lenarda, A.; Fornasiero, P.; Marelli, M.; Evangelisti, C.; Innocenti, M.; Jia, Q.; Mukerjee, S.; Jankovic, J.; et al. Palladium–Ceria Catalysts with Enhanced Alkaline Hydrogen Oxidation Activity for Anion Exchange Membrane Fuel Cells. ACS Appl. Energy Mater. 2019, 2, 4999–5008. [Google Scholar] [CrossRef]
- Miller, H.A.; Lavacchi, A.; Vizza, F.; Marelli, M.; di Benedetto, F.; D’Acapito, F.; Paska, Y.; Page, M.; Dekel, D.R. A Pd/C-CeO2 Anode Catalyst for High-Performance Platinum-Free Anion Exchange Membrane Fuel Cells. Angew. Chem. Int. Ed. 2016, 55, 6004–6007. [Google Scholar] [CrossRef] [PubMed]
- Su, Y.-Q.; Filot, I.A.W.; Liu, J.-X.; Hensen, E.J.M. Stable Pd-Doped Ceria Structures for CH4 Activation and CO Oxidation. ACS Catal. 2018, 8, 75–80. [Google Scholar] [CrossRef] [PubMed] [Green Version]
- Jerkiewicz, G. Electrochemical Hydrogen Adsorption and Absorption. Part 1: Under-potential Deposition of HydrogenElectrocatalysis. Electrocatalysis 2010, 1, 179–199. [Google Scholar] [CrossRef]
- Simons, A.; Bauer, C. A life-cycle perspective on automotive fuel cells. Appl. Energy 2015, 157, 884–896. [Google Scholar] [CrossRef]
- Civelli, M. Comparative Life Cycle Assessment of Acid and Alkaline Fuel Cells. Master’s Thesis, The University of Milan, Milano, Italy, 29 June 2020. [Google Scholar]
- Masoni, P.; Zamagni, A. Guidance Document for Performing LCA on Fuel Cells. Project Deliverable for Fuel Cell and Hydrogen—Joint Undertaking. FC-Hy Guide. Available online: http://hytechcycling.eu/wp-content/uploads/FC-Guidance-Document.pdf (accessed on 5 February 2020).
- ILCD International Life Cycle Data system, European Platform on Life Cycle Assessment; Publications Office of the European Union: Luxembourg, 2012.
- EC JRC. General Guide for Life Cycle Assessment—Detailed Guidance; Publications Office of the European Union: Luxembourg, 2010. [Google Scholar]
- ISO 14040. International Standard Assessment—Principles and Framework. Available online: https://www.iso.org/obp/ui#iso:std:iso:14040:ed-2:v1:en (accessed on 31 October 2019).
- CML-IA Baseline Version 3.04, in CML-IA Database. Department of Industrial Ecology, The University of Leiden: Leiden, The Netherlands. Available online: https://www.universiteitleiden.nl/en/research/research-output/science/cml-ia-characterisation-factors (accessed on 31 October 2019).
- Poynton, S.D.; Slade, R.C.T.; Omasta, T.J.; Mustain, W.E.; Escudero-Cid, R.; Ocón, P.; Varco, J.R. Preparation of radiation-grafted powders for use as anion exchange ionomers in alkaline polymer electrolyte fuel cells. J. Mater. Chem. A 2014, 2, 5124–5130. [Google Scholar] [CrossRef] [Green Version]
- Zhang, H.; Wang, X.; Zhang, J.; Zhang, J. Conventional Catalyst Ink, Catalyst Layer and MEA Preparation. In PEM Fuel Cell Electrocatalysts and Catalyst Layers; Springer: London, UK, 2008. [Google Scholar]
- Wang, L.; Bellini, M.; Miller, H.A.; Varcoe, J.R. A high conductivity ultrathin anion-exchange membrane with 500+ h alkali stability for use in alkaline membrane fuel cells that can achieve 2 W cm−2 at 80 °C. J. Mater. Chem. A 2018, 6, 15404–15412. [Google Scholar] [CrossRef] [Green Version]
- Ge, J.; Higier, A.; Liu, H. Effect of gas diffusion layer compression on PEM fuel cell performance. J. Power Sources 2006, 159, 922–927. [Google Scholar] [CrossRef]
- Sahu, A.K.; Pitchumani, S.; Sridhar, P.; Shukla, A.K. Nafion and modified-Nafion membranes for polymer electrolyte fuel cells: An overview. Bull. Mater. Sci. 2009, 32, 285–294. [Google Scholar] [CrossRef]
- Hermann, A.; Chaudhuri, T.; Spagnol, P. Bipolar plates for PEM fuel cells: A review. Int. J. Hydrogen. Energy 2005, 30, 1297–1302. [Google Scholar] [CrossRef]
- Karimi, S.; Fraser, N.; Roberts, B.; Foulkes, F.R. A review of metallic bipolar plates for proton exchange membrane fuel cells: Materials and fabrication methods. Adv. Mater. Sci. Eng. 2012, 2012, 828070. [Google Scholar] [CrossRef] [Green Version]
- James, B.D.; Huia-Houadio, J.; Houchins, C.; Desantis, D. Mass Production Cost Estimation of Direct H2 PEM Fuel Cell Systems for Transportation Applications: 2017 Update; Technical Report; Strategic Analysis Inc.: Arlington, VA, USA, 2017. [Google Scholar]
- LCD International. Available online: https://eplca.jrc.ec.europa.eu/ (accessed on 31 October 2019).
- European Union Risk Assessment Report Chlorodifluoromethane; CAS-No. 75-45-6 EINECS, No: 200-871-9, Risk Assessment; Publications Office of the European Union: Luxembourg, 2007.
Publisher’s Note: MDPI stays neutral with regard to jurisdictional claims in published maps and institutional affiliations. |
© 2021 by the authors. Licensee MDPI, Basel, Switzerland. This article is an open access article distributed under the terms and conditions of the Creative Commons Attribution (CC BY) license (https://creativecommons.org/licenses/by/4.0/).