1. Introduction
With rapid urbanization, urban habitat fragmentation and artificialization have intensified. These changes expose pollinating insects to multiple stressors, including habitat loss and food shortages, resulting in global declines in pollinator population size and diversity [
1]. Flower-visiting bees and butterflies serve as key pollinator groups in urban ecosystems. Their diversity influences natural plant community renewal and ecosystem stability [
2] and serves as an important indicator of urban biodiversity conservation [
3].
Internationally, research on urban pollinator conservation has been systematically conducted since the 1990s [
4]. Relevant studies demonstrate that urban parks serve as vital conservation habitats for pollinators [
4]. Under certain conditions, wild bee richness and abundance can approach natural levels in urban parks [
5]. However, different types of urban green spaces do not provide equal support for pollinators, as significant differences exist in pollinator community composition among parks, community gardens, and remnant natural areas [
6]. The shrub–herb layer provides primary foraging and habitat resources for bees and butterflies [
7]. Floral richness acts as a key driver of urban bee communities, whereas the warming effect induced by urbanization may reduce bee abundance [
8]. In China, research on urban pollinator conservation started relatively late, with existing literature primarily focusing on temperate and northern subtropical cities such as Beijing and Shanghai. These studies have conducted regional baseline surveys, screened nectar plants attracting bees and butterflies, and established corresponding evaluation systems. For instance, a study on flower-visiting Hymenoptera (e.g., bees) in the urban planning area of Beijing revealed their important indicator role in pollination and ecosystem services, emphasizing the conservation value of urban green spaces for these insects [
3]. Studies on urban parks in Fuzhou and Hefei further confirmed the supporting role of urban green spaces for butterfly communities and explored the impacts of urbanization on butterfly taxonomic and functional diversity [
9,
10,
11]. Notably, similar international research has also indicated that urbanization often leads to the taxonomic and functional homogenization of butterfly communities [
12], whereas wild bee communities display differential responses at phylogenetic, functional, and taxonomic levels along urbanization gradients [
13], providing an important reference for understanding pollinator diversity patterns in Chinese cities.
Domestic and international research has primarily focused on plant–pollinator interaction networks in natural and semi-natural habitats of temperate regions and pollinator corridor designs in agricultural landscapes. However, tropical and subtropical urban ecosystems remain understudied [
14]. A global review of urban plant–pollinator interactions demonstrated that studies in temperate regions overwhelmingly predominate, whereas tropical urban ecosystems remain understudied [
15]; a meta-analysis of pollination services and biological control similarly confirmed that over two-thirds of studies originate from temperate zones, despite the larger area of tropical agricultural land [
16]. An evidence map on temperate plant traits supporting pollination indicated that existing conclusions rely heavily on temperate climatic conditions and specific pollinator community structures, making them difficult to directly transfer to urban green spaces in subtropical South China [
17]. At the evaluation indicator level, current research focuses heavily on floral ornamental value, flowering duration, and visitation frequency, with fewer studies incorporating practical landscape implementation metrics such as heat and humidity tolerance, stress resistance, and maintenance costs [
15]. Trait matching has been recognized as a core framework for constructing pollinator-friendly urban green spaces, where precise matching between plants and pollinators in phenological, morphological, and physiological traits is crucial for maintaining stable mutualistic networks [
18]; nevertheless, relevant applied research remains limited.
Currently, major methods for plant cultivar evaluation include the Analytic Hierarchy Process (AHP) [
19], Fuzzy Mathematics [
20], Grey Relational Analysis [
21], Cluster Analysis [
22], Discriminant Analysis [
23], and TOPSIS [
24]. These methods are constructed based on distinct mathematical principles to address core evaluation needs, such as determining indicator weights, handling uncertainty, and ranking classifications. The method adopted in this study is the Analytic Hierarchy Process (AHP). AHP is a structured decision-making technique based on mathematics and psychology [
25]. It decomposes complex problems into a hierarchical structure and constructs pairwise comparison judgment matrices using a 1–9 scale. Weight vectors are then derived via the eigenvalue method, and consistency checks are performed to convert qualitative judgments into quantitative priorities. By integrating qualitative and quantitative evaluations based on quantified specific indicators, AHP objectively enhances the validity of evaluation results and is suitable for multi-factor comprehensive evaluations [
26]. Consequently, it effectively addresses practical challenges such as the vast number of candidate nectar plant species, complex evaluation indicators, and the difficulty of quantifying certain metrics.
As a typical subtropical city in South China, Guangzhou possesses favorable hygrothermal conditions and abundant park green spaces, providing natural advantages for conserving pollinating insects such as bees and butterflies. However, current landscape configurations are predominantly oriented toward human aesthetic preferences, leading to an underutilization of native nectar plants and simplified plant community structures that fail to effectively support the full life-cycle requirements of pollinators [
27]. Studies have pointed out that while urban green spaces hold immense conservation potential for pollinators such as bees, this potential must be realized through meticulously planned plant configurations rather than a mere listing of species [
28,
29].
To address these gaps, this study first synthesized domestic and international research and identified candidate nectar plants through literature analysis. Subsequently, a systematic four-season field survey was conducted across five representative urban parks in Guangzhou to establish an evaluation framework tailored to local green spaces. The AHP was then applied to score and evaluate plant species to screen core dominant species, providing technical support for the construction of bee- and butterfly-friendly landscapes in South China.
2. Materials and Methods
This study adopted a technical route combining literature analysis, field surveys, and the Analytic Hierarchy Process (AHP) to systematically evaluate and screen bee- and butterfly-friendly shrub and herbaceous plants in Guangzhou’s urban parks. First, literature analysis was employed to review domestic and international research progress on pollinator conservation and nectar plant evaluation. Inventories of common garden shrub and herbaceous plants and local bee and butterfly species in South China were also compiled to establish the research methodology and evaluation indicator framework. Second, five representative urban parks in Guangzhou were selected, where survey quadrats were set up across six mainstream shrub and herbaceous planting patterns; synchronized quarterly surveys of plant communities and flower-visiting bees and butterflies were subsequently conducted throughout the year to acquire baseline species and behavioral data. On this basis, aligned with the application needs of urban green spaces, a comprehensive evaluation system encompassing four dimensions—ornamental value, bee and butterfly attractiveness, ecological adaptability, and flowering characteristics—was constructed, and the AHP was applied to determine indicator weights and compute species scores. Finally, statistical methods, including correlation analysis, were utilized to identify the core driving factors influencing flower-visiting behaviors, screen dominant nectar plants, and define management requirements for high-risk species, thereby providing technical support for the construction of local bee- and butterfly-friendly landscapes.
2.1. Experimental Materials
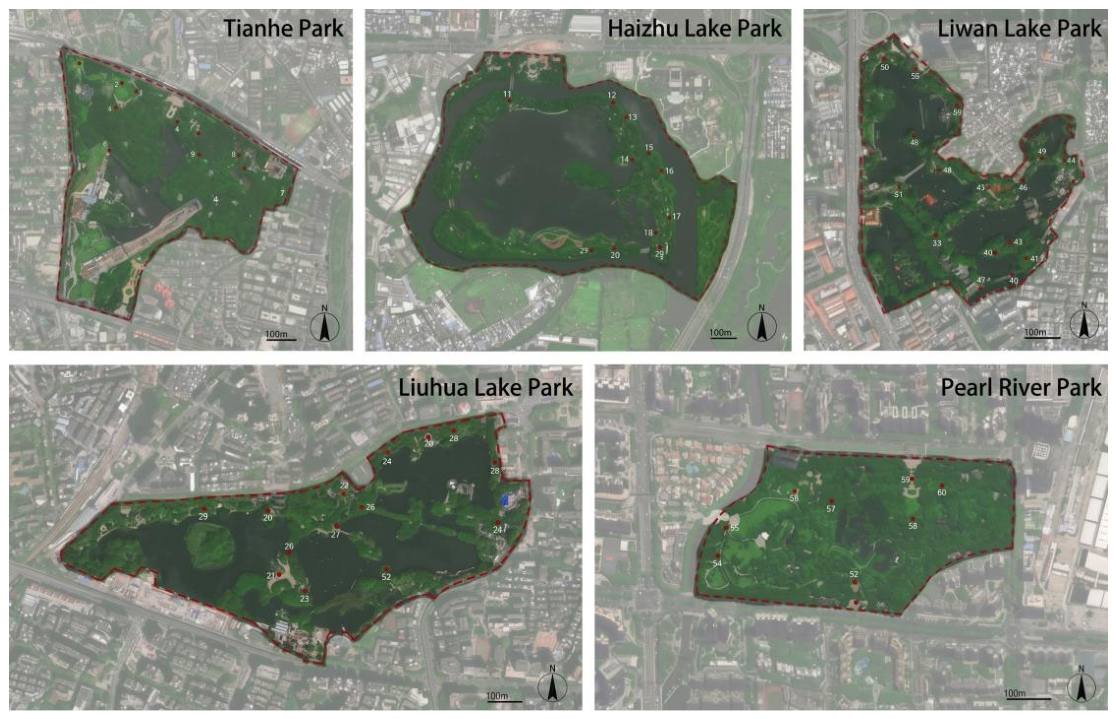
Guangzhou is located in the Pearl River Delta, bounded by the residual ranges of the Nanling Mountains to the north and adjacent to the South China Sea to the south. It features a subtropical monsoon climate influenced significantly by both maritime and continental factors. The annual average temperature in Guangzhou ranges between 21.7 °C and 23.1 °C. Rainfall resources are abundant, with an average annual precipitation of 1923 mm and an average of 149 precipitation days per year; sunshine hours are relatively long, with an annual mean sunshine duration of approximately 1879 h. Considering park location, establishment year, green space scale, vegetation types, and the representativeness of planting patterns, five representative urban parks in Guangzhou—Liuhuahu Park, Liwanhu Park, Tianhe Park, Haizhu Lake Park, and Zhujiang Park (
Figure 1)—were selected as research sites. These sites encompass the mainstream shrub and herbaceous planting patterns as well as landscape types of Guangzhou’s urban parks, possessing high regional representativeness.
The experimental materials consisted of flowering plants recorded during field surveys within the shrub and herbaceous plant communities of the aforementioned parks. Through a year-long investigation, a total of 161 flowering plant species belonging to 139 genera and 66 families were recorded. From these, nectar plants with recorded visitation by bees and butterflies were screened as evaluation objects, including both shrubs and herbaceous plants. Among them, shrubs accounted for 70 species across 61 genera and 35 families, while herbaceous plants comprised 91 species across 79 genera and 37 families; native flowering plants accounted for 59 species across 55 genera and 40 families, whereas exotic flowering plants comprised 102 species across 87 genera and 44 families.
2.2. Experimental Methods
2.2.1. Field Sampling and Insect Observation Procedures
This study conducted a year-round survey from March 2025 to February 2026, with seasons divided according to Guangzhou’s climatic characteristics: spring (March–May), summer (June–August), autumn (September–November), and winter (December–February). In each park, surveys were carried out three times per season, resulting in a total of 60 surveys across the five parks (3 times × 4 seasons × 5 parks). Observations were performed on warm, sunny, and windless weekdays (9:00–17:00), avoiding public holidays. A stratified random sampling method was adopted for plot establishment. Specifically, plots were first stratified by six planting patterns (mixed clump, single-species clump, mixed mass, single-species mass, mixed row, and single-species row); within each stratum, plot locations were randomly selected, with a minimum spacing of 30 m between plots to ensure independence. A total of 60 permanent plots (25 m2 each) were established, with ten replicates assigned to each planting pattern. Within each plot, continuous observations lasted 30 min per survey. We recorded the species and abundance of flowering plants, and floral cover, as well as the species, individual counts, and flower visitation frequency of bees and butterflies. Flower visitation counting followed Technical guidelines for biodiversity monitoring—bees (HJ 710.13-2016). A valid visit was recorded each time an insect landed on a flower; consecutive landings were counted separately, and visits were recounted if an insect departed and returned or switched plant species.
Flower visitation counting followed Technical guidelines for biodiversity monitoring—bees (HJ 710.13-2016). A valid visit was recorded each time an insect landed on a flower. Consecutive landings on multiple flowers were counted separately according to actual landing events; visits were recounted if an insect departed and returned, and separate counts were applied when insects switched plant species. Bee and butterfly floral visitation abundance in this study was represented by the total visitation frequency within each plot over the 30-min observation period. Two indicators in the comprehensive evaluation system, bee and butterfly visitation frequency (C6) and visitor species richness of bees and butterflies (C7), were derived directly from these field observations. For C6, the annual total visitation frequency of a plant species was divided by its mean floral cover (%), and standardized to visits per 10 min. For C7, the metric referred to the total number of bee and butterfly species visiting the target plant across all plots within one year. All indicators were based on field measurements rather than literature records.
Bee identification mainly relied on Fauna Sinica, Insecta and online taxonomic databases. Butterflies were identified with reference to Butterflies of Guangzhou, Field Guide to Observing Butterflies, and Monograph of Chinese Butterflies. Specimens were collected or photographs were taken for species that could not be identified in situ. Subsequent verification and identification were completed by faculty specializing in entomology at South China Agricultural University to ensure accuracy and reliability of species data.
2.2.2. Selection and Measurement of Indicators
To screen shrub and herbaceous plant species conducive to bees and butterflies for urban parks in Guangzhou, this study established a comprehensive evaluation system for the landscape application of nectar plants. The system focused on the conservation requirements of pollinating bees and butterflies in urban habitats. It also considered the practical application characteristics of Guangzhou urban parks and the regional features of the south subtropical monsoon climate.
Construction of the hierarchical comprehensive evaluation model: A total of 14 specific indicators affecting the functional and ornamental value of nectar plants were selected through extensive literature review and expert consultation in relevant fields.
Ornamental indicators: Leaf shape, leaf color, flower color, flower size, and floral fragrance were assessed via field observations and literature records using standardized qualitative grading criteria.
Pollinator attraction indicators: Bee and butterfly visitation frequency was quantified through field quadrat surveys. The calculation formula was defined as the total number of bee and butterfly visits to a target plant within a 5 m × 5 m quadrat over a 30-min observation period, divided by the floral cover (%) of the plant, and finally standardized to visits per 10 min. The number of visiting bee and butterfly species was determined through systematic quadrat monitoring, representing the total richness of pollinator species recorded visiting the focal plant throughout the entire survey year.
Ecological adaptability indicators: Five traits including waterlogging tolerance, heat tolerance, shade tolerance, barren tolerance, and native status were comprehensively evaluated based on Flora of China, Flora of Guangdong, and in-situ growth performance of individual plants.
Flowering phenology indicators: Flowering duration was recorded as the continuous flowering days of each plant species based on year-round phenological observations. Flowering phase was scored according to the dominant flowering season of each species.
2.2.3. Construction of the Comprehensive Evaluation Model and Scoring Criteria
The established model consisted of four non-intersecting hierarchical layers: the target layer A (comprehensive evaluation of landscape application for nectar plants), the criterion layer B (four dimensions including ornamental value, bee and butterfly attraction, ecological adaptability, and flowering phenology), the indicator layer C (14 specific indicators such as leaf color, flower color, and waterlogging tolerance), and the bottom layer (plant species to be evaluated).
Based on the constructed hierarchical model, 20 experts in the fields of botany, landscape architecture, and entomology were invited to score all indicators at the indicator layer via the expert evaluation scoring method. A 1–9 ratio scale was adopted for scoring to establish judgment matrices, and the comprehensive evaluation model framework was established (
Table 1). The matrices were formulated by quantitatively characterizing the relative importance of each factor at the same hierarchy. Through pairwise comparison of all indicators to determine their relative importance, a total of five judgment matrices were constructed, including one A-B matrix and four B-C matrices. The weight value of each indicator was finally calculated using Yaahp software (version 10.0, Yaahp Software Co., Ltd., Taiyuan, China).
2.2.4. Calculation of Comprehensive Evaluation Scores
Yaahp software was used to calculate the maximum eigenvalue (λmax) and corresponding eigenvector for each of the five judgment matrices (A-B, B1-C, B2-C, B3-C, and B4-C) obtained from the expert questionnaires, based on which the initial weight of each indicator was determined. At the criterion layer, ecological adaptability exhibited the highest weight (0.5824), followed by pollinator attraction (0.2815), while ornamental value (0.0709) and flowering phenology (0.0652) had relatively lower weights (
Table 2). Subsequently, a consistency test was performed individually for each matrix. The results showed that the consistency ratio (CR) of all matrices was less than 0.1 (
Table 3), indicating a favorable consistency in experts’ judgments on the relative importance of indicators and verifying the validity of the obtained weights. In accordance with the established scoring criteria for the 14 indicators, each indicator was classified into three grades corresponding to scores of 1, 3, and 5. The same group of experts who completed the pairwise judgment matrices were invited to score each indicator of all evaluated plant species through questionnaire surveys. The weighted total score of each plant was calculated as the sum of the product of each indicator’s score and its corresponding weight. All plant species were then sorted in descending order based on their weighted total scores. According to the ranking results, shrub and herbaceous plant species with high comprehensive scores were screened as superior nectar plants suitable for popularization and application in Guangzhou urban parks.
3. Results
3.1. Consistency Test of the Judgment Matrix and Weight Calculation Results
In terms of criterion layer weights, the ranking was ecological adaptability (0.5824) > bee and butterfly attraction (0.2815) > ornamental value (0.0709) > flowering phenology (0.0652), as presented in the A-B hierarchical judgment matrix (
Table 4). The dominant weight of ecological adaptability indicated that under the local natural conditions of high temperature, high humidity, and barren soil in Guangzhou, the environmental adaptability of plants serves as the primary prerequisite for landscape application. Pollinator attraction ranked second, demonstrating that the pollination ecological benefits of nectar plants outweigh their pure ornamental functions. By contrast, the relatively low weights of ornamental value and flowering phenology revealed that the ecological functions of nectar plants should take precedence over single ornamental effects in urban green space construction.
At the indicator layer, the top five indicators in terms of weight were bee and butterfly visitation frequency (C6, 0.2252), heat tolerance (C9, 0.2044), barren tolerance (C11, 0.1473), waterlogging tolerance (C8, 0.1400), and flowering duration (C13, 0.0543). Bee and butterfly visitation frequency had the highest weight, reflecting that nectar quality (including nectar volume, pollen quantity, and sugar content) is the core indicator for evaluating the pollinator-friendliness of plants. The three ecological adaptability indicators (heat tolerance, barren tolerance, and waterlogging tolerance) collectively accounted for a total weight of 0.4917, further verifying the dominant role of ecological adaptability in plant selection for subtropical urban areas in South China.
Among ornamental indicators, flower color (C3, 0.4687, accounting for 66.1% of the total ornamental weight) and flower size (C4, 0.2406, accounting for 33.9% of the total ornamental weight) were the two most critical factors, which can be seen from the judgment matrix for ornamental value (
Table 5). This indicated that flower-related traits which can effectively enhance pollinator attraction are prioritized within ornamental evaluation. For pollinator attraction indicators, bee and butterfly visitation frequency (0.8) possessed a far higher weight than pollinator species richness (0.2), as illustrated in the judgment matrix for bee and butterfly attractiveness (
Table 6), suggesting that nectar quality is more important than pollinator species universality for nectar plants.
In terms of ecological adaptability indicators, the weight ranking was heat tolerance (0.3509) > barren tolerance (0.2529) > waterlogging tolerance (0.2404) > native status (0.0836) > shade tolerance (0.0723), which is highly consistent with the typical climatic characteristics of Guangzhou, including high summer temperature, barren soil, and abundant rainfall. In addition, all consistency ratio (CR) values of the judgment matrices were less than 0.1 (
Table 7), confirming the validity and reliability of the weight values at all hierarchical layers.
3.2. Screening of Nectar Source Plant Varieties
Through a year-long investigation across 60 shrub and herbaceous quadrats in five urban parks in Guangzhou, a total of 207 plant species belonging to 171 genera and 77 families were recorded, among which native plants accounted for 36.36% and exotic plants comprised 63.64%. Current planting configurations in park shrub and herbaceous communities predominantly emphasize landscape aesthetics, with extensive applications of ornamental foliage plants and species with long flowering periods. Asteraceae species were the most widely applied, whereas the overall application proportion of native plants remained low. The investigation identified 132 nectar plant species attracting bees and butterflies, accounting for 63.77% of the total recorded plant species; these included 127 species serving as bee nectar sources and 108 species as butterfly nectar sources. Broad-spectrum nectar plants were predominantly from Asteraceae, Verbenaceae, and Lamiaceae. Species such as Salvia farinacea Benth., Sphagneticola trilobata (L.) Pruski, and Ixora chinensis Lam. ranked among the top in both visitation frequency and the diversity of visiting insect species supported. Exotic species accounted for over 60% of all nectar plants, reflecting an insufficient reserve and application of native nectar species. Regarding flower-visiting insects, 35 bee species belonging to 7 families and 60 butterfly species belonging to 9 families were recorded. Apis cerana represented the dominant bee species, whereas Pieris rapae, Nacaduba kurava, and Papilio polytes were the dominant butterfly species. Both bee and butterfly communities exhibited a stronger preference for herbaceous and exotic plants, with a lower proportion of visitations to native plants.
In terms of comprehensive weighted scores, herbaceous nectar plants scored slightly higher overall than shrubs. Among shrubs, 43 species achieved scores above 3.5, of which native species accounted for 51.16% (22 species). Among herbaceous plants, 53 species scored above 3.5, with native species accounting for 26.41% (14 species). These results indicate that common superior nectar shrubs in landscape applications have a higher proportion of native species than nectar herbs; thus, native nectar herbs urgently require further development and application in landscape design. Among the top 20 species with the highest comprehensive scores (
Table 8), shrubs accounted for 30% (6 species), including
Duranta erecta L.,
Heptapleurum heptaphyllum (L.) Y. F. Deng,
Lantana camara L.,
Ixora chinensis Lam.,
Combretum indicum (L.) DeFilipps, and
Calliandra haematocephala Hassk., among which
D. erecta, H. heptaphyllum, and
I. chinensis are native species. Herbaceous plants accounted for 70% (14 species), such as
M. procumbens,
S. trilobata, and
Farfugium japonicum (L.) Kitam., among which six are native species (
M. procumbens,
F. japonicum,
Ageratum conyzoides L.,
Orthosiphon aristatus (Blume) Miq.,
Ruellia simplex C. Wright, and
Eupatorium fortunei Turcz.). This demonstrates that herbaceous plants constitute a higher proportion among species with superior overall performance. To better protect local characteristic flora and pollinator populations, native plants should be prioritized when constructing flower-visiting bee- and butterfly-friendly plant communities. Furthermore, it should be noted that although
S. trilobata,
L. camara,
Bidens pilosa L., and
Ipomoea cairica (L.) Sweet received high evaluation scores, they are invasive species that spread rapidly, displace native plant ecological niches, cause declines in plant and pollinator diversity, and homogenize pollination networks. Therefore, their application in landscapes, particularly in ecological parks, must be strictly avoided.
3.3. Construction of Bee- and Butterfly-Friendly Shrub and Herb Community Configuration Models Based on Screening Results
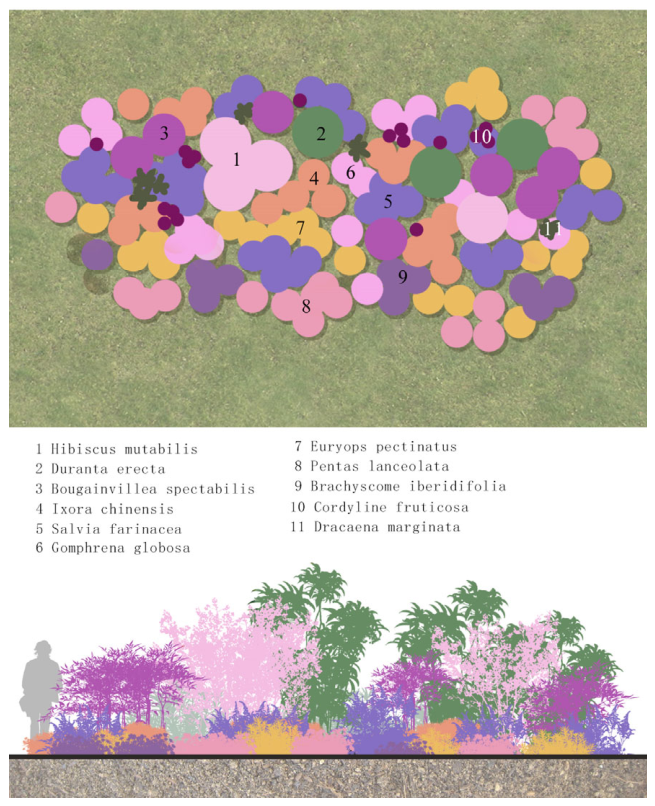
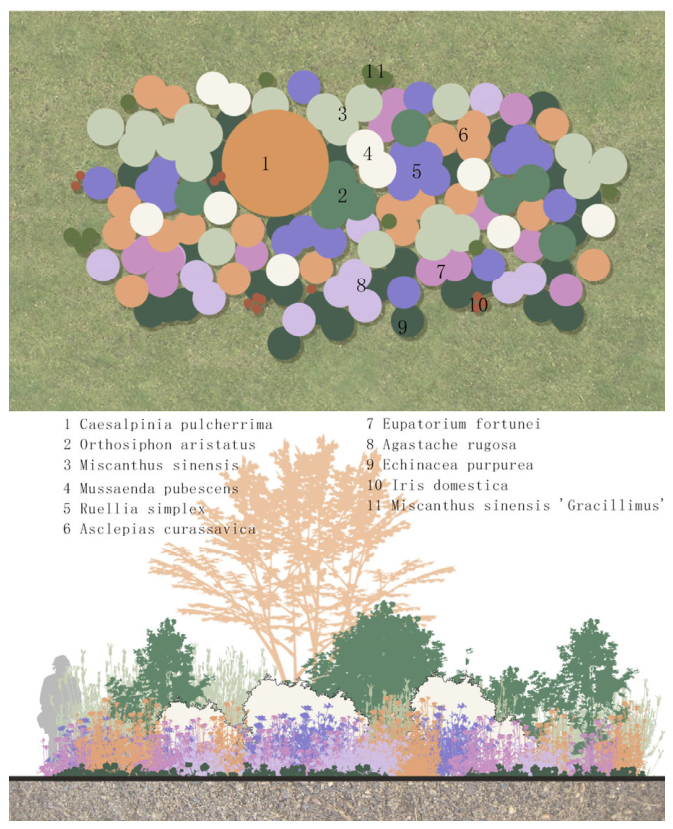
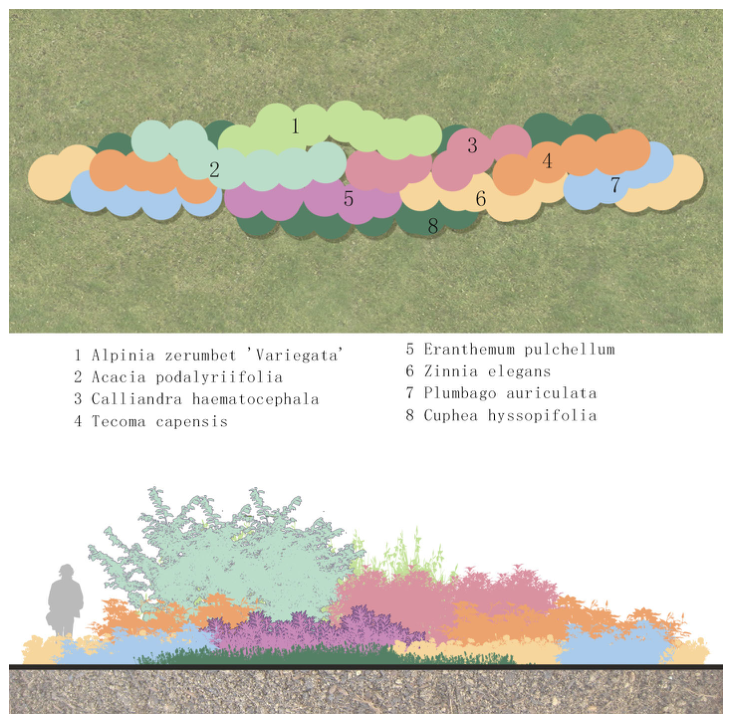
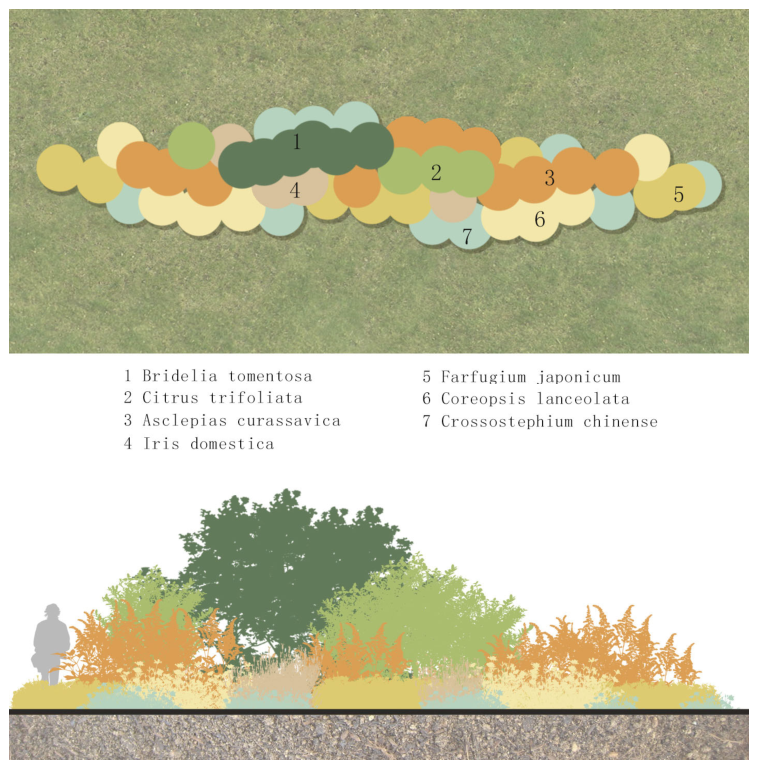
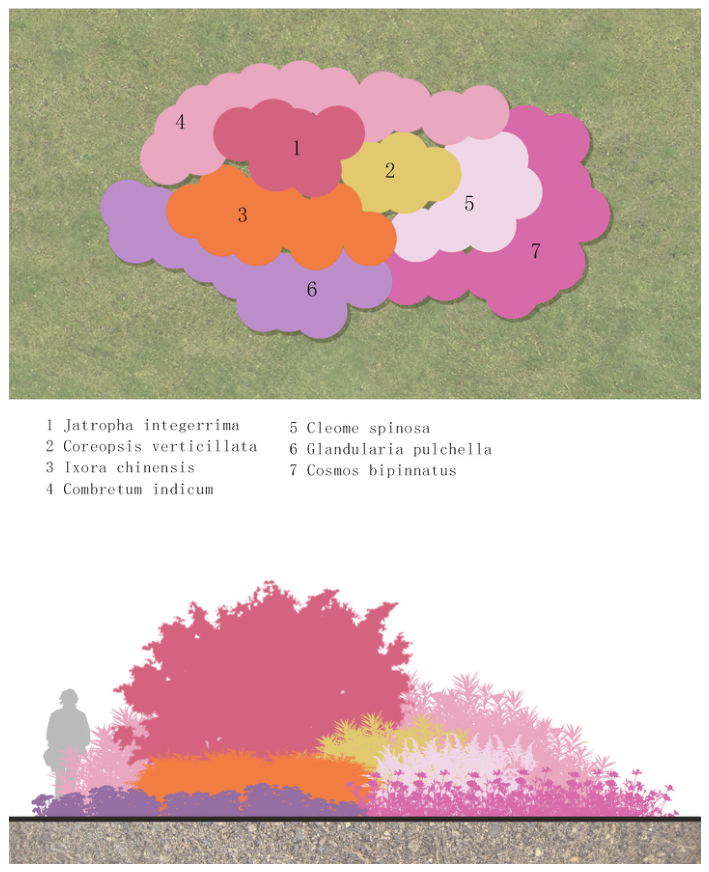
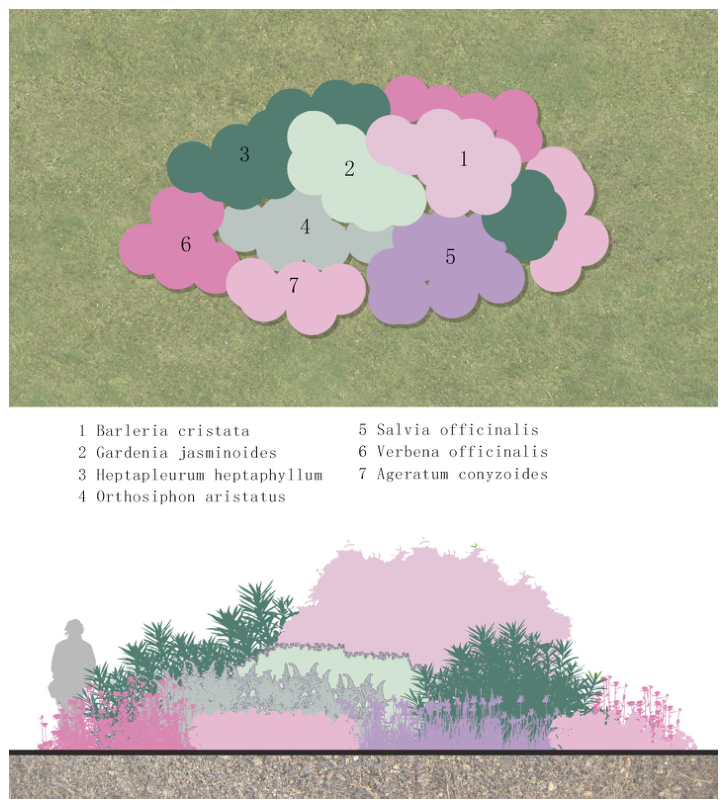
Relying on the screening results of superior nectar plants and integrating the functional demands and site characteristics of various urban green spaces, two core types of bee- and butterfly-friendly shrub–herb communities were constructed: highly ornamental flower-border communities and low-maintenance naturalistic communities. Combined with three planting forms—clump planting, mass planting, and row planting—six implementable configuration schemes were established to balance ecological benefits with landscape application requirements (
Figure 2,
Figure 3,
Figure 4,
Figure 5,
Figure 6 and
Figure 7).
The flower-border communities are suitable for high-traffic areas such as urban park centers, focusing on aesthetic value while concentratedly providing high-quality nectar sources. The mixed clump planting pattern is stratified into upper, middle, and lower layers, utilizing species such as Hibiscus mutabilis L., I. chinensis, and S. farinacea, supplemented by foliage shrubs to enrich structural layers and achieve year-round flowering coverage. The mixed mass planting pattern creates structured communities with distinct height gradient variations using species like Jatropha integerrima Jacq. and Cleome spinosa Jacq., ensuring stable nectar supply across spring, summer, and autumn. The mixed row planting pattern incorporates species such as Alpinia zerumbet (Pers.) B. L. Burtt & R. M. Sm., Calliandra haematocephala Hassk., and Zinnia elegans Jacq., maintaining continuous floral resource availability for bees and butterflies across all four seasons.
The naturalistic communities emphasize a wild, nature-esque style, heavily incorporating native plants tailored for green space margins, ecological restoration zones, and low-maintenance parks, thereby creating suitable habitats for local bee and butterfly species. The mixed clump planting pattern incorporates native species such as Caesalpinia pulcherrima (L.) Sw., Miscanthus sinensis Anderss., and Eupatorium fortunei Turcz. Some of these species also serve as butterfly host plants, providing continuous nectar resources from spring to winter. The mixed mass planting pattern primarily features Barleria cristata L., Heptapleurum heptaphyllum (L.) Y. F. Deng, and Ageratum conyzoides L., covering an extensive flowering period, while Gardenia jasminoides J.Ellis serves as a larval host for butterflies. The mixed row planting pattern combines species such as Poncirus trifoliata (L.) Raf., Bridelia tomentosa Blume, and Farfugium japonicum (L.) Kitam., leveraging the strong adaptability of native plants to lower maintenance costs while simultaneously meeting the foraging and shelter requirements of pollinators.
All configuration patterns prioritize vertical stratification and staggered flowering phenology, organically integrating primary nectar plants, supplementary nectar plants, larval host plants, and ornamental plants. This design approach not only protects urban flower-visiting bee and butterfly diversity and bolsters pollination networks, but also enhances the overall ecological stability and landscape value of urban green spaces.
4. Discussion
Urban green space planting design has long prioritized human aesthetics, resulting in an insufficient application of native nectar plants and simplified community structures that fail to fulfill the ecological needs of pollinating insects. This contradiction is widespread in cities globally. In a comprehensive review of urban pollinator conservation, Baldock pointed out that increasing floral resources in green spaces is a key strategy to mitigate pollinator declines, yet urban landscape design remains dominated by horticultural ornamental varieties [
30]. A systematic study on the attractiveness of urban green spaces to pollinators revealed that floral traits, such as inflorescence type and flower color, significantly influence the flower choice of bees and butterflies, further highlighting the structural mismatch between aesthetic orientation and pollination ecological demands [
31]. Schueller et al. emphasized that supporting pollinator diversity in urban green spaces critically depends on increasing the proportion of native plants and overall floral diversity [
32]. In China, this issue is equally prominent. Research in Beijing demonstrated that native plants, perennial herbs, and low-maintenance plants contribute significantly to the stability of pollination networks, yet horticultural cultivars still prevail in urban green spaces [
33]. A survey in Guangzhou showed that although up to 107 nectar species were recorded in autumn urban parks, pollinator visitation peaks were concentrated on only a few species, revealing a pronounced homogenization of plant communities [
34]. Research in the Pearl River Delta also indicated that native butterfly nectar plants are becoming increasingly scarce due to rapid urbanization [
35].
Notably, existing studies evaluating pollinator-friendly plants have mostly focused on temperate cities or greenhouse environments. Davey et al. conducted nectar and pollen resource research based on northern European temperate cities [
36], and the evaluation model for pollinator-attracting plants in Beijing developed by Zhao et al. centered on core indicators such as flower diameter, color, fragrance, and nectar [
37]. However, fundamental differences exist between these ecological conditions and those of southern subtropical cities like Guangzhou—where composite environmental stressors, including high temperatures, high humidity, and compacted, nutrient-poor soils, render temperate evaluation standards difficult to directly transfer. Asgarzadeh et al. applied the AHP to establish a plant selection model for semi-arid urban environments, emphasizing the principal weight of regional adaptability [
38]. Studies utilizing AHP in South China have also confirmed the priority of ecological adaptability in comprehensive evaluations [
39]; nevertheless, evaluation frameworks that balance both pollination ecological functions and landscape adaptability remain scarce.
Indicator screening is the core step in constructing an AHP framework. Previous studies regarding pollinator attractiveness primarily approached indicator selection via floral traits. Wang et al. systematically investigated the combined effects of inflorescence type, floral color, and corolla morphology on flower visitations by bees and butterflies [
31], while Benachour quantified differences in visitation frequency among distinct pollinator groups through direct observation [
40]. Zeng et al. indicated that nectar plant traits represent the primary factor influencing pollinator diversity [
41]. However, incorporating visitation frequency and visitor diversity as independent criteria-layer indicators into an AHP evaluation system remains uncommon. This study used this gap as a breakthrough point, employing visitation frequency and visitor diversity—two metrics that directly quantify pollination “utilization intensity”—as the core of the bee and butterfly attractiveness dimension. The ornamental dimension incorporated leaf color, flower color, flower size, and fragrance. These traits influence both human aesthetic preferences and pollinator behavioral choices through complex interactions [
42,
43]. The ecological adaptability dimension selected waterlogging tolerance, heat tolerance, shade tolerance, barren tolerance, and nativeness, which aligns closely with the current international consensus that prioritizes highly adaptable native plants in challenging urban habitats [
44,
45]. Furthermore, the framework incorporated flowering duration and flowering phenology as phenological indicators. This integration enabled a transition from static trait descriptions to dynamic ecological process assessments and provided a scientific basis for plant selection in urban green infrastructure [
46,
47].
The weighting results clearly reflect the regional adaptation characteristics of nectar plant screening in South China. Ecological adaptability accounted for more than half of the total weight, serving as the primary factor. Southern subtropical cities such as Guangzhou experience multiple environmental stresses, including soil compaction, nutrient deficiency, seasonal waterlogging, and extreme heat. These factors directly affect plant survival and long-term maintenance costs [
48]. This aligns with the perspective of Anselmo et al., who advocated for prioritizing native climate-adapted plants [
49], and echoes the findings of Nason and Eason regarding large, diverse gardens as effective resource patches for butterflies [
50]. Bee and butterfly attractiveness ranked second in weight, highlighting the emphasis on pollinator conservation. This differs from traditional evaluation approaches that mainly focus on landscape aesthetics. The lower weights assigned to ornamental value and flowering period do not negate their importance. Instead, they indicate that ecological survival and core pollination functions have higher priority. These three dimensions therefore achieve a complementary balance. In comparing the foraging behaviors of wild and urban bees, Wojcik and McBride also pointed out that the quality of floral resources, rather than the landscape background, determines pollinator utilization patterns [
51]—a conclusion highly consistent with the design philosophy of this study: “securing the ecological foundation before layering landscape value.”
The evaluation system established in this study passed consistency tests, demonstrating scientifically sound weight assignments and high concordance between evaluation outcomes and field observations. This validates the high applicability and precision of applying the AHP to screen bee- and butterfly-friendly nectar plants in the subtropical climate of South China. Nevertheless, certain limitations remain. This study focused exclusively on shrub and herbaceous plants in Guangzhou’s urban parks. Tree and vine nectar species were not included, and micro-level indicators such as floral nectar sugar content and pollen nutritional composition were not explored. Recent studies have demonstrated that the canopy layer provides crucial microclimate regulation and long-term pollen resources [
52], while vertical greening systems serve as both an effective means of urban space expansion and an essential carrier for promoting pollinators, where plant diversity and floral coverage act as core drivers of pollinator abundance [
53,
54]. Furthermore, evidence shows that the developmental survival rate of solitary bees critically depends on the ratio of proteins to lipids in pollen [
55]. Pollen nutritional compositions vary significantly among plant species, and bees can discern nutritional quality, selectively foraging on pollen sources with balanced nutritional ratios [
56,
57]. Future research should expand the scope of plant screening to include trees and vines, refine the evaluation framework by integrating plant physiological metrics, and conduct comparative trials of different planting configurations to optimize bee- and butterfly-friendly plant community design, thereby providing more comprehensive technical support for urban biodiversity conservation and ecological landscape construction in South China.