Article

Early Survival and Growth of Polylepis racemosa Ruiz & Pav. Under Contrasting Island-Guano Doses in a High-Andean Grassland


by
Carlos Emérico Nieto Ramos
1,
Bayron Alexander Ruiz-Blandon
2,*,
Rosario Marilu Bernaola-Paucar
3,*,
Luis Armando Nieto Ramos
4,
Roberto Sánchez-Lucio
2,
Efrén Hernández-Alvarez
5,
Ronald Francisco Bernaola-Paucar
6,
Lizbeth Gesenia Sánchez-Arias
7,
Marcos Alama-Flores
8 and
Percy Rodas Huamaní
1
1
Facultad de Ingeniería, Escuela Profesional de Ingeniería Forestal y Medio Ambiente, Universidad Nacional Amazónica de Madre de Dios, Puerto Maldonado 17001, Madre de Dios, Peru
2
Instituto Nacional de Investigaciones Forestales, Agrícolas y Pecuarias, Mexico City 04010, Mexico
3
Escuela Profesional de Ingeniería Agroindustrial, Facultad de Ingeniería, Universidad Nacional Autónoma Altoandina de Tarma, Acobamba 12731, Junín, Peru
4
Departamento de Psicología, Universidad Andina del Cusco, Puerto Maldonado 17001, Madre de Dios, Peru
5
Centro Universitario de Ciencias Biológicas y Agropecuarias, Universidad de Guadalajara, Zapopan 44600, Jalisco, Mexico
6
Facultad de Ingeniería de Forestal y Ambiental, Universidad Nacional del Centro del Perú, Huancayo 12006, Junín, Peru
7
Servicio Nacional de Áreas Naturales Protegidas por el Estado (SERNANP), San Isidro, Lima 15036, Peru
8
Facultad de Ciencias Agrarias, Universidad Nacional de Huancavelica, Acobamba 09381, Huancavelica, Peru
*
Authors to whom correspondence should be addressed.
Ecologies 2026, 7(3), 91; https://doi.org/10.3390/ecologies7030091
Submission received: 21 July 2026 / Revised: 14 August 2026 / Accepted: 18 August 2026 / Published: 1 September 2026

Abstract

High-Andean environments impose severe limitations on tree establishment, making early survival and growth decisive for restoration success. This study evaluated differences associated with four island-guano doses—0, 150, 300, and 450 g plant−1—applied in separate treatment strips to Polylepis racemosa established in a grassland at 4239 m a.s.l. A monitored cohort of 148 plants, with 37 individuals per treatment strip, was assessed at establishment and after 4, 8, and 12 months. Survival, interval mortality, total height, basal diameter, cumulative increments, and relative growth rates were analyzed using longitudinal mixed models. All plants survived during the first four months, but survival declined afterward. At 12 months, survival reached 29.7% in the control strip and 45.9%, 43.2%, and 37.8% in the strips receiving 150, 300, and 450 g plant−1, respectively. The strongest height and basal-diameter responses occurred in the 300 and 450 g plant−1 strips. The highest-dose strip showed the greatest final height, basal diameter, and cumulative growth increments, whereas the highest relative growth rates under the larger doses occurred mainly during the first four months. The 150 g plant−1 strip showed slower structural development but the highest final survival. These results indicate a non-linear pattern associated with island-guano dose, as the strip showing the greatest growth did not show the highest persistence. Considering final survival together with structural growth, the 300 g plant−1 strip showed the most balanced pattern within the evaluated plantation. This interpretation does not identify a generally optimal dose, and replicated, longer-term trials are required before broader recommendations can be made.

1. Introduction

High-Andean ecosystems occur under some of the most restrictive conditions for tree establishment, including low temperatures, intense solar radiation, strong winds, marked daily thermal variation, and seasonal water limitation. These environments also harbor exceptional biological diversity and high levels of endemism. Within this landscape, forests and woodlands dominated by Polylepis represent one of the few native woody formations capable of reaching the upper limits of tree growth in the Andes. The genus includes species distributed from Venezuela to northern Argentina and Chile, many of which form isolated forest patches within extensive grassland matrices. These wooded islands provide habitat for specialized plant and bird communities and contribute to the ecological connectivity of otherwise open high-elevation landscapes [1,2,3,4].
Despite their ecological importance, much of the remaining Polylepis cover persists as small and spatially isolated remnants. Recurrent burning, livestock grazing, fuelwood extraction, agricultural expansion, and proximity to roads and settlements have progressively altered stand structure and limited natural regeneration. Forest accessibility has been associated with reductions in biomass and changes in vegetative recruitment, while post-fire recovery may remain slow even where nearby forest fragments provide potential seed sources. Historical imagery has also shown that high-Andean forest cover can change considerably over relatively short periods in response to land use. These local pressures now interact with climate change, which may shift suitable habitats upslope, reduce the area available to some species, and increase exposure to drought and temperature extremes [5,6,7,8,9].
Active planting has therefore become an important component of efforts to recover native woody cover in degraded high-Andean landscapes. Its success, however, depends heavily on the first months following outplanting, when seedlings must overcome transplant shock and adjust to field conditions that differ sharply from those found in the nursery. Elevation and human disturbance influence the size and architecture attained by Polylepis trees, while natural regeneration across grasslands and forest plantations varies with site conditions, surrounding vegetation, and soil properties. Seedling height and basal diameter are useful indicators of early performance because they reflect the capacity of a plant to acquire resources, maintain structural stability, and resume growth after planting. Yet these attributes do not guarantee establishment when seedlings encounter frost, limited soil moisture, nutrient scarcity, or competition from herbaceous vegetation [10,11,12,13,14].
Nutrient availability can impose another constraint on seedlings established in exposed and degraded soils. Phosphorus frequently limits terrestrial plant production because much of it remains bound to soil minerals or organic compounds that are not readily available for uptake. Low temperatures may further slow organic matter decomposition and nutrient mineralization, reducing the ability of recently planted trees to sustain new root and shoot growth. Organic amendments offer one way to improve establishment conditions by supplying nutrients and modifying the immediate soil environment around each seedling. Field restoration studies have shown that management around planted trees can affect soil moisture, competition, survival, and diameter growth, although the magnitude and direction of these responses depend on species, site conditions, and the type of amendment applied [15,16,17].
Peruvian island guano is a seabird-derived organic fertilizer historically valued for its high concentrations of nitrogen and phosphorus. Once incorporated into the soil, guano-derived nitrogen may become available through the transformation of uric acid and other organic compounds into ammonium and nitrate. Its effect is nevertheless dose-dependent. Ecological studies in seabird colonies have shown that guano inputs can increase soil nitrogen and plant productivity, but excessive accumulation may also alter pH, salinity, and plant community composition. Controlled and field experiments with maize confirmed that nutrients derived from seabird guano are absorbed by plants and can strongly modify plant nitrogen status and growth. These findings indicate that guano may support early tree development, but they also caution against assuming that increasing the amount applied will produce a proportional improvement in plant performance [18,19,20]. For the present field trial, island guano was selected because it is a well-established organic fertilizer in Peru and supplies several nutrients relevant to early plant growth. Its selection was not based on a formal comparison of availability or cost against mineral fertilizers.
Polylepis racemosa Ruiz & Pav. is frequently used in Andean reforestation because of its capacity to grow at high elevations and its potential contribution to the recovery of native woody vegetation. Nursery research has shown that its initial height and diameter growth can respond positively to nutrient supply, particularly when nitrogen, phosphorus, and potassium are provided in sufficient amounts. Evidence from field conditions remains much more limited, especially at elevations above 4000 m, where low temperature, exposure, and seasonal moisture deficits may alter the response observed under controlled nursery environments. Recent studies in southern Peru have concentrated mainly on the distribution, fragmentation, conservation status, and structural condition of existing Polylepis forests, leaving a clear need for field-based evidence on practices that could improve the establishment of planted individuals [21].
This study compared the early field performance of P. racemosa among four treatment strips receiving 0, 150, 300, and 450 g plant−1 of island guano in a high-Andean grassland at 4239 m a.s.l. Survival, interval mortality, total height, basal diameter, cumulative growth increments, and relative growth rates were assessed over 12 months. We hypothesized that (a) plants in the guano-treated strips would show higher survival and lower interval mortality than those in the unfertilized strip; (b) increasing guano dose would be associated with greater height, basal diameter, cumulative increments, and relative growth rates, although these responses would not necessarily follow a linear pattern; and (c) differences among treatment strips would vary through time as plants remained exposed to high-Andean field conditions.

2. Materials and Methods

2.1. Study Area

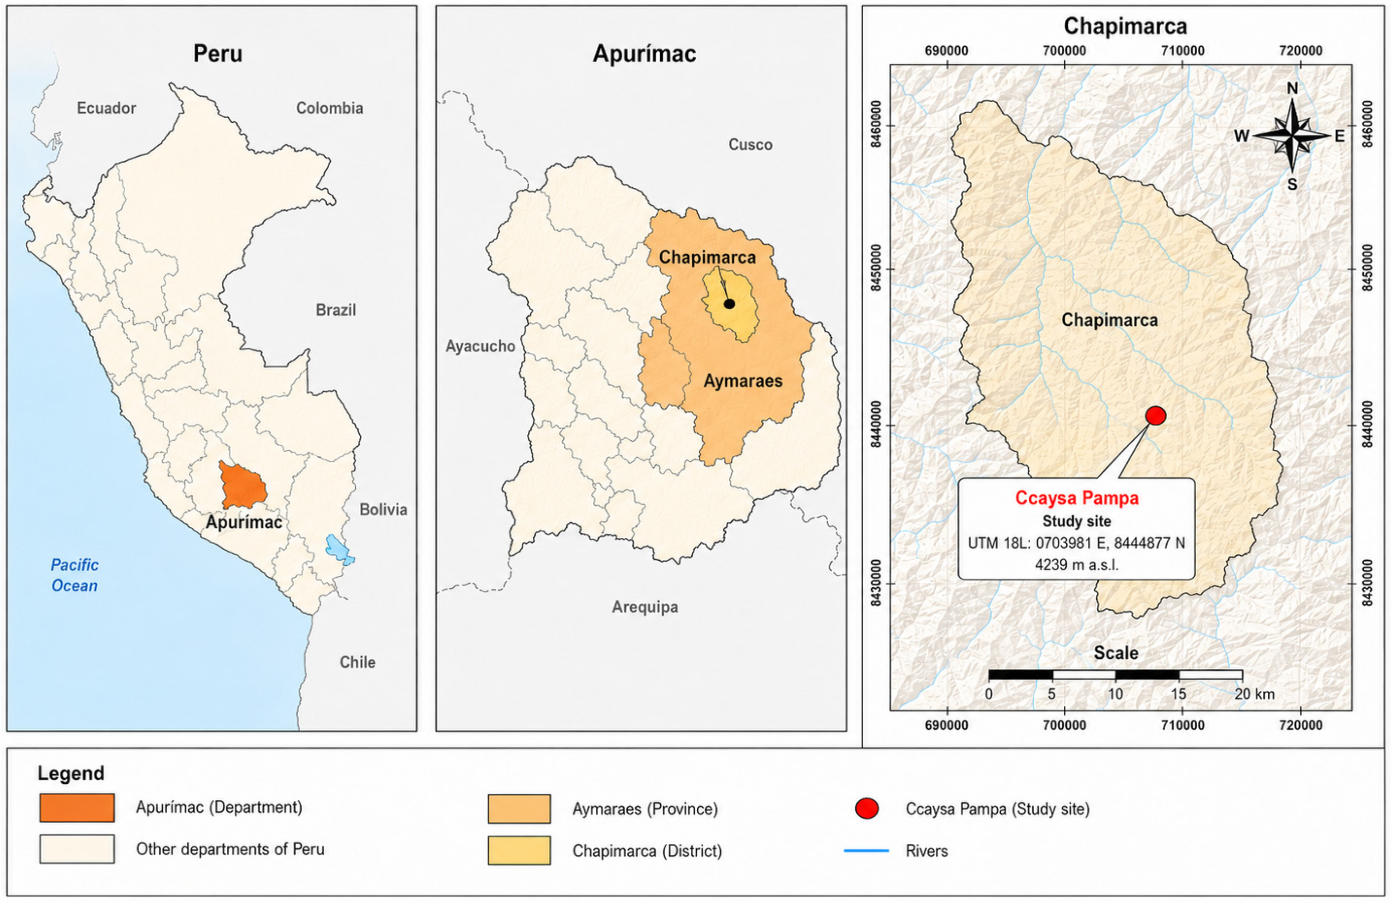
The study was conducted in the Ccaysa Pampa sector of the rural community of Ancobamba, Chapimarca District, Aymaraes Province, Apurímac Department, Peru (Figure 1). The experimental site is located at 14°03′34.17″ S and 73°06′39.39″ W, at an elevation of 4239 m a.s.l. The plantation was established within a 3 ha high-Andean grassland characterized by mountainous terrain, exposed slopes, natural pastures, tussock vegetation, and scattered native woody species. Livestock grazing and small-scale agriculture are the main land uses surrounding the experimental area. The broader plantation occupied approximately 3 ha, whereas the field comparison was conducted within a permanent experimental unit of 1792 m2. This unit was located on an open, undulating high-Andean hillslope dominated by tussock grassland, with scattered exposed rocks and locally irregular microrelief. The experimental area formed part of the same slope sector, but quantitative measurements of slope angle, aspect, and within-unit elevation range were not recorded. Consequently, topographic uniformity among treatment strips could not be verified quantitatively.
Climatic conditions were characterized from WorldClim version 2.1 monthly surfaces for 1970–2000 at a spatial resolution of 30 arcs [22]. At the study coordinates, mean annual temperature was approximately 5.9 °C and annual precipitation reached 941 mm. Monthly mean temperature ranged from 3.7 °C in July to 7.2 °C in December. Mean minimum temperature declined to −5.4 °C in July, whereas mean maximum temperature reached 14.9 °C in October. Precipitation showed marked seasonality, with 183–190 mm month−1 from January to March and approximately 10 mm month−1 in June and July. These values describe the long-term climatic setting rather than the weather experienced during the monitoring year.
Field establishment occurred in December 2020, and the plants were monitored until December 2021, with subsequent assessments conducted in April, August, and December 2021. No meteorological station was installed at the experimental site, and interval-specific records of air temperature, frost occurrence, precipitation, soil moisture, or wind speed were not available. Consequently, the observed changes in mortality and growth could not be related directly to weather anomalies during the study year.
The experimental area was located in an open high-Andean grassland dominated by tussock vegetation, with exposed rocks and visible spatial variation in surface soil conditions and microrelief. However, no detailed soil survey or pre-treatment soil sampling was conducted within the experimental unit. Consequently, soil classification, effective depth, texture, pH, organic matter, total nitrogen, available phosphorus, exchangeable potassium, and other fertility indicators were not determined. Baseline soil fertility and possible edaphic differences among treatment strips could therefore not be evaluated.

2.2. Plant Material and Field Establishment

Plant material consisted of rooted vegetative cuttings supplied by AGRORURAL–Apurímac and maintained at the community nursery of Ancobamba until field establishment. Donor-tree identity was not recorded, genetic uniformity among cuttings was not verified, and no documented randomization procedure was available for the assignment of individual plants to treatment strips. At establishment, monitored plants ranged from 25 to 69 cm in height and from 0.30 to 1.00 cm in basal diameter. Initial height and basal diameter were therefore measured for every plant and included as covariates in the growth analyses. Initial plant height and basal diameter were recorded immediately after establishment and used as baseline measurements for subsequent evaluations.

2.3. Treatment Strips and Sampling Design

The field comparison was established within a single experimental unit of 1792 m2. According to the original field layout, this unit was divided into four contiguous treatment strips of approximately 448 m2 each. The four strips were arranged longitudinally along the hillside. Their long axes followed the predominant downslope direction, so the strips ran approximately parallel to the local slope rather than across it. Accordingly, they were positioned laterally side by side across the slope and were not arranged as successive horizontal treatment bands from the upper to the lower part of the hillside. No treatment strip was therefore located directly downslope from another treatment strip. Planting points followed a regular spacing of 4 × 4 m. Each treatment strip occupied approximately 448 m2. The original field layout represented the four strips as contiguous subplots and did not document an intentionally established untreated buffer between neighboring strips. Exact strip width, strip length, and inter-strip distance were not recorded; therefore, a quantitative strip-width-to-gap ratio cannot be reconstructed from the available field documentation.
Each strip contained 37 monitored plants and received one island-guano dose, 0, 150, 300, or 450 g plant−1, resulting in a total cohort of 148 plants. The elevation of 4239 m a.s.l. represents the general location of the experimental site. Strip-specific elevations and the vertical difference within the experimental unit were not measured. The surviving field documentation did not preserve a sufficiently reliable record of the cross-slope sequence of the four dose-specific strips; therefore, their exact left-to-right order cannot be reconstructed without speculation.
The available field records document one strip per dose within a fixed spatial arrangement. Independent replication at the strip level was not available, and randomization of treatment assignment among strip positions could not be confirmed. Consequently, guano dose was spatially confounded with strip location. Accordingly, the field layout does not provide independent experimental replication for guano dose and cannot support causal inference regarding fertilizer-dose effects beyond the four observed strips. Potential differences in drainage, wind exposure, rock cover, surrounding vegetation, soil conditions, and other microsite characteristics could not be separated from the patterns associated with each dose-specific strip. The relative proportions of exposed rocks, surrounding vegetation, and sheltered planting positions were not quantified separately for each strip.
All plants were permanently identified and assessed at establishment and after 4, 8, and 12 months. For longitudinal analyses, treatment strip was considered the between-plant grouping factor, assessment time represented the within-plant factor, and plant identity defined the repeated observational unit. Survival was recorded for the complete cohort, whereas height and basal diameter were measured only in living individuals. Because treatment replication was unavailable at the strip level, statistical comparisons were interpreted as descriptive differences among the four observed strips rather than as independently replicated treatment effects.

2.4. Island Guano Application

Island guano was applied once during field establishment at four treatment levels: 0, 150, 300, and 450 g plant−1. Each dose was weighed separately and distributed manually on the soil surface as a circular band around the plant, avoiding direct contact with the stem and root collar. The amendment was not incorporated into the planting hole. This was an operational field procedure; the study did not assess whether it represented a traditional local fertilization practice. Control plants received no guano, and no additional applications were made during the 12-month monitoring period. Wind displacement, surface runoff, and subsequent movement of the amendment were not monitored; therefore, limited redistribution after application cannot be excluded.
The fertilizer consisted of Peruvian island guano derived from seabird colonies along the Pacific coast and distributed by the Programa de Desarrollo Productivo Agrario Rura (l AGRORURAL), Jr. Cahuide 805, Jesús María, Lima, Peru. According to the product specifications, it contained approximately 10–14% total nitrogen, 10–12% phosphorus expressed as P2O5, and 2–3% potassium expressed as K2O, together with calcium, magnesium, sulfur, and several micronutrients. Its nitrogen and phosphorus occurred in both readily available and progressively mineralized fractions.
This combination of mineral and organic nutrient fractions allows part of the applied nutrients to become available shortly after application, while other fractions are released gradually through microbial activity. Guano-derived phosphorus may also shift among soluble, organic, and mineral soil pools, meaning that its availability depends on soil and rhizosphere processes [23].
The doses formed an evenly spaced operational gradient in increments of 150 g plant−1 and were not derived from a previous dose–response or phytotoxicity calibration for P. racemosa. The surface-ring method was used to distribute the amendment around the immediate rooting zone while avoiding direct contact with the stem, root collar, and roots at the bottom of the planting hole. This was a precautionary operational procedure, but the study did not establish a safety threshold for island-guano application. The method was not selected on the basis of measured soil structure or water regime because these properties were not characterized before planting.

2.5. Survival and Growth Measurements

Plant survival, total height, and basal diameter were assessed at establishment and 4, 8, and 12 months after planting. These variables were selected because survival provides a direct measure of establishment success, whereas height and stem diameter describe complementary components of early plant development and are widely used to evaluate the field performance of forest planting stock [24,25].
At each assessment, plants were classified as alive or dead based on the presence of living foliage, flexible stems, or active shoots. Plants showing complete tissue desiccation and no visible signs of resprouting were recorded as dead. Survival was calculated for each treatment and assessment as Equation (1):
S % = N 0 N t × 100
where S is the survival percentage, Nt is the number of living plants recorded at assessment time t, and N0 is the initial number of monitored plants per treatment, corresponding to 37 individuals. Mortality during each evaluation interval was calculated as Equation (2):
M t \ % = N t 1 N t N t 1 × 100
where Mt is the mortality percentage during a given interval, Nt−1 is the number of plants alive at the beginning of the interval, and Nt is the number remaining alive at the end of the interval.
Total height was measured from the ground surface at the stem base to the highest living apical point using a 5 m Power Lock measuring tape, model 33-158 (STANLEY Black & Decker, New Britain, CT, USA). Basal diameter was measured at the root collar using a vernier caliper, model 530-312, with a measuring range of 0–150 mm and a resolution of 0.02 mm (Mitutoyo Corporation, Kawasaki, Japan). Measurements originally recorded in millimeters were converted to centimeters for analysis by dividing them by 10. Measurements were taken at the same stem position during successive assessments to reduce variation associated with changes in the measurement point. Height and basal diameter were expressed in centimeters to maintain consistency with the standardized dataset. Repeated measurements of these attributes provided a direct assessment of structural development after outplanting and allowed treatment responses to be distinguished from differences already present at establishment [26].
Cumulative height and basal-diameter increments were calculated for each living plant relative to its measurement at establishment. These variables were used to describe the structural response of each individual throughout the monitoring period while controlling for differences in initial plant size. Height increment and basal-diameter increment were calculated as Equations (3) and (4):
Δ H i t = H i t H i 0
Δ D i t = D i t D i 0
where ΔHit and ΔDit are the cumulative increments in height and basal diameter of plant i at assessment time t; Hit and Dit are the corresponding measurements at time t; and Hi0 and Di0 are the initial measurements recorded at establishment.
Relative growth rates were also calculated to account for differences in initial plant size and to express growth in proportional terms. Relative growth in height and basal diameter was estimated as Equations (5) and (6):
R G R H , i t = ln H i t ln H i 0 t
R G R D , i t = ln D i t ln D i 0 t
where RGRH,it and RGRD,it are the relative growth rates in height and basal diameter of plant i at time t, respectively, and t is the elapsed time since establishment, expressed in months. Both rates were expressed in month−1.
Plants that died remained included in the survival analyses, but measurements at the exact time of death were not available because mortality was identified during the scheduled assessments. Values recorded as zero after death were treated as missing observations rather than as zero growth. Growth results therefore describe plants that remained alive at each assessment and should be interpreted as conditional on survival.

2.6. Data Organization and Quality Control

The analytical dataset was organized from the individual field records reported in the annexes of the original study. These records contained four consecutive measurements for each monitored plant and preserved the treatment assignment throughout the evaluation period. A total of 148 individual records were recovered, corresponding to 37 plants in each of the four fertilization treatments. The information was reorganized into a longitudinal format, with one record per plant and assessment time, resulting in a maximum of 592 plant–time observations. Each individual was assigned a unique code to maintain consistency across the four assessments.
Before analysis, treatment labels, measurement units, decimal notation, and assessment times were standardized. Height measurements were retained in centimeters, whereas basal-diameter records originally expressed in millimeters were converted to centimeters by dividing the recorded values by 10. Survival status was derived from the presence or absence of living tissue at each assessment. When a plant was recorded as dead, the subsequent height and diameter entries were treated as missing values rather than as zero measurements. This distinction prevented mortality from being interpreted as a reduction in plant size and allowed survival and growth responses to be analyzed separately. Based on the standardized records, cumulative height and basal-diameter increments, relative growth rates, and interval mortality were calculated for each plant and assessment period using the equations described in Section 2.5.
Several internal checks were applied to verify the reconstructed dataset. The number of records per treatment was confirmed at 37 plants, and survival counts were compared with the totals reported in the original results. The standardized dataset reproduced the reported survival percentages at 12 months: 29.7% for the control, 45.9% for 150 g plant−1, 43.2% for 300 g plant−1, and 37.8% for 450 g plant−1. Records were also screened for impossible transitions, including plants returning to a living condition after being classified as dead, negative measurements, and values outside the observed range. No artificial values were generated to replace missing growth observations.

2.7. Statistical Analysis

Descriptive statistics were calculated for survival, interval mortality, total height, basal diameter, cumulative increments, and relative growth rates at each assessment time. Survival and mortality were summarized as counts and percentages, whereas continuous variables were described using the mean, standard deviation, standard error, and 95% confidence interval. Initial height and basal diameter were examined to identify pre-existing differences among treatment groups before assessing subsequent plant responses. All statistical analyses were conducted using the observed longitudinal field records.
Because no mortality occurred during the first four months, inferential analysis of survival focused on the 4–8- and 8–12-month intervals. Mortality risk was analyzed using a generalized linear mixed model with a binomial distribution and logit link. Only plants alive at the beginning of each interval were considered at risk. Guano treatment, evaluation interval, and their interaction were included as fixed effects, while plant identity was included as a random effect to account for repeated observations from individuals that remained alive across consecutive intervals. The model was expressed as Equation (7):
l o g i t p i t = β 0 + β 1 T i + β 2 M t + β 3 T i × M t + u i
where Pit is the probability that plant i died during evaluation interval t, Ti represents guano treatment, Mt represents assessment time, Ti × Mt is their interaction, and ui is the plant-specific random effect. Model-based differences among treatment strips were summarized using estimated probabilities, odds ratios, and 95% confidence intervals.
Total height and basal diameter were analyzed separately using linear mixed models for repeated measurements. Measurements recorded at 4, 8, and 12 months were used as response variables, while the corresponding value at establishment was included as a covariate. This adjustment reduced the influence of initial size differences and allowed post-establishment differences among strips to be described after accounting for baseline plant size. The model was defined as Equation (8):
Y i t = β 0 + β 1 T i + β 2 M t + β 3 T i × M t + β 4 Y i 0 + ε i t
where Yit is the height or basal diameter of plant i at time t, Yi0 is its baseline value, and εit is the residual error. Repeated observations were modeled within plant identity using the selected covariance structure.
Cumulative height increment (ΔH), cumulative basal-diameter increment (ΔD), and their corresponding relative growth rates were analyzed using separate linear mixed models. Because these variables were calculated relative to initial plant size, the baseline measurement was not included again as a covariate. Treatment, assessment time, and their interaction were considered fixed effects. Repeated observations were modeled within plant identity using the selected covariance structure.
Models for continuous response variables were fitted by maximum likelihood. Alternative covariance structures, including compound symmetry, first-order autoregressive, and unstructured matrices, were compared using the corrected Akaike information criterion. The structure producing the lowest value was retained. Mixed models were used because they account for correlations among measurements collected repeatedly from the same plants and accommodate the unequal number of growth observations resulting from mortality [27,28].
Model assumptions for continuous variables were evaluated using studentized residuals, normal quantile plots, and plots of residuals against predicted values. Influential observations were examined but retained unless a transcription or measurement error was confirmed. Missing growth measurements following plant death were not imputed. Growth models were therefore conditional on survival because height and basal diameter could only be measured in plants that remained alive at each assessment. Baseline height and basal diameter were included as covariates to reduce the influence of initial differences among treatment strips, but this adjustment could not fully remove potential selection associated with non-random mortality. Because each dose was applied to a single strip, plants within a strip represented longitudinal subsamples rather than independent treatment replicates. The mixed models accounted for repeated observations within individual plants but could not separate guano dose from strip position or unmeasured topographic and microsite heterogeneity. Inferential statistics were therefore used to describe longitudinal differences among the four observed strips and should not be interpreted as estimates of independently replicated causal treatment effects. Statistical significance was established at p < 0.05. Analyses were performed using the GLIMMIX and MIXED procedures in SAS version 9.4 [29].

3. Results

3.1. Initial Plant Size and Dataset Structure

The monitored cohort comprised 148 plants, with 37 individuals assigned to each island-guano treatment. Four assessments generated 592 survival records. Complete height and basal-diameter measurements were available at establishment and after 4 months. As mortality increased, the number of plants available for growth measurements declined to 95 at 8 months and 58 at 12 months.
Plant size differed among treatment groups at establishment (Table 1). Initial height varied significantly among treatments (Welch’s F3,71.99 = 15.20, p < 0.001). Plants assigned to the 150 g plant−1 treatment had the lowest mean height (36.22 ± 4.26 cm) and were significantly shorter than those assigned to the control, 300 g, and 450 g treatments. No significant differences were detected among the latter three groups. Initial basal diameter also differed significantly (Welch’s F3,79.60 = 43.76, p < 0.001). The 300 and 450 g treatments showed the largest mean basal diameters (0.74 ± 0.11 and 0.74 ± 0.12 cm, respectively), followed by the control (0.64 ± 0.14 cm), whereas the 150 g treatment had the smallest value (0.48 ± 0.11 cm). Games–Howell comparisons therefore separated initial basal diameter into three statistical groups: 300–450 g, control, and 150 g. Because these differences were already present at establishment, initial height and basal diameter were retained as covariates in the subsequent mixed-model analyses.

3.2. Survival and Interval Mortality

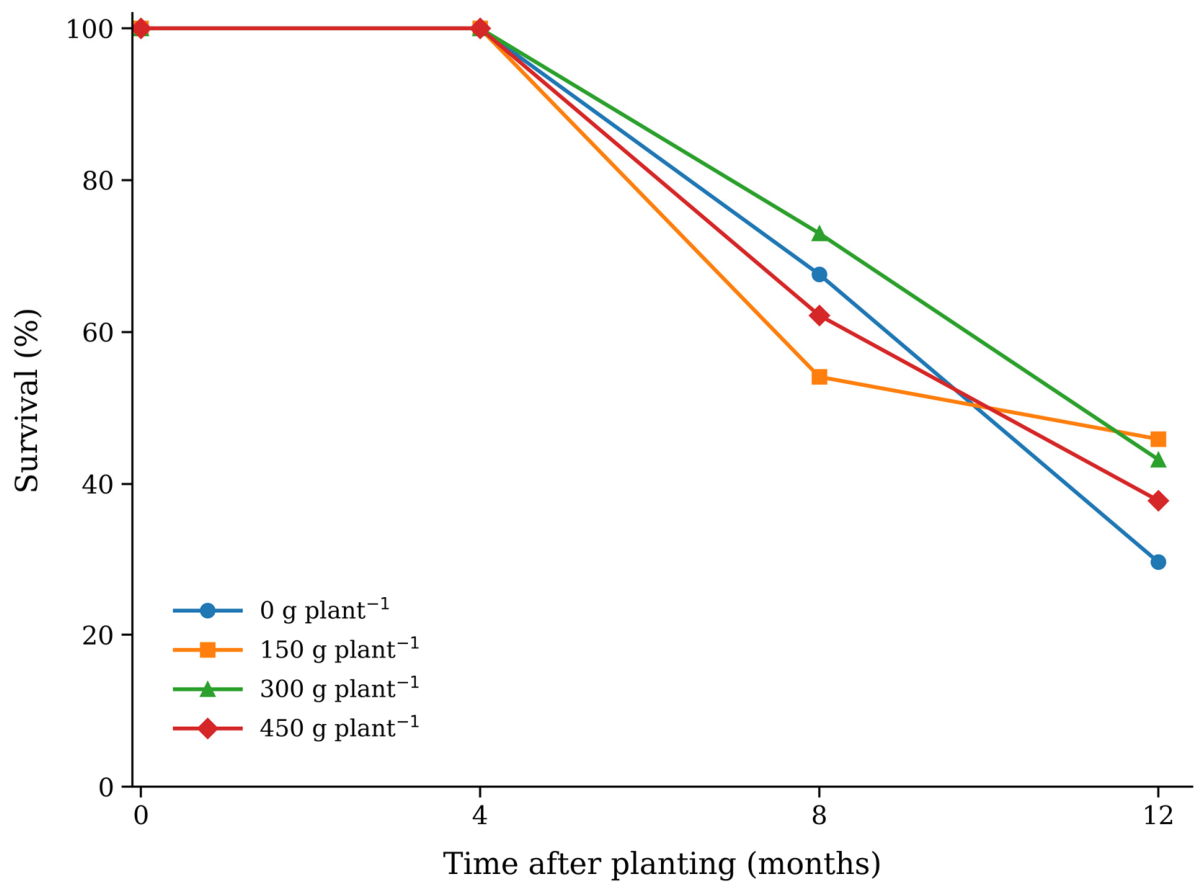
All monitored plants remained alive during the first four months after establishment. Survival declined thereafter in every treatment, although the timing and magnitude of mortality differed among guano doses (Figure 2). At 8 months, survival was highest under 300 g plant−1 (73.0%), followed by the control (67.6%), 450 g plant−1 (62.2%), and 150 g plant−1 (54.1%). By 12 months, the highest survival was recorded under 150 g plant−1 (45.9%), followed by 300 g plant−1 (43.2%), 450 g plant−1 (37.8%), and the control (29.7%).
Mortality during the 4–8-month interval ranged from 27.0% under 300 g plant−1 to 45.9% under 150 g plant−1. This pattern changed during the 8–12-month interval, when mortality reached 56.0% in the control but declined to 15.0% under 150 g plant−1. Mortality during the same interval was 40.7% and 39.1% under 300 and 450 g plant−1, respectively. Thus, the 150 g treatment showed the greatest early mortality but the lowest mortality during the final evaluation interval.
The repeated-binomial model detected no significant overall effect of treatment (χ2 = 3.10, df = 3, p = 0.377) or evaluation interval (χ2 = 3.33, df = 1, p = 0.068), but the treatment × interval interaction was significant (χ2 = 9.04, df = 3, p = 0.029; Table 2). During the 8–12-month interval, plants receiving 150 g plant−1 had lower mortality odds than control plants (odds ratio = 0.14, 95% CI = 0.03–0.60, p = 0.008). No significant differences from the control were detected for the 300 or 450 g treatments during that interval.

3.3. Temporal Variation in Height and Basal Diameter

The repeated-measures analysis detected significant effects of treatment and assessment time on total height, whereas the treatment × time interaction was not significant (Table 3). Height differed among treatments (χ2 = 8.38, df = 3, p = 0.039) and increased through time (χ2 = 117.83, df = 2, p < 0.001), but the temporal pattern was statistically comparable among guano doses (χ2 = 6.05, df = 6, p = 0.418). Basal diameter was significantly affected by treatment (χ2 = 39.88, df = 3, p < 0.001), time (χ2 = 253.42, df = 2, p < 0.001), and the treatment × time interaction (χ2 = 38.30, df = 6, p < 0.001). Thus, treatment differences in height remained broadly consistent across assessments, whereas basal-diameter responses changed during the monitoring period.
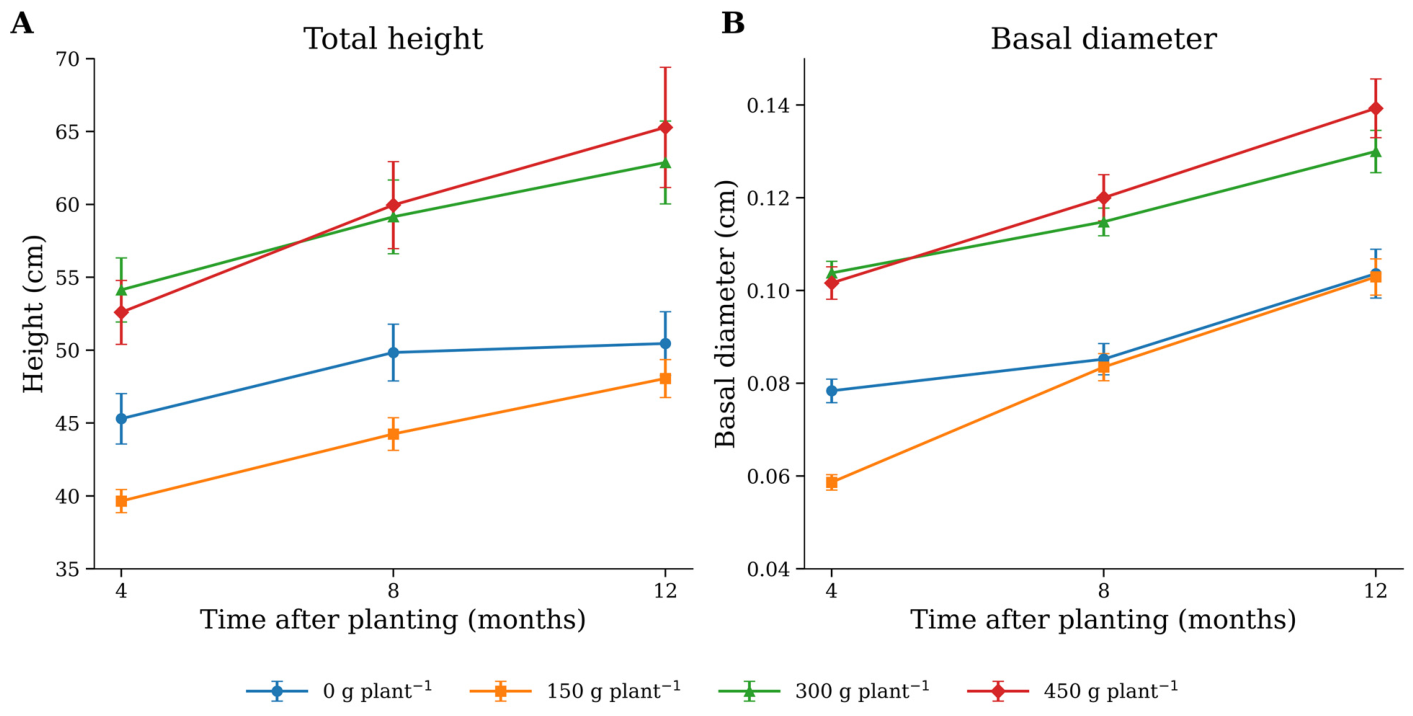
Mean height increased in every treatment throughout the monitoring period, although the magnitude of the response differed among treatment strips (Figure 3A). At 4 months, mean height ranged from 39.65 ± 4.83 cm in the 150 g plant−1 strip to 54.14 ± 13.39 cm in the 300 g plant−1 strip. At 8 months, the highest values were recorded in the 450 and 300 g plant−1 strips, reaching 59.96 ± 14.32 and 59.15 ± 13.13 cm, respectively. By 12 months, plants in the 450 g plant−1 strip attained the greatest mean height (65.29 ± 15.45 cm), followed by those in the 300 g plant−1 strip (62.88 ± 11.38 cm), whereas the control and 150 g plant−1 strips remained below 51 cm.
Basal diameter showed a comparable temporal increase, but treatment differences were more pronounced (Figure 3B). Mean basal diameter at 4 months ranged from 0.586 ± 0.100 cm under 150 g plant−1 to 1.038 ± 0.153 cm under 300 g plant−1. At 8 months, the highest values were recorded under 450 and 300 g plant−1 (1.200 ± 0.239 and 1.148 ± 0.155 cm, respectively), whereas the control and 150 g treatments remained close to 0.85 cm. At 12 months, basal diameter reached 1.393 ± 0.237 cm under 450 g plant−1 and 1.300 ± 0.183 cm under 300 g plant−1, compared with 1.036 ± 0.175 cm in the control and 1.029 ± 0.161 cm under 150 g plant−1.

3.4. Cumulative and Relative Growth Responses

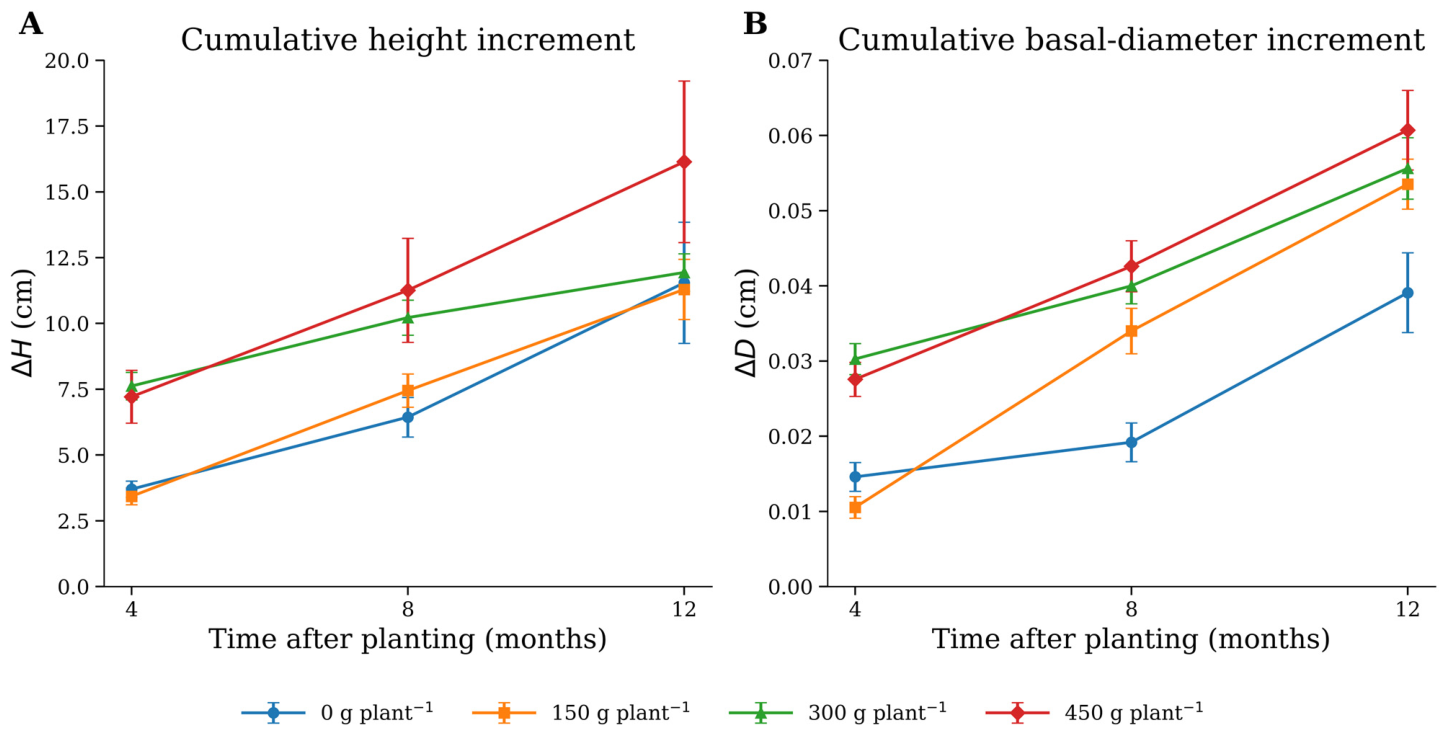
Cumulative height increment increased through time in all treatments, although the magnitude of the response differed among guano doses (Figure 4A). At 4 months, the largest increments occurred under 300 and 450 g plant−1 (7.62 ± 3.17 and 7.22 ± 6.12 cm, respectively), whereas the control and 150 g treatment showed smaller gains (3.70 ± 1.88 and 3.43 ± 1.94 cm). At 8 months, cumulative height increment remained highest under 450 g plant−1 (11.26 ± 9.48 cm), followed by 300 g plant−1 (10.22 ± 3.47 cm). By 12 months, plants receiving 450 g plant−1 reached the greatest cumulative height increment (16.14 ± 11.48 cm), while values under 0, 150, and 300 g plant−1 ranged from 11.29 to 11.94 cm.
Cumulative basal-diameter increment also increased throughout the monitoring period (Figure 4B). At 4 months, the greatest gains were observed under 300 and 450 g plant−1 (0.303 ± 0.126 and 0.276 ± 0.138 cm, respectively). At 8 months, basal-diameter increment reached 0.426 ± 0.163 cm under 450 g plant−1 and 0.400 ± 0.124 cm under 300 g plant−1. At 12 months, the highest cumulative increment occurred under 450 g plant−1 (0.607 ± 0.198 cm), followed by 300 and 150 g plant−1 (0.556 ± 0.163 and 0.535 ± 0.137 cm), while the control showed the smallest gain (0.391 ± 0.176 cm).
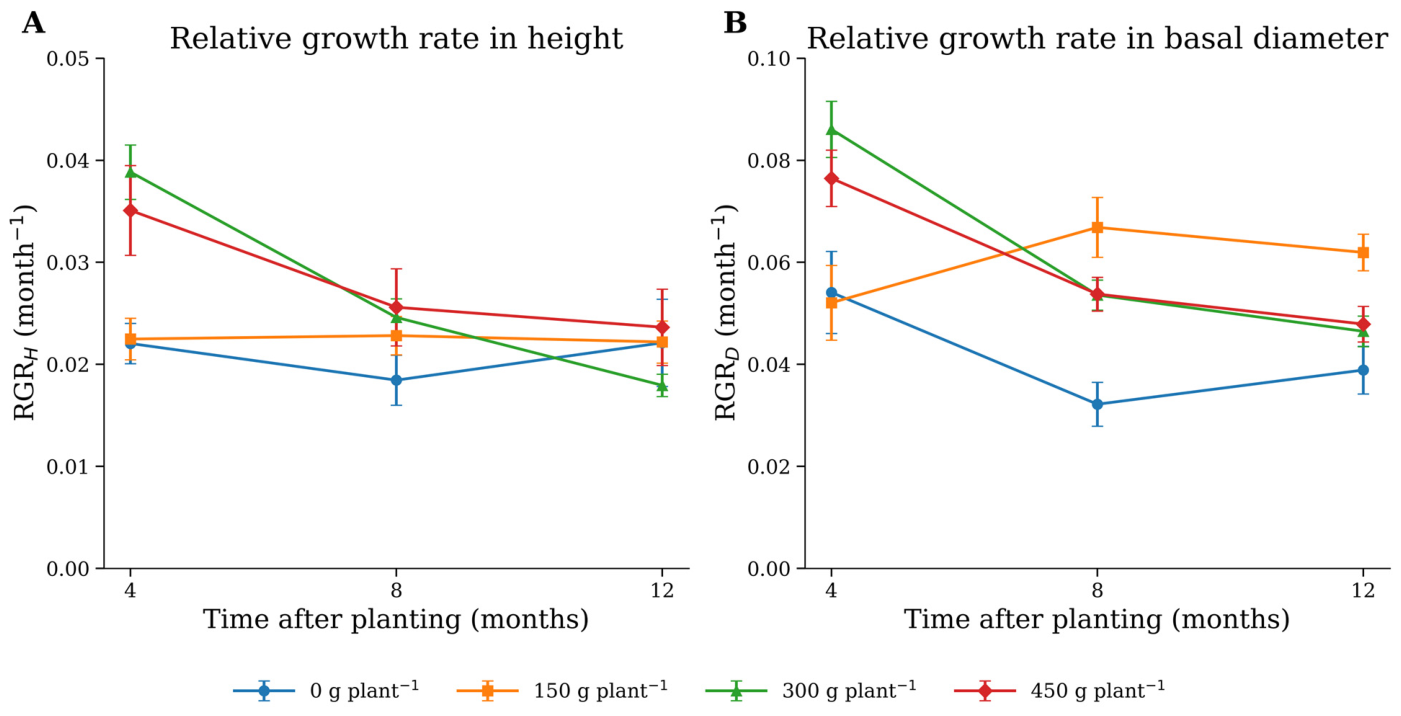
Relative growth in height was greatest during the first four months under 300 and 450 g plant−1, with values of 0.039 ± 0.016 and 0.035 ± 0.027 month−1, respectively (Figure 5A). Thereafter, relative height growth declined under the two highest doses, while remaining comparatively stable in the control and 150 g treatment. Relative basal-diameter growth followed a similar early response, reaching 0.086 ± 0.034 month−1 under 300 g plant−1 and 0.076 ± 0.034 month−1 under 450 g plant−1 at 4 months (Figure 5B). By 12 months, the highest relative basal-diameter growth was recorded under 150 g plant−1 (0.062 ± 0.015 month−1), whereas the other fertilized treatments ranged from 0.046 to 0.048 month−1.
The repeated-measure models confirmed significant effects of island-guano treatment and assessment time on all four growth responses (Table 4). For cumulative height increment, the treatment × time interaction was not significant (χ2 = 5.92, df = 6, p = 0.433), indicating that the pattern of treatment differences remained statistically comparable across assessment times. In contrast, cumulative basal-diameter increment showed a significant treatment × time interaction (χ2 = 38.33, df = 6, p < 0.001). Significant interactions were also detected for relative height growth (χ2 = 39.57, df = 6, p < 0.001) and relative basal-diameter growth (χ2 = 63.59, df = 6, p < 0.001), confirming that the relative response to island guano changed during the monitoring period.

4. Discussion

4.1. Early Survival and Mortality Under High-Andean Field Conditions

All plants survived during the first four months, but mortality increased markedly afterward, leaving between 29.7% and 45.9% of the monitored individuals alive at 12 months. This temporal pattern is consistent with limited early transplant losses followed by greater mortality later in the monitoring period. However, the available data do not allow the causes of this decline to be separated. At these elevations, low temperatures, seasonal water limitation, intense radiation, and short favorable growth periods may act simultaneously. Studies with Polylepis australis have shown that cold resistance and early plant performance vary across elevation gradients, reflecting differences in environmental exposure and population responses [30,31]. Because monitoring covered one complete annual cycle, the 12-month assessment provides the clearest short-term silvicultural indication of establishment. The 4- and 8-month evaluations are useful for identifying when mortality changed during the year, but they represent intermediate stages rather than evidence of longer-term performance.
The 150 g plant−1 treatment showed the highest final survival, while increasing the dose to 300 or 450 g plant−1 provided no additional advantage. This non-linear pattern suggests that differences in survival among strips were not explained by guano dose alone. Rocabado et al. (2023) [32] similarly found that fertilization strongly increased the growth of planted P. australis but did not significantly improve survival. In Andean restoration trials, elevation and shade can exert stronger effects on seedling survival than management treatments, particularly at the highest and most exposed sites [33].
Microsite conditions may therefore explain part of the mortality observed after the fourth month. Rocks, surrounding vegetation, and sheltered positions can reduce temperature fluctuations, conserve soil moisture, and protect young plants from wind and radiation. Cáceres et al. (2019) [34] reported that microsite effects on the early performance of P. australis changed with altitude, while Victoria et al. (2021) [35] found greater recruitment of P. tarapacana in relatively moist microsites influenced by rocks. Plant quality and belowground interactions may also contribute to differences among individuals, as early seedling performance can vary with propagule quality and soil microbial associations [36,37]. Within the evaluated plantation, the moderate-dose strips showed comparatively favorable survival, although microsite conditions and other uncontrolled spatial differences may also have contributed to the observed pattern.

4.2. Height and Basal-Diameter Patterns Among Island-Guano Treatment Strips

Height and basal diameter increased in all treatment strips, with larger values generally recorded in the strips receiving 300 and 450 g plant−1. The highest final values occurred in the 450 g plant−1 strip. These results describe differences among dose-specific strips within the evaluated plantation and should not be interpreted as independently replicated fertilizer effects. Nutrient-addition studies nevertheless provide useful context for understanding why plant growth may differ under contrasting nutrient conditions [38,39].
The response was more evident for basal diameter than for height. Greater stem thickening may improve mechanical stability and water transport, which are important for young trees exposed to wind, low temperatures, and seasonal moisture limitation. However, nutrient responses in montane tree seedlings are rarely uniform. Homeier et al. (2012) [40] found that moderate nitrogen and phosphorus additions rapidly modified several components of an Ecuadorian montane forest, while Cárate-Tandalla et al. (2018) [41] reported contrasting growth responses among tree species exposed to the same nutrient treatments. The observed differences are compatible with a nutrient-related response, but the design does not separate guano dose from spatial variation among strips.
The increasing separation among strips over time, particularly for basal diameter, may also be related to the gradual release of nutrients from the organic fraction of island guano. Murga-Orrillo et al. (2023) [42] observed that differences between organically fertilized and unfertilized plants became clearer during later evaluations rather than immediately after application. A delayed response is reasonable because nutrient mineralization depends on soil moisture, temperature, and microbial activity, all of which can be restricted at high elevations.
The similar performance recorded in the two highest-dose strips may indicate diminishing gains at higher application rates, although this interpretation remains tentative because each dose was represented by a single strip. Zalamea et al. (2016) [43] showed that phosphorus responses differ markedly among tropical tree species, whereas Martínez-Bravo et al. (2022) [44] found that high fertilizer doses did not consistently improve tropical reforestation and could reduce performance in some species. Within the evaluated plantation, the 300 g plant−1 strip showed a comparatively balanced pattern of growth and survival, but this observation should not be considered evidence of a general optimum dose.

4.3. Cumulative and Relative Growth Patterns During the First Year

Cumulative height and basal-diameter increments increased throughout the first year, whereas relative growth rates were highest during the first four months in the 300 and 450 g plant−1 strips and declined during the subsequent assessments. Because monitoring covered only one annual cycle, this decline cannot be separated from seasonal variation, and the available data do not support an age- or ontogeny-based explanation. Studies of high-Andean Polylepis have shown that annual radial growth and cambial activity are sensitive to temperature, precipitation, and the timing of favorable growing conditions [45,46]. Changes in soil moisture, wind exposure, nutrient availability, and individual plant condition may therefore have contributed to the within-year trajectories.
The assessments at 4 and 8 months provide useful information on the timing of early growth, but the 12-month evaluation represents the most relevant short-term endpoint for comparing establishment. At that time, the 450 g plant−1 strip showed the greatest cumulative height and basal-diameter increments, whereas the 150 g plant−1 strip retained the highest survival. When survival and growth were considered jointly, the 300 g plant−1 strip occupied an intermediate position. These patterns describe the first-year outcome at this particular site and do not indicate whether the same differences will persist during subsequent years.
Island guano contains organic nutrient fractions that may be released gradually. Mineralization of organic fertilizers is strongly influenced by temperature, moisture, substrate characteristics, and fertilizer composition [47]. Consequently, differences among strips could emerge or change after the first year. However, because weather and soil conditions were not recorded for each assessment interval, delayed nutrient release could not be distinguished from seasonal conditions, microsite heterogeneity, or individual biological variation. The observed trajectories should therefore be interpreted as provisional.
Growth analyses included only plants that remained alive at each assessment. Longitudinal responses observed after mortality describe the changing cohort of survivors and may not represent the complete population present at establishment [48]. Therefore, the mean height, basal diameter, and cumulative increments reported at 8 and 12 months may partly reflect selective survival if smaller or slower-growing plants were more likely to die. This possibility is particularly relevant because initial plant size differed among treatment strips. Including baseline height and basal diameter as covariates reduced the influence of these initial differences but did not eliminate the potential bias associated with non-random mortality. The later growth patterns should consequently be interpreted as conditional on survival rather than as responses representative of the complete initial cohort.

4.4. Possible Nutrient-Related Explanations Under High-Elevation Stress

The greater growth recorded in the guano-treated strips is consistent with a possible contribution from the combined supply of nitrogen, phosphorus, potassium, and organic matter. Alpine plants frequently respond to nutrient combinations because growth may be constrained by more than one element. However, the present study did not directly evaluate nutrient uptake or availability, and the comparisons cited below provide ecological context rather than evidence of the mechanism responsible for the observed differences. Feng et al. (2025) [49] found that phosphorus and combined nitrogen–phosphorus additions increased height-based relative growth in alpine plants, while Ren et al. (2017) [50] reported evidence of nitrogen and phosphorus co-limitation in an alpine grassland. These studies provide plausible ecological context for the growth patterns observed in P. racemosa, although the underlying nutrient mechanisms were not measured directly.
Nutrient availability at 4239 m a.s.l. is nevertheless controlled by cold soil conditions. Low temperatures can slow organic-matter decomposition and restrict the conversion of nutrients into forms available for root uptake. Müller et al. (2017) [51] documented declining nitrogen and phosphorus availability toward the Himalayan treeline, while Mou et al. (2020) [52] found that colder soils accumulated more phosphorus in organic pools associated with roots and microorganisms. Thus, part of the guano applied in the present study may have remained temporarily immobilized rather than becoming immediately available to plants.
The gradual separation among treatments is consistent with the behavior of organic fertilizers. Their effects depend on mineralization, soil moisture, temperature, and microbial activity, so nutrient release does not necessarily coincide with the moment of application. Harraq et al. (2022) [53] showed that nitrogen release and plant response differed among organic fertilizers, whereas Haugwitz et al. (2011) [54] demonstrated that microorganisms can retain a substantial proportion of added nutrients in cold ecosystems. Nutrient uptake may therefore have occurred progressively during favorable periods, contributing to the delayed increase in growth observed under the higher guano doses.
A larger nutrient supply does not always produce a proportional benefit. Dong et al. (2022) [55] found that plant production and microbial responses changed differently across nitrogen levels in an alpine steppe, and Petraglia et al. (2014) [56] reported distinct nitrogen and phosphorus effects on the growth and phenology of an alpine species. Nutrient enrichment may also modify belowground associations; Lu et al. (2022) [57] observed that long-term nitrogen addition altered plant–mycorrhizal networks and reduced several fungal associations. In the present study, soil nutrient concentrations, foliar nutrient status, and guano mineralization were not measured. Nutrient-related explanations should therefore be regarded as plausible hypotheses supported by previous studies rather than as mechanisms demonstrated by this experiment.

4.5. Implications for Polylepis Restoration and High-Andean Grassland Management

Within the evaluated plantation, the 450 g plant−1 strip showed the largest cumulative increments, whereas final survival was higher in the 150 and 300 g plant−1 strips. Considering survival and growth jointly, the 300 g plant−1 strip showed the most balanced pattern under the conditions of this particular site. This interpretation is context-specific and should not be treated as a general fertilization recommendation because each dose was represented by a single strip.
Fertilization should not be considered in isolation when planning restoration. Young plants should also be protected from livestock, uncontrolled fire, and herbivory during the establishment period. Giorgis et al. (2020) [58] found that low grazing pressure was necessary for the expansion and maturation of Polylepis australis forests, while a global synthesis by Xu et al. (2023) [59] showed that herbivory frequently limits vegetation recovery in restoration projects. Selecting sheltered planting positions and maintaining protective vegetation around seedlings may reduce exposure, although management should avoid excessive competition from dense grass cover.
Plant quality before outplanting is equally important. The use of vegetatively propagated material can facilitate the production of native Andean trees when seed availability is limited, but maintaining several source plants is necessary to avoid narrowing genetic representation [60]. Seed-based propagation should remain part of future restoration programs because seed quality and maternal origin vary considerably among Polylepis individuals and species [61]. Future restoration trials could also evaluate locally available mycorrhizal inocula, as Becerra et al. (2024) [62] found substantial growth benefits in P. australis seedlings inoculated with soil from degraded forest sites.
Scaling up restoration will require more than planting and fertilization. Site selection should consider future climatic suitability, connectivity with forest remnants, and the potential for natural recruitment [63,64]. Community participation is also essential in the Peruvian Andes, where interest in restoring Polylepis forests is closely linked to water security, technical knowledge, and local livelihoods [65,66]. The patterns observed at this site should be validated through replicated, multi-year trials under comparable and contrasting environmental conditions before any dose is recommended for wider restoration use.

4.6. Study Limitations

The field comparison was conducted within a single experimental unit containing one strip for each island-guano dose. Individual plants represented longitudinal subsamples within their respective strips rather than independent treatment replicates. Independent strip-level replication was unavailable, and randomized allocation of treatments among strip positions was not documented. Consequently, guano dose was confounded with strip position, and the statistical results should be interpreted as descriptive differences among the four evaluated strips rather than as independently replicated treatment effects [67]. This limitation cannot be resolved statistically, because replication of individual plants within a strip does not constitute independent replication of the strip-level guano treatment. Accordingly, the study cannot provide treatment-level inference beyond the four observed strips, and independent replication would be required to formally test the effect of island-guano dose.
The strips were contiguous and extended along the local slope. Quantitative measurements of slope gradient, aspect, within-unit elevation differences, soil depth, rock cover, vegetation cover, drainage, and surface runoff were not available. These local conditions can influence soil temperature, moisture availability, wind exposure, seedling establishment, and early growth in high-elevation environments [68]. Their possible contribution to the observed variation could therefore not be separated from the patterns associated with each dose-specific strip. Because exact strip dimensions and any small inter-strip separation were not measured, their potential influence on lateral surface or subsurface nutrient movement could not be evaluated quantitatively.
Island guano was applied to the soil surface around each plant, but its movement after application was not monitored. Limited redistribution through wind, surface runoff, or downslope transport within or between adjacent strips cannot therefore be excluded. Research with surface-applied organic amendments has shown that nutrient movement in runoff varies with rainfall, soil conditions, vegetation cover, and application method [69]. In the present study, this possibility is recognized only as a source of uncertainty and not as a process demonstrated at the site.
The study covered one annual cycle and did not include interval-specific weather records, baseline soil characterization, foliar analyses, direct estimates of guano mineralization, soil mineral nitrogen, potential gaseous nitrogen losses, or nutrient uptake. Consequently, the proportion of each nominal dose retained in the soil or absorbed by the plants could not be determined, and the 450 g plant−1 application should not be interpreted as an amount that was fully available to the root system. Growth analyses were also conditional on survival. The findings should therefore be regarded as exploratory and specific to the evaluated plantation until they are confirmed through randomized and replicated trials incorporating topographic, edaphic, climatic, and microsite measurements.

5. Conclusions

This study documented contrasting one-year survival and growth patterns among four island-guano treatment strips in a high-Andean grassland. At 12 months, the 150 g plant−1 strip retained the highest proportion of living plants, whereas the 450 g plant−1 strip showed the greatest structural development among survivors. When survival and growth were considered jointly, the 300 g plant−1 strip showed the most balanced pattern within this plantation. This interpretation is site-specific and should not be regarded as evidence of a universally optimal dose.
These findings should be regarded as exploratory and most directly applicable to high-Andean restoration settings with environmental conditions comparable to those of the evaluated plantation. They describe site-specific patterns among four dose-specific strips and should not be generalized to other locations or management contexts. Replicated multi-year trials across additional restoration sites and contrasting environmental settings are required to determine whether these patterns persist and to support any broader fertilization recommendation.

Author Contributions

Conceptualization, C.E.N.R. and B.A.R.-B.; methodology, C.E.N.R. and R.M.B.-P.; software, B.A.R.-B.; validation, L.A.N.R., R.S.-L. and E.H.-A.; formal analysis, B.A.R.-B.; investigation, C.E.N.R. and P.R.H.; resources, R.M.B.-P.; data curation, R.F.B.-P., L.G.S.-A., M.A.-F. and P.R.H.; writing—original draft preparation, B.A.R.-B., E.H.-A. and R.S.-L.; writing—review and editing, C.E.N.R., B.A.R.-B., R.M.B.-P., L.A.N.R., R.S.-L., E.H.-A., R.F.B.-P., L.G.S.-A., M.A.-F. and P.R.H.; visualization, B.A.R.-B.; supervision, R.M.B.-P.; project administration, B.A.R.-B. and R.M.B.-P.; funding acquisition, R.M.B.-P. All authors have read and agreed to the published version of the manuscript.

Funding

This research received no external funding.

Institutional Review Board Statement

Not applicable.

Informed Consent Statement

Not applicable.

Data Availability Statement

The data supporting the findings of this study are available from the corresponding author upon reasonable request.

Acknowledgments

B.A.R.-B., a corresponding author of this study, dedicates this work to Marilyn Zuleth Ruiz Guzmán.

Conflicts of Interest

The authors declare no conflicts of interest.

Abbreviations

The following abbreviations are used in this manuscript:
AICcCorrected Akaike information criterion
a.s.l.Above sea level
CIConfidence interval
dfDegrees of freedom
ΔHCumulative height increment
ΔDCumulative basal-diameter increment
RGRHRelative growth rate in height
RGRDRelative growth rate in basal diameter

References

  1. Madriñán, S.; Cortés, A.J.; Richardson, J.E. Páramo Is the World’s Fastest Evolving and Coolest Biodiversity Hotspot. Front. Genet. 2013, 4, 192. [Google Scholar] [CrossRef] [Scilit]
  2. Gareca, E.E.; Hermy, M.; Fjeldså, J.; Honnay, O. Polylepis Woodland Remnants as Biodiversity Islands in the Bolivian High Andes. Biodivers. Conserv. 2010, 19, 3327–3346. [Google Scholar] [CrossRef] [Scilit]
  3. Espinoza, T.E.B.; Kessler, M. A Monograph of the Genus Polylepis (Rosaceae). PhytoKeys 2022, 203, 1–274. [Google Scholar] [CrossRef] [Scilit]
  4. Franco, P.; Cáceres, C.; Navarro, M.; Jove, C.; Ignacio, J.; Oyague, E. Bosques de Polylepis tarapacana en la cuenca Maure, extremo sur del Perú. Oportunidades para su conservación. Estud. Geogr. 2021, 82, e059. [Google Scholar] [CrossRef] [Scilit]
  5. Toivonen, J.M.; Kessler, M.; Ruokolainen, K.; Hertel, D. Accessibility Predicts Structural Variation of Andean Polylepis Forests. Biodivers. Conserv. 2011, 20, 1789–1802. [Google Scholar] [CrossRef] [Scilit]
  6. Renison, D.; Morales, L.; Cuyckens, G.É.; Sevillano, C.S.; Amaya, D.M.C. Ecología y conservación de los bosques y arbustales de Polylepis: ¿qué sabemos y qué ignoramos? Ecol. Austral. 2018, 28, 163–174. [Google Scholar] [CrossRef] [Scilit]
  7. Calbi, M.; Clerici, N.; Borsch, T.; Brokamp, G. Reconstructing Long Term High Andean Forest Dynamics Using Historical Aerial Imagery: A Case Study in Colombia. Forests 2020, 11, 788. [Google Scholar] [CrossRef] [Scilit]
  8. Zutta, B.R.; Rundel, P.W. Modeled Shifts in Polylepis Species Ranges in the Andes from the Last Glacial Maximum to the Present. Forests 2017, 8, 232. [Google Scholar] [CrossRef] [Scilit]
  9. Bedoya-Canas, L.E.; López-Hernández, F.; Cortés, A.J. Climate Change Responses of High-Elevation Polylepis Forests. Forests 2024, 15, 811. [Google Scholar] [CrossRef] [Scilit]
  10. Kessler, M.; Toivonen, J.M.; Sylvester, S.P.; Kluge, J.; Hertel, D. Elevational Patterns of Polylepis Tree Height (Rosaceae) in the High Andes of Peru: Role of Human Impact and Climatic Conditions. Front. Plant Sci. 2014, 5, 194. [Google Scholar] [CrossRef] [Scilit]
  11. Valencia, B.G.; Bush, M.B.; Coe, A.L.; Orren, E.; Gosling, W.D. Polylepis Woodland Dynamics during the Last 20,000 Years. J. Biogeogr. 2018, 45, 1019–1030. [Google Scholar] [CrossRef] [Scilit]
  12. Quiroz Dahik, C.; Marín, F.; Arias, R.; Crespo, P.; Weber, M.; Palomeque, X. Comparison of Natural Regeneration in Natural Grassland and Pine Plantations across an Elevational Gradient in the Páramo Ecosystem of Southern Ecuador. Forests 2019, 10, 745. [Google Scholar] [CrossRef] [Scilit]
  13. Grossnickle, S.C.; MacDonald, J.E. Seedling Quality: History, Application, and Plant Attributes. Forests 2018, 9, 283. [Google Scholar] [CrossRef] [Scilit]
  14. Ivetić, V.; Grossnickle, S.; Škorić, M. Forecasting the Field Performance of Austrian Pine Seedlings Using Morphological Attributes. iForest-Biogeosci. For. 2016, 10, 99. [Google Scholar] [CrossRef] [Scilit]
  15. Vitousek, P.M.; Porder, S.; Houlton, B.Z.; Chadwick, O.A. Terrestrial Phosphorus Limitation: Mechanisms, Implications, and Nitrogen–Phosphorus Interactions. Ecol. Appl. 2010, 20, 5–15. [Google Scholar] [CrossRef] [Scilit]
  16. Benites, R.M.A.; Guerra, A.; Reis, L.K.; Ferreira, B.H.d.S.; Borges, F.L.G.; Ferreira, I.J.K.; Abrahão, M.; Garcia, L.C. Nucleário, Cardboard, or Manual Crowning: Which Maintenance Technique Is Most Cost-Effective in Tree Seedling Survival Establishment? J. Environ. Manag. 2020, 270, 110900. [Google Scholar] [CrossRef] [Scilit]
  17. Machado, D.L.; Dourado, M.N.; de Freitas, M.S.; de Souza, L.M.; da Silva, E.M.; Podadera, D.S.; Andrade, C.R.; Ferreira, W.C.; Guilherme, F.A.G. Organic Mulching Alters the Soil Microclimate, Increases Survival and Growth of Tree Seedlings in Restoration Planting. Forests 2024, 15, 1777. [Google Scholar] [CrossRef] [Scilit]
  18. Wait, D.A.; Aubrey, D.P.; Anderson, W.B. Seabird Guano Influences on Desert Islands: Soil Chemistry and Herbaceous Species Richness and Productivity. J. Arid Environ. 2005, 60, 681–695. [Google Scholar] [CrossRef] [Scilit]
  19. Szpak, P.; Longstaffe, F.J.; Millaire, J.-F.; White, C.D. Stable Isotope Biogeochemistry of Seabird Guano Fertilization: Results from Growth Chamber Studies with Maize (Zea mays). PLoS ONE 2012, 7, e33741. [Google Scholar] [CrossRef] [Scilit]
  20. Szpak, P.; Millaire, J.-F.; White, C.D.; Longstaffe, F.J. Influence of Seabird Guano and Camelid Dung Fertilization on the Nitrogen Isotopic Composition of Field-Grown Maize (Zea mays). J. Archaeol. Sci. 2012, 39, 3721–3740. [Google Scholar] [CrossRef] [Scilit]
  21. Quinteros-Gómez, Y.; Salinas-Inga, A.; Macedo-Bedoya, J.; Peralta-Alcantara, E.; La Rosa-Sánchez, M.; Gonzales, F.C.; Yamunaque, A.; Angeles-Alvarez, F.; Gómez-Ticerán, D.; Dávila, O.L.S. Noninvasive Sonic Tomography for the Detection of Internal Defects in Relict Woodlands of Polylepis in Peru. Forests 2025, 16, 957. [Google Scholar] [CrossRef] [Scilit]
  22. Fick, S.E.; Hijmans, R.J. WorldClim 2: New 1-Km Spatial Resolution Climate Surfaces for Global Land Areas. Int. J. Climatol. 2017, 37, 4302–4315. [Google Scholar] [CrossRef] [Scilit]
  23. Zhong, H.; Kim, Y.-N.; Smith, C.; Robinson, B.; Dickinson, N. Seabird Guano and Phosphorus Fractionation in a Rhizosphere with Earthworms. Appl. Soil Ecol. 2017, 120, 197–205. [Google Scholar] [CrossRef] [Scilit]
  24. Mataruga, M.; Cvjetković, B.; De Cuyper, B.; Aneva, I.; Zhelev, P.; Cudlín, P.; Metslaid, M.; Kankaanhuhta, V.; Collet, C.; Annighöfer, P.; et al. Monitoring and Control of Forest Seedling Quality in Europe. For. Ecol. Manag. 2023, 546, 121308. [Google Scholar] [CrossRef] [Scilit]
  25. Djiofack, B.Y.; Bourland, N.; Beeckman, H.; Cerutti, P.O.; Fai, C.D.; Van Hulle, M.; Pierson, M.; Mayaux, J.; Luambua, N.K.; Musepena, D.; et al. The Potential of Native Tree Species for Forest Restoration in the Central Congo Basin. Ecol. Eng. 2025, 217, 107662. [Google Scholar] [CrossRef] [Scilit]
  26. Rajapakshe, R.; Karthigesu, J.; Thavananthan, S.; Sivachandiran, S.; Navaneetham, V.; Sinnamani, S. Restoring a Dry Tropical Forest through Assisted Natural Regeneration: Enhancing Tree Diversity, Structure, and Carbon Stock. Trees For. People 2024, 17, 100616. [Google Scholar] [CrossRef] [Scilit]
  27. Harrison, X.A.; Donaldson, L.; Correa-Cano, M.E.; Evans, J.; Fisher, D.N.; Goodwin, C.E.D.; Robinson, B.S.; Hodgson, D.J.; Inger, R. A Brief Introduction to Mixed Effects Modelling and Multi-Model Inference in Ecology. PeerJ 2018, 6, e4794. [Google Scholar] [CrossRef] [Scilit]
  28. Stroup, W.W. Generalized Linear Mixed Models: Modern Concepts, Methods and Applications; CRC Press: Boca Raton, FL, USA, 2016; ISBN 978-0-429-07529-2. [Google Scholar]
  29. SAS Institute Inc. SAS/STAT User’s Guide, version 9.4; SAS Institute Inc.: Cary, NC, USA, 2016.
  30. Marcora, P.I.; Tecco, P.A.; Ferrero, M.C.; Ferreras, A.E.; Zeballos, S.R.; Funes, G.; Gurvich, D.E.; Arias, G.; Cáceres, Y.; Hensen, I. Are Populations of Polylepis Australis Locally Adapted along Their Elevation Gradient? Neotrop. Biodivers. 2021, 7, 246–256. [Google Scholar] [CrossRef] [Scilit]
  31. Schrieber, K.; Cáceres, Y.; Engelmann, A.; Marcora, P.; Renison, D.; Hensen, I.; Müller, C. Elevational Differentiation in Metabolic Cold Stress Responses of an Endemic Mountain Tree. Environ. Exp. Bot. 2020, 171, 103918. [Google Scholar] [CrossRef] [Scilit]
  32. Rocabado, P.A.; Sparacino, J.; Torres, R.C.; Díaz, R.E.; Renison, D. Restauración del bosque montano en suelos degradados: La fertilización temprana quintuplica el crecimiento postplantación de Polylepis australis. Ecol. Austral. 2023, 33, 609–620. [Google Scholar] [CrossRef] [Scilit]
  33. Marín, F.; Palomeque, X.; Báez, S.; Verbeeck, H.; Montesdeoca, A.; Ortiz, E.; Cajas, P.; Delva, J.; Murillo, D.; Merchán, W.; et al. Elevation and Shade Interact to Affect Survival and Growth of Native Tree Seedlings in an Andean Forest Restoration Field Experiment. J. Appl. Ecol. 2026, 63, e70401. [Google Scholar] [CrossRef] [Scilit]
  34. Cáceres, Y.; Schrieber, K.; Lachmuth, S.; Auge, H.; Argibay, D.; Renison, D.; Hensen, I. Effects of Altitude, Land Use and Microsites on Early Life Performance of a High Mountain Tree: Insights from an in Situ Sowing Experiment. Divers. Distrib. 2019, 25, 1537–1550. [Google Scholar] [CrossRef] [Scilit]
  35. Victoria Lien, L.; Manuel, C.J.; Cuyckens, G.A.E. Influencia Del Micrositio y El Ambiente En La Instalación de Polylepis Tarapacana En Los Altos Andes. Neotrop. Biodivers. 2021, 7, 135–145. [Google Scholar] [CrossRef] [Scilit]
  36. Domic, A.I.; Capriles, J.M.; Camilo, G.R. Evaluating the Fitness Effects of Seed Size and Maternal Tree Size on Polylepis Tomentella (Rosaceae) Seed Germination and Seedling Performance. J. Trop. Ecol. 2020, 36, 115–122. [Google Scholar] [CrossRef] [Scilit]
  37. Soteras, F.; Renison, D.; Becerra, A.G. Restoration of High Altitude Forests in an Area Affected by a Wildfire: Polylepis Australis Bitt. Seedlings Performance after Soil Inoculation. Trees 2014, 28, 173–182. [Google Scholar] [CrossRef] [Scilit]
  38. Cárate Tandalla, D.; Homeier, J.; Batáry, P. Responses of Tropical Tree Seedlings to Nutrient Addition: A Meta-Analysis to Understand Future Changes in Tropical Forest Dynamics. Curr. For. Rep. 2024, 11, 3. [Google Scholar] [CrossRef] [Scilit]
  39. Santiago, L.S.; Wright, S.J.; Harms, K.E.; Yavitt, J.B.; Korine, C.; Garcia, M.N.; Turner, B.L. Tropical Tree Seedling Growth Responses to Nitrogen, Phosphorus and Potassium Addition. J. Ecol. 2012, 100, 309–316. [Google Scholar] [CrossRef] [Scilit]
  40. Homeier, J.; Hertel, D.; Camenzind, T.; Cumbicus, N.L.; Maraun, M.; Martinson, G.O.; Poma, L.N.; Rillig, M.C.; Sandmann, D.; Scheu, S.; et al. Tropical Andean Forests Are Highly Susceptible to Nutrient Inputs—Rapid Effects of Experimental N and P Addition to an Ecuadorian Montane Forest. PLoS ONE 2012, 7, e47128. [Google Scholar] [CrossRef] [Scilit]
  41. Cárate-Tandalla, D.; Camenzind, T.; Leuschner, C.; Homeier, J. Contrasting Species Responses to Continued Nitrogen and Phosphorus Addition in Tropical Montane Forest Tree Seedlings. Biotropica 2018, 50, 234–245. [Google Scholar] [CrossRef] [Scilit]
  42. Murga-Orrillo, H.; Chuquimez Gonzales, J.K.; Pashanasi Amasifuén, B.; Arévalo López, L.A. Vigna Unguiculata: A Productive Option in the Face of Climate Change? Front. Agron. 2023, 5, 1284173. [Google Scholar] [CrossRef] [Scilit]
  43. Zalamea, P.-C.; Turner, B.L.; Winter, K.; Jones, F.A.; Sarmiento, C.; Dalling, J.W. Seedling Growth Responses to Phosphorus Reflect Adult Distribution Patterns of Tropical Trees. New Phytol. 2016, 212, 400–408. [Google Scholar] [CrossRef] [Scilit]
  44. Martínez-Bravo, R.D.M.; Ricker, M.; Nava-Cruz, Y.; Siebe, C. Mineral Fertilization in Tropical Reforestation: Seedling Growth and Survival of Ten Native Tree Species in Tabasco, Mexico. Madera Bosques 2022, 28, e2812269. [Google Scholar] [CrossRef] [Scilit]
  45. Requena-Rojas, E.J.; Morales, M.; Villalba, R. Dendroclimatological Assessment of Polylepis rodolfo-vasquezii: A Novel Polylepis Species in the Peru Highlands. Dendrochronologia 2020, 62, 125722. [Google Scholar] [CrossRef] [Scilit]
  46. Rodríguez-Morata, C.; Pacheco-Solana, A.; Ticse-Otarola, G.; Boza Espinoza, T.E.; Crispín-DelaCruz, D.B.; Santos, G.M.; Morales, M.S.; Requena-Rojas, E.J.; Andreu-Hayles, L. Revealing Polylepis Microphylla as a Suitable Tree Species for Dendrochronology and Quantitative Wood Anatomy in the Andean Montane Forests. Dendrochronologia 2022, 76, 125995. [Google Scholar] [CrossRef] [Scilit]
  47. Cannavo, P.; Recous, S.; Valé, M.; Bresch, S.; Paillat, L.; Benbrahim, M.; Guénon, R. Organic Fertilization of Growing Media: Response of N Mineralization to Temperature and Moisture. Horticulturae 2022, 8, 152. [Google Scholar] [CrossRef] [Scilit]
  48. Kurland, B.F.; Johnson, L.L.; Egleston, B.L.; Diehr, P.H. Longitudinal Data with Follow-up Truncated by Death: Match the Analysis Method to Research Aims. Stat. Sci. 2009, 24, 211–222. [Google Scholar] [CrossRef] [Scilit]
  49. Feng, R.; Wang, S.; Ma, J.; Wang, N.; Wang, X.; Ren, F.; Li, H.; Liang, D.; Hu, J.; Li, X.; et al. Nutrient Additions Regulate Height Growth Rate but Not Biomass Growth Rate of Alpine Plants Through the Contrasting Effect of Total and Available Nitrogen. Plants 2025, 14, 1143. [Google Scholar] [CrossRef] [Scilit]
  50. Ren, F.; Song, W.; Chen, L.; Mi, Z.; Zhang, Z.; Zhu, W.; Zhou, H.; Cao, G.; He, J.-S. Phosphorus Does Not Alleviate the Negative Effect of Nitrogen Enrichment on Legume Performance in an Alpine Grassland. J. Plant Ecol. 2017, 10, 822–830. [Google Scholar] [CrossRef] [Scilit]
  51. Müller, M.; Oelmann, Y.; Schickhoff, U.; Böhner, J.; Scholten, T. Himalayan Treeline Soil and Foliar C:N:P Stoichiometry Indicate Nutrient Shortage with Elevation. Geoderma 2017, 291, 21–32. [Google Scholar] [CrossRef] [Scilit]
  52. Mou, X.M.; Wu, Y.; Niu, Z.; Jia, B.; Guan, Z.-H.; Chen, J.; Li, H.; Cui, H.; Kuzyakov, Y.; Li, X.G. Soil Phosphorus Accumulation Changes with Decreasing Temperature along a 2300 m Altitude Gradient. Agric. Ecosyst. Environ. 2020, 301, 107050. [Google Scholar] [CrossRef] [Scilit]
  53. Harraq, A.; Sadiki, K.; Bourioug, M.; Bouabid, R. Organic Fertilizers Mineralization and Their Effect on the Potato “Solanum tuberosum” Performance in Organic Farming. J. Saudi Soc. Agric. Sci. 2022, 21, 255–266. [Google Scholar] [CrossRef] [Scilit]
  54. Haugwitz, M.S.; Michelsen, A.; Schmidt, I.K. Long-Term Microbial Control of Nutrient Availability and Plant Biomass in a Subarctic-Alpine Heath after Addition of Carbon, Fertilizer and Fungicide. Soil Biol. Biochem. 2011, 43, 179–187. [Google Scholar] [CrossRef] [Scilit]
  55. Dong, J.; Cui, X.; Niu, H.; Zhang, J.; Zhu, C.; Li, L.; Pang, Z.; Wang, S. Effects of Nitrogen Addition on Plant Properties and Microbiomes Under High Phosphorus Addition Level in the Alpine Steppe. Front. Plant Sci. 2022, 13, 894365. [Google Scholar] [CrossRef] [Scilit]
  56. Petraglia, A.; Tomaselli, M.; Mondoni, A.; Brancaleoni, L.; Carbognani, M. Effects of Nitrogen and Phosphorus Supply on Growth and Flowering Phenology of the Snowbed Forb Gnaphalium supinum L. Flora-Morphol. Distrib. Funct. Ecol. Plants 2014, 209, 271–278. [Google Scholar] [CrossRef] [Scilit]
  57. Lu, Y.; Liu, X.; Zhou, S. Nitrogen Addition Altered the Plant-Arbuscular Mycorrhizal Fungi Network through Reducing Redundant Interactions in an Alpine Meadow. Soil Biol. Biochem. 2022, 171, 108727. [Google Scholar] [CrossRef] [Scilit]
  58. Giorgis, M.A.; Cingolani, A.M.; Teich, I.; Poca, M. Can Livestock Coexist with Polylepis australis Forests in Mountains of Central Argentina? Setting Thresholds for a Land Sharing Landscape. For. Ecol. Manag. 2020, 457, 117728. [Google Scholar] [CrossRef] [Scilit]
  59. Xu, C.; Silliman, B.R.; Chen, J.; Li, X.; Thomsen, M.S.; Zhang, Q.; Lee, J.; Lefcheck, J.S.; Daleo, P.; Hughes, B.B.; et al. Herbivory Limits Success of Vegetation Restoration Globally. Science 2023, 382, 589–594. [Google Scholar] [CrossRef] [Scilit]
  60. Díaz-Páez, M.; Werden, L.K.; Zahawi, R.A.; Usuga, J.; Polanía, J. Vegetative Propagation of Native Tree Species: An Alternative Restoration Strategy for the Tropical Andes. Restor. Ecol. 2022, 30, e13611. [Google Scholar] [CrossRef] [Scilit]
  61. Huayta-Hinojosa, L.D.; Quispe-Melgar, H.R.; Poma, K.L.L.; Llacua-Tineo, Y.S.; Ames-Martínez, F.N.; Renison, D. Low Seed Viability and Germination in Polylepis flavipila Hinder Forest Restoration: The Role of Seed Mass and Maternal Effects. Trees For. People 2025, 19, 100746. [Google Scholar] [CrossRef] [Scilit]
  62. Becerra, A.G.; Renison, D.; Menoyo, E.; Oehl, F.; Chiarini, F.; Cabello, M.N. Arbuscular Mycorrhizal Fungi Inoculum from Degraded Forest Soils Promotes Seedling Growth of a Keystone Mountain Tree Used for Restoration. For. Ecol. Manag. 2024, 572, 122327. [Google Scholar] [CrossRef] [Scilit]
  63. Cuyckens, G.A.E.; Renison, D. Identification of Priority Areas for the Restoration of High Andean Mountain Forests under Climate Change: A Case Study Using Potential Distribution Models. Restor. Ecol. 2024, 32, e14193. [Google Scholar] [CrossRef] [Scilit]
  64. Piquer-Doblas, M.; Correa-Londoño, G.A.; Osorio-Vélez, L.F. From Stand to Forest: Woody Plant Recruitment in an Andean Restoration Project. Plants 2024, 13, 2474. [Google Scholar] [CrossRef] [Scilit]
  65. Christmann, T.; Cjuno-Turpo, I.; López-Aranda, M.; Wilson, S.J.; Cuni-Sanchez, A.; Malhi, Y.; Ramirez, A.; Rondán, V.; Medina Castro, F.; Mamani, M.; et al. ‘Sowing and Harvesting Water’: Revisiting Forest Restoration in the Peruvian Andes through a Multi-Stakeholder Analysis. People Nat. 2025, 7, 631–652. [Google Scholar] [CrossRef] [Scilit]
  66. Joseph, L.; Yaranga Cano, R.M.; Arizapana-Almonacid, M.; Venelli Pyles, M.; Freire de Siqueira, F.; van den Berg, E. Socioeconomic Conditions and Landowners’ Perception Affect the Intention to Restore Polylepis Forests in the Central Andes of Peru. Forests 2021, 12, 118. [Google Scholar] [CrossRef] [Scilit]
  67. Hurlbert, S.H. Pseudoreplication and the Design of Ecological Field Experiments. Ecol. Monogr. 1984, 54, 187–211. [Google Scholar] [CrossRef] [Scilit]
  68. Kambo, D.; Danby, R.K. Factors Influencing the Establishment and Growth of Tree Seedlings at Subarctic Alpine Treelines. Ecosphere 2018, 9, e02176. [Google Scholar] [CrossRef] [Scilit]
  69. Jokela, W.; Sherman, J.; Cavadini, J. Nutrient Runoff Losses from Liquid Dairy Manure Applied with Low-Disturbance Methods. J. Environ. Qual. 2016, 45, 1672–1679. [Google Scholar] [CrossRef] [Scilit]
Figure 1. Geographic location of the study area in Ccaysa Pampa, Chapimarca District, Aymaraes Province, Apurímac Department, Peru.
Ecologies 07 00091 g001
Figure 2. Survival of Polylepis racemosa plants under four island-guano doses during the 12-month monitoring period. Values represent the percentage of living plants relative to the 37 individuals initially monitored per treatment.
Ecologies 07 00091 g002
Figure 3. Temporal variation in total height (A) and basal diameter (B) of Polylepis racemosa under four island-guano doses. Values are presented as mean ± standard error at 4, 8, and 12 months after planting. Means at each assessment were calculated from plants alive at that time; error bars represent standard errors.
Ecologies 07 00091 g003
Figure 4. Cumulative height increment (A) and cumulative basal-diameter increment (B) of Polylepis racemosa under four island-guano doses. Values are presented as mean ± standard error at 4, 8, and 12 months after planting. Means at each assessment were calculated from plants alive at that time; error bars represent standard errors.
Ecologies 07 00091 g004
Figure 5. Relative growth rates in height (A) and basal diameter (B) of Polylepis racemosa under four island-guano doses. Values are presented as mean ± standard error at 4, 8, and 12 months after planting. Means at each assessment were calculated from plants alive at that time; error bars represent standard errors.
Ecologies 07 00091 g005
Table 1. Initial height and basal diameter of Polylepis racemosa plants assigned to the four island-guano treatments. Values are presented as mean ± standard deviation and observed range. Different lowercase letters within the same column indicate significant differences among treatments according to the Games–Howell test (p < 0.05).
Island-Guano Dose (g plant−1)Initial Height (cm)Range (cm)Initial Basal Diameter (cm)Range (cm)
041.59 ± 10.30 a27–670.64 ± 0.14 b0.30–0.90
15036.22 ± 4.26 b29–490.48 ± 0.11 c0.30–0.70
30046.51 ± 12.09 a25–690.74 ± 0.11 a0.60–1.00
45045.38 ± 10.32 a27–680.74 ± 0.12 a0.50–1.00
Table 2. Wald tests from the repeated-binomial model evaluating the effects of island-guano treatment, evaluation interval, and their interaction on mortality of Polylepis racemosa. Significant effects are shown in bold (p < 0.05).
EffectWald χ2df(p)-Value
Island-guano treatment3.1030.377
Evaluation interval3.3310.068
Treatment × interval9.0430.029
Table 3. Wald tests from the repeated-measures models evaluating the effects of island-guano treatment, assessment time, and their interaction on total height and basal diameter of Polylepis racemosa. Initial plant size was included as a covariate. Significant was assessed at (p < 0.05).
Response VariableEffectWald χ2df(p)-Value
Total heightTreatment8.3830.039
Time117.832<0.001
Treatment × time6.0560.418
Basal diameterTreatment39.883<0.001
Time253.422<0.001
Treatment × time38.306<0.001
Table 4. Wald tests from the repeated-measures models evaluating the effects of island-guano treatment, assessment time, and their interaction on cumulative and relative growth of Polylepis racemosa. An unstructured within-plant covariance matrix was selected for all response variables according to the lowest AICc. Significant significance was assessed at (p < 0.05).
Response VariableEffectWald χ2df(p)-Value
Cumulative height increment ( Δ H)Treatment13.1930.004
Time115.912<0.001
Treatment × time5.9260.433
Cumulative basal-diameter increment ( Δ D)Treatment39.513<0.001
Time251.232<0.001
Treatment × time38.336<0.001
Relative height growth ( Δ H)Treatment9.7130.021
Time66.002<0.001
Treatment × time39.576<0.001
Relative basal-diameter growth ( Δ D)Treatment17.853<0.001
Time31.882<0.001
Treatment × time63.596<0.001
Disclaimer/Publisher’s Note: The statements, opinions and data contained in all publications are solely those of the individual author(s) and contributor(s) and not of MDPI and/or the editor(s). MDPI and/or the editor(s) disclaim responsibility for any injury to people or property resulting from any ideas, methods, instructions or products referred to in the content.