Article

Intertidal Oyster Reef Mapping and Population Analysis in West Galveston Bay, Texas

1
Honors College, University of Houston, Houston, TX 77204, USA
2
Black Cat GIS and Biological Services, Houston, TX 77584, USA
3
Gulf Coast Bird Observatory, Lake Jackson, TX 77566, USA
*
Author to whom correspondence should be addressed.
Ecologies 2025, 6(2), 36; https://doi.org/10.3390/ecologies6020036
Submission received: 24 March 2025 / Revised: 18 April 2025 / Accepted: 21 April 2025 / Published: 6 May 2025

Abstract

:
Intertidal reefs comprised of the eastern oyster (Crassostrea virginica) are an important habitat type within the estuarine landscape and provide many unique ecosystem services. Within West Galveston Bay (WGB), Texas, this type of reef plays an important ecological role; however, the system’s intertidal reef abundance, structure, and habitat provisions are relatively understudied, and the current spatial extent of these reefs has not been recently quantified. The primary objectives of the study were to identify intertidal oyster reefs utilizing GIS models and sample representative reefs for topographical characteristics, oyster demographics, and the associated benthic macrofauna (ABM) community composition in WGB from August 2019 to February 2020. Secondarily, GIS models and oyster population abundance were utilized to estimate the intertidal oyster abundance in WBG. The total area of intertidal oyster reefs in WGB was estimated to be 818,128 m2, with 59,931 m2 of reefs confirmed through GIS analysis and ground truthing, and the GIS model estimating an additional 758,197 m2 of reef. Through ground truthing, reefs were found to be either shell rakes, consisting of piled shell with minimal three-dimensional structure and oysters, or true intertidal reefs with high reef structure and oyster abundance. High oyster abundance was spatially distributed within the northeastern and southwestern areas of WGB and the total intertidal oyster population, coupling the GIS models and reef sampling, was estimated to be 500 million individual oysters. The ABM community was sparse in terms of richness and diversity, further indicating a lack of structural complexity in most of the reefs within this system. This study demonstrates the importance of coupling field results with GIS modeling to estimate system level population sizes and furthers the understanding of the spatial distributions of intertidal oyster reef to promote management, conservation, and restoration efforts.

1. Introduction

The spatial distribution of estuarine organisms is synchronous with the diverse habitat types found with an estuary. This distribution is driven by local microhabitat dynamics [1,2,3,4], specific habitat characteristics [5,6,7,8,9], and through regional landscapes [2,10,11]. Within estuaries along the Atlantic Coast and Gulf of Mexico in the USA, reefs comprised of the eastern oyster (Crassostrea virginica) are vital biogenic habitats [5,12,13], as they provide three-dimensional structure habitat in areas that would be open bottom [13,14,15,16] and are foundational species in an estuarine ecosystem [17,18]. Throughout their natural distribution, oysters can be found in the subtidal zone of an estuary, completely submerged at low tide, or within the intertidal environment when subjected tidal fluxes and are exposed at low tide [19,20,21]. Both reef types provide similar ecosystem services by functioning as feeding grounds for reef-associated fauna and mobile nekton [5,6,13,16,22], trapping and sequestering sediment [23,24,25,26], and providing shoreline protection [27,28,29,30]. However, the difference in tidal regime between the two reef types leads to differences in ecological function, approach to commercial harvest, management strategies, and restoration practices [24,31,32,33,34,35,36,37].
The presence of different reef types within an estuary can present challenges for resource managers and restoration efforts, as approaches for understanding the spatial distribution of reefs and standing stocks of oysters vary [38,39,40,41,42,43,44]. Determining the spatial context of subtidal reefs has been accomplished through various methods, such as digital mapping from aerial surveys, side scan sonar, acoustic telemetry, and Light Detection and Ranging (LiDAR) [38,40,41,42,43,44,45,46]. Quantifying oyster density on subtidal reefs can be coupled with standardized oyster dredges [25,47,48,49,50] to provide an estimation of an estuarine systems total oyster abundance. However, pairing the techniques of quantifying spatial orientation and total oyster abundance on intertidal reefs is comparatively more difficult due to the shallow depths and exposure at low tide. Espriella et al. 2023 [45] utilized LiDAR for intertidal reefs 1–3 m in depth, but this survey method may not be feasible on many intertidal reefs. Furthermore, techniques, such as side scan sonar and LiDAR, are expensive and only provide the distribution of intertidal reefs, as oyster abundance of this reef type is often manually assessed [7,14,16,51]. Therefore, the standing stocks of intertidal reefs are comparatively less quantified than subtidal reefs.
Having a relative understanding of oyster stocks for an estuary that has both subtidal and intertidal oysters, such as Galveston Bay (GB), Texas, USA is ecologically important to understand larval settlement, metapopulation dynamics, and long-term reef spatial dynamics and survivorship [7,52,53,54]. Along with their ecological importance, oysters from GB are an important species in the seafood industry. Galveston Bay provides ~15% of the United States oysters and brings in an estimated USD 15 million to the local economy [55]. Harvesting oysters in GB is generally limited to the subtidal region, as it is prohibited to harvest oysters within 300 ft (~91 m) of the shoreline and commercial harvest is mainly with an oyster dredge [56]. Therefore, Fisheries Independent Monitoring of oyster populations is limited to physical estuarine characteristics and potential harvestable reefs. This may lead to undervaluing the ecological influence of intertidal oyster reefs within a large estuarine system that is focused on the economic importance of subtidal oyster populations. The limited knowledge of the current intertidal oyster stocks, and a lack of recent maps and data for this reef type, the objectives of this study were to map current intertidal reefs in West Galveston Bay, determine the physical characteristics of intertidal reefs, understand oyster population demography, and ascertain infaunal community composition for this critical habitat type within Galveston Bay.

2. Materials and Methods

2.1. Study Site

Physically, the Galveston Bay (GB) estuarine system is the largest in Texas and is within the top 10 estuaries in size (~1600 km2) of surface area in the USA [57]. The estuary is relatively shallow (~3 m), with a tidal amplitude of ~0.5 m [58,59]. Galveston Bay is generally a positive estuary and typically demonstrates a salinity gradient influencing organismal utilization among the different bays and creeks that provide ecologically different habitats [58,59]. This study utilizes West Galveston Bay (Figure 1) to map and quantify oyster abundance and associated benthic macrofauna.

2.2. GIS Analyses

Texas Orthoimagery Program (TOP) aerial photos were downloaded from the Texas Natural Resources Information System (TNRIS) https://tnris.org/ (accessed 19 March 2019). The TOP data were recorded in a 0.5 meter (m) resolution. The 0.5 m orthoimagery covering the entire State of Texas was flown from October 2014 to August 2015, with select areas additionally flown for 6-inch/1-foot orthoimagery. The 2014/2015 Statewide Orthoimagery Project under the TOP was administered by Texas Geographical Information Office, part of the Texas Water Development Board. All orthoimagery acquired under TOP are 4-band (R, G, B, NIR), natural color, and color infrared capable. Orthophotos were organized throughout the project using the United States Geological Survey (USGS) quarter quadrant system, an established grid based on latitude and longitude lines long used by federal agencies. The study area comprised 27 quarter quadrants (QQ), representing areas of West Bay, Swan Lake, Jones Bay, Chocolate Bay, Christmas Bay, Drum Bay, and Oyster Lake (Figure 1). Each QQ covers an area measuring 3.75 min longitude by 3.75 min latitude (or 43 km2). USGS QQ data were also downloaded from https://www.twdb.texas.gov/ (accessed 25 March 2019).
The GIS models subsequently classified aerial photos into categories based on pixel value, which were then examined to assign habitat type values. QQs were analyzed individually due to changes in color and reflections depending on time and day of data recording or light variance. Each QQ had its corresponding orthophoto(s) analyzed via ESRI mapping software (ArcMap 10.5) using the iso cluster unsupervised classification tool (ISO), which produced a raster dataset sorted into categories based on pixel colors. This tool performed an unsupervised classification on a series of input raster bands using the Iso Cluster and Maximum Likelihood Classification tools. The process is automated, removing user-induced error. ISO was run with 10 classes, with a minimum of 20 cells per valid class and a 10-cell interval to be used for sampling.
Once the classification was completed, rasters were converted to polygons using the Raster to Polygon tool in Modelbuilder. Polygons were assigned gridcode numbers based on their corresponding category from the raster dataset. Polygons were clipped to water depths that could support intertidal reef. Water depths were determined using data from local National Oceanic and Atmospheric Administration (NOAA) tide gauges (https://tidesandcurrents.noaa.gov/) (accessed 1 April 2019). Data for two gauge sites were acquired: Galveston Railroad Bridge, TX—Station ID: 8771486, and San Luis Pass, TX—Station ID: 8771972. Data on historic Mean High Water (MHW), Mean Sea Level (MSL), Mean Lower Low Water (MLLW), and Extreme Low Water (ELW) levels were recorded and averaged between the two stations. NOAA data reflected averages from 1983 to 2001, converted to North American Vertical Datum of 1988 (NAVD88). Appropriate zones for intertidal oyster reefs were created using these water level measurements. Water depths above MHW (0.225 m) were assigned the value of 1 and discarded as not inundated enough for intertidal habitat. Depths between MHW (0.255 m) and MSL (0.12 m) were assigned a value of 2. Depths between MSL (0.12 m) and MLLW (−0.105 m) were assigned a value of 3. Depths between MLLW (−0.105 m) and ELW (−0.6575 m) were assigned a value of 4. Depths between ELW (−0.6575 m) and −1 m were assigned a value of 5 and any depths deeper than −1 m were assigned a value of 6 and considered too deep to classify as intertidal. Areas with assigned values of 2, 3, 4, and 5 were designated as locations suitable for intertidal reef habitat.

2.3. Ground Truthing of GIS Models

Ground truthing of potential intertidal oyster reef locations was performed for each QQ during low tide periods. A set of ten numbered random points located within potential intertidal reefs were generated for each QQ using the Create Random Points tool in ArcGIS (version 10.8.1) and loaded onto a Samsung Galaxy Active 2 8-inch ruggedized Tablet along with a diagram showing the outline of the QQs. In a few cases, there was only a small portion of the QQ that contained bay water, and those QQs were assigned less than 10 random points. Points were visited in order utilizing the Samsung Tablet to navigate to each point until one was reached that was suitable for oyster sampling. Once a suitable site within a QQ was reached no other sample sites within the QQ were visited. If all ten points within a QQ were visited and found no sites suitable for oyster sampling were found, that QQ was excluded and moved onto the next QQ.
Once a suitable site was found for ground truthing an intertidal oyster reef within a QQ, the Samsung Tablet and an iSXBlue2+ GNSS capable GPS unit were utilized to map the reef with submeter accuracy. The centerline of the reef was manually walked, and a GIS point was collected every 20 steps. Then, the circumference of the reef was also walked, taking a point every 20 steps, if time and tidal inundation permitted. If the reef was too large to walk the entire circumference, only a portion of the circumference was walked.
Based upon the field data, the location tool was run in GIS to determine polygon gridcode numbers most likely to have reef. Any polygons that contained a ground truthing known reef point were labeled “confirmed” reef, with 82% of the total reefs being verified as confirmed reefs visited. Those polygons sharing the same gridcode as definite reef in the same QQ were labeled “plausible” reef as they shared similar visual characteristics on the analyzed orthophotos but were not actually confirmed in the field. Additional polygons that were pulled during the isocluster analysis process but did not share a common gridcode with confirmed reef in the same QQ were labeled “not likely” reef. On some occasions, field teams went to a polygon site and discovered the location was definitely not reef. Using the select by location tool, polygons that contained a “None” assessment from field work were labeled as “Not Reef”.
Area was calculated for each polygon in each QQ in square meters using the North American Datum (NAD) 1983 Universal Transverse Mercator (UTM) Zone 15 N projection. Area data calculations from shapefiles were downloaded as dbf tables and manipulated in Microsoft Excel to calculate statistics for each QQ and compute final totals.

2.4. Reef Characteristics and Oyster Population Structure

2.4.1. Intertidal Reef Characteristics and Oyster Demography

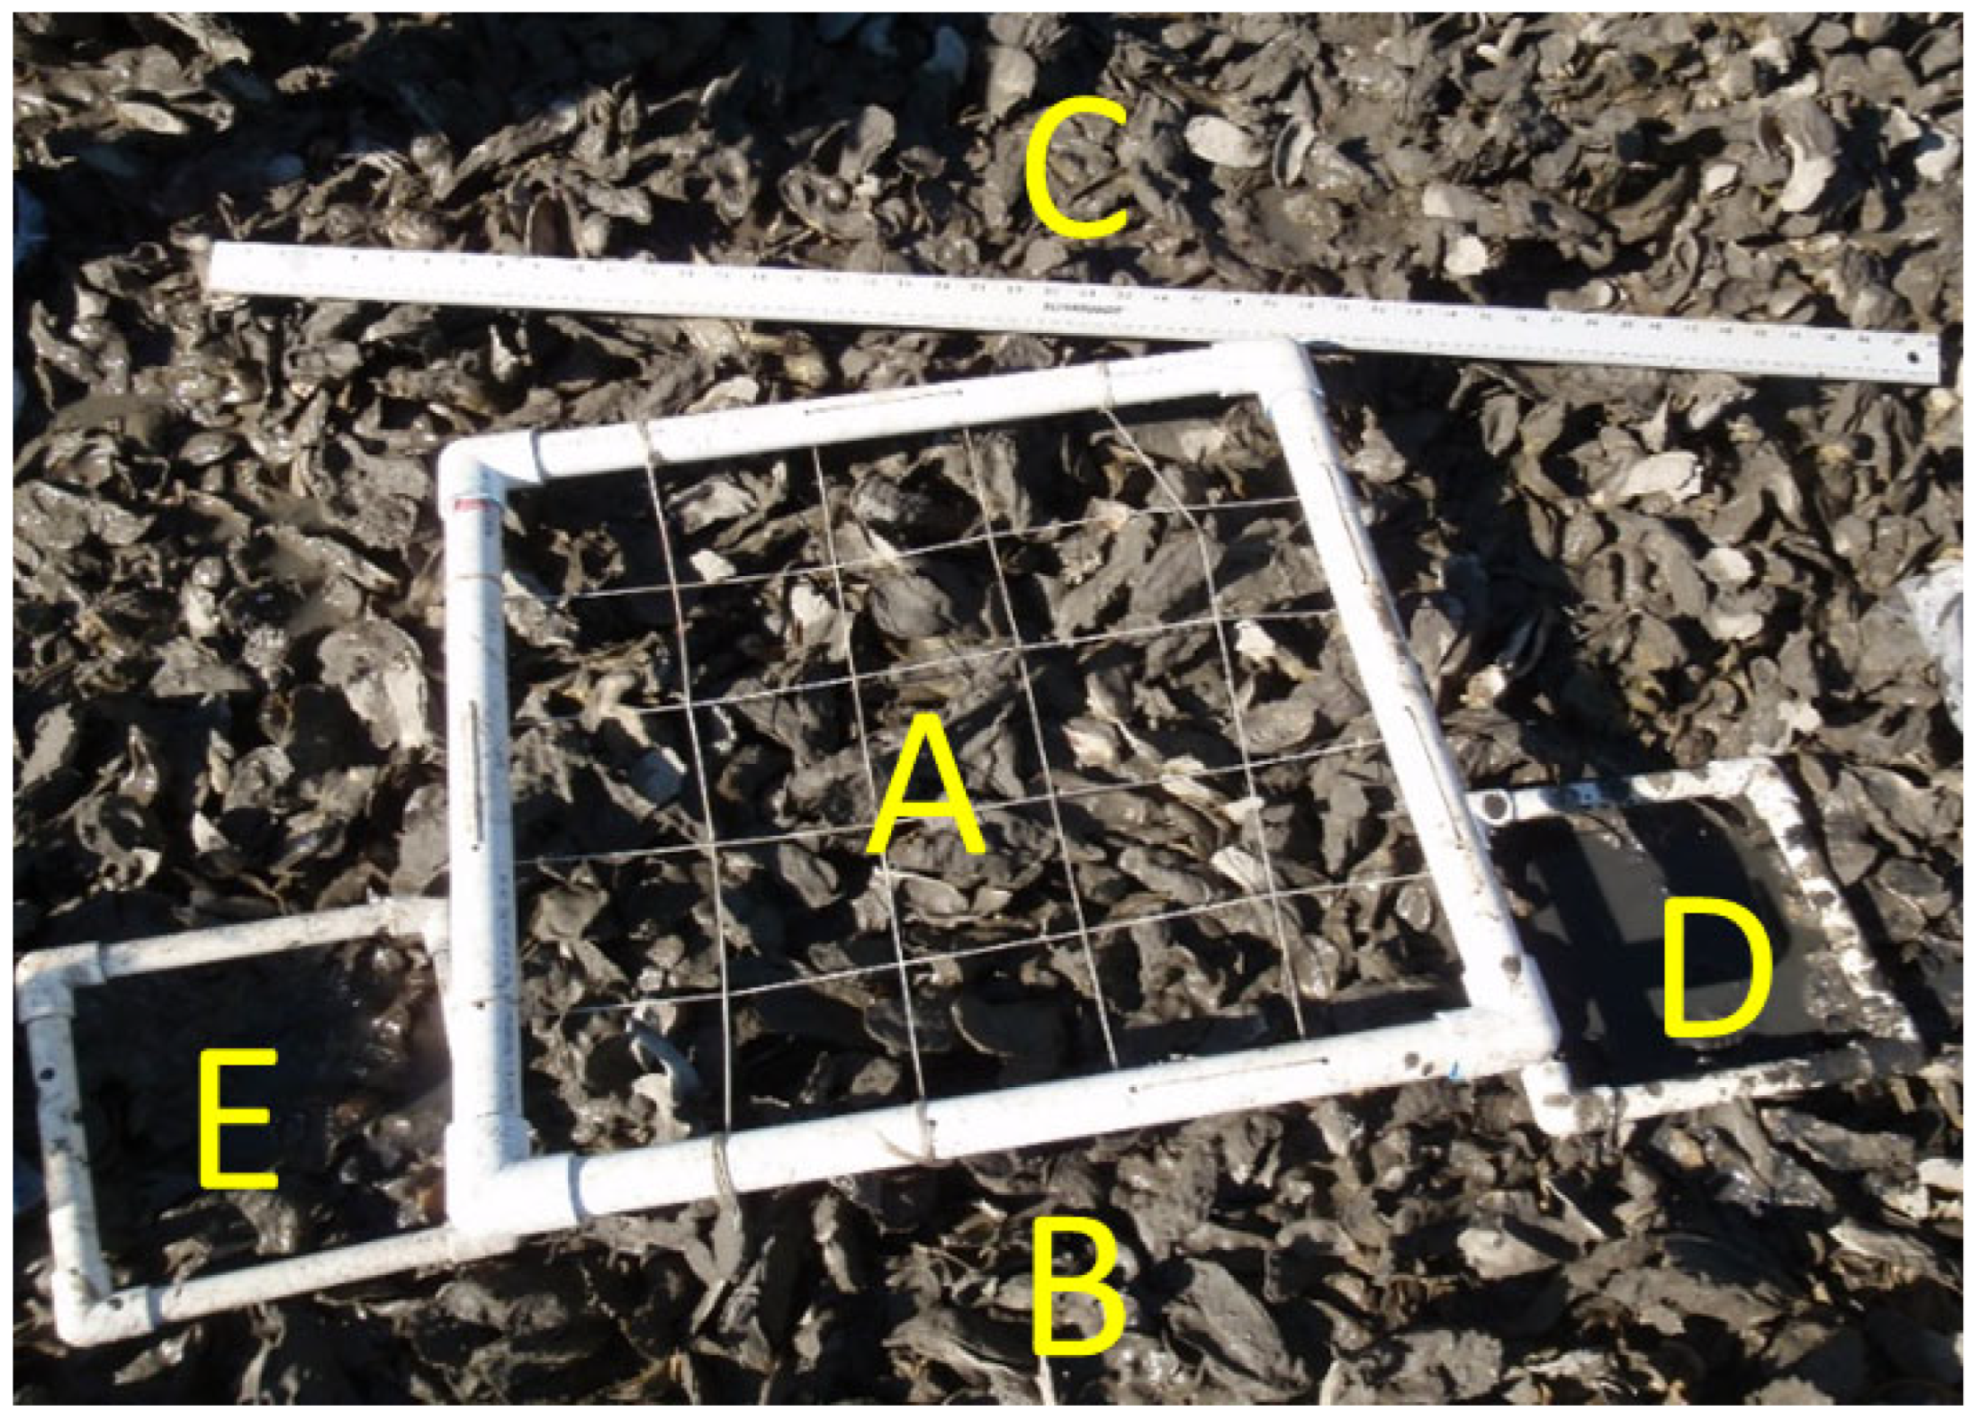
Representative intertidal reefs from each QQ with accessible intertidal reefs were surveyed to determine the physical reef structure and oyster population characteristics. First, reef structure was quantified for percent cover of oyster shell, percentage of live oysters within the oyster shell, and reef height and reef rugosity. For each of these reef characteristics, quadrats (n = 5) were haphazardly deployed across the reef. Percent shell cover and percent live oyster cover were measured with a 0.25 m2 quadrat with 16 evenly spaced points in a 4 × 4 pattern placed on the reef. Under each point, it was determined if live oysters, shell hash, or open bottom was present to estimate total percent reef cover by oyster shell (Figure 2A). The percentage of live oysters was quantified by the number of live oyster points, within the quadrat, divided by the total number of points with shell present (Figure 2A). Reef rugosity, which is a measurement of topographical heterogeneity that provides a relative index of reef complexity [60], was quantified by laying a 1 m chain parallel to each 0.25 m2 quadrat and then measuring the chain distance after conformation with the reef (Figure 2B). Reef height was determined by a measurement of the tallest oyster or culm within the quadrat (Figure 2C). Within each 0.04 m2 quadrat (Figure 2D,E), the shell height (SH) of the first 20 oysters were measured and the remaining oysters enumerated.

2.4.2. Oyster Condition Index

Oyster Condition Index (CI), which provides a relative measurement of physiological health [59,61,62,63], was determined for oysters on each representative reef by collecting oysters with SHs of 50–70 mm (n = 15 per reef, if available) haphazardly from the reef [7,61]. In the lab, the amount of oyster tissue relative to the internal volume inside the shell was calculated [61,62,63] via (Equation (1)):
C o n d i t i o n   I n d e x = d r y   m e a t   w e i g h t   g i n t e r n a l   s h e l l   c a v i t y   v o l u m e   c m 3 × 100
where the internal shell cavity volume was determined as the differential weight between the whole oyster and the weight of the dried empty shell. The CI values provide a relative health index, with poor oyster condition represented by low values and increased health represented by higher values [61,62,63].

2.4.3. Reef Associated Benthic Macrofauna

The associated benthic macrofauna (ABM) community was collected on each representative reef by excavating one of the 0.04 m2 quadrats next to the 0.25 m2 quadrat (Figure 2D) haphazardly sampled on each reef. All organisms with limited vagility were removed in the field and returned to the lab and preserved in 70% alcohol. Bivalves and crabs were identified according to species, enumerated, and measured (shell height for bivalves, carapace width for crabs). All other organisms were identified as far as taxonomically possible and enumerated.

2.5. Statistical Analysis

All reef and oyster data were analyzed with SAS Version 9.4 software (SAS Institute) and differences between the QQs were compared with an Analysis of Variance (ANOVA) using the proc general linear model (GLM) procedure with random effects. Values of percent cover and percent live were arcsine square root transformed on the proportion values prior to analysis. For reef rugosity, a rugosity index (Rq) was calculated with the formula Rq = 1 − d/1, with d representing the distance in centimeters of the chain after conformation to the reef [60]. The Rq values were arcsine square root transformed prior to analysis [7]. Reef height, oyster abundance, and oyster shell height were tested for homogeneity of variance (Levene’s test) prior to analysis and, if the data did not meet the assumptions of normality, were log(x + 1) transformed prior to analysis. Any significant ANOVA results were further analyzed with a Student–Newman–Keuls (SNK) post hoc test. Following Bagget et al. 2014 [64], all oyster abundance values are presented by extrapolated to abundance per m2. For the ABM, species richness and diversity (Shannon’s Diversity Index) was calculated with the Vegan Package in R and a one-way ANOVA was utilized to compare each QQ. Finally, a Pearson Product-Moment Correlation was tested the hypothesis that there was a relationship for diverse ABM communities with oyster reef characteristics and oyster abundance.

3. Results

3.1. GIS Analysis and Groud Truthing

In this project, 59,931 m2 (14.8 acres) of intertidal oyster reef was confirmed by ground truthing across all 27 QQs (Appendix A). Further, the GIS model predicted that there are an additional 758,197 m2 (187.35 acres) of reef habitat based upon the similarities in orthoimage input raster bands after Iso Cluster Unsupervised Classification between these areas and confirmed reef (Appendix A). In total, 687,975 m2 was estimated as not likely reef (Appendix A). These areas do not share the same input raster band signatures with confirmed reef in their respected QQ and are likely mud flat or submerged vegetation habitat. Finally, roughly 1187 m2 was observed in the field during ground truthing as non-intertidal reef habitat (Appendix A).
The greatest amount of confirmed reef was in the 2994_41_2 (VIRGINIA POINT NE) QQ at 18,474.82 m2, followed by the 2994_41_4 (VIRGINIA POINT SE) QQ at 11,485.48 m2. These two QQs also represented the greatest amount of plausible reef, with a total of 349,105.27 m2 (86.27 acres) over both. No confirmed or plausible reef was identified in 14 of the 27 QQs.

3.2. Intertidal Oyster Reef Characteristics and Oyster Demography

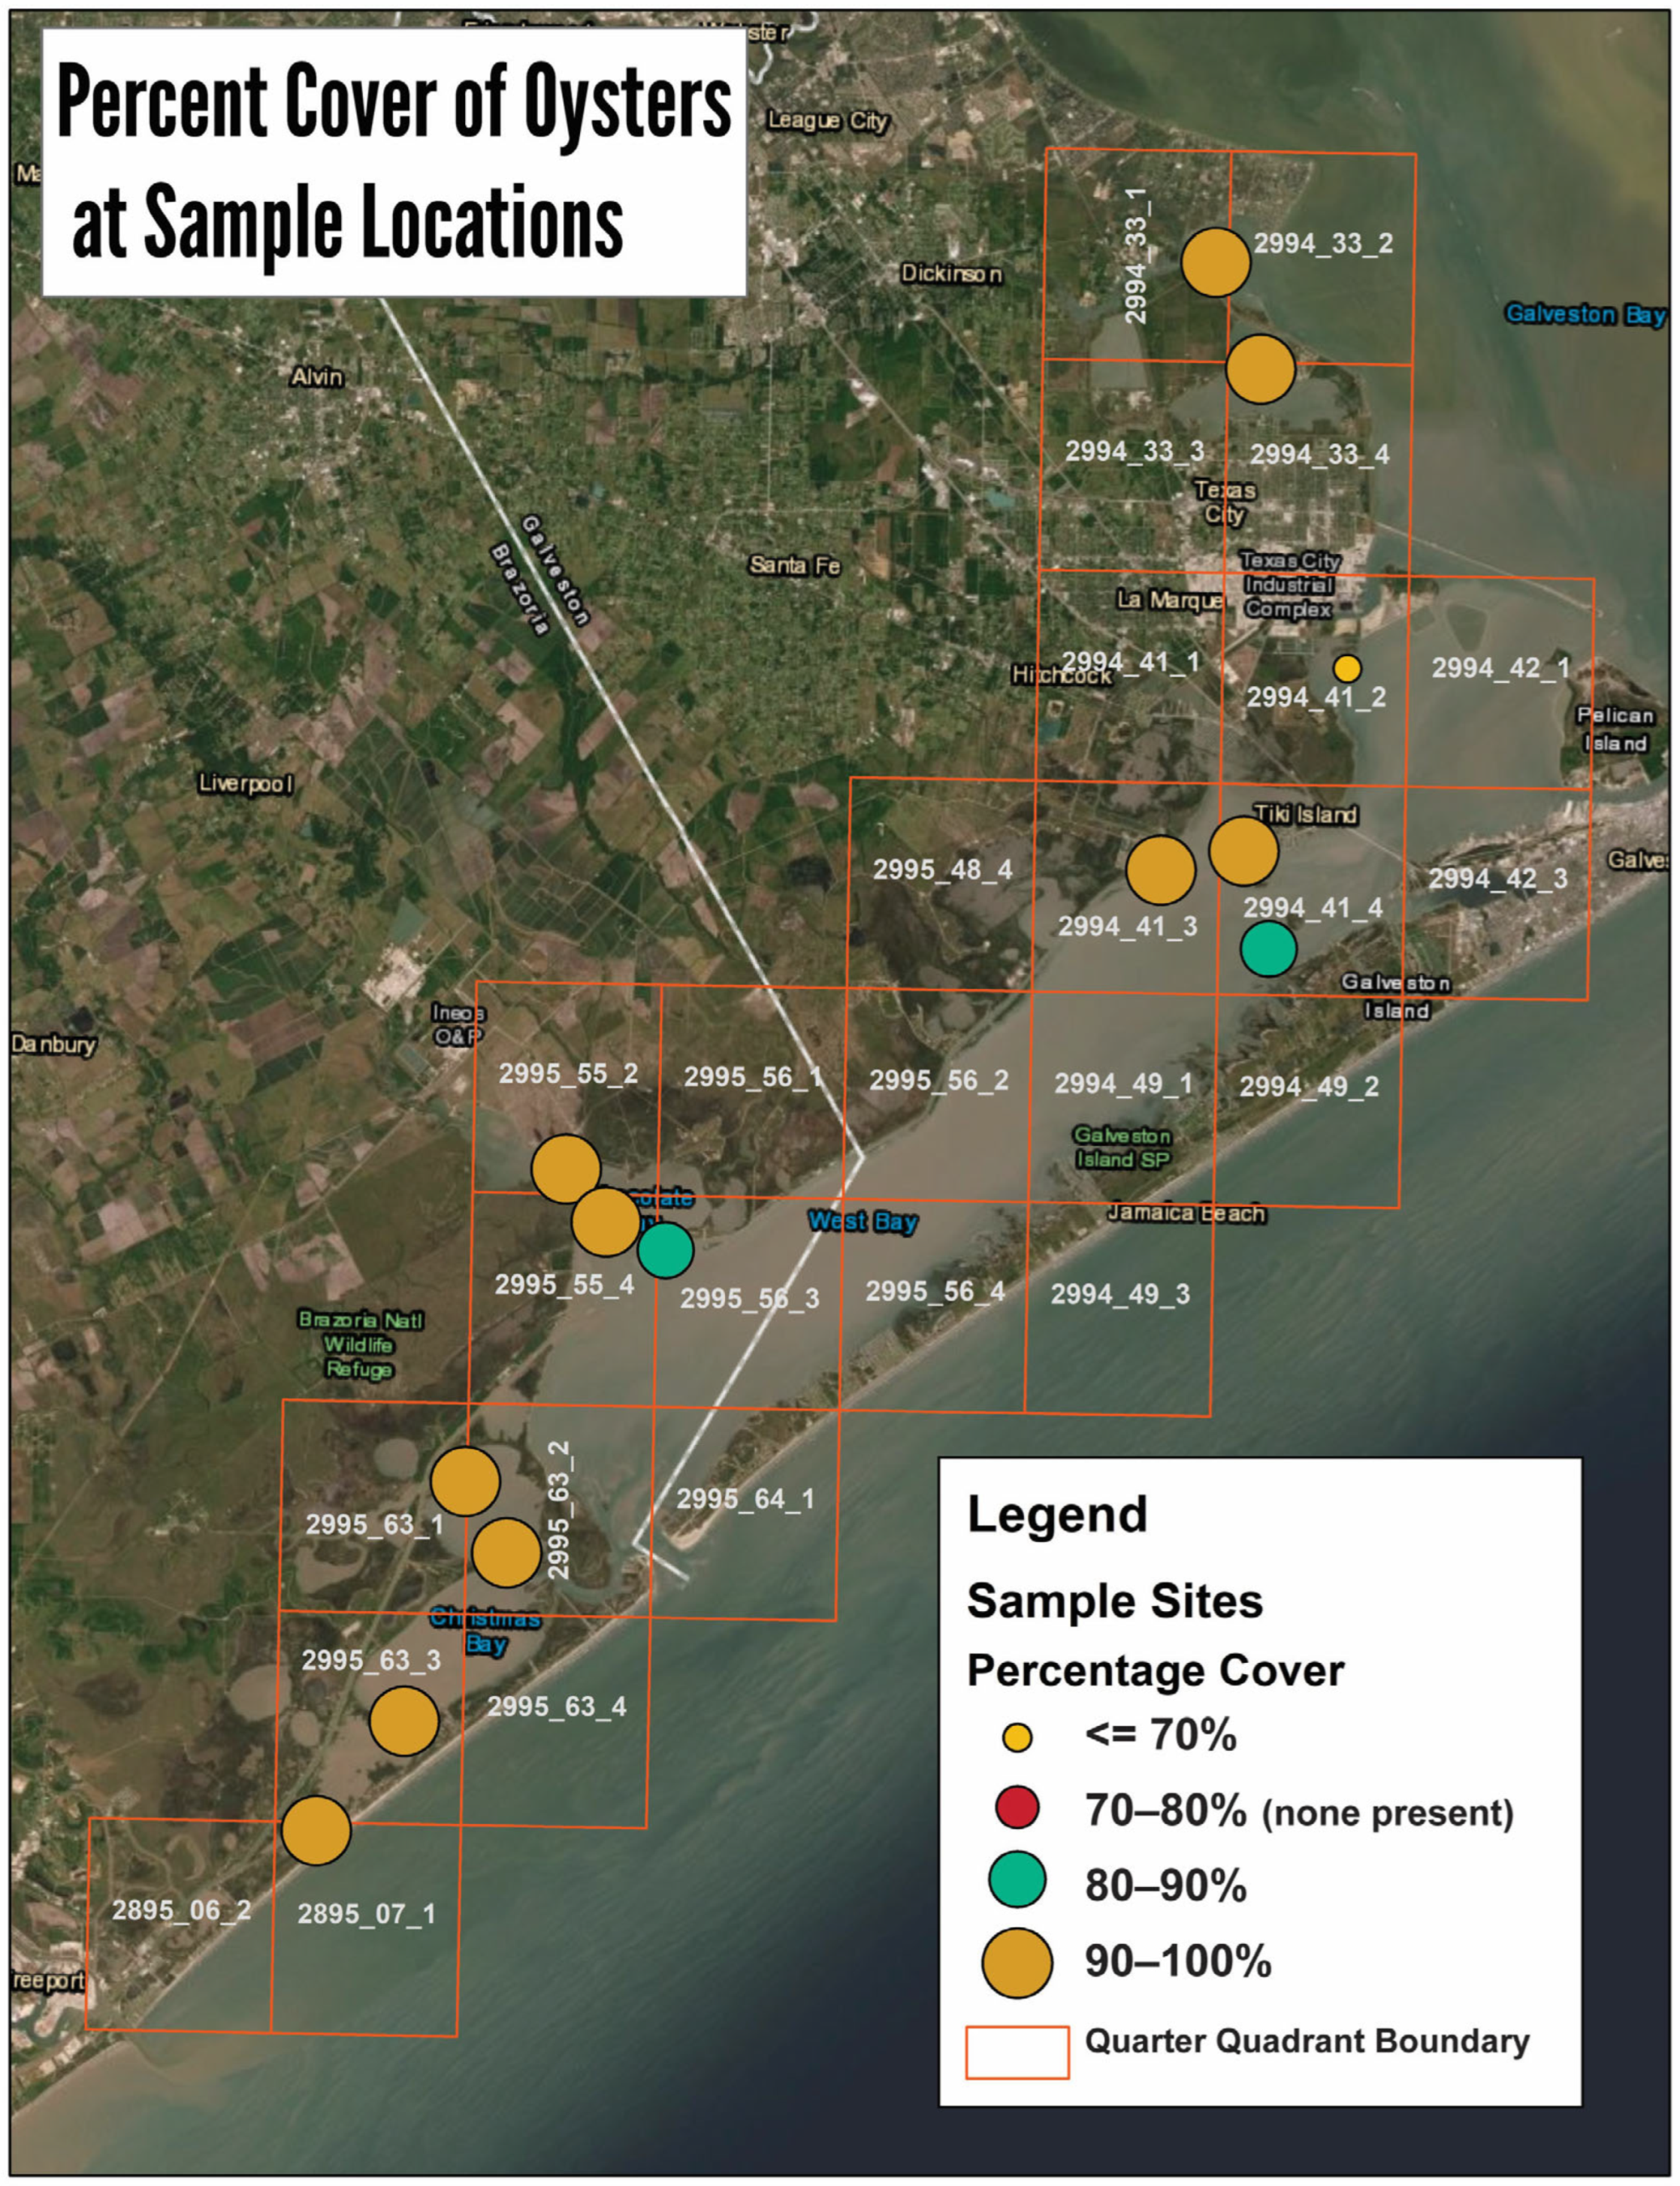
Percent reef cover varied significantly among the QQs (F12,52 = 3.37, p = 0.001); however, this difference was driven by a significantly lower reef cover within a single QQ representative reef (2994_41_2, Figure 3 and Figure 4). The remaining 12 representative reefs were mainly covered by oyster shell (Figure 3).
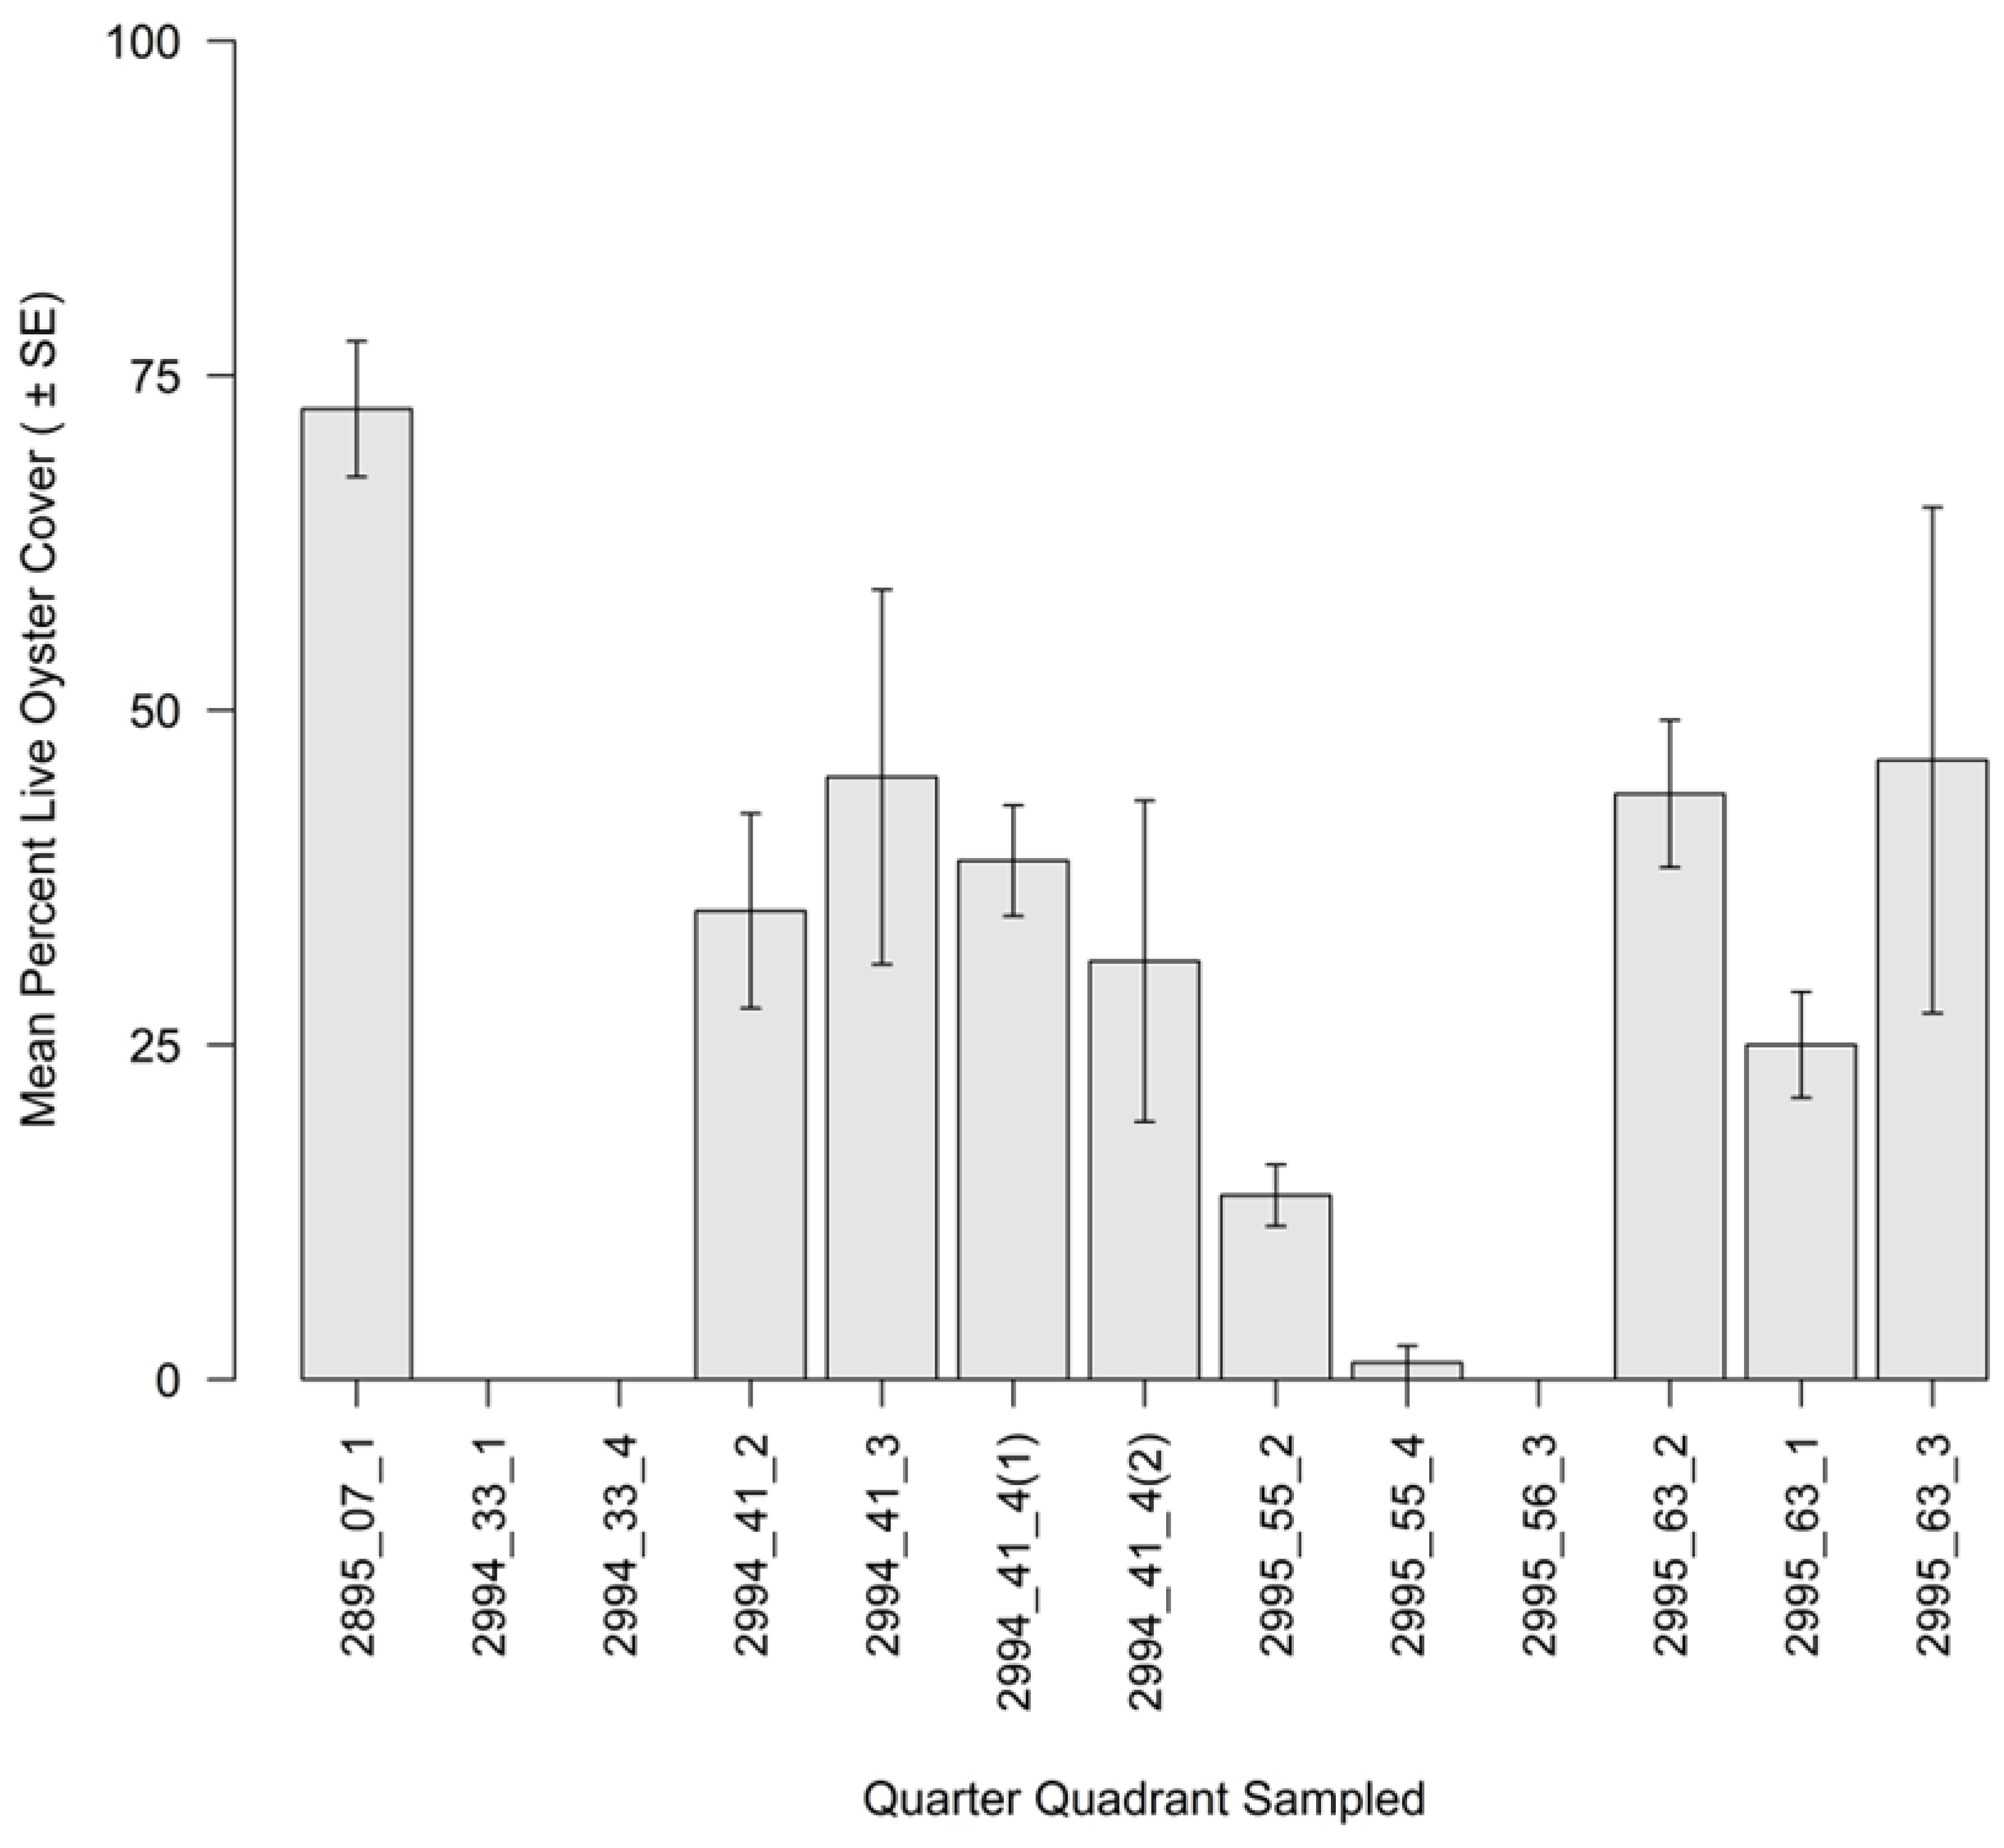
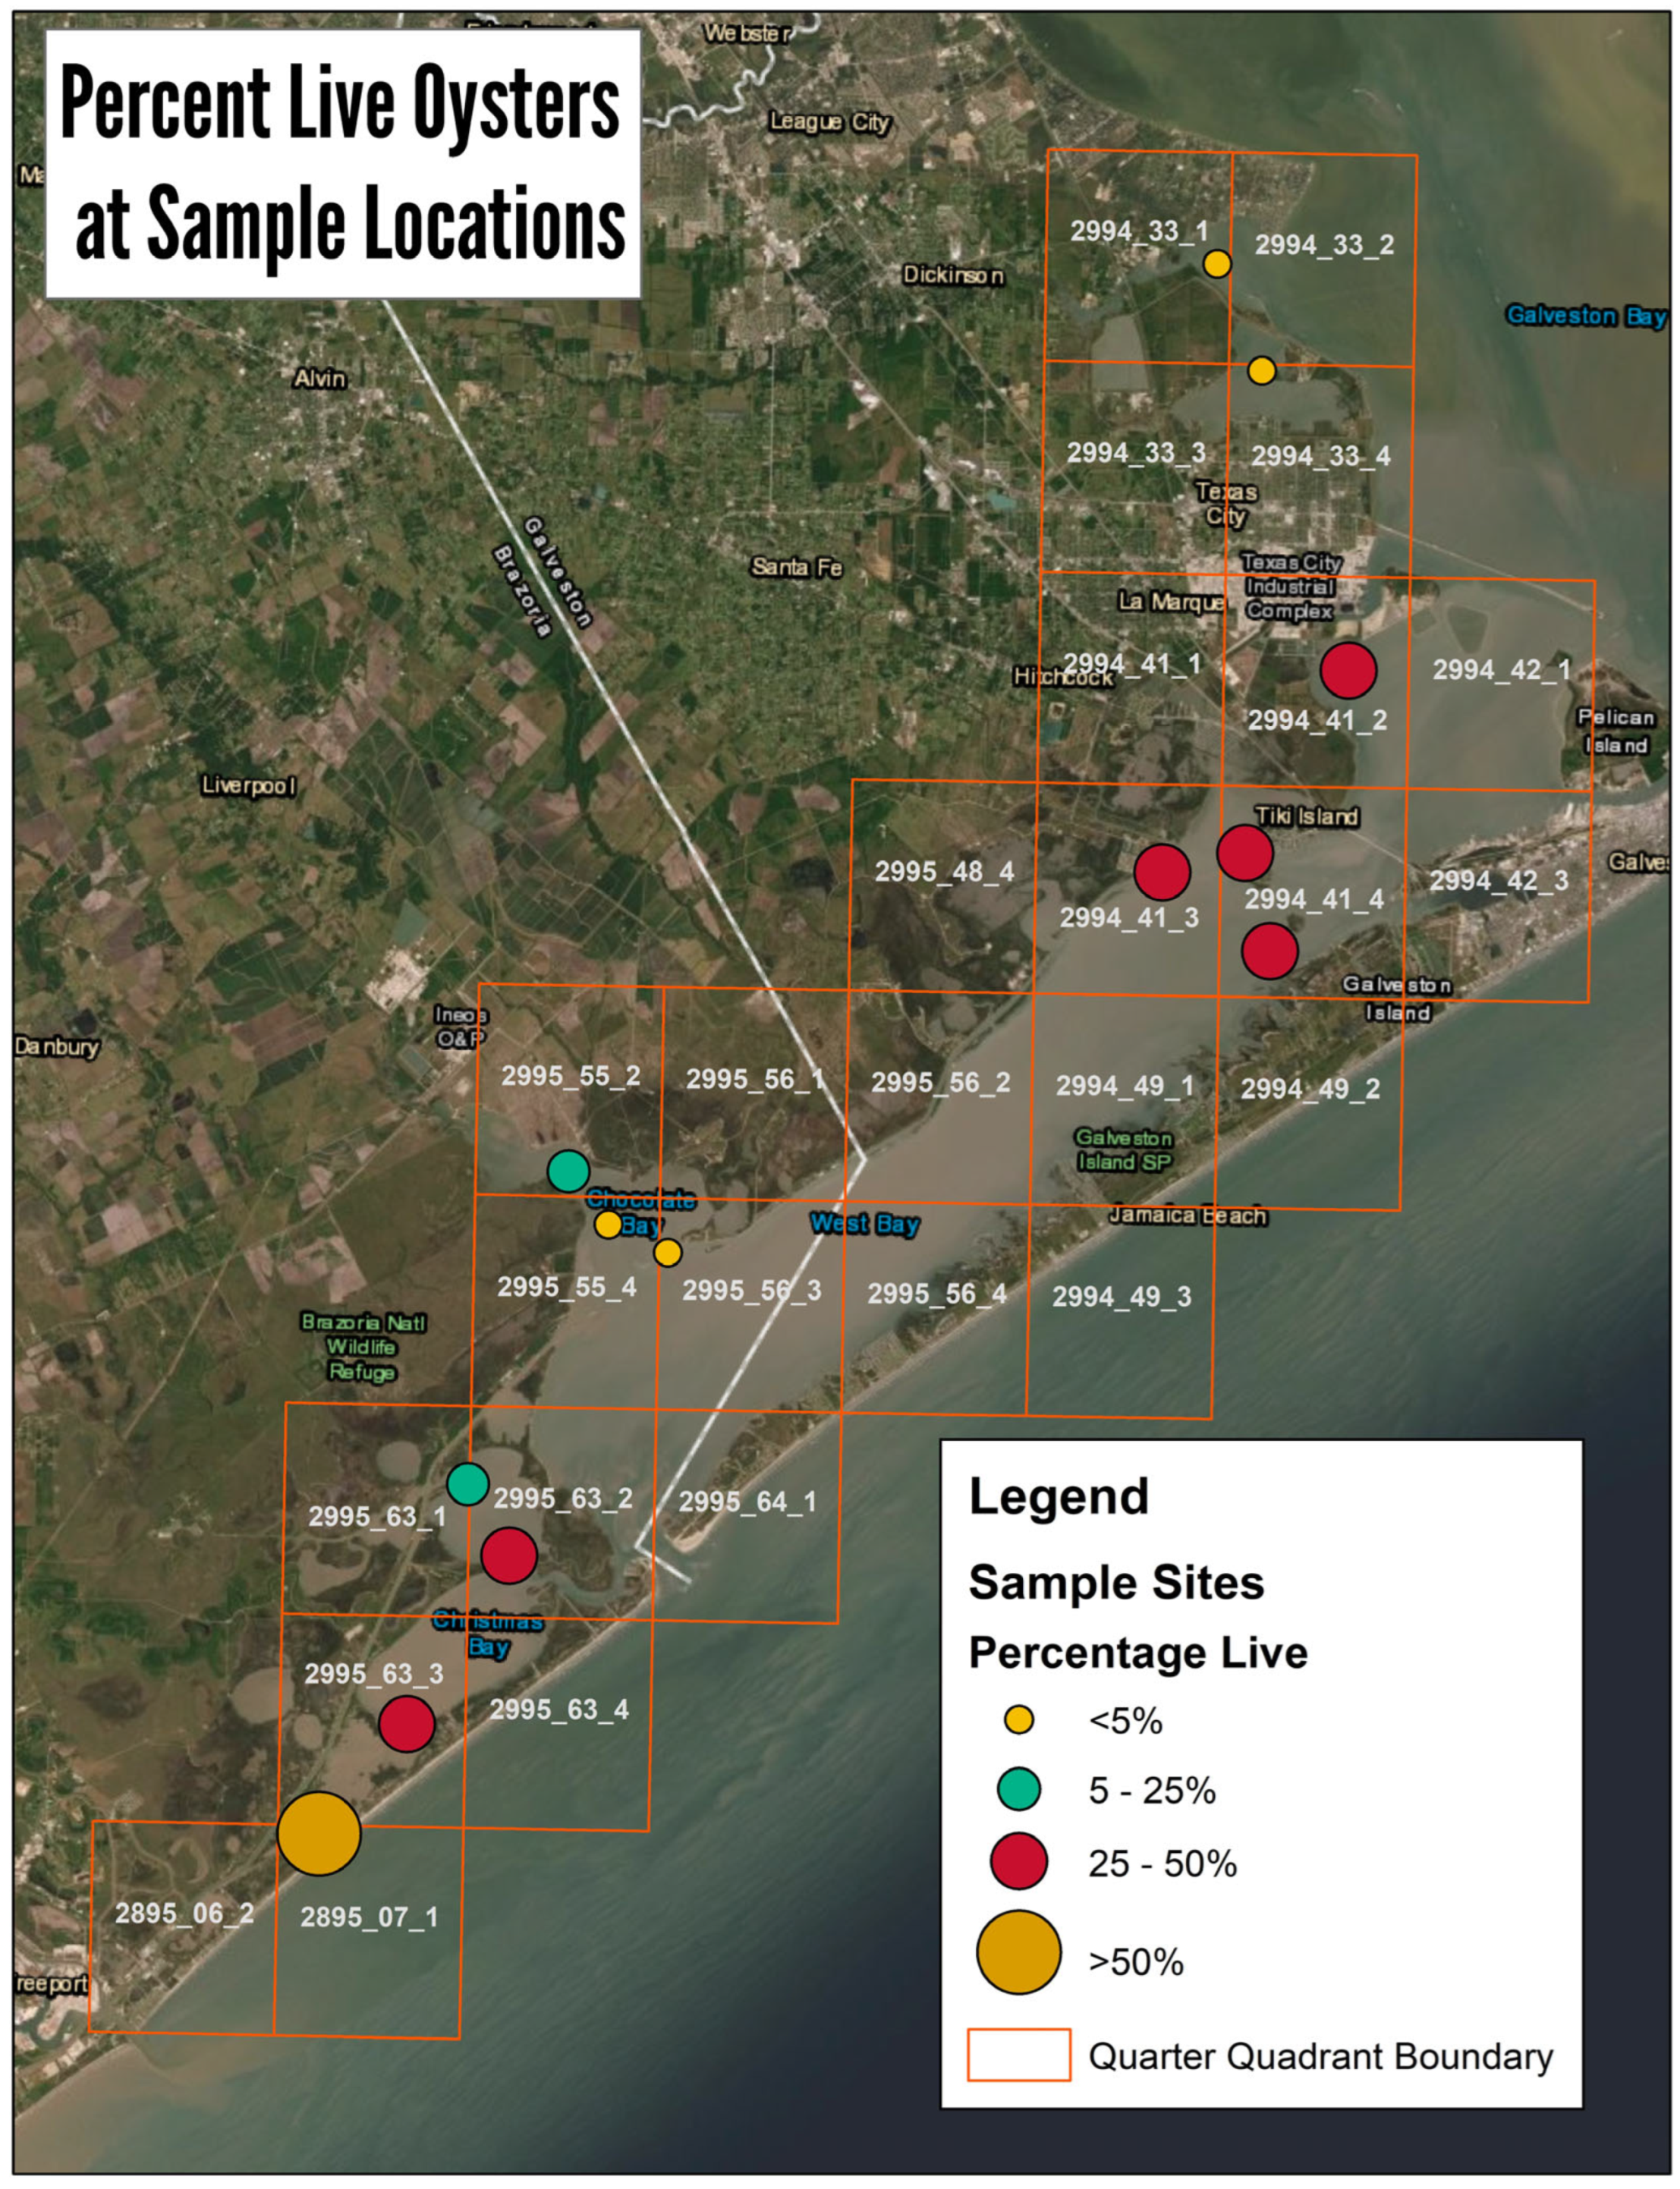
However, the percent of live oysters was more variable among the QQs (F12,52 = 10.29, p < 0.001, Figure 5), with representative reefs with increased percent of live oysters being found in the northern and southernmost ends of West Galveston Bay (Figure 5 and Figure 6).
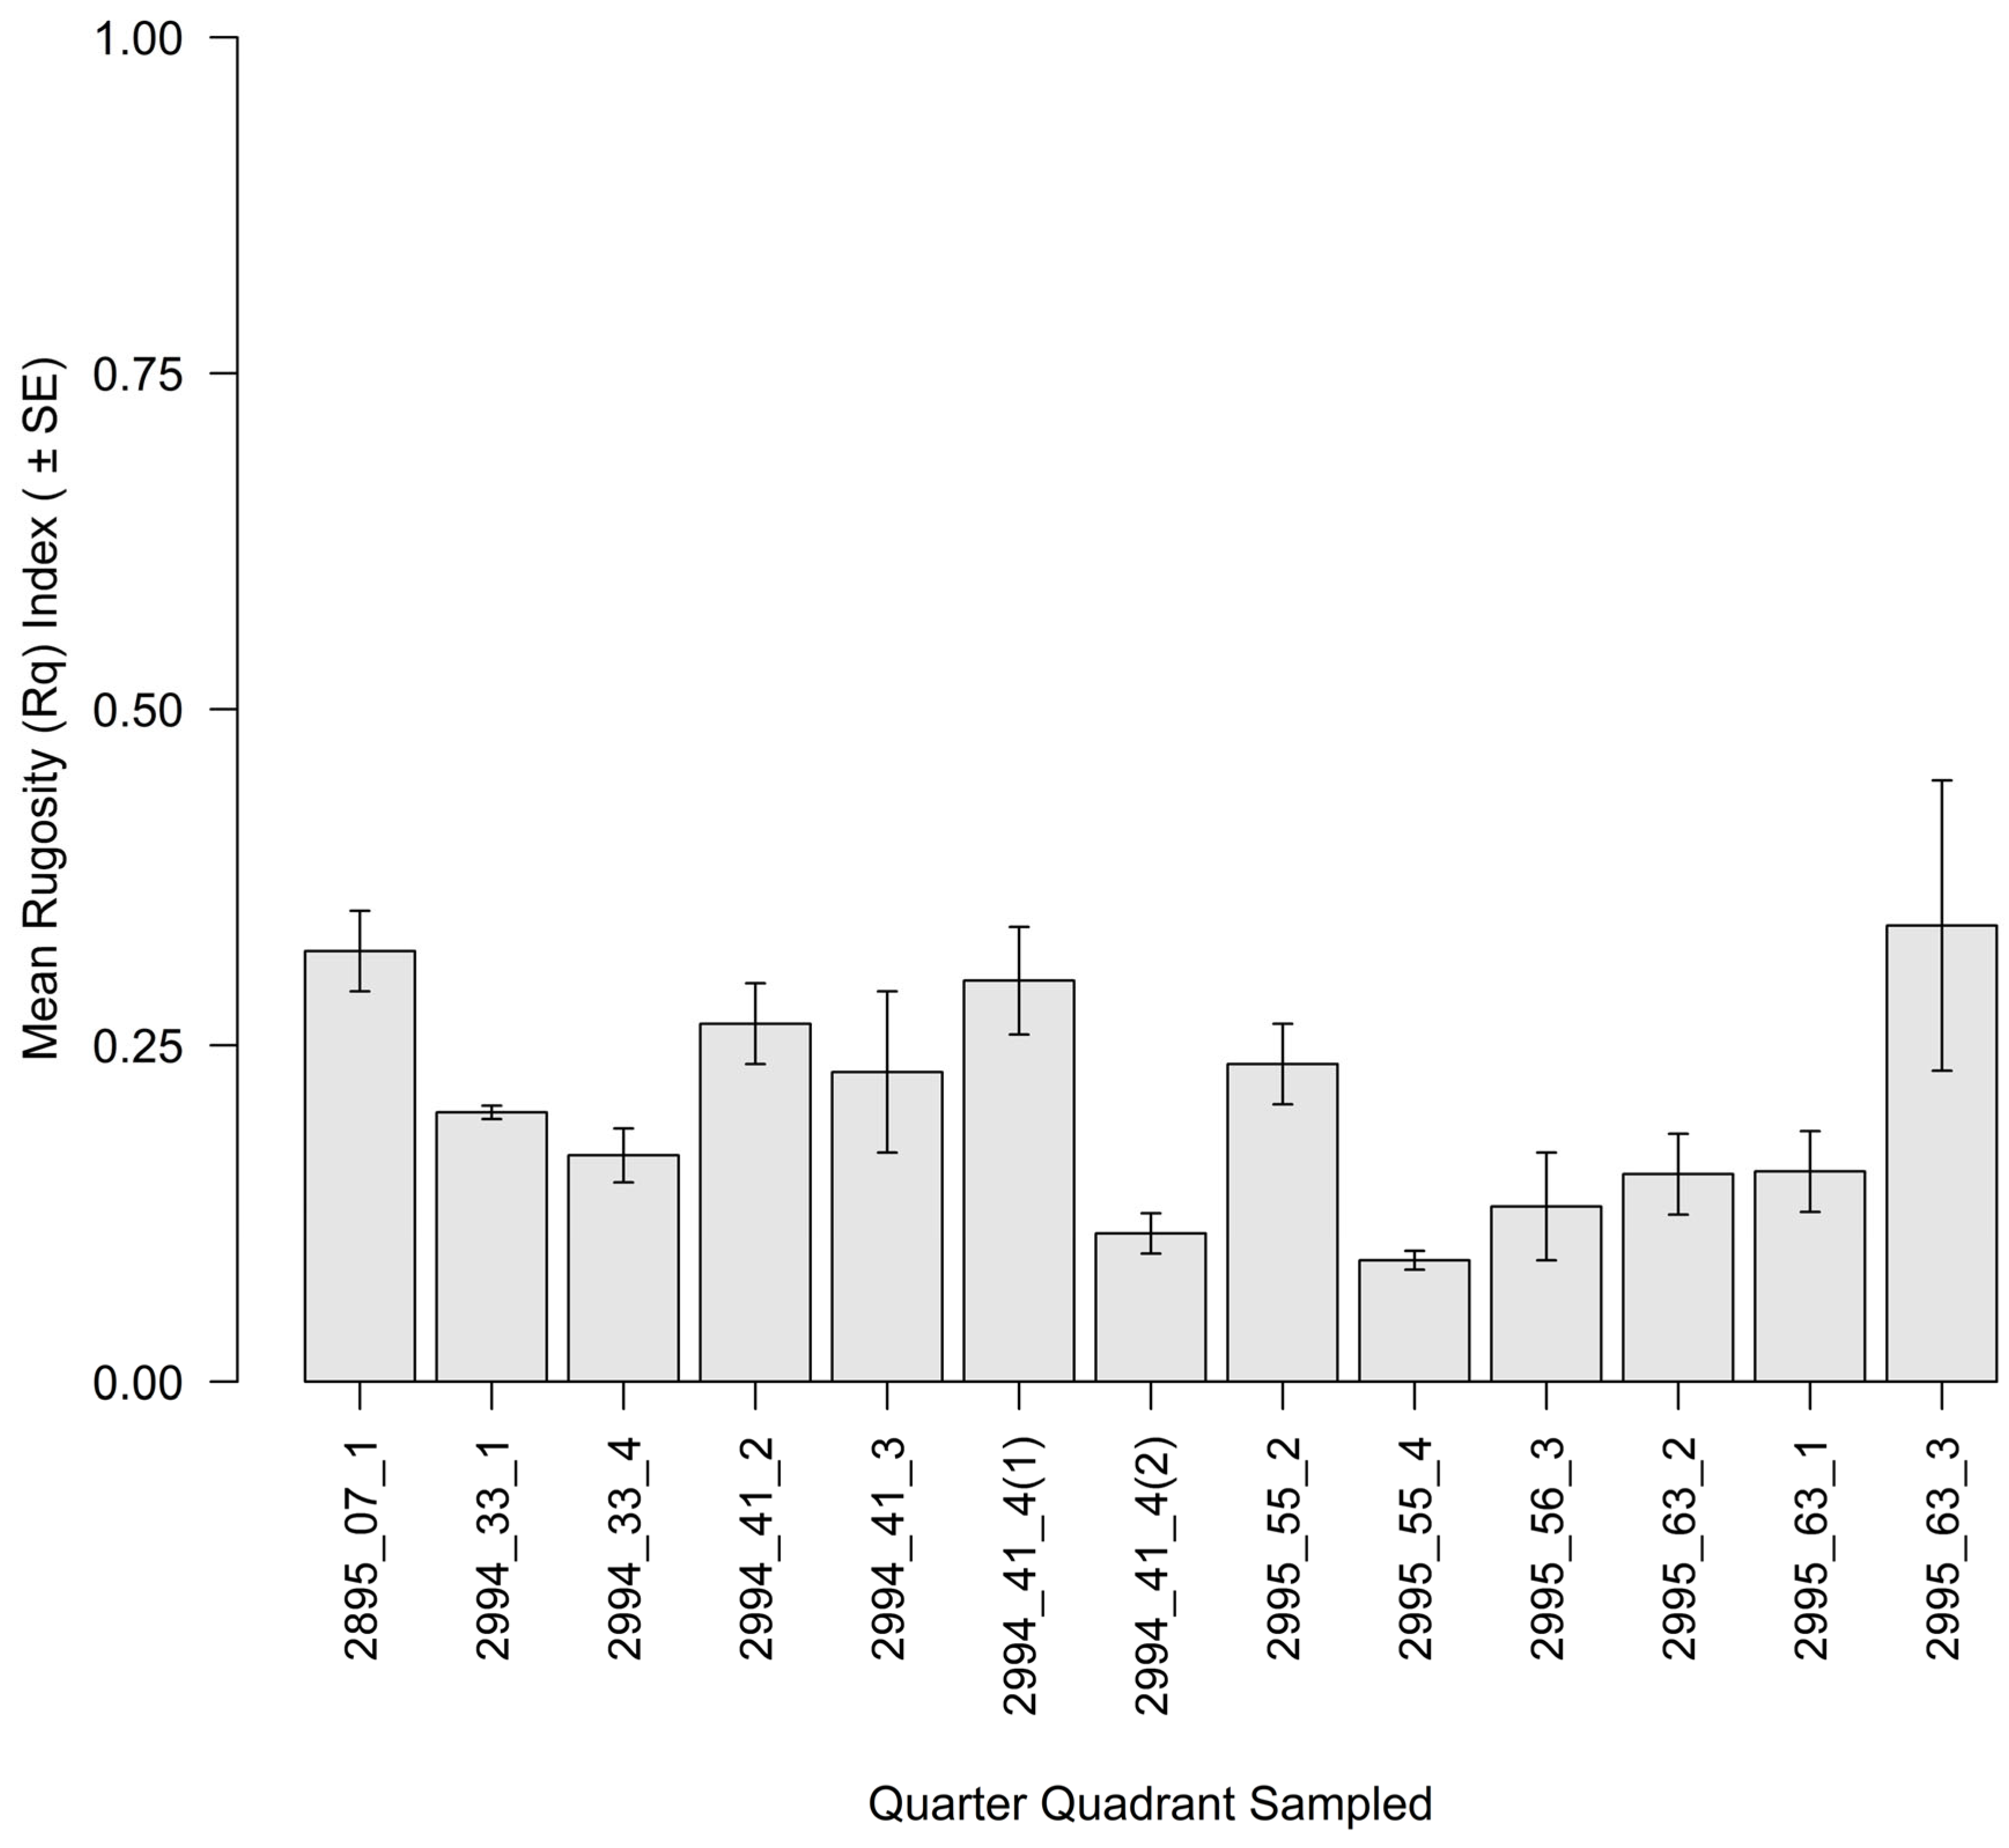
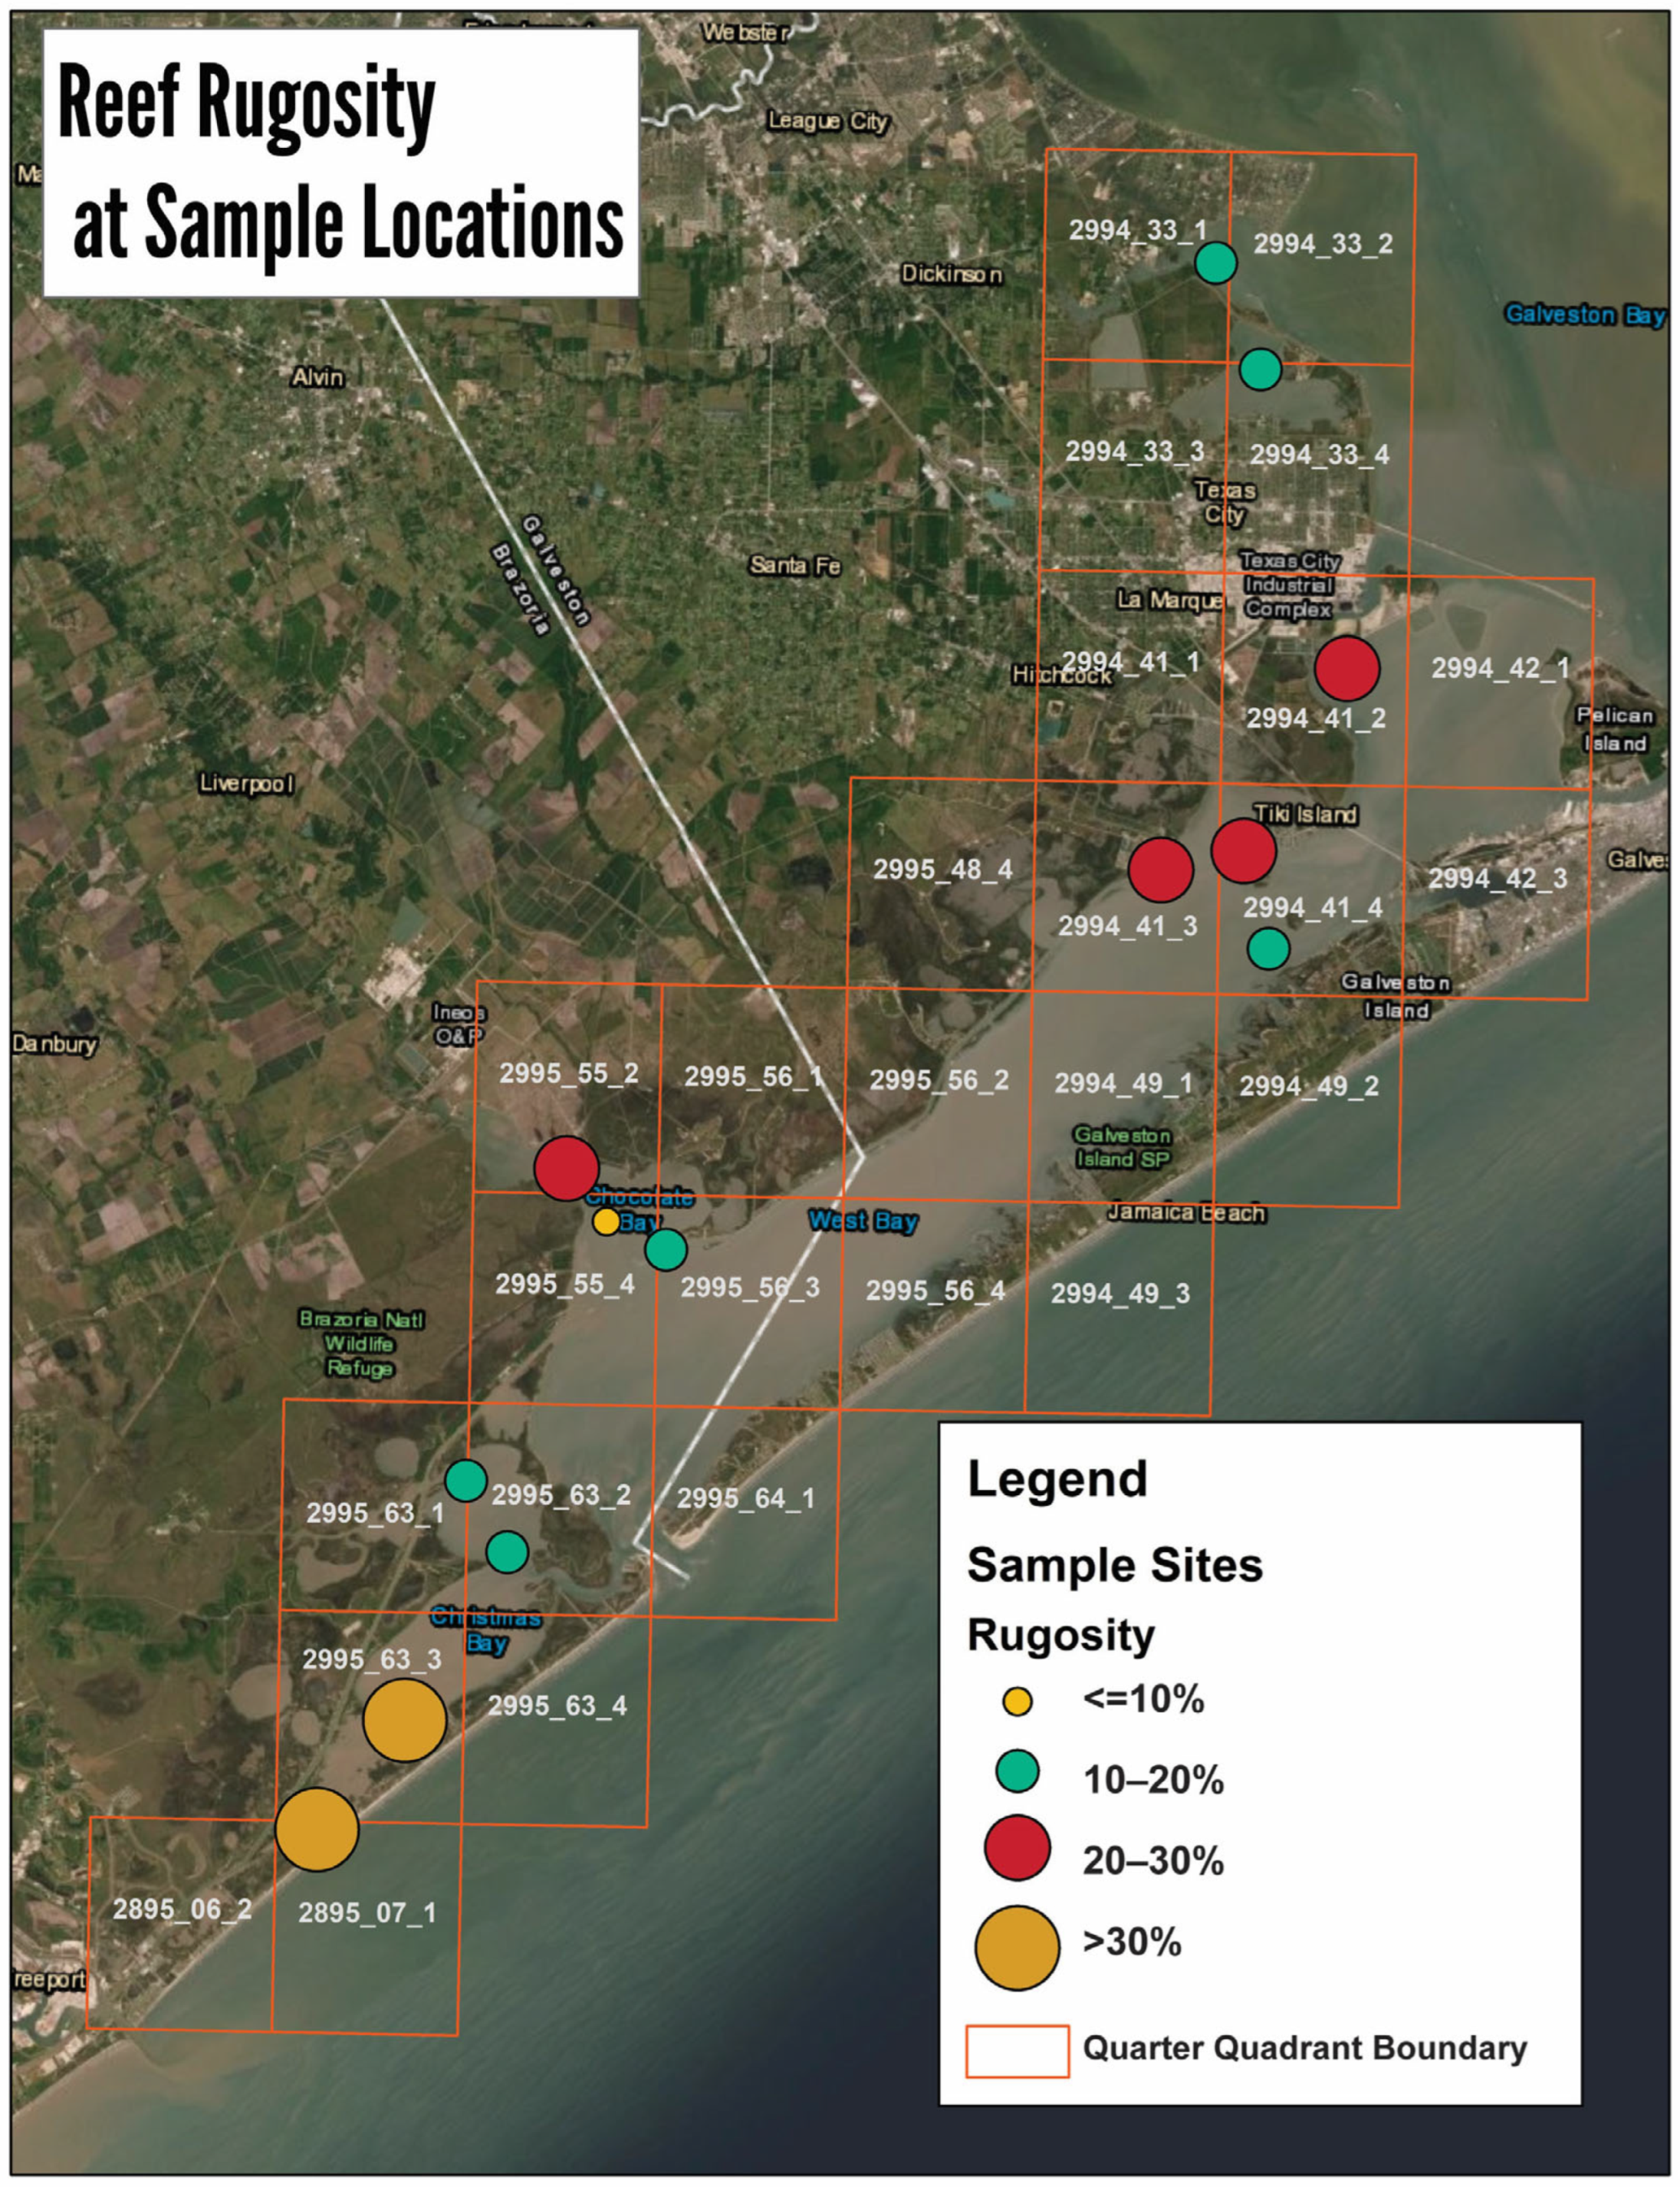
Overall, the reefs exhibited low topographic heterogeneity (Figure 7) but did exhibit significant differences compared to one another (F12,52 = 3.28, p = 0.001). QQs 2995_63_3 and 2895_7_1 had significantly greater complexity compared to QQs 2994_41_4(2) and 2995_5_4. The reefs with the greatest topographical heterogeneity were in the southernmost portion of West Galveston Bay. Intermediate values for rugosity were found in the northern portion of West Bay, adjacent to Galveston Bay proper (Figure 8).
Reef height exhibited similar patterns, as there was a significant difference (F12,52 = 11.29, p < 0.001) between the QQs sampled (Figure 9), with the reefs with the greatest vertical measurements of oysters occurring on representative reefs found at the southernmost end of West Galveston Bay and in the northern portion of West Bay adjacent to Galveston Bay proper (Figure 9 and Figure 10).
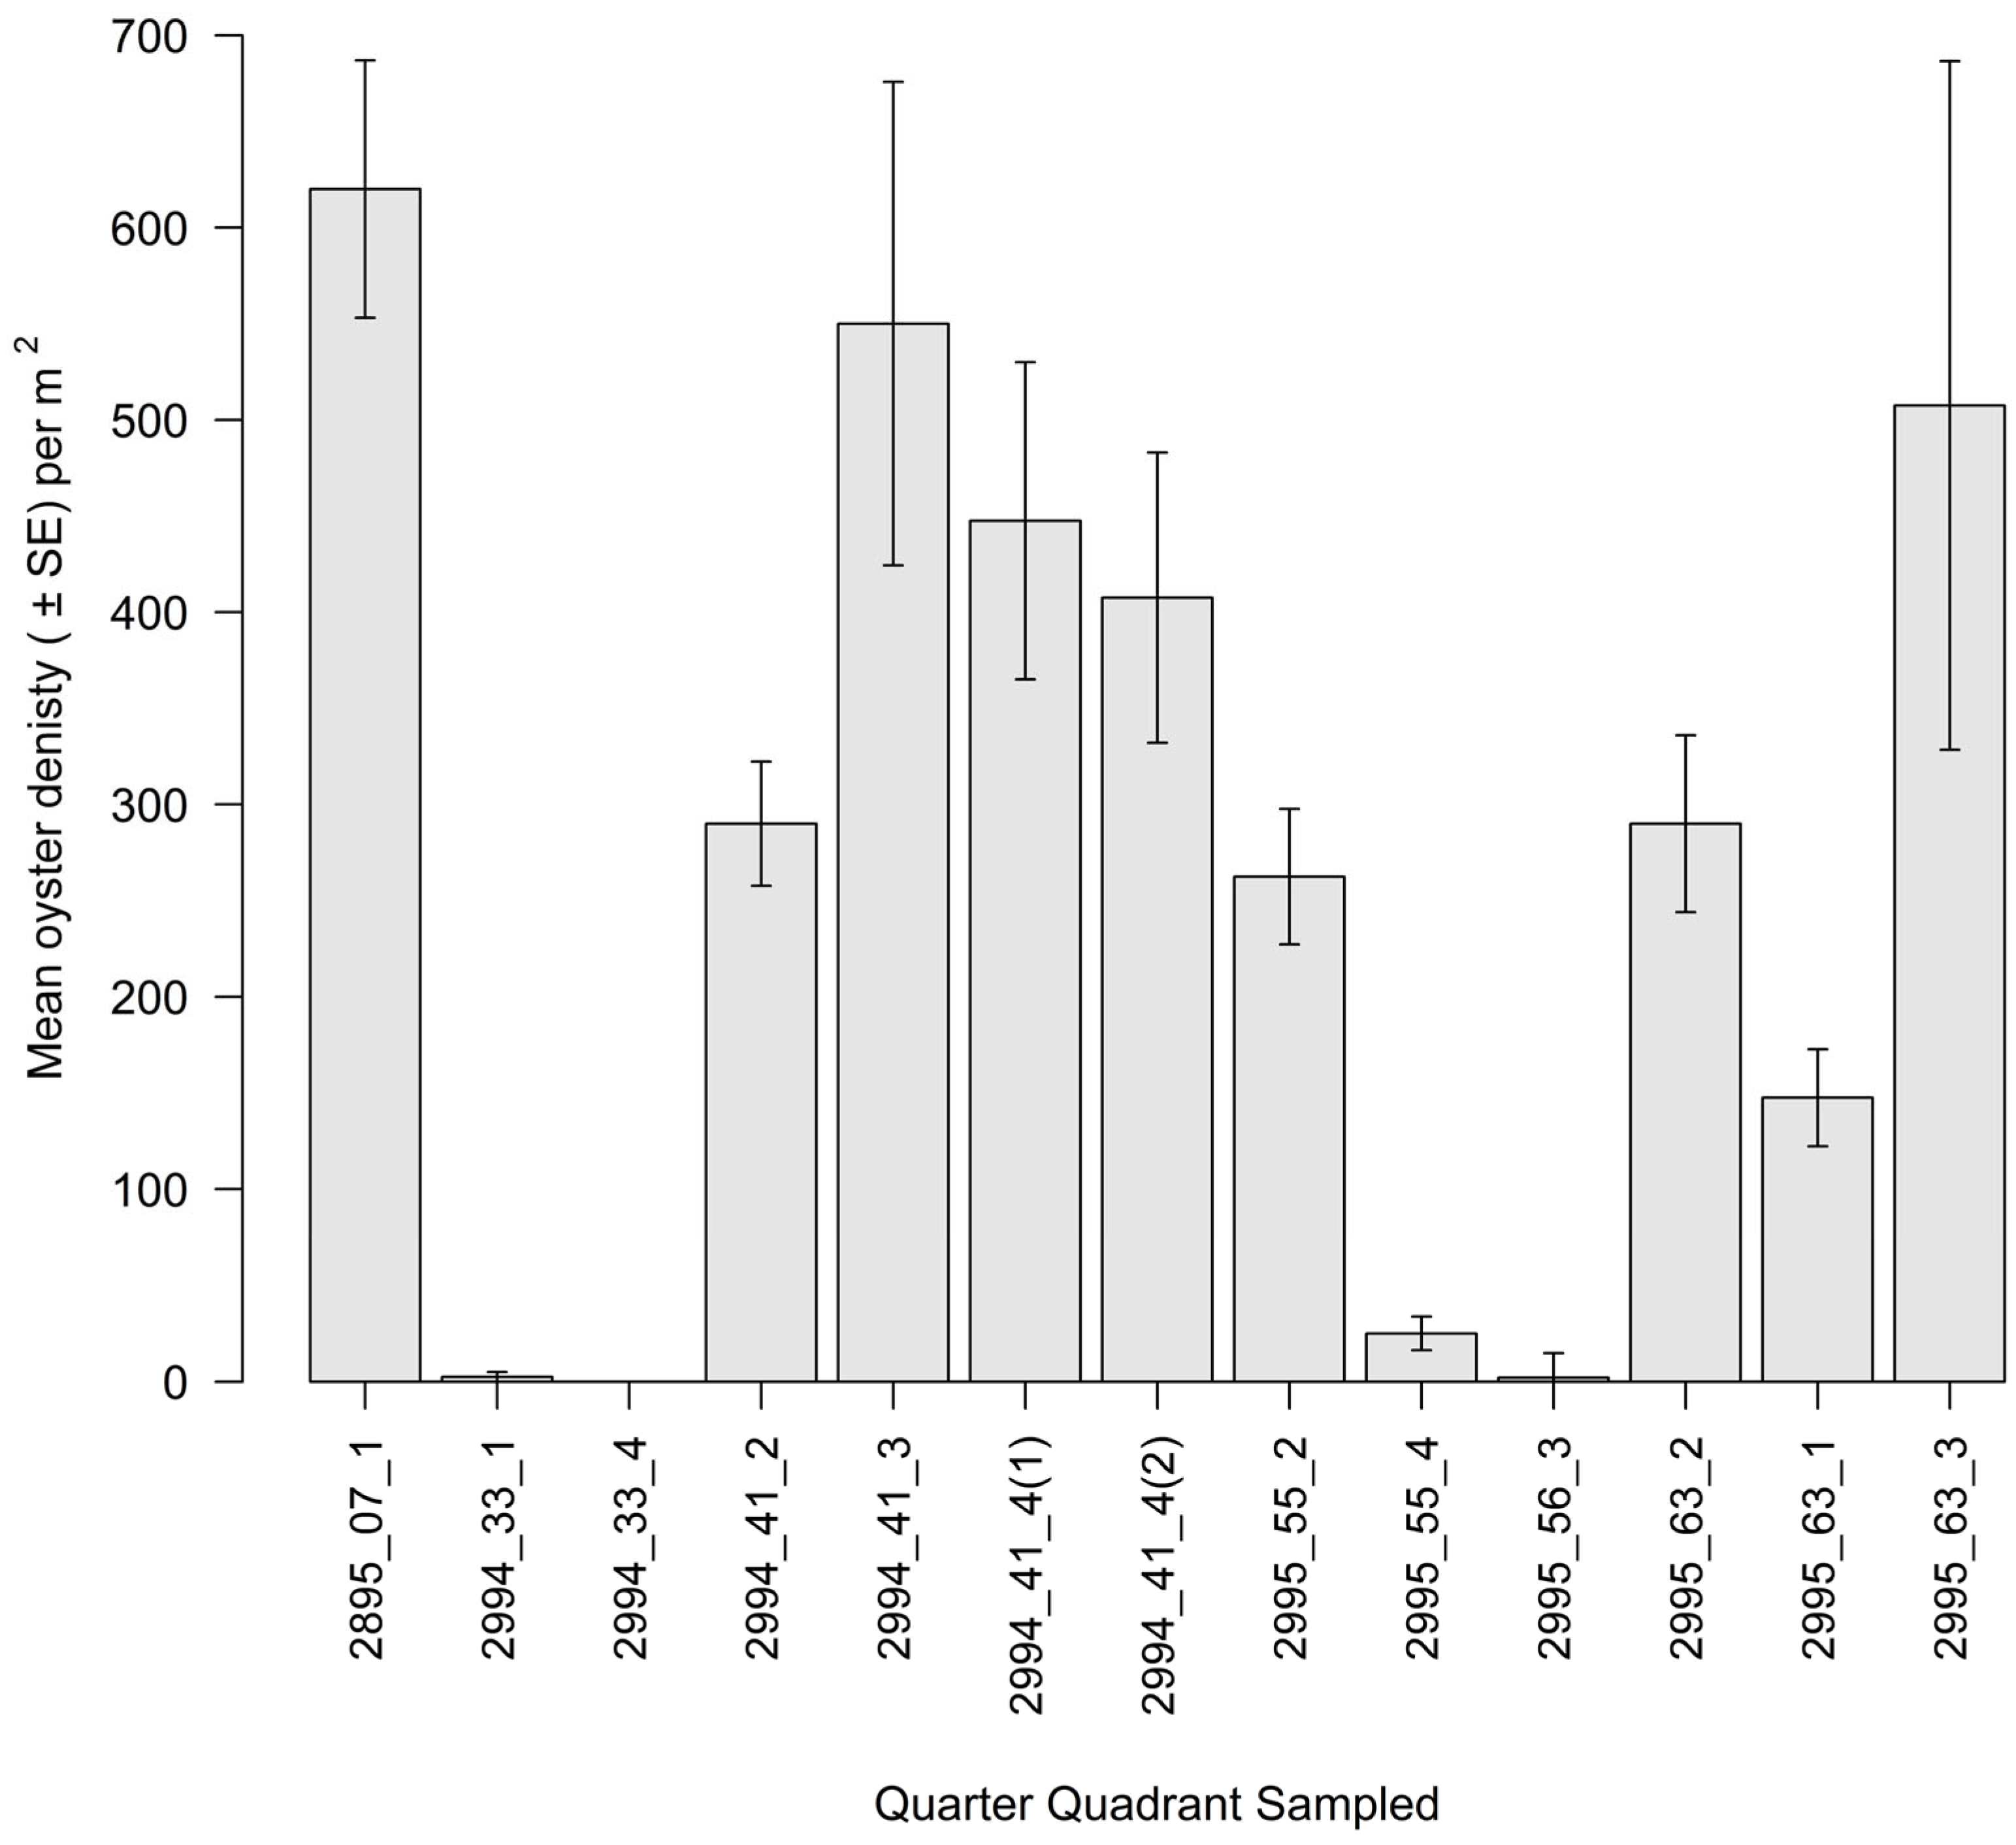
Using log(x + 1) data, oyster densities varied significantly among the QQs (F12,52 = 9.10, p < 0.001), with several representative reefs having little or no oysters present (Figure 11). Representative reefs with higher oyster abundance were spatially located at the southern portion of West Galveston Bay and adjacent to Galveston Bay proper (Figure 11 and Figure 12).
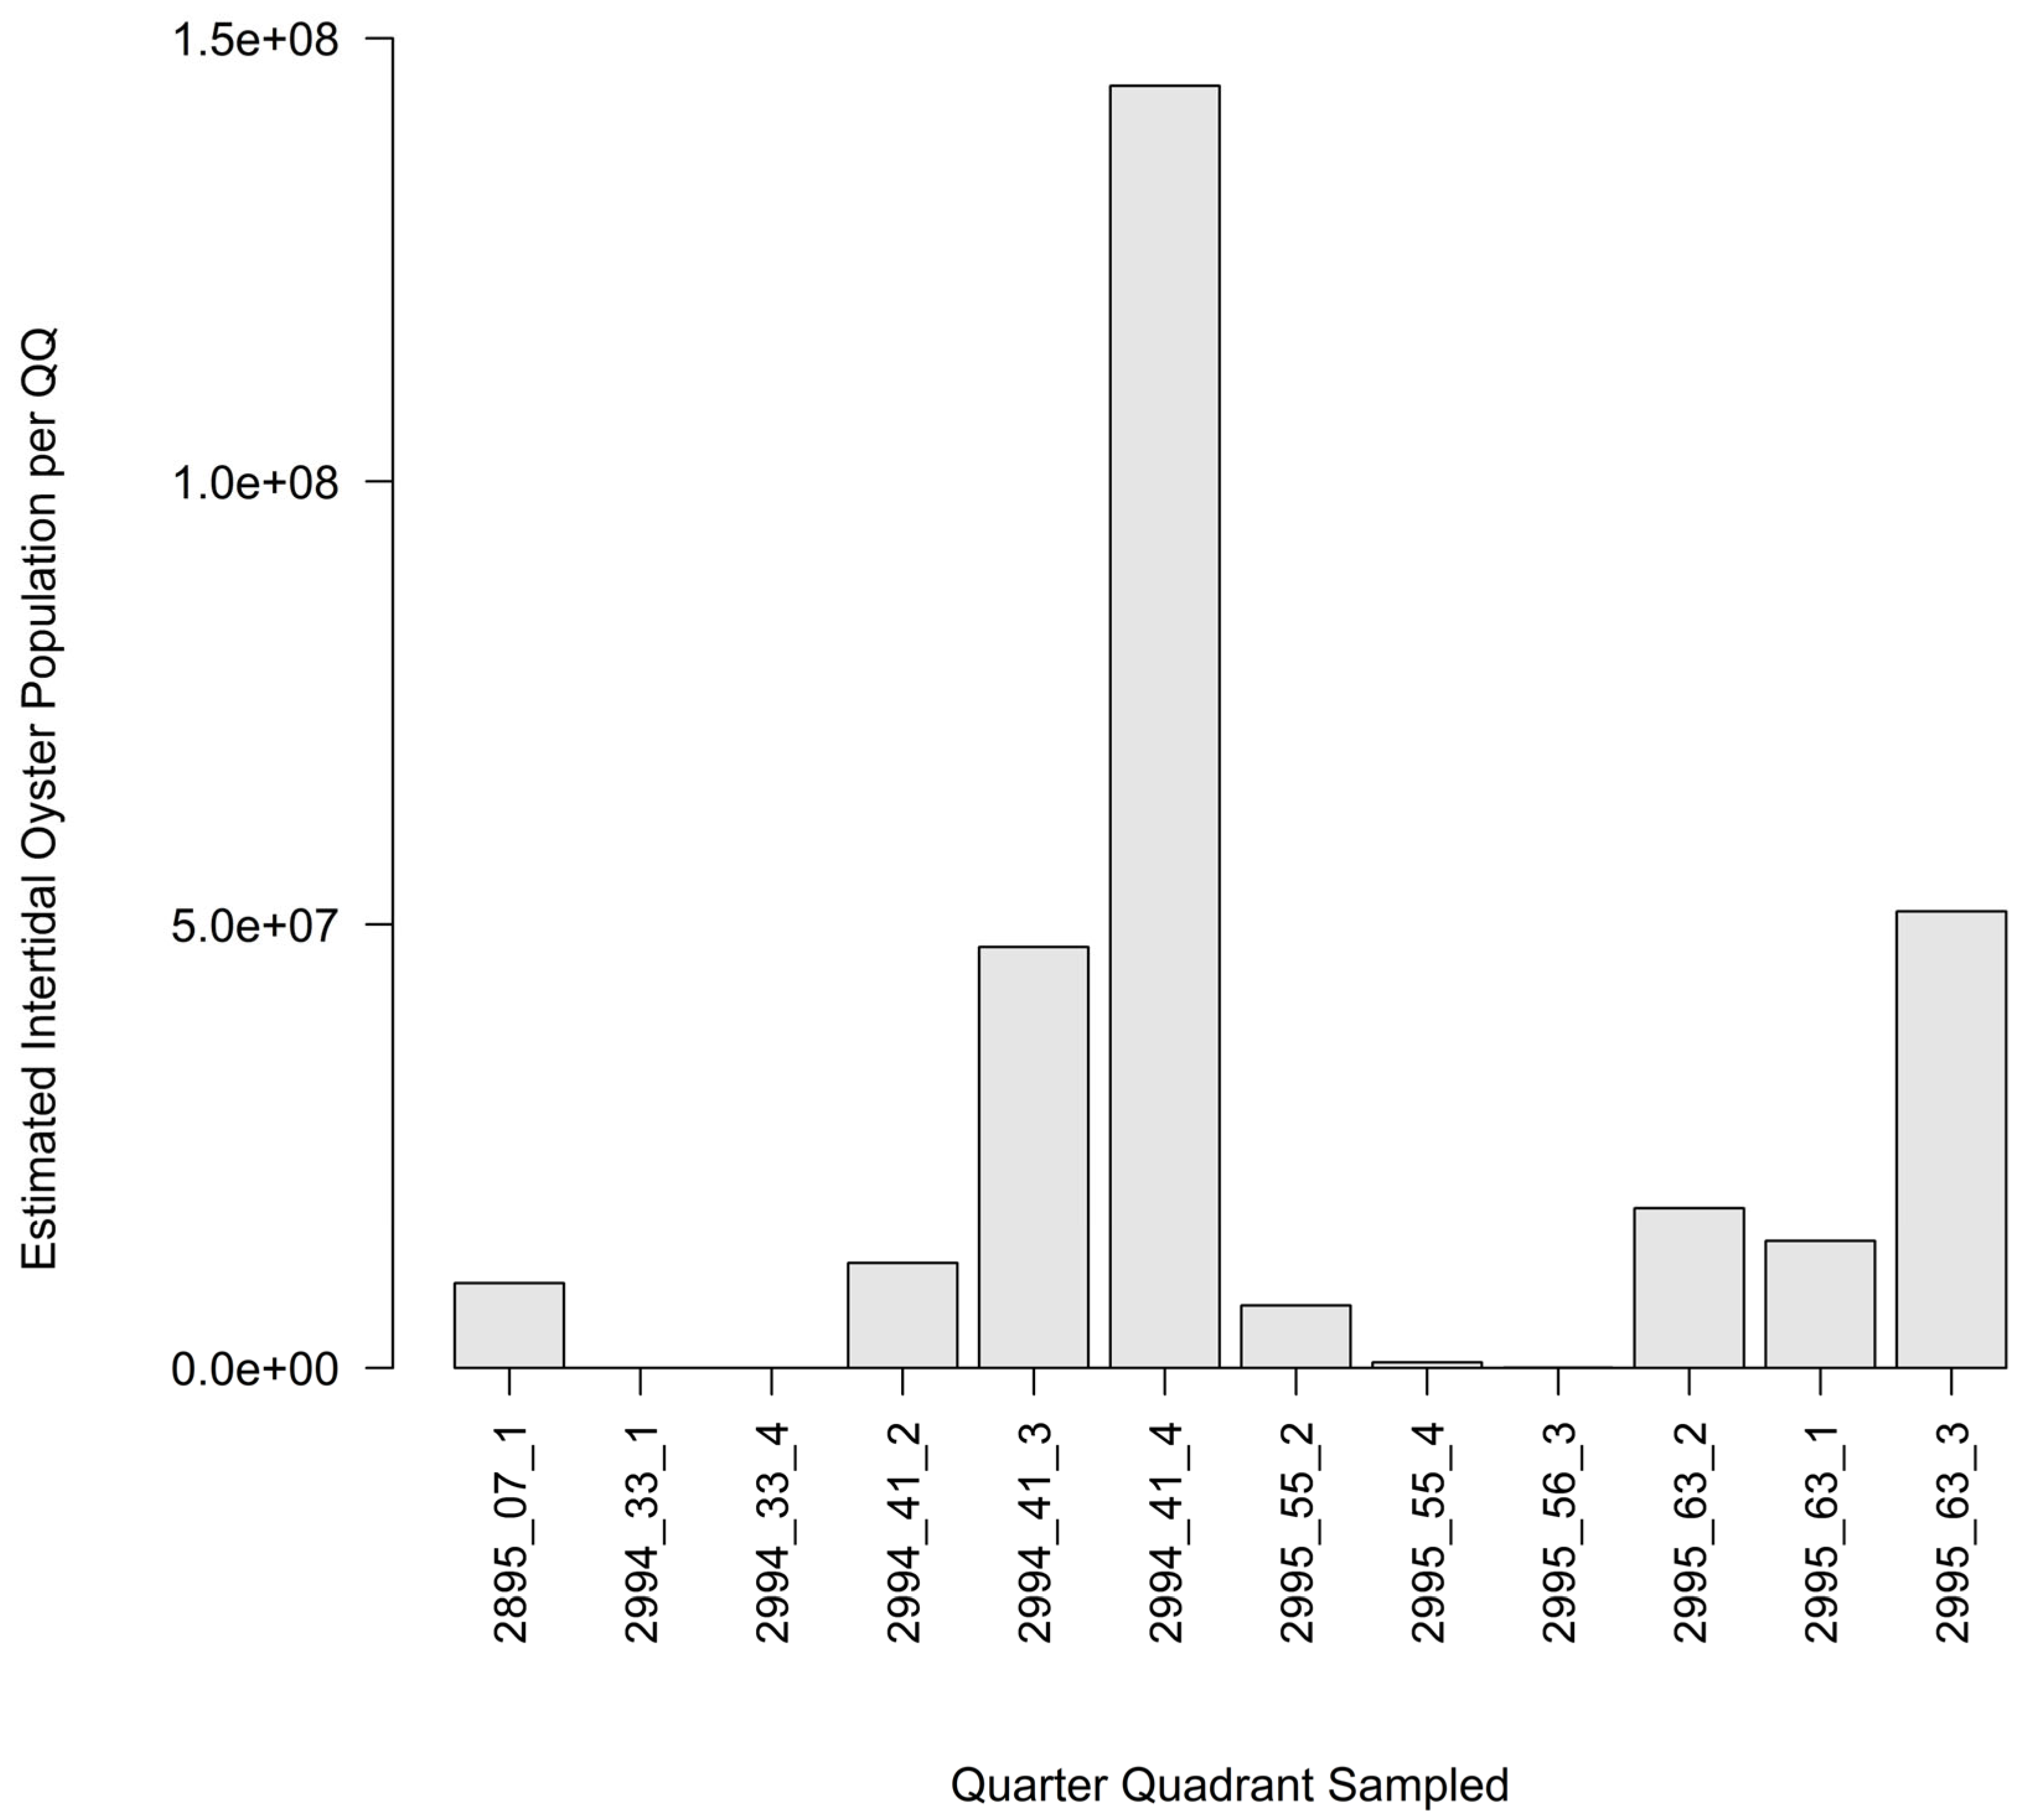
Based on the mapped confirmed and probable intertidal reef area, estimated intertidal oyster populations were calculated for each QQ. When extrapolating densities were based on intertidal reef area, the overall oyster densities decreased in QQ 2895_07_1 (Figure 11) relative to oyster density on the representative reef, and estimates were the highest in QQ 2994_41_4 (Figure 13).
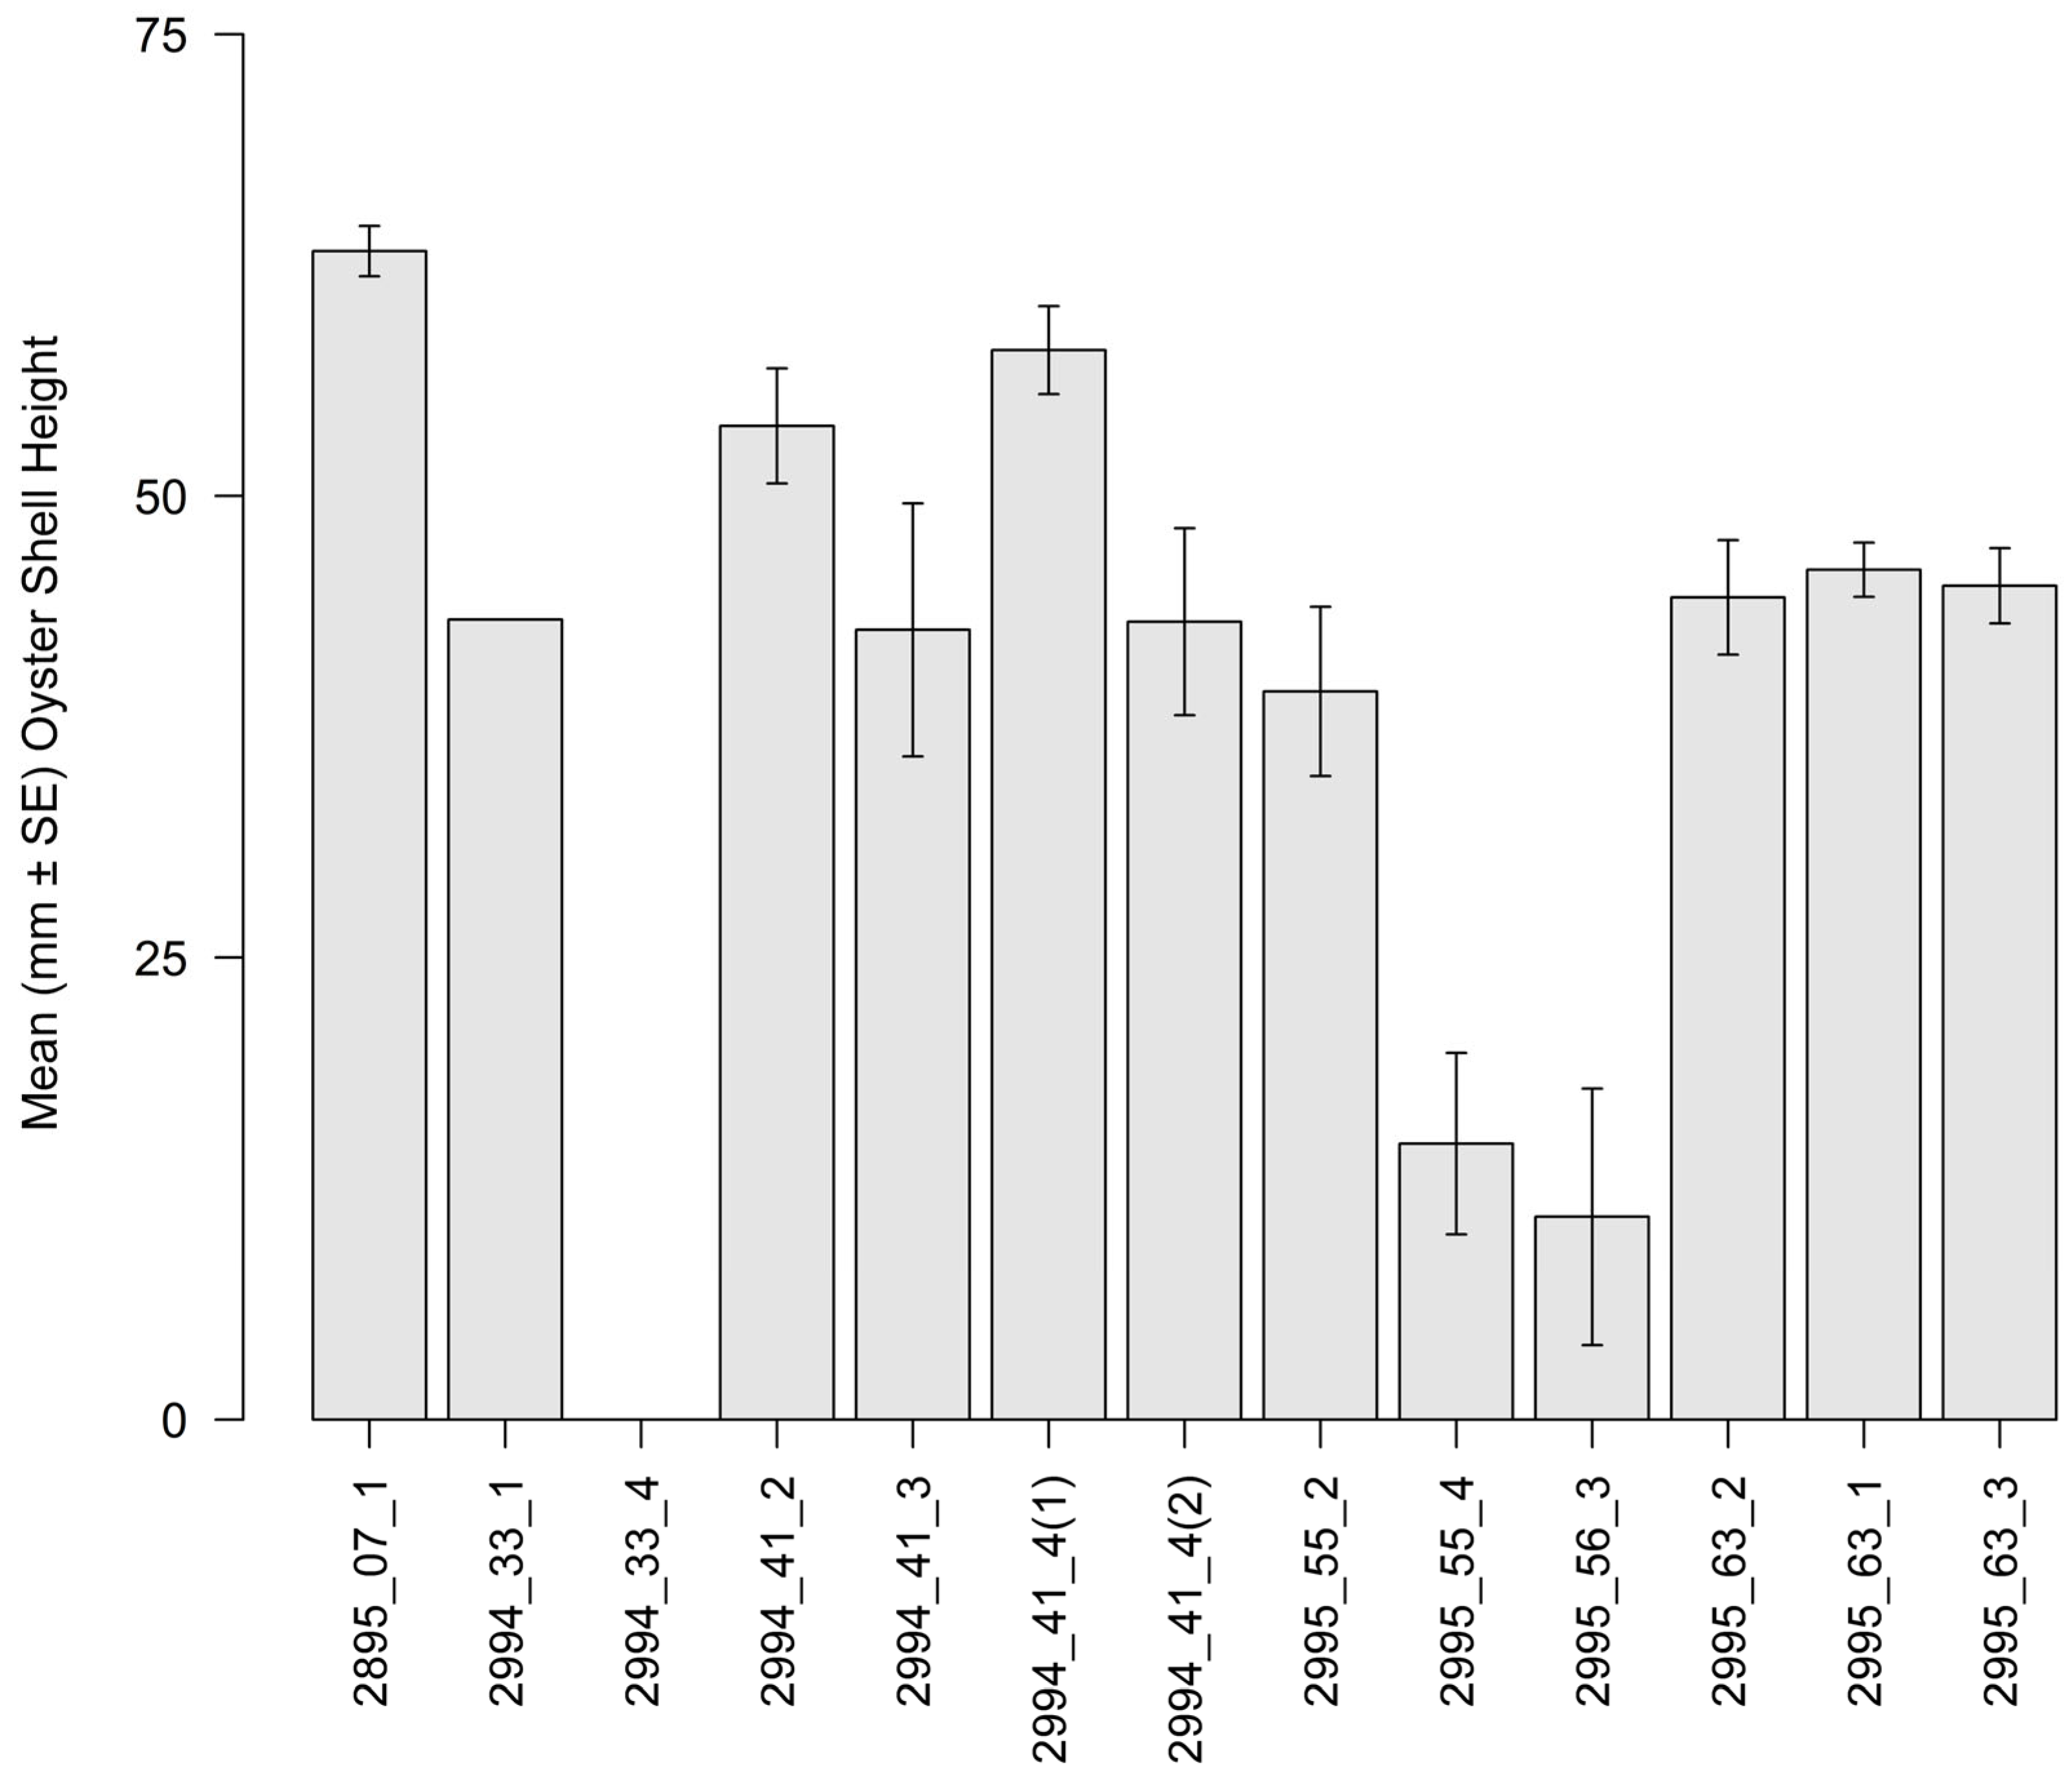
Mean oyster size varied significantly (F11,40 = 8.44, p < 0.001) among the QQs (Figure 14). Those with the largest sized oysters were found on reefs located at the southernmost end of West Galveston Bay and adjacent to Galveston Bay proper (Figure 14 and Figure 15).
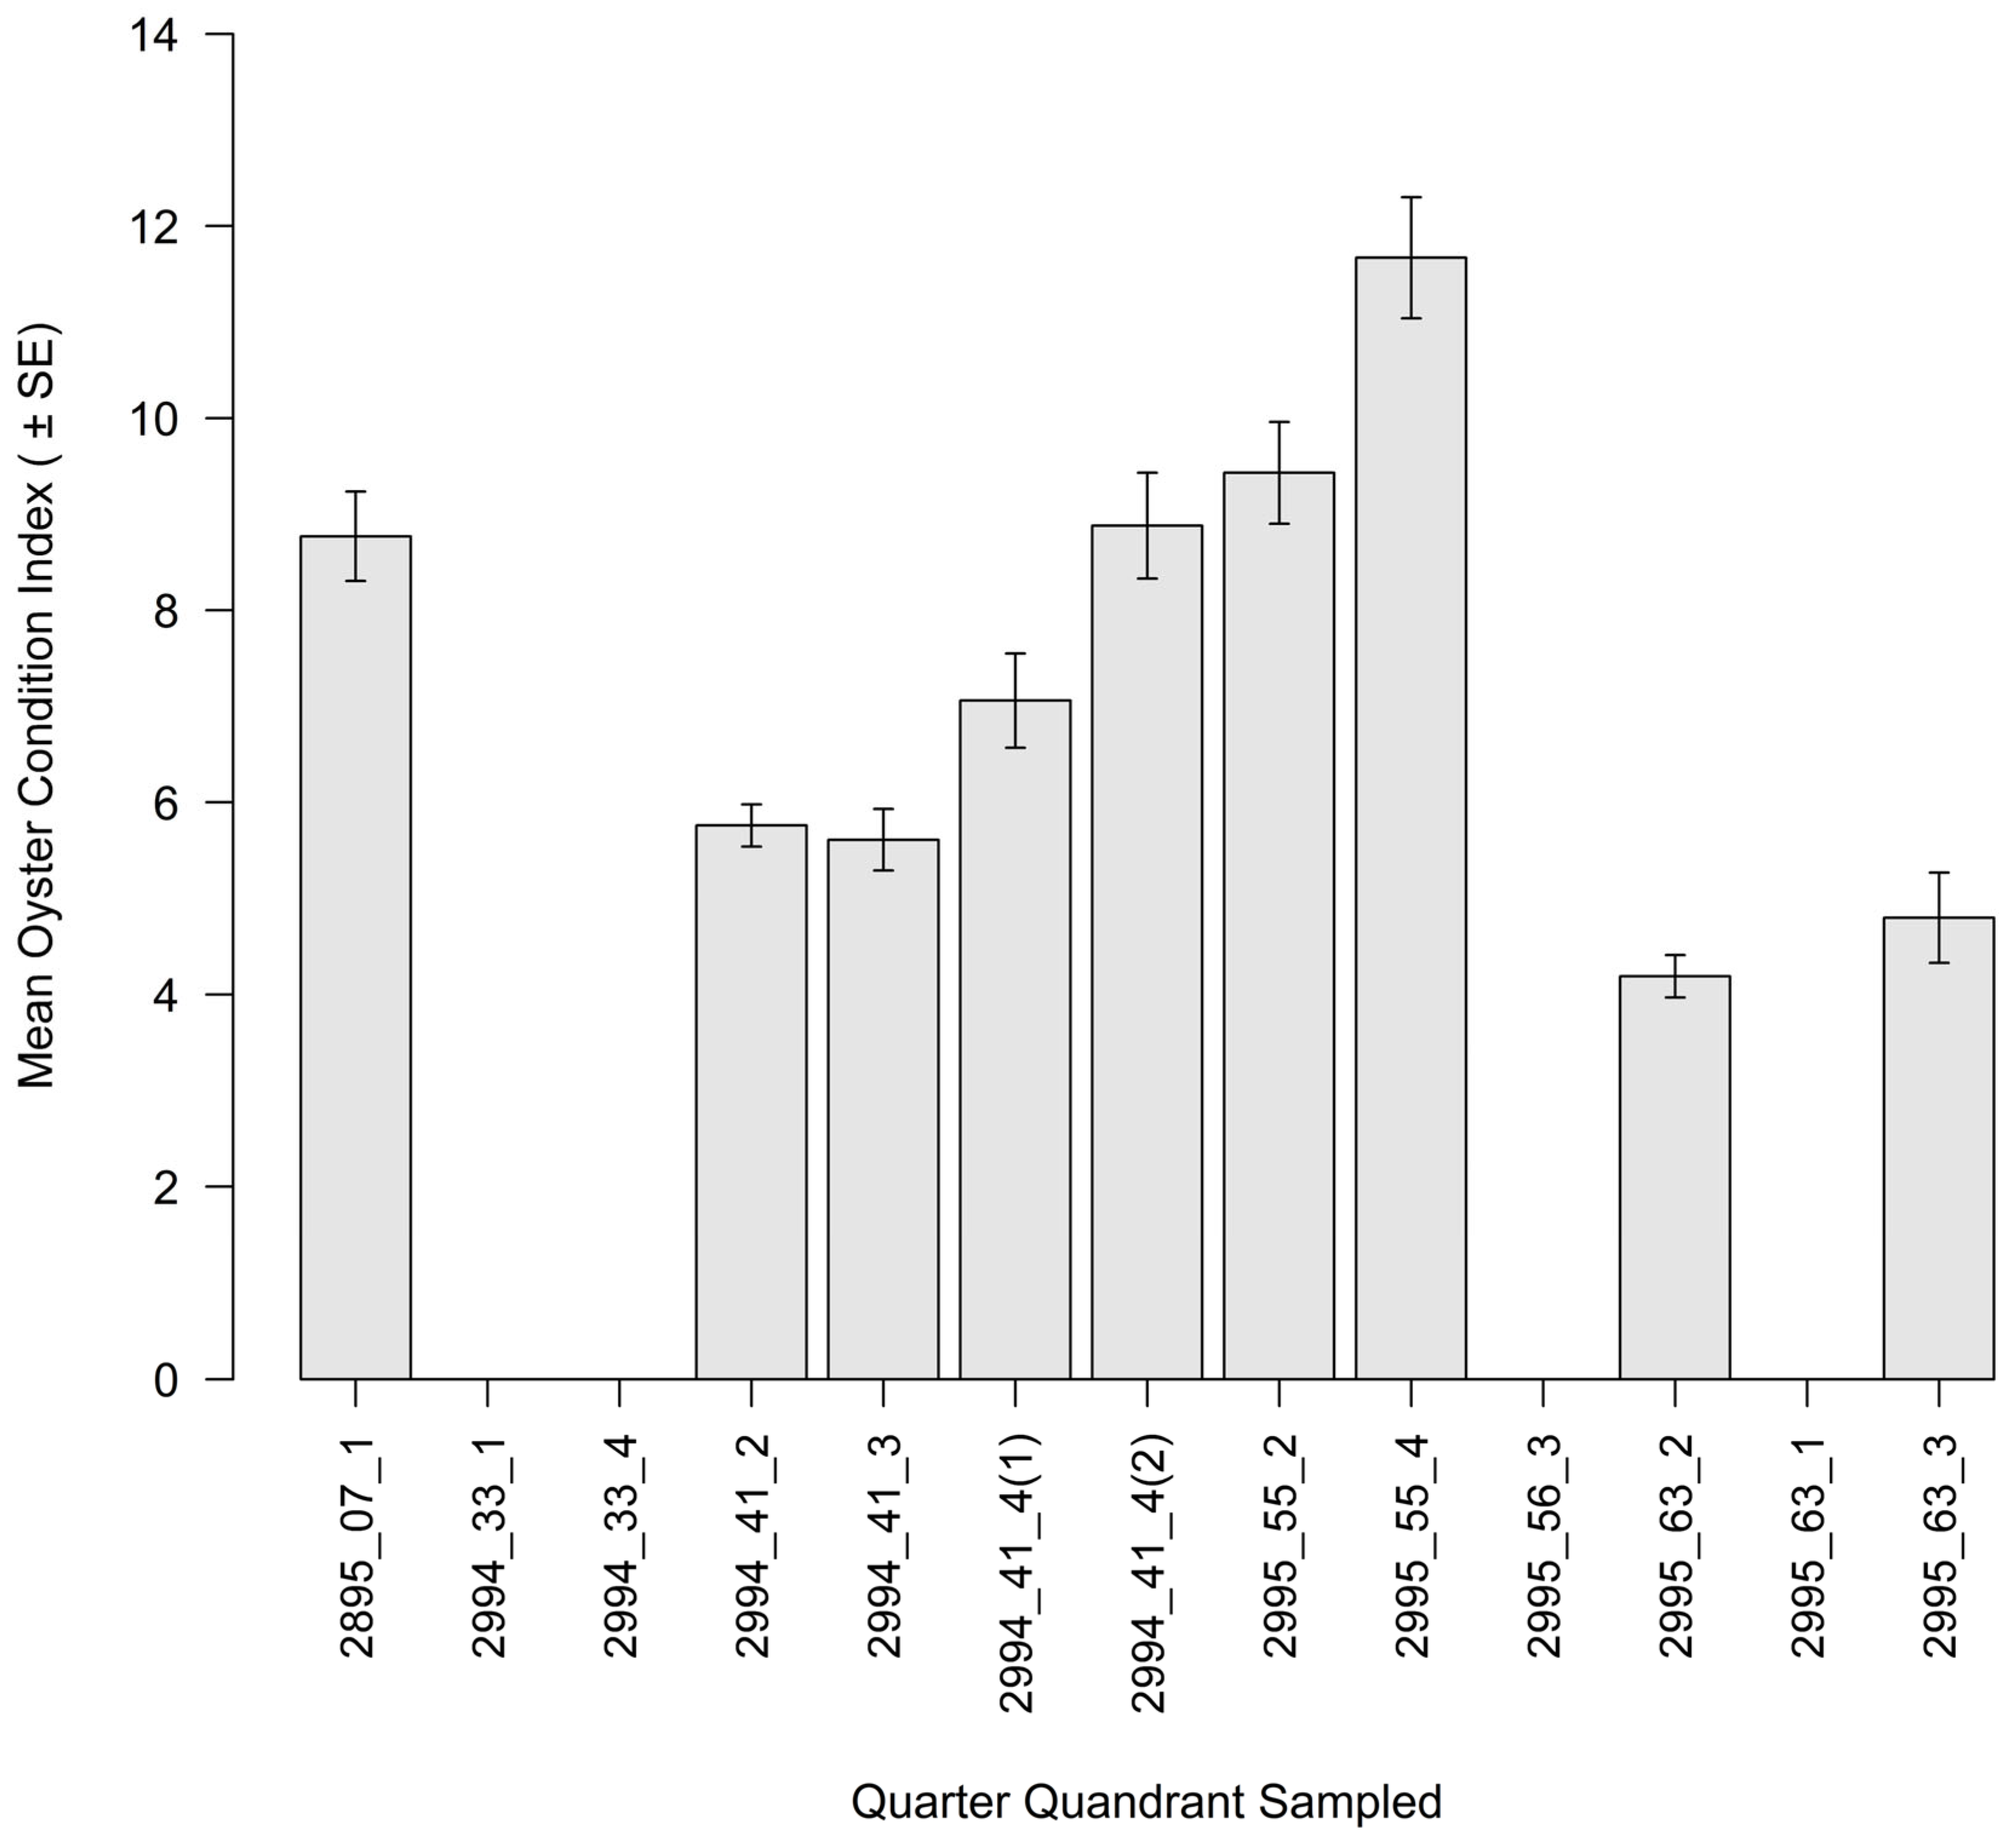
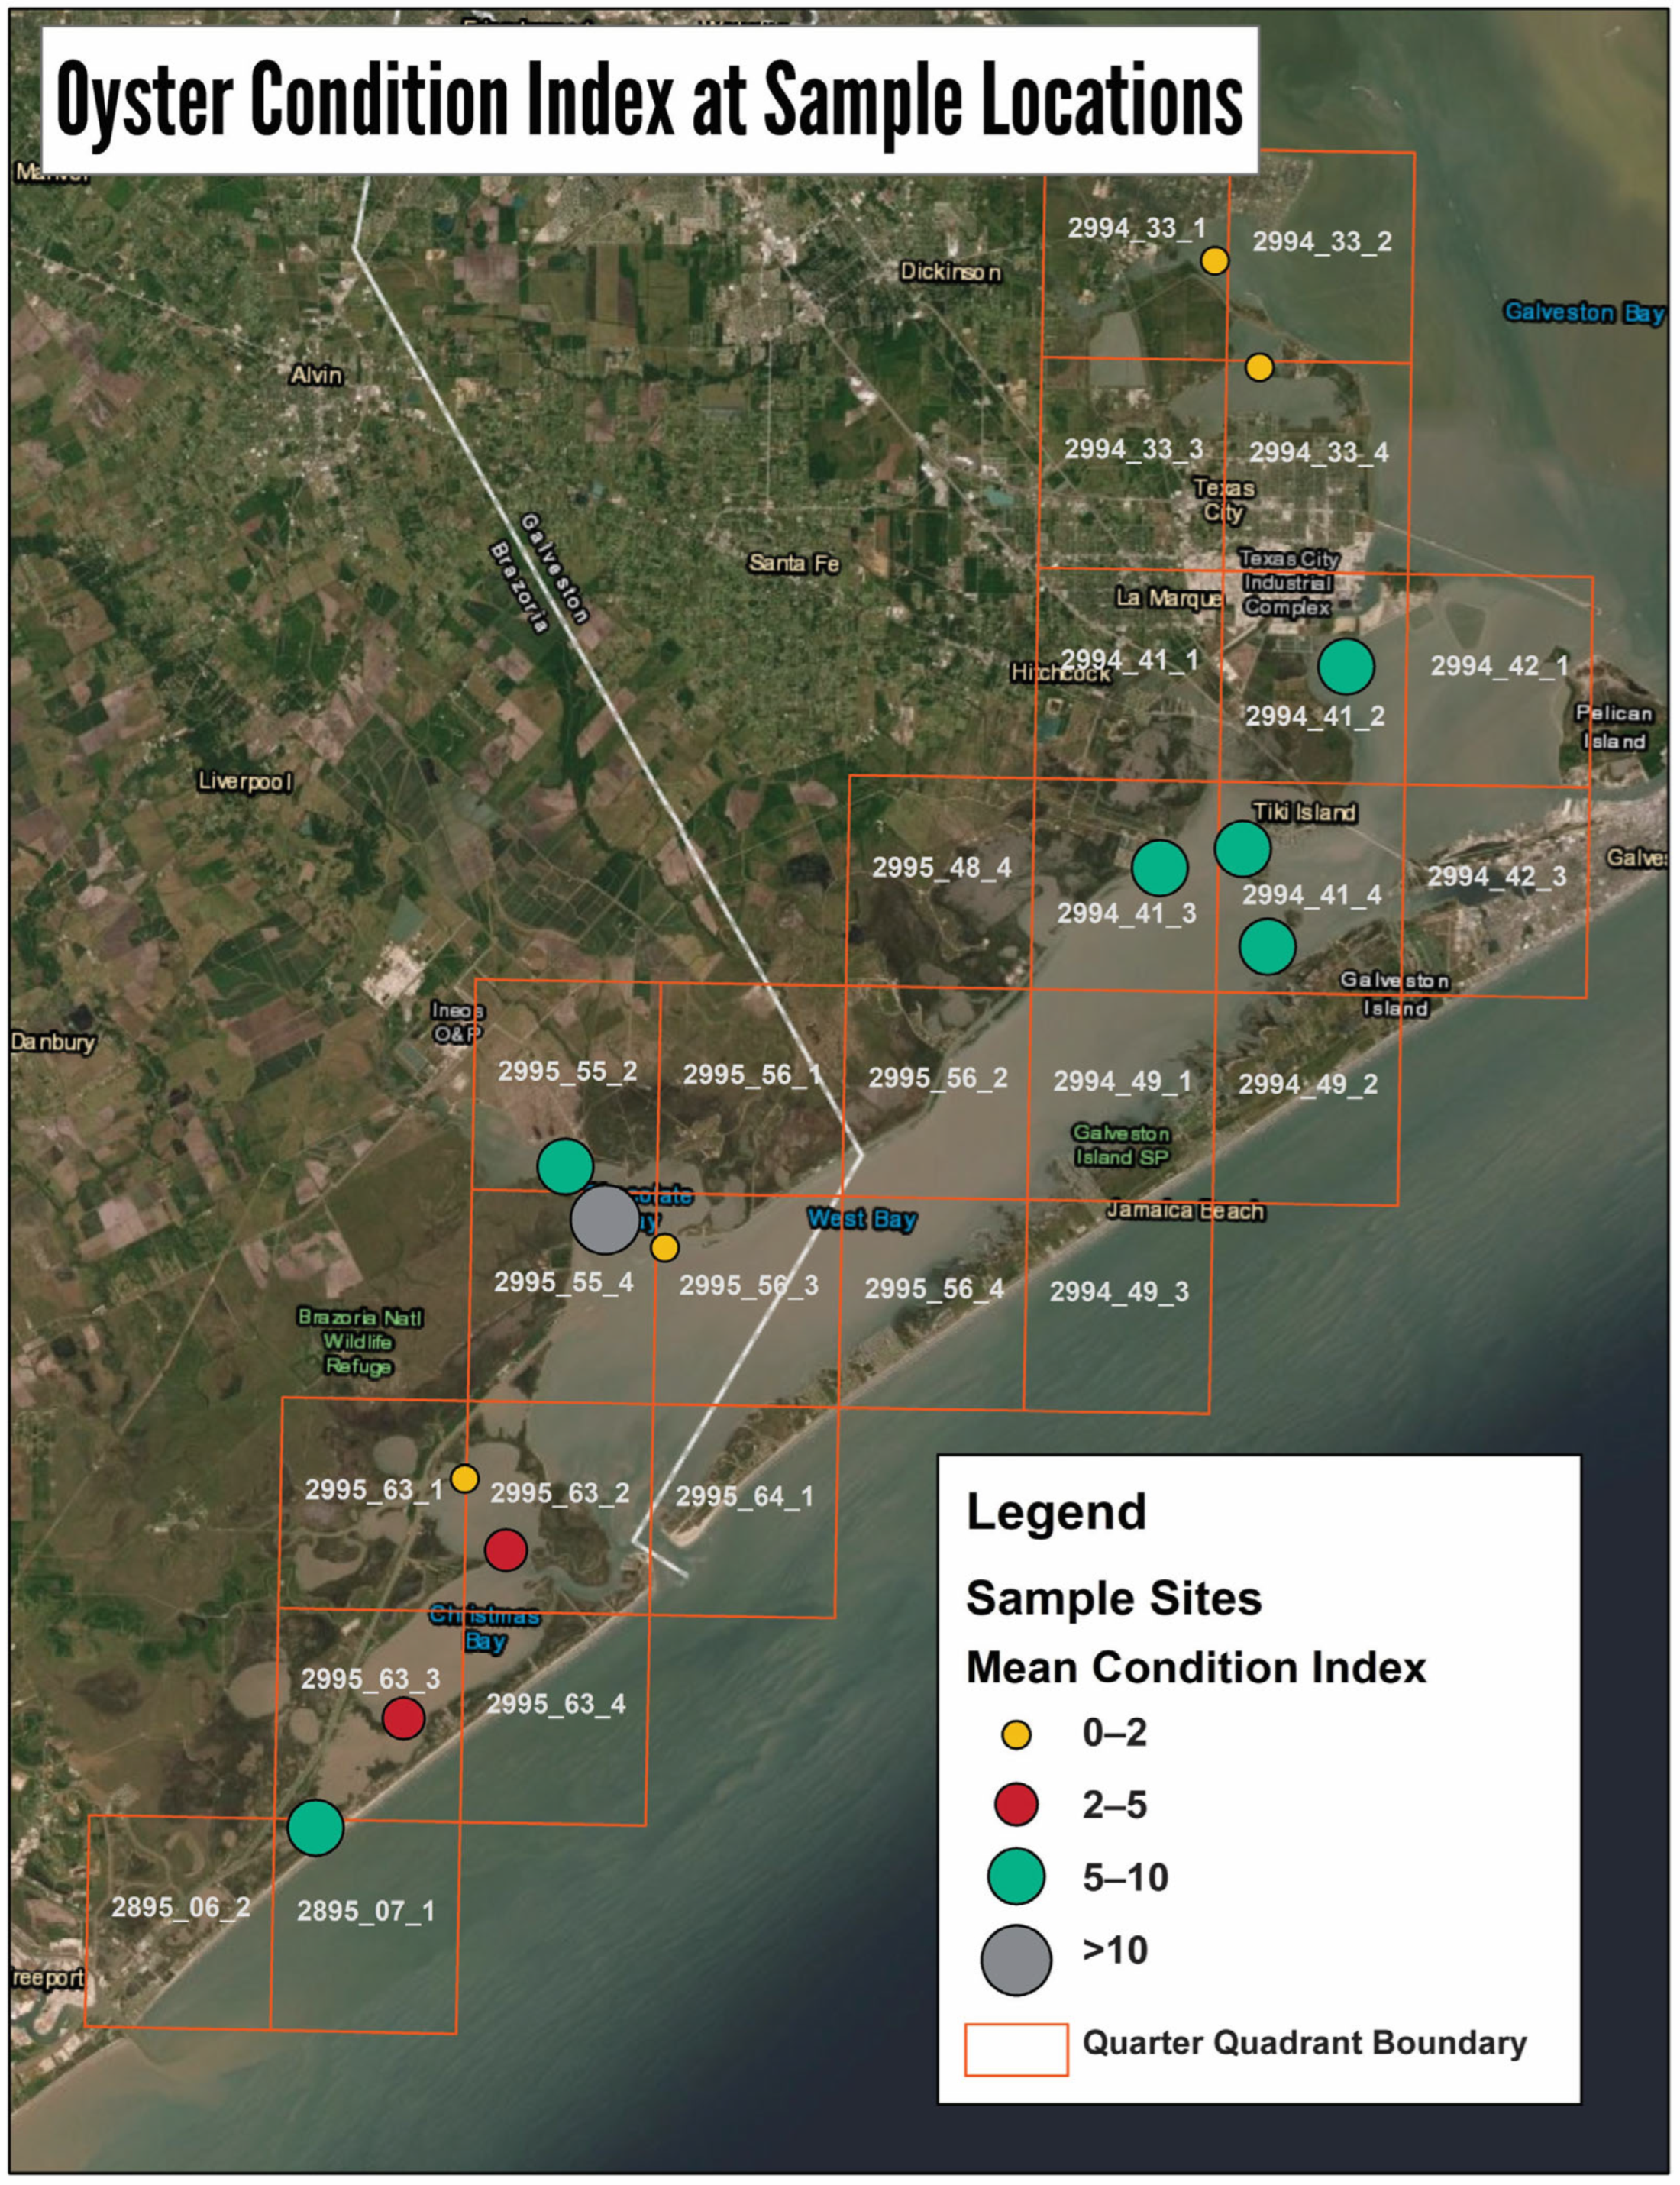
Finally, there was a large range of CI among the oysters sampled on the representative reefs (Figure 16), with a highly significant difference (F9,131 = 27.20, p < 0.0.001 found between the representative reefs using log(x + 1) data. Across West Galveston Bay (Figure 16), one representative reef (2995_55_4) had an extremely high mean CI, while most reefs that had oysters to sample had CI values ranging between 5 and 10 (Figure 16 and Figure 17).

3.3. Intertidal Oyster Reef Associated Benthic Macrofauna (ABM)

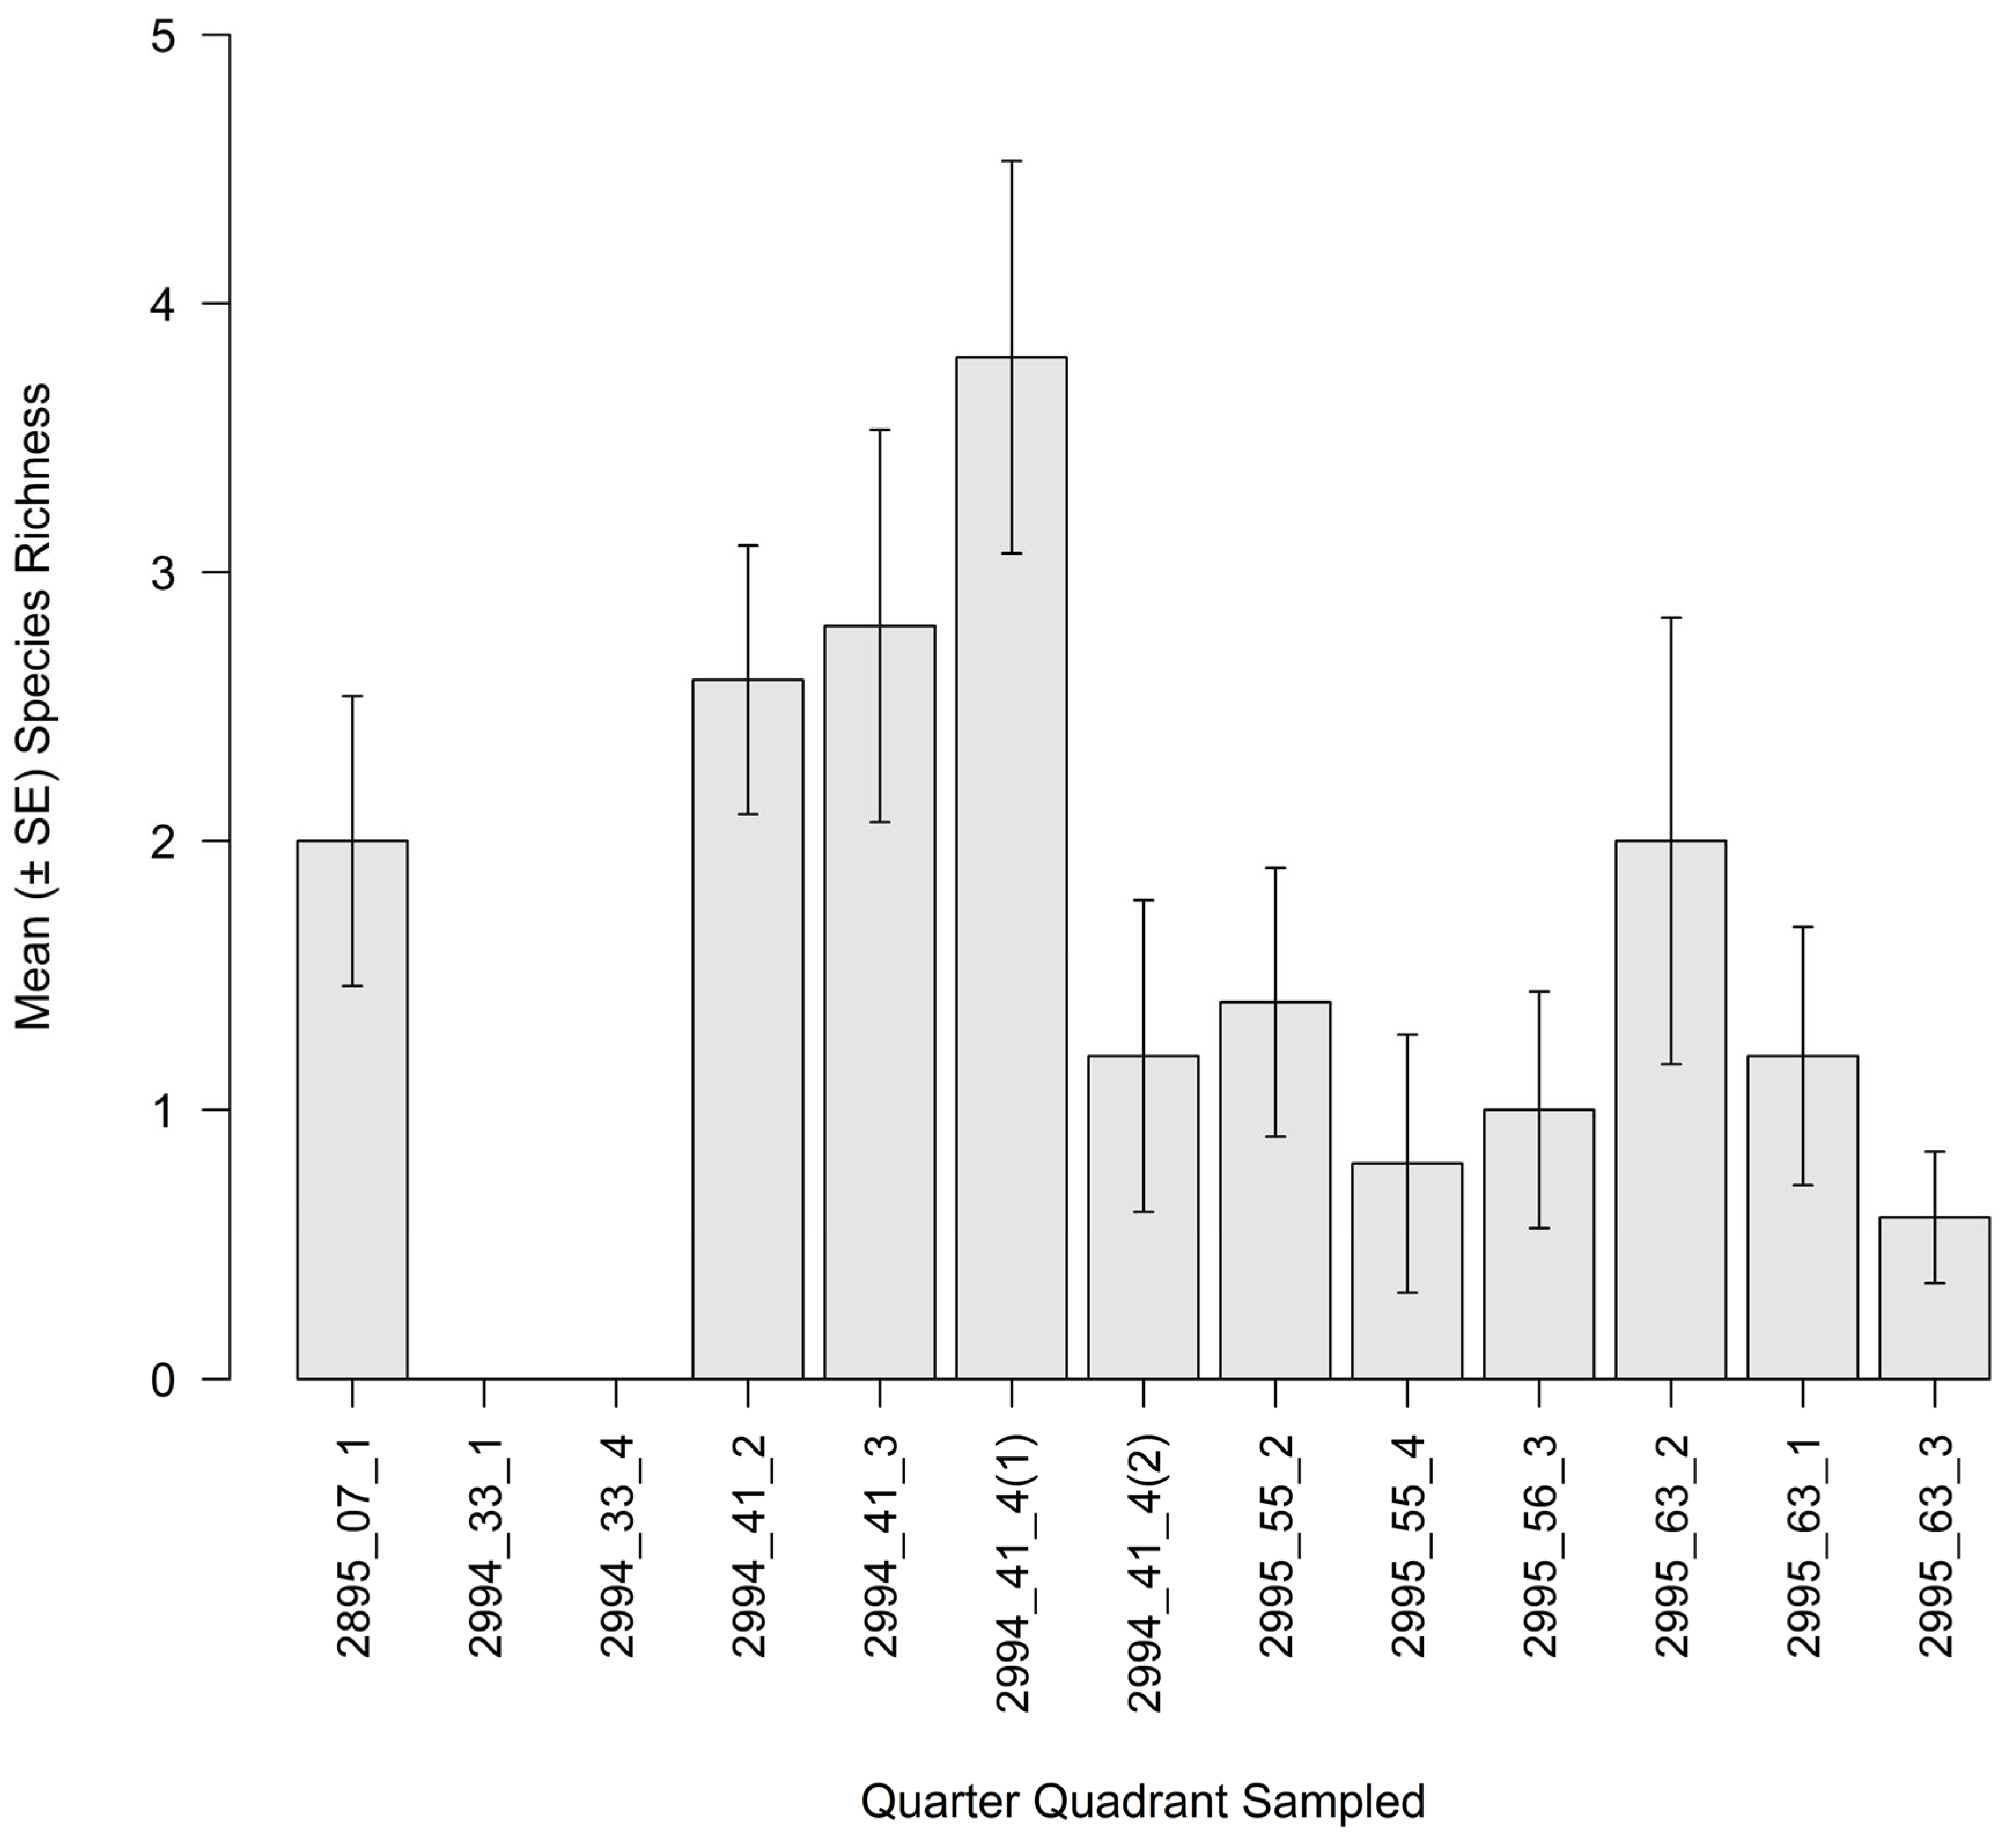
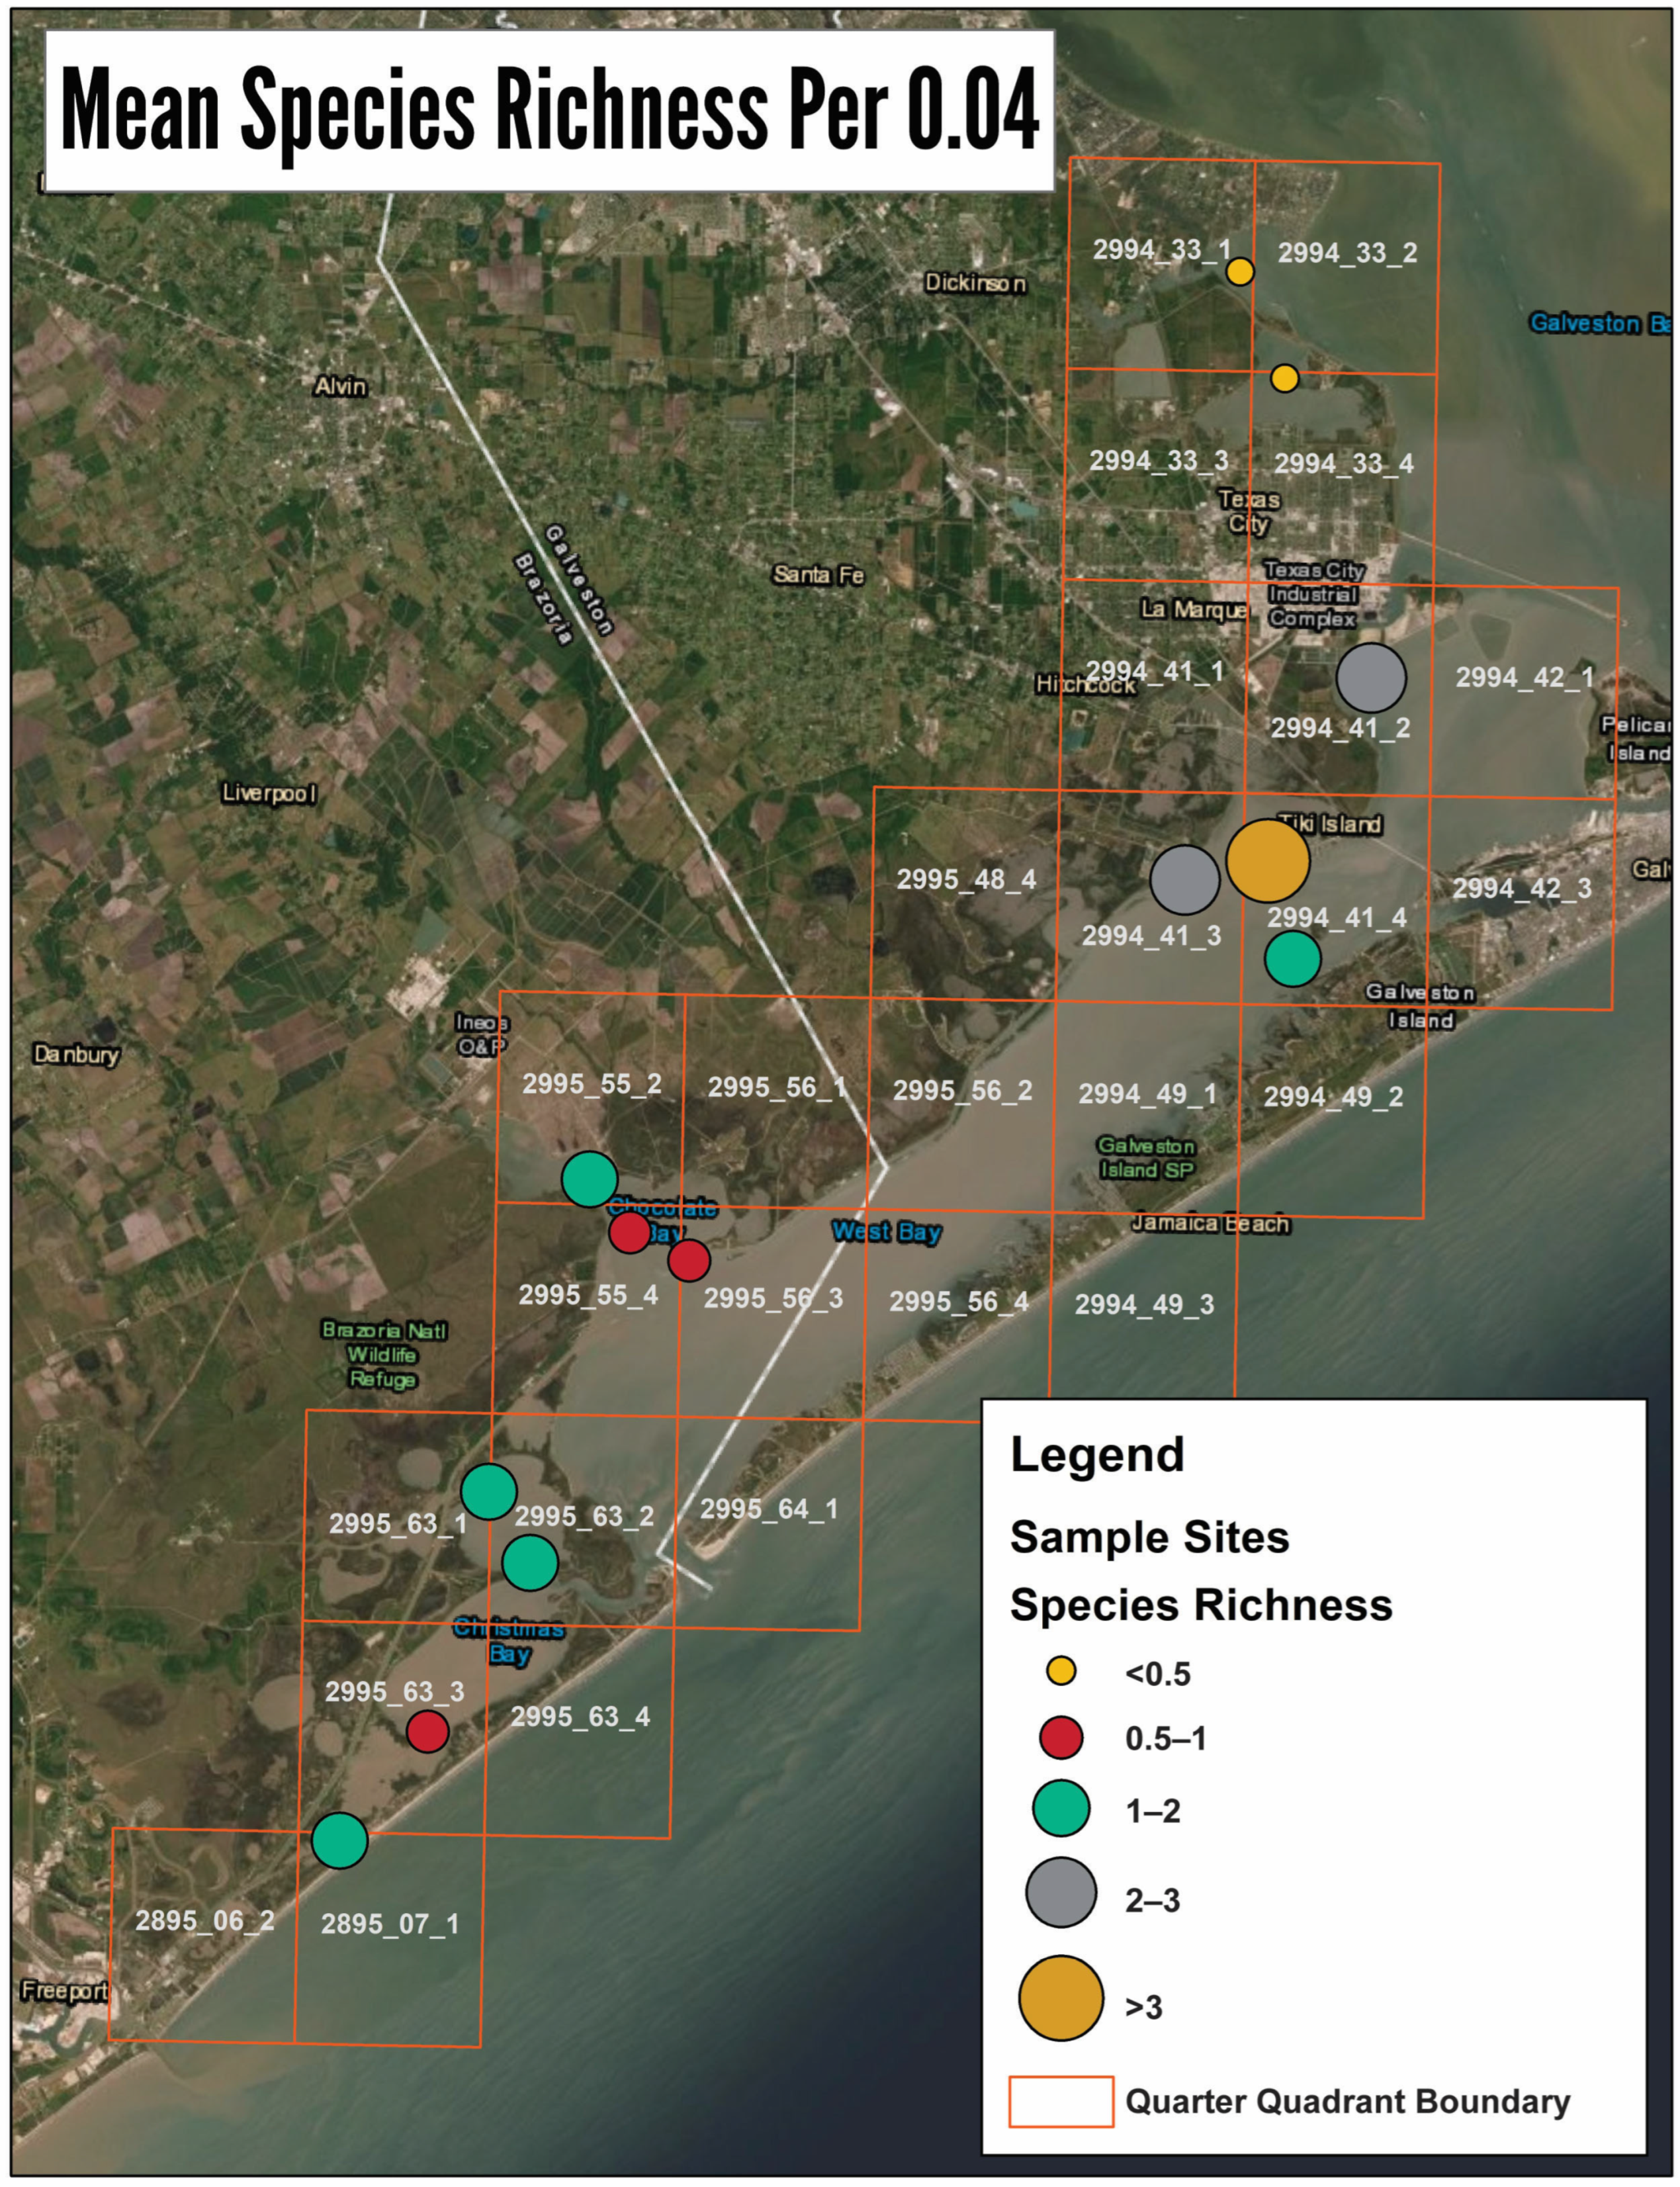
A total of 331 individual organisms were collected from 10 taxonomic groups during the ABM surveys. A full species list and count by QQ are listed in Appendix A. There was a significant difference (F11,40 = 8.44, p < 0.001) among the QQs sampled for species richness (Figure 18), with many reefs having limited species richness (Figure 18 and Figure 19).
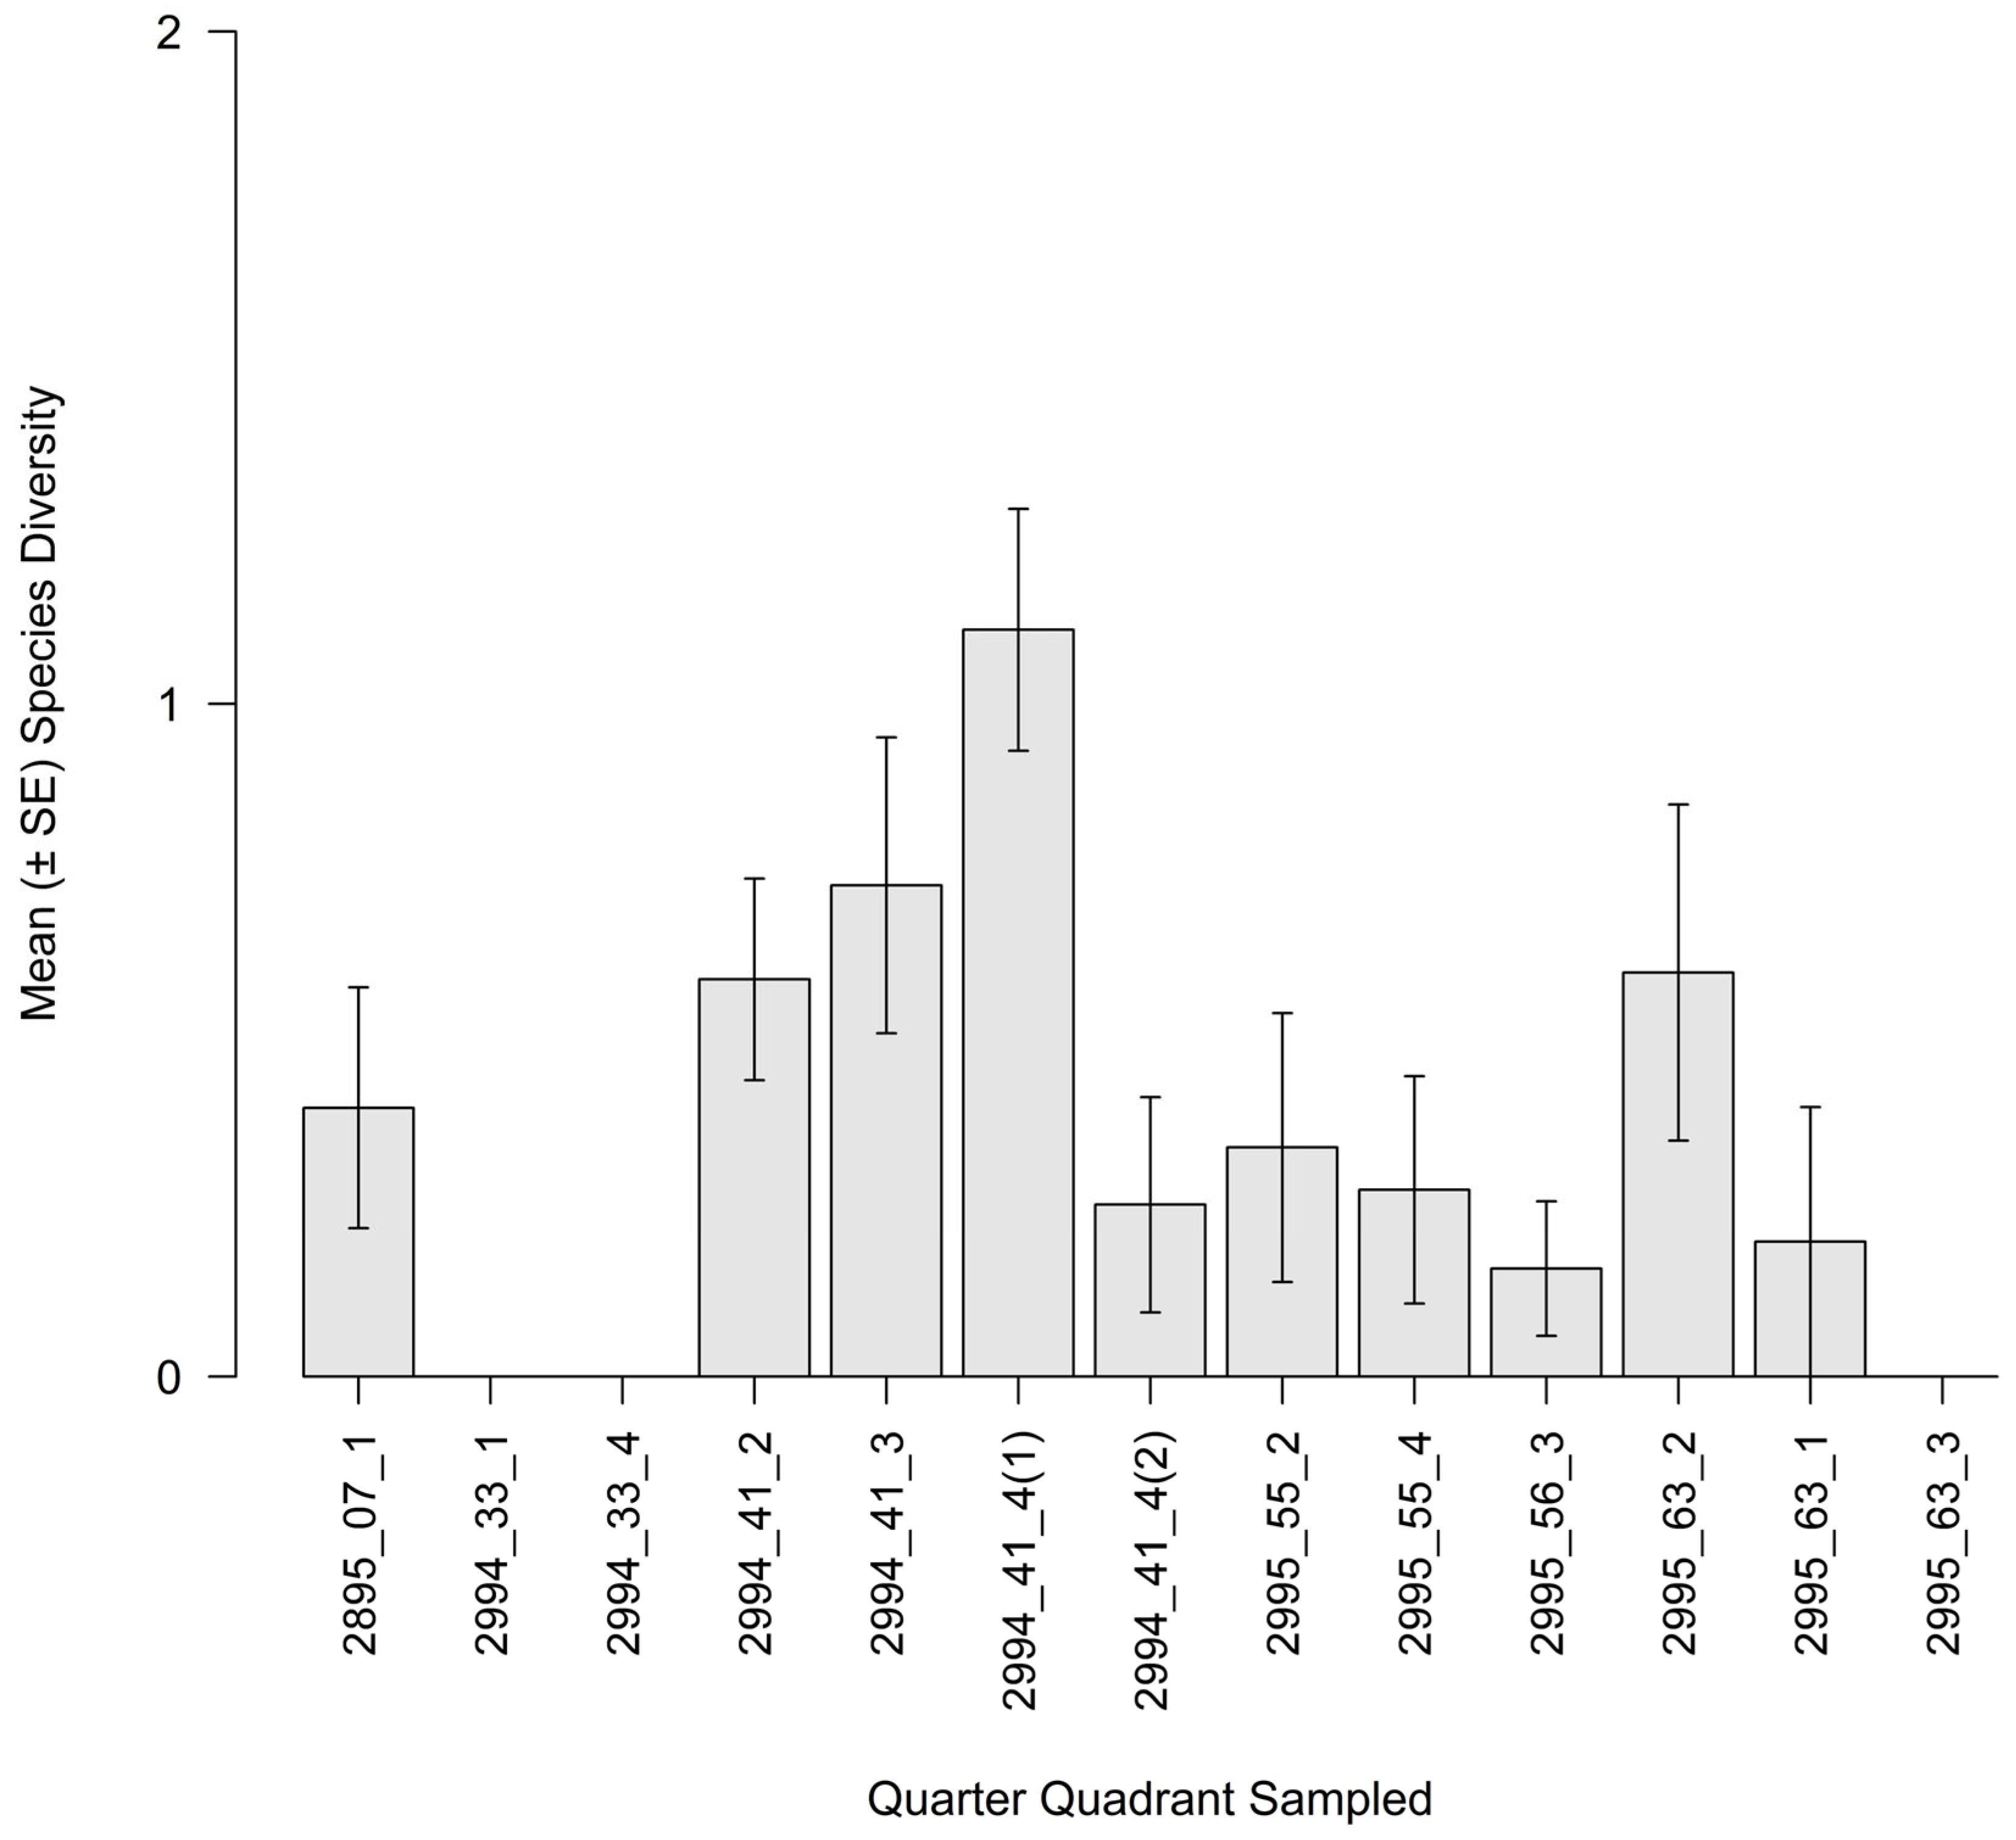
Overall species diversity was low among all the QQ, but did vary significantly among the QQ (F10,44 = 2.99, p = 0.006, Figure 20 and Figure 21). ABM diversity was not significantly influenced by most reef characteristics, as there was no significant relationship with percent cover (r11 = −0.33, p = 0.25) or rugosity (r11 = 0.29, p = 0.32). However, there was a significant relationship between ABM diversity and reef height (r11 = 0.67, p = 0.01), with increased species diversity with increased reef height. Oyster population characteristics did not influence ABM species diversity, as there was no significant correlation between oyster density (r11 = 0.50, p = 0.07) or oyster size (r11 = 0.51, p = 0.07) for ABM species diversity.

4. Discussion

The subtidal populations of oysters in Galveston Bay have been historically monitored for maintenance of oyster stocks [50,56], and this study provides a current quantification of the spatial extent, reef characteristics, oyster populations, and macrofauna utilization of intertidal reefs in WGB. The specific location of the reefs within WGB appears to be a significant and driving factor for the functionality of the reefs for oyster populations. The representative intertidal reefs that supported high percent live oysters, high oyster density and larger size, and increased oyster CI were found in the southernmost portion and the northern portion of WGB. The associated benthic macrofauna species richness and diversity were low across the sampled reefs in WGB. The results suggest that functional intertidal reefs are found by openings to the estuary and are structured by local hydrodynamics to create functional habitat. Reefs within the middle of the estuary simply function as structure for shell rake reefs which do not serve as functional reefs, ultimately leading us to assess the extrapolated the intertidal oyster population to be 500 million individual oysters.
The physical characteristics of the sampled representative reefs suggest that intertidal reefs may fall into one of two types of structured habitat within the estuarine landscape: shell rakes or functional intertidal oyster reefs [65]. Shell rakes are mounds of dead oyster shell that have formed by wave action, and several QQs were in this category. The reefs in QQ 2994_3_1, 2994_33_4, 2995_55_4, and 2995_56_3 can all be classified as shell rakes based on zero or low percentage of live oysters and low observed oyster density, but high percentage of shell cover. A technical report from Georgia, USA [65] also demonstrated similar findings of both shell rake reefs and true intertidal oyster reefs within the estuarine system. In WGB, these shell rakes were all found within an embayment, indicating shells were accumulated by wind or other hydrodynamic processes. These areas are also heavily trafficked by commercial and/or recreational boats, which could also contribute to the accumulation of shell [66,67]. Thus, energy input that forms the shell rake reefs may also limit the development of the three-dimensional structure of the oyster reef.
Representative reef oyster density had a strong spatial pattern within WGB. Reefs with high oyster densities (>300 per m2) were found in the very southern portion of WGB or towards the northern portion, just adjacent to Galveston Bay proper. For the functional intertidal oyster reefs that supported significant oyster densities, these numbers were incomparable to intertidal reefs sampled within other estuarine systems. For example, intertidal reefs in southeastern North Carolina [7] supported oyster density at approximately 784 per m2. While the abundance of oysters found on intertidal reefs in WGB are not relatively comparable to intertidal reefs along the Atlantic coast, the system in southeastern North Carolina strictly has intertidal reefs and the intertidal oyster reef population in WGB only represents a portion of the oyster metapopulation. Therefore, oyster densities measured in this study suggest that intertidal reefs, for an estuarine system harboring both subtidal and intertidal reefs, may contribute an important role with metapopulation dynamics [53,68], and further research is needed to understand the larval connectivity and oyster survivorship between the reef types for theoretical modeling [52,54], resource management, and restoration efforts [69,70,71].
Coupling the GIS analysis of the spatial extent of intertidal reefs and sampling oyster densities on representative reefs enabled the estimation of the intertidal oyster population per QQ. While many representative reefs had no or low oyster densities, potentially skewing the estimation of total oysters for those QQs, two unique patterns emerged. First, in one of the southernmost QQs sampled (289_07_01—Christmas Point), oyster densities on the representative reef were high; however, the overall extent of reef mapped in this area was low. This indicates that while this area of West Galveston Bay can support well-structured intertidal reefs and healthy oysters, the minimal overall area of reef limits the population size of oysters. Conversely, one of the northernmost QQ in West Galveston Bay (2994_41_4—east West Galveston Bay) supported relatively high oyster densities in addition to having 338,312 square meters mapped of confirmed and plausible reef. Therefore, it is estimated that this specific QQ supports the highest oyster abundances in West Galveston Bay, more than threefold compared to other QQs mapped and sampled. Understanding the overall spatial extent of the estimated intertidal oyster abundance by QQ, particularly with high estimated densities (2994_41_4—east West Galveston Bay), is important for restoration practices by providing an estimated standing stock in the event of natural disasters [32,72] and provides target locations for restoration reefs.
This pattern for the spatial distribution of oyster densities at the northern and southern locations of the estuary was also observed for reef height and oyster size. This indicates that these reefs not only contained high densities, but these oysters were achieving vertical growth within the reef. Vertical growth for oysters on a reef not only demonstrates ideal growth conditions for an individual in the population but translates to biogenic habitat for other organisms. Previous work has demonstrated that the three-dimensional structure not only provides habitat, but can also impact trophic dynamics for oysters, ABM, and commercially important species [12,15,73,74,75,76,77,78]. While these reefs did support oysters with vertical growth, none of these oysters were within the size range of legal harvest in Texas (76.5 mm) [56]. This suggests that these reefs were subjected to harvest or that oysters in the intertidal environment have a decreased growth rate compared to the subtidal environment within the Galveston Bay system. Harvesting intertidal oysters is illegal in Galveston Bay; however, anecdotal evidence (J. Culbertson, per. comm.) suggests that poaching of intertidal oysters does co-occur with low harvests of subtidal oysters. Conversely, the hydrodynamic nature of intertidal reefs may limit the size of intertidal oysters. Given that the tidal regime of Galveston Bay is mixed, with mainly diurnal tides [79], oysters within the intertidal environment endure varied water flow, increased sedimentation, aerial exposure and intermittent feeding times [19,20]. Regardless of the mechanism(s) driving oyster size on intertidal reefs in West Galveston Bay, the overall size appears to be comparable to intertidal oysters found in other systems. For example, in southeastern North Carolina, 22 intertidal oyster reefs within tidal creek systems had a mean size of approximately 50 mm compared to an overall mean size of 42 mm size in this study [7]. Therefore, the size of intertidal oysters may be limited by both physiological conditions on an intertidal reef and the potential of illegal harvest pressure on the reef, which ultimately may lead to decreased gametic contribution to the larval pool.
Despite any factors limiting the size of oysters, oysters found on the representative reefs had appropriate CI values for healthy oysters [61,62,63,77]. One representative reef (2995_55_4—Hoskins Mound SE) had a comparatively high mean CI. These comparatively high CI values may be a result of the lack of intraspecific competition for food [7]. This reef had one of the lowest densities of oysters on the reefs sampled; therefore, the high food availability due to the lack of competition may be responsible for the increased physiological health of the oysters on this reef. Remaining reefs, with increased oyster densities, demonstrated CI values similar to values of intertidal oysters from other locations [61,62,63,77], further indicating these reefs have not only developed intertidal reef structure, but also have healthy stocks of oysters.
The richness and diversity of the ABM found on the representative reefs sampled was low compared to other studies of intertidal ABM [6,80,81]. This is likely due to the lack of structural heterogeneity present on many of these reefs. Many ABM rely on the structural complexity provided by intertidal reefs as predation refuges from higher trophic predators [79,80]. With the limited structural complexity and subsequent limited interstitial space [80], the ABM are highly prone to predation when the tide covers the reef [73]. Furthermore, the overall ABM community may also be limited by wave energy via wind and tides. Lunt et al. [81] found that ABM abundance was decreased with increased wave energy and flow on intertidal reefs in St. Charles and Aransas Bay, Texas. This current study further implies that the local hydrodynamics may influence the ABM and the overall communities’ species richness and diversity.

5. Conclusions

In conclusion, the results from this study indicate a large variance in the amount of intertidal reef across West Galveston Bay. Oyster densities on representative reefs and estimated areas of reef cover were used to extrapolate oyster abundances per QQ. Oyster densities and representative reef characteristics indicated that there are two different types of intertidal reefs: shell rakes and functional intertidal reefs. Neither of these reef types provided major topographical heterogeneity, and subsequently, the ABM community was poorly represented. This study updates the spatial extent of intertidal reefs in West Galveston Bay and provides a current estimation of the standing stock of intertidal oysters in West Galveston Bay. By providing a spatial reference for intertidal reefs and the population dynamics for oysters and reef-dependent species within Galveston Bay, this study provides an updated understanding of the distribution and functionality of this habitat type, both from a species and community perspective. Last, this study demonstrates how resource managers can couple different methodologies to understand intertidal oyster populations within a particular system and provides baseline data for intertidal reefs, population dynamics, and functional habitat within the Galveston Bay system.

Author Contributions

Conceptualization, M.H.H., A.H. and S.A.H.; methodology, M.H.H., A.H. and S.A.H.; software, A.H., M.H.H. and S.A.H.; validation, M.H.H., A.H. and S.A.H.; formal analysis, M.H.H., A.H. and S.A.H.; investigation, M.H.H., A.H. and S.A.H.; resources, M.H.H., A.H. and S.A.H.; data curation, M.H.H., A.H. and S.A.H.; writing—original draft preparation, M.H.H., A.H. and S.A.H.; writing—review and editing, M.H.H., A.H. and S.A.H.; visualization, M.H.H., A.H. and S.A.H.; supervision, M.H.H., A.H. and S.A.H.; project administration, M.H.H., A.H. and S.A.H.; funding acquisition, M.H.H., A.H. and S.A.H. All authors have read and agreed to the published version of the manuscript.

Funding

This research was funded by Galveston Bay Estuary Program, grant number 582-19-90213, EPA Grant No. CE-00655006.

Institutional Review Board Statement

Not applicable.

Informed Consent Statement

Not applicable.

Data Availability Statement

Available from the corresponding author for oyster patterns. Also, please see https://storymaps.arcgis.com/stories/9b7d40a98df54645a070ad0dd29dddac for a GIS story map of the project created by A.H.

Acknowledgments

We would like to thank Kori Lugar and Rachel Sanchez for their role in collecting data and the University of Houston undergraduate students that assisted in processing the lab samples.

Conflicts of Interest

The authors declare no conflicts of interest.

Appendix A

Table A1. Based on the GIS Analysis for each QQ, the total amount of area that was identified in a polygon. All numerical values are in m2.
QQ NumberNameConfirmed ReefPlausible ReefNot Likely ReefNot ReefArea
Analyzed
2895_06_2Freeport NE 90,186.16 90,186.16
2895_07_1Christmas Point OE S NW3174.2512,209.26865.37 16,248.88
2994_33_1Texas City NW272.21637.081027.81 1937.10
2994_33_2Texas City NE 15,109.90 15,109.90
2994_33_3Texas City SW 169.69169.69
2994_33_4Texas City SE1446.039918.51417.272.4611,784.247
2994_41_1Virgina Point NW261.280.86122.94 385.08
2994_41_2Virgina Point NE18,474.8222,277.60109,931.12 150,683.54
2994_41_3Virgina Point SW2026.9984,266.77104,164.76 190,458.51
2994_41_4Virgina Point SE11,485.48326,827.67196,194.97 534,508.12
2994_42_1Galveston NW 1014.841014.84
2994_42_3Galveston SW 8218.50 8218.50
2994_49_1Lake Como NW 13,393.96 13,393.96
2994_49_2Lake Como NE 207.73 207.73
2994_49_3Lake Como SW 134.66 134.66
2995_48_4Hitchcock SE 897.41 897.41
2995_55_2Hoskins Mound NE1091.4825,642.1436,076.85 62,810.48
2995_55_4Hoskins Mound SE9200.3015,071.4415,270.51 39,542,25
2995_56_1Sea Isle NW 5020.42 5020.42
2995_56_2Sea Isle NE 6880.30 6880.30
2995_56_3Sea Isle SW3220.7510,171.23673.00 14,064.97
2995_56_4Sea Isle SE 12,907.54 12,907.54
2995_63_1Christmas Point NW3166.0093,807.220.75 96,973.97
2995_63_2Christmas Point SW1991.2399,440.87 101,432.10
2995_64_1 San Luis Pass NW 37,098.04 37,098.04
TOTAL59,931.98758,197.12687,975.201186.981150,291.28
Table A2. Species list and count of organisms collected in each QQ during ABM survey.
Alitta succineaAmphipod sp.Barnacle sp.Boonea impressaBrachidontes exustusCrepidula fornicataEurypanopeus depressusIschadium recurvumPanopeus simpsoniPetrolisthes armatus
2895_07_1011001202612
2994_41_2004057111800
2994_41_303015342023
2994_41_4 (1)010315267011
2994_41_4 (2)01000064012
2995_55_21100306000
2995_55_40200002000
2995_56_321400001000
2995_63_10000401200
2995_63_2033002205010
2995_63_30000303000

References

  1. Vieira, S.; Sroczyńska, K.; Neves, J.; Martins, M.; Costa, M.H.; Adão, H.; Vicente, C.S.L. Distribution Patterns of Benthic Bacteria and Nematode Communities in Estuarine Sediments. Estuar. Coast Shelf Sci. 2023, 291, 108448. [Google Scholar] [CrossRef]
  2. Suzzi, A.L.; Stat, M.; Gaston, T.F.; Huggett, M.J. Spatial Patterns in Host-Associated and Free-Living Bacterial Communities Across Six Temperate Estuaries. FEMS Microbiol. Ecol. 2023, 99, fiad061. [Google Scholar] [CrossRef] [PubMed]
  3. Gignoux-Wolfsohn, S.; Ruiz, M.G.; Barron, D.P.; Ruiz, G.; Lohan, K. Bivalve Microbiomes Are Shaped by Host Species, Size, Parasite Infection, and Environment. PeerJ 2024, 12, e18082. [Google Scholar] [CrossRef]
  4. Carroll, J.M.; Dashiell, R.; Watts, J.C.; Hunter, E.A. Tidal Level Affects the Prevalence and Impacts of Pests and Parasites on Oysters (Crassostrea virginica) on Intertidal Reefs in Georgia, USA. Mar. Biol. 2021, 168, 45. [Google Scholar] [CrossRef]
  5. LaRoche, R.A.; Doan, T.M.; Hanke, M.H. Habitat Characteristics of Artificial Oyster Reefs Influence Female Oystershell Mud Crab Panopeus simpsoni Rathbun, 1930 (Decapoda: Brachyura: Panopeidae). J. Crustac. Biol. 2022, 42, ruac033. [Google Scholar] [CrossRef]
  6. Hanke, M.H.; Posey, M.H.; Alphin, T.D. The Effects of Intertidal Oyster Reef Habitat Characteristics on Faunal Utilization. Mar. Ecol. Prog. Ser. 2017, 581, 57–70. [Google Scholar] [CrossRef]
  7. Hanke, M.H.; Posey, M.H.; Alphin, T.D. The Influence of Habitat Characteristics on Intertidal Oyster Crassostrea virginica Populations. Mar. Ecol. Prog. Ser. 2017, 571, 121–138. [Google Scholar] [CrossRef]
  8. Smith, T.M.; Hindell, J.S.; Jenkins, G.P.; Connolly, R.M. Seagrass Patch Size Affects Fish Responses to Edges. J. Anim. Ecol. 2010, 79, 275–281. [Google Scholar] [CrossRef]
  9. Fagan, W.F.; Cantrell, R.S.; Cosner, C. How Habitat Edges Change Species Interactions. Am. Nat. 1999, 153, 165–182. [Google Scholar] [CrossRef]
  10. Byers, J.E.; Rogers, T.L.; Grabowski, J.H.; Hughes, R.A.; Piehler, M.F.; Kimbro, D.L. Host and Parasite Recruitment Correlated at a Regional Scale. Oecologia 2014, 174, 731–738. [Google Scholar] [CrossRef]
  11. Byers, J.E.; Grabowski, J.H.; Piehler, M.F.; Hughes, A.R.; Weiskel, H.W.; Malek, J.C.; Kimbro, D.L. Geographic Variation in Intertidal Oyster Reef Properties and the Influence of Tidal Prism. Limnol. Oceanogr. 2015, 60, 1051–1063. [Google Scholar] [CrossRef]
  12. Peterson, C.; Grabowski, J.; Powers, S. Estimated Enhancement of Fish Production Resulting from Restoring Oyster Reef Habitat: Quantitative Valuation. Mar. Ecol. Prog. Ser. 2003, 264, 249–264. [Google Scholar] [CrossRef]
  13. Tolley, S.; Volety, A. The Role of Oysters in Habitat Use of Oyster Reefs by Resident Fishes and Decapod Crustaceans. J. Shellfish Res. 2005, 24, 1007–1012. [Google Scholar]
  14. Harwell, H.D.; Posey, M.H.; Alphin, T.D. Landscape Aspects of Oyster Reefs: Effects of Fragmentation on Habitat Utilization. J. Exp. Mar. Biol. Ecol. 2011, 409, 30–41. [Google Scholar] [CrossRef]
  15. Grabowski, J.; Powers, S. Habitat Complexity Mitigates Trophic Transfer on Oyster Reefs. Mar. Ecol. Prog. Ser. 2004, 277, 291–295. [Google Scholar] [CrossRef]
  16. Posey, M.H.; Alphin, T.D.; Powell, C.M. Use of Oyster Reefs as Habitat for Epibenthic Fish and Decapods. In Oyster Reef Restoration: A Synopsis and Synthesis of Approach; Luckenback, M., Mann, R., Wesson, J., Eds.; Virginia Institute of Marine Science Press: Gloucester Point, VA, USA, 1999; pp. 229–237. [Google Scholar]
  17. Wernberg, T.; Thomsen, M.S.; Baum, J.K.; Bishop, M.J.; Bruno, J.F.; Coleman, M.A.; Filbee-Dexter, K.; Gagnon, K.; He, Q.; Murdiyarso, D.; et al. Impacts of Climate Change on Marine Foundation Species. Ann. Rev. Mar. Sci. 2024, 16, 247–282. [Google Scholar] [CrossRef]
  18. Leong, R.C.; Bugnot, A.B.; Ross, P.M.; Erickson, K.R.; Gibbs, M.C.; Marzinelli, E.M.; O’Connor, W.A.; Parker, L.M.; Poore, A.G.B.; Scanes, E.; et al. Recruitment of a Threatened Foundation Oyster Species Varies with Large and Small Spatial Scales. Ecol. Appl. 2024, 34, e2968. [Google Scholar] [CrossRef]
  19. Whitman, E.; Reidenbach, M. Benthic Flow Environments Affect Recruitment of Crassostrea virginica Larvae to an Intertidal Oyster Reef. Mar. Ecol. Prog. Ser. 2012, 463, 177–191. [Google Scholar] [CrossRef]
  20. Lenihan, H.S. Physical—Biological Coupling on Oyster Reefs: How Habitat Structure Influences Individual Performance. Ecol. Monogr. 1999, 69, 251–275. [Google Scholar]
  21. Dame, R.; Alber, M.; Allen, D.; Mallin, M.; Montague, C.; Lewitus, A.; Chalmers, A.; Gardern, R.; Gilman, C.; Kjerfve, B.; et al. Estuaries of the South Atlantic Coast of North America: Their Geographical Signatures. Estuaries 2000, 23, 793–819. [Google Scholar] [CrossRef]
  22. Anderson, M.J.; Connell, S.D. Predation by Fish on Intertidal Oysters. Mar. Ecol. Prog. Ser. 1999, 187, 203–211. [Google Scholar] [CrossRef]
  23. Saoud, I.G.; Rouse, D.B. Evaluating Sediment Accretion on a Relic Oyster Reef in Mobile Bay, Alabama. J. Appl. Aquac. 2000, 10, 41–49. [Google Scholar] [CrossRef]
  24. Southwell, M.W.; Veenstra, J.J.; Adams, C.D.; Scarlett, E.V.; Payne, K.B. Changes in Sediment Characteristics upon Oyster Reef Restoration, NE Florida, USA. J. Coast. Zone Manag. 2017, 20, 1000442. [Google Scholar] [CrossRef]
  25. Caretti, O.N.; Bohnenstiehl, D.W.R.; Eggleston, D.B. Spatiotemporal Variability in Sedimentation Drives Habitat Loss on Restored Subtidal Oyster Reefs. Estuaries Coasts 2021, 44, 2100–2117. [Google Scholar] [CrossRef]
  26. Salvador de Paiva, J.N.; Walles, B.; Ysebaert, T.; Bouma, T.J. Understanding the Conditionality of Ecosystem Services: The Effect of Tidal Flat Morphology and Oyster Reef Characteristics on Sediment Stabilization by Oyster Reefs. Ecol. Eng. 2018, 112, 89–95. [Google Scholar] [CrossRef]
  27. Uddin, M.J.; Smith, K.J.; Hargis, C.W. Development of Pervious Oyster Shell Habitat (POSH) Concrete for Reef Restoration and Living Shorelines. Constr. Build. Mater. 2021, 295, 123685. [Google Scholar] [CrossRef]
  28. Piazza, B.P.; Banks, P.D.; La Peyre, M.K. The Potential for Created Oyster Shell Reefs as a Sustainable Shoreline Protection Strategy in Louisiana. Restor. Ecol. 2005, 13, 499–506. [Google Scholar] [CrossRef]
  29. Morris, R.L.; La Peyre, M.K.; Webb, B.M.; Marshall, D.A.; Bilkovic, D.M.; Cebrian, J.; Mcclenachan, G.; Kibler, K.M.; Walters, L.J.; Bushek, D.; et al. Large-Scale Variation in Wave Attenuation of Oyster Reef Living Shorelines and the Influence of Inundation Duration. Ecol. Appl. 2021, 31, e02382. [Google Scholar] [CrossRef]
  30. Morris, R.L.; Bilkovic, D.M.; Boswell, M.K.; Bushek, D.; Cebrian, J.; Goff, J.; Kibler, K.M.; La Peyre, M.K.; McClenachan, G.; Moody, J.; et al. The Application of Oyster Reefs in Shoreline Protection: Are We over-Engineering for an Ecosystem Engineer? J. Appl. Ecol. 2019, 56, 1703–1711. [Google Scholar] [CrossRef]
  31. Graham, P.M.; Palmer, T.A.; Beseres Pollack, J. Oyster Reef Restoration: Substrate Suitability May Depend on Specific Restoration Goals. Restor. Ecol. 2017, 25, 459–470. [Google Scholar] [CrossRef]
  32. Hanke, M.H.; Bobby, N.; Sanchez, R. Can Relic Shells Be an Effective Settlement Substrate for Oyster Reef Restoration? Restor. Ecol. 2021, 29, 3–6. [Google Scholar] [CrossRef]
  33. Beck, M.W.; Brumbaugh, R.D.; Airoldi, L.; Carranza, A.; Coen, L.D.; Crawford, C.; Defeo, O.; Edgar, G.J.; Hancock, B.; Kay, M.C.; et al. Oyster Reefs at Risk and Recommendations for Conservation, Restoration, and Management. Bioscience 2011, 61, 107–116. [Google Scholar] [CrossRef]
  34. Goelz, T.; Vogt, B.; Hartley, T. Alternative Substrates Used for Oyster Reef Restoration: A Review. J. Shellfish Res. 2020, 39, 1–12. [Google Scholar] [CrossRef]
  35. George, L.M.; De Santiago, K.; Palmer, T.A.; Beseres Pollack, J. Oyster Reef Restoration: Effect of Alternative Substrates on Oyster Recruitment and Nekton Habitat Use. J. Coast. Conserv. 2015, 19, 13–22. [Google Scholar] [CrossRef]
  36. Coen, L.D.; Luckenbach, M.W. Developing Success Criteria and Goals for Evaluating Oyster Reef Restoration: Ecological Function or Resource Exploitation? Ecol. Eng. 2000, 15, 323–343. [Google Scholar] [CrossRef]
  37. Powers, S.; Peterson, C.; Grabowski, J.; Lenihan, H. Success of Constructed Oyster Reefs in No-Harvest Sanctuaries: Implications for Restoration. Mar. Ecol. Prog. Ser. 2009, 389, 159–170. [Google Scholar] [CrossRef]
  38. Grizzle, R.; Ward, K.; Geselbracht, L.; Birch, A. Distribution and Condition of Intertidal Eastern Oyster (Crassostrea virginica) Reefs in Apalachicola Bay Florida Based on High-Resolution Satellite Imagery. J. Shellfish Res. 2018, 37, 1027–1038. [Google Scholar] [CrossRef]
  39. Zu Ermgassen, P.S.E.; Spalding, M.D.; Grizzle, R.E.; Brumbaugh, R.D. Quantifying the Loss of a Marine Ecosystem Service: Filtration by the Eastern Oyster in US Estuaries. Estuaries Coasts 2012, 36, 36–43. [Google Scholar] [CrossRef]
  40. Grizzle, R.E.; Brodeur, M.A.; Abeels, H.A.; Greene, J.K. Bottom Habitat Mapping Using Towed Underwater Videography: Subtidal Oyster Reefs as an Example Application. J. Coast. Res. 2008, 24, 103–109. [Google Scholar] [CrossRef]
  41. Windle, A.E.; Puckett, B.; Huebert, K.B.; Knorek, Z.; Johnston, D.W.; Ridge, J.T. Estimation of Intertidal Oyster Reef Density Using Spectral and Structural Characteristics Derived from Unoccupied Aircraft Systems and Structure from Motion Photogrammetry. Remote Sens. 2022, 14, 2163. [Google Scholar] [CrossRef]
  42. Le Bris, A.; Rosa, P.; Lerouxel, A.; Cognie, B.; Gernez, P.; Launeau, P.; Robin, M.; Barillé, L. Hyperspectral Remote Sensing of Wild Oyster Reefs. Estuar. Coast. Shelf Sci. 2016, 172, 1–12. [Google Scholar] [CrossRef]
  43. Adams, R.E.; Dijkstra, J.R.; Semme, J.; Smith, B.; Ward, R.W. Mapping and Characterizing Subtidal Oyster Reefs Using Acoustic Techniques, Underwater Videography and Quadrat Counts. Am. Fish. Soc. Symp. 2005, 41, 153–159. [Google Scholar]
  44. Allen, Y.C.; Wilson, C.A.; Roberts, H.H.; Supan, J. High Resolution Mapping and Classification of Oyster Habitats in Nearshore Louisiana Using Sidescan Sonar. Estuaries 2005, 28, 435–446. [Google Scholar] [CrossRef]
  45. Espriella, M.C.; Lecours, V.; Camp, E.V.; Andrew Lassiter, H.; Wilkinson, B.; Frederick, P.C.; Pittman, S.J. Drone Lidar-Derived Surface Complexity Metrics as Indicators of Intertidal Oyster Reef Condition. Ecol. Indic. 2023, 150, 110190. [Google Scholar] [CrossRef]
  46. Cannon, D.J.; Kibler, K.M.; Taye, J.; Medeiros, S.C. Characterizing Canopy Complexity of Natural and Restored Intertidal Oyster Reefs (Crassostrea virginica) with a Novel Laser-Scanning Method. Restor. Ecol. 2023, 31, e13973. [Google Scholar] [CrossRef]
  47. Wirth, E.E.; Scott, G.I.; Fulton, M.H.; Van Dolah, R.F.; Maier, R.R.; Hadley, N.; Daugomah, J.W.; Key, R.B. In Situ Monitoring of Dredged Material Spoil Sites Using the Oyster Crassostrea virginica. Arch. Environ. Contam. Toxicol. 1996, 30, 340–348. [Google Scholar] [CrossRef]
  48. Marenghi, F.; Ashton-Alcox, K.; Wong, R.; Reynolds, B.; Ozbay, G. Dredge Efficiency on Natural Oyster Grounds in Delaware Bay and Its Application in Monitoring the Eastern Oyster (Crassostrea virginica) Stock in Delaware, USA. Fish Res. 2017, 186, 292–300. [Google Scholar] [CrossRef]
  49. Lehnert, R.; Allen, D. Nekton Use of Subtidal Oyster Shell Habitat in a Southeastern US Estuary. Estuaries 2002, 25, 1015–1024. [Google Scholar] [CrossRef]
  50. Outhwaite, A.; Lebreton, B.; Palmer, T.A.; Beseres Pollack, J. Habitat Provision Differs Across Subtidal Reefs Varying in Location Within the Estuarine Landscape. Estuaries Coasts 2024, 47, 1345–1358. [Google Scholar] [CrossRef]
  51. Griffitt, J.; Posey, M.H.; Alphin, T.D. Effects of Edge Fragmentation on Oyster Reef Utilization by Transient Nekton. J. Elisha Mitchell Sci. Soc. 1999, 115, 98–103. [Google Scholar]
  52. Kjelland, M.E.; Piercy, C.D.; Lackey, T.; Swannack, T.M. An Integrated Modeling Approach for Elucidating the Effects of Different Management Strategies on Chesapeake Bay Oyster Metapopulation Dynamics. Ecol. Model. 2015, 308, 45–62. [Google Scholar] [CrossRef]
  53. Theuerkauf, S.J.; Puckett, B.J.; Eggleston, D.B. Metapopulation Dynamics of Oysters: Sources, Sinks, and Implications for Conservation and Restoration. Ecosphere 2021, 12, e03573. [Google Scholar] [CrossRef]
  54. Arnold, W.S.; Meyers, S.D.; Geiger, S.P.; Luther, M.E.; Narváez, D.; Frischer, M.E.; Hofmann, E. Applying a Coupled Biophysical Model to Predict Larval Dispersal and Source/Sink Relationships in a Depleted Metapopulation of the Eastern Oyster Crassostrea virginica. J. Shellfish Res. 2017, 36, 101–118. [Google Scholar] [CrossRef]
  55. Rivera, M. Texas Oyster Industry Tries Comeback after Harvey Devastation. New York Post, 17 July 2018. [Google Scholar]
  56. Texas Parks and Wildlife Texas Commercial Fishing Regulations Summary. 2024. Available online: https://tpwd.texas.gov/publications/pwdpubs/media/pwd_bk_v3400_0074.pdf (accessed on 10 February 2025).
  57. Carter, L.J. Galveston Bay: Test Case of an Estuary in Crisis. Science 1970, 167, 1102–1108. [Google Scholar] [CrossRef]
  58. Salas-Monreal, D.; Anis, A.; Salas-de-Leon, D.A. Galveston Bay Dynamics under Different Wind Conditions. Oceanologia 2018, 60, 232–243. [Google Scholar] [CrossRef]
  59. Du, J.; Park, K.; Dellapenna, T.M.; Clay, J.M. Dramatic Hydrodynamic and Sedimentary Responses in Galveston Bay and Adjacent Inner Shelf to Hurricane Harvey. Sci. Total Environ. 2019, 653, 554–564. [Google Scholar] [CrossRef]
  60. Margiotta, A.M.; Shervette, V.R.; Hadley, N.H.; Plante, C.J.; Wilber, D.H. Species-Specific Responses of Resident Crabs to Vertical Habitat Complexity on Intertidal Oyster Reefs. J. Exp. Mar. Biol. Ecol. 2016, 477, 7–13. [Google Scholar] [CrossRef]
  61. Lawrence, D.R.; Scott, G.I. The Determination and Use of Condition Index of Oysters. Estuaries 1982, 5, 23–27. [Google Scholar] [CrossRef]
  62. Abbe, G.R.; Albright, B.W. An Improvement to the Determination of Meat Condition Index for the Eastern Oyster Crassostrea virginica (Gmelin 1791). J. Shellfish Res. 2003, 22, 747–752. [Google Scholar]
  63. Hanke, M.H.; Hargrove, J.M.; Alphin, T.D.; Posey, M.H. Oyster Utilization and Host Variation of the Oyster Pea Crab (Zaops ostreum). J. Shellfish Res. 2015, 34, 281–287. [Google Scholar] [CrossRef]
  64. Baggett, L.P.; Powers, S.P.; Brumbaugh, R.; Coen, L.D.; DeAngelis, B.; Greene, J.; Hancock, B.; Morlock, S. Oyster Habitat Restoration Monitoring and Assessment Handbook; The Nature Conservancy: Arlington, VA, USA, 2014; 96p. [Google Scholar]
  65. Keyes, T. Restoration of Offshore Bars and Shell Rakes. In Georgia Department of Natural Resources-Technical Report; Georgia Department of Natural Resources: Atlanta, GA, USA, 2020; 33p. [Google Scholar]
  66. Manis, J.E.; Garvis, S.K.; Jachec, S.M.; Walters, L.J. Wave Attenuation Experiments over Living Shorelines over Time: A Wave Tank Study to Assess Recreational Boating Pressures. J. Coast. Conserv. 2015, 19, 1–11. [Google Scholar] [CrossRef]
  67. Sussan, T.T.; Charpentier, C.L. Conditions That Promote Oyster Settlement Coincide with Areas of High Boating Activity in a Developed Coastal Habitat. J. Exp. Mar. Biol. Ecol. 2024, 572, 151989. [Google Scholar] [CrossRef]
  68. Lipcius, R.N.; Burke, R.P.; McCulloch, D.N.; Schreiber, S.J.; Schulte, D.M.; Seitz, R.D.; Shen, J. Overcoming Restoration Paradigms: Value of the Historical Record and Metapopulation Dynamics in Native Oyster Restoration. Front. Mar. Sci. 2015, 2, 65. [Google Scholar] [CrossRef]
  69. Luckenbach, M.; Coen, L.; Ross, P.G., Jr.; Stephen, J. Oyster Reef Habitat Restoration: Relationships Between Oyster Abundance and Community Development Based on Two Studies in Virginia and South Carolina. J. Coast. Res. 2005, 64–78. [Google Scholar]
  70. Coen, L.; Brumbaugh, R.; Bushek, D.; Grizzle, R.; Luckenbach, M.; Posey, M.; Powers, S.; Tolley, S. Ecosystem Services Related to Oyster Restoration. Mar. Ecol. Prog. Ser. 2007, 341, 303–307. [Google Scholar] [CrossRef]
  71. Schulte, D.M.; Burke, R.P.; Lipcius, R.N. Unprecedented Restoration of a Native Oyster Metapopulation. Science 2009, 325, 1124–1129. [Google Scholar] [CrossRef]
  72. Hanke, M.H.; Leija, H.; Laroche, R.A.S.; Modi, S.; Culver-Miller, E.; Sanchez, R.; Bobby, N. Localized Placement of Breakwater Reefs Influences Oyster Populations and Their Resilience after Hurricane Harvey. Ecologies 2022, 3, 422–434. [Google Scholar] [CrossRef]
  73. Hill, J.; Weissburg, M. Habitat Complexity and Predator Size Mediate Interactions between Intraguild Blue Crab Predators and Mud Crab Prey in Oyster Reefs. Mar. Ecol. Prog. Ser. 2013, 488, 209–219. [Google Scholar] [CrossRef]
  74. Grabowski, J. Habitat Complexity Disrupts Predator-Prey Interactions but Not the Trophic Cascade on Oyster Reefs. Ecology 2004, 85, 995–1004. [Google Scholar] [CrossRef]
  75. Ziegler, S.L.; Grabowski, J.H.; Baillie, C.J.; Fodrie, F.J. Effects of Landscape Setting on Oyster Reef Structure and Function Largely Persist More than a Decade Post-Restoration. Restor. Ecol. 2017, 26, 933–942. [Google Scholar] [CrossRef]
  76. Grabowski, J.H.; Baillie, C.J.; Carlyle, R.; Fodrie, F.J.; Gittman, R.K.; Kimbro, D.L.; Sullivan, K.; Baukus, A.; Hughes, A.R.; Powers, S.P.; et al. Fish and Invertebrate Use of Restored vs. Natural Oyster Reefs in a Shallow Temperate Latitude Estuary. Ecosphere 2022, 13, e4035. [Google Scholar] [CrossRef]
  77. Mercado-Silva, N. Condition Index of the Eastern Oyster, Crassostrea virginica (Gmelin, 1791) in Sapelo Island Georgia-Effects of Site, Position on Bed and Pea Crab Parasitism. J. Shellfish Res. 2005, 24, 121–126. [Google Scholar]
  78. Hadley, N.H.; Hodges, M.; Wilber, D.H.; Coen, L.D. Evaluating Intertidal Oyster Reef Development in South Carolina Using Associated Faunal Indicators. Restor. Ecol. 2010, 18, 691–701. [Google Scholar] [CrossRef]
  79. Matias, M.G. Macrofaunal Responses to Structural Complexity Are Mediated by Environmental Variability and Surrounding Habitats. Mar. Biol. 2013, 160, 493–502. [Google Scholar] [CrossRef]
  80. Hesterberg, S.G.; Duckett, C.C.; Salewski, E.A.; Bell, S.S. Three-Dimensional Interstitial Space Mediates Predator Foraging Success in Different Spatial Arrangements. Ecology 2017, 98, 1153–1162. [Google Scholar] [CrossRef]
  81. Lunt, J.; Reustle, J.; Smee, D.L. Wave Energy and Flow Reduce the Abundance and Size of Benthic Species on Oyster Reefs. Mar. Ecol. Prog. Ser. 2017, 569, 25–36. [Google Scholar] [CrossRef]
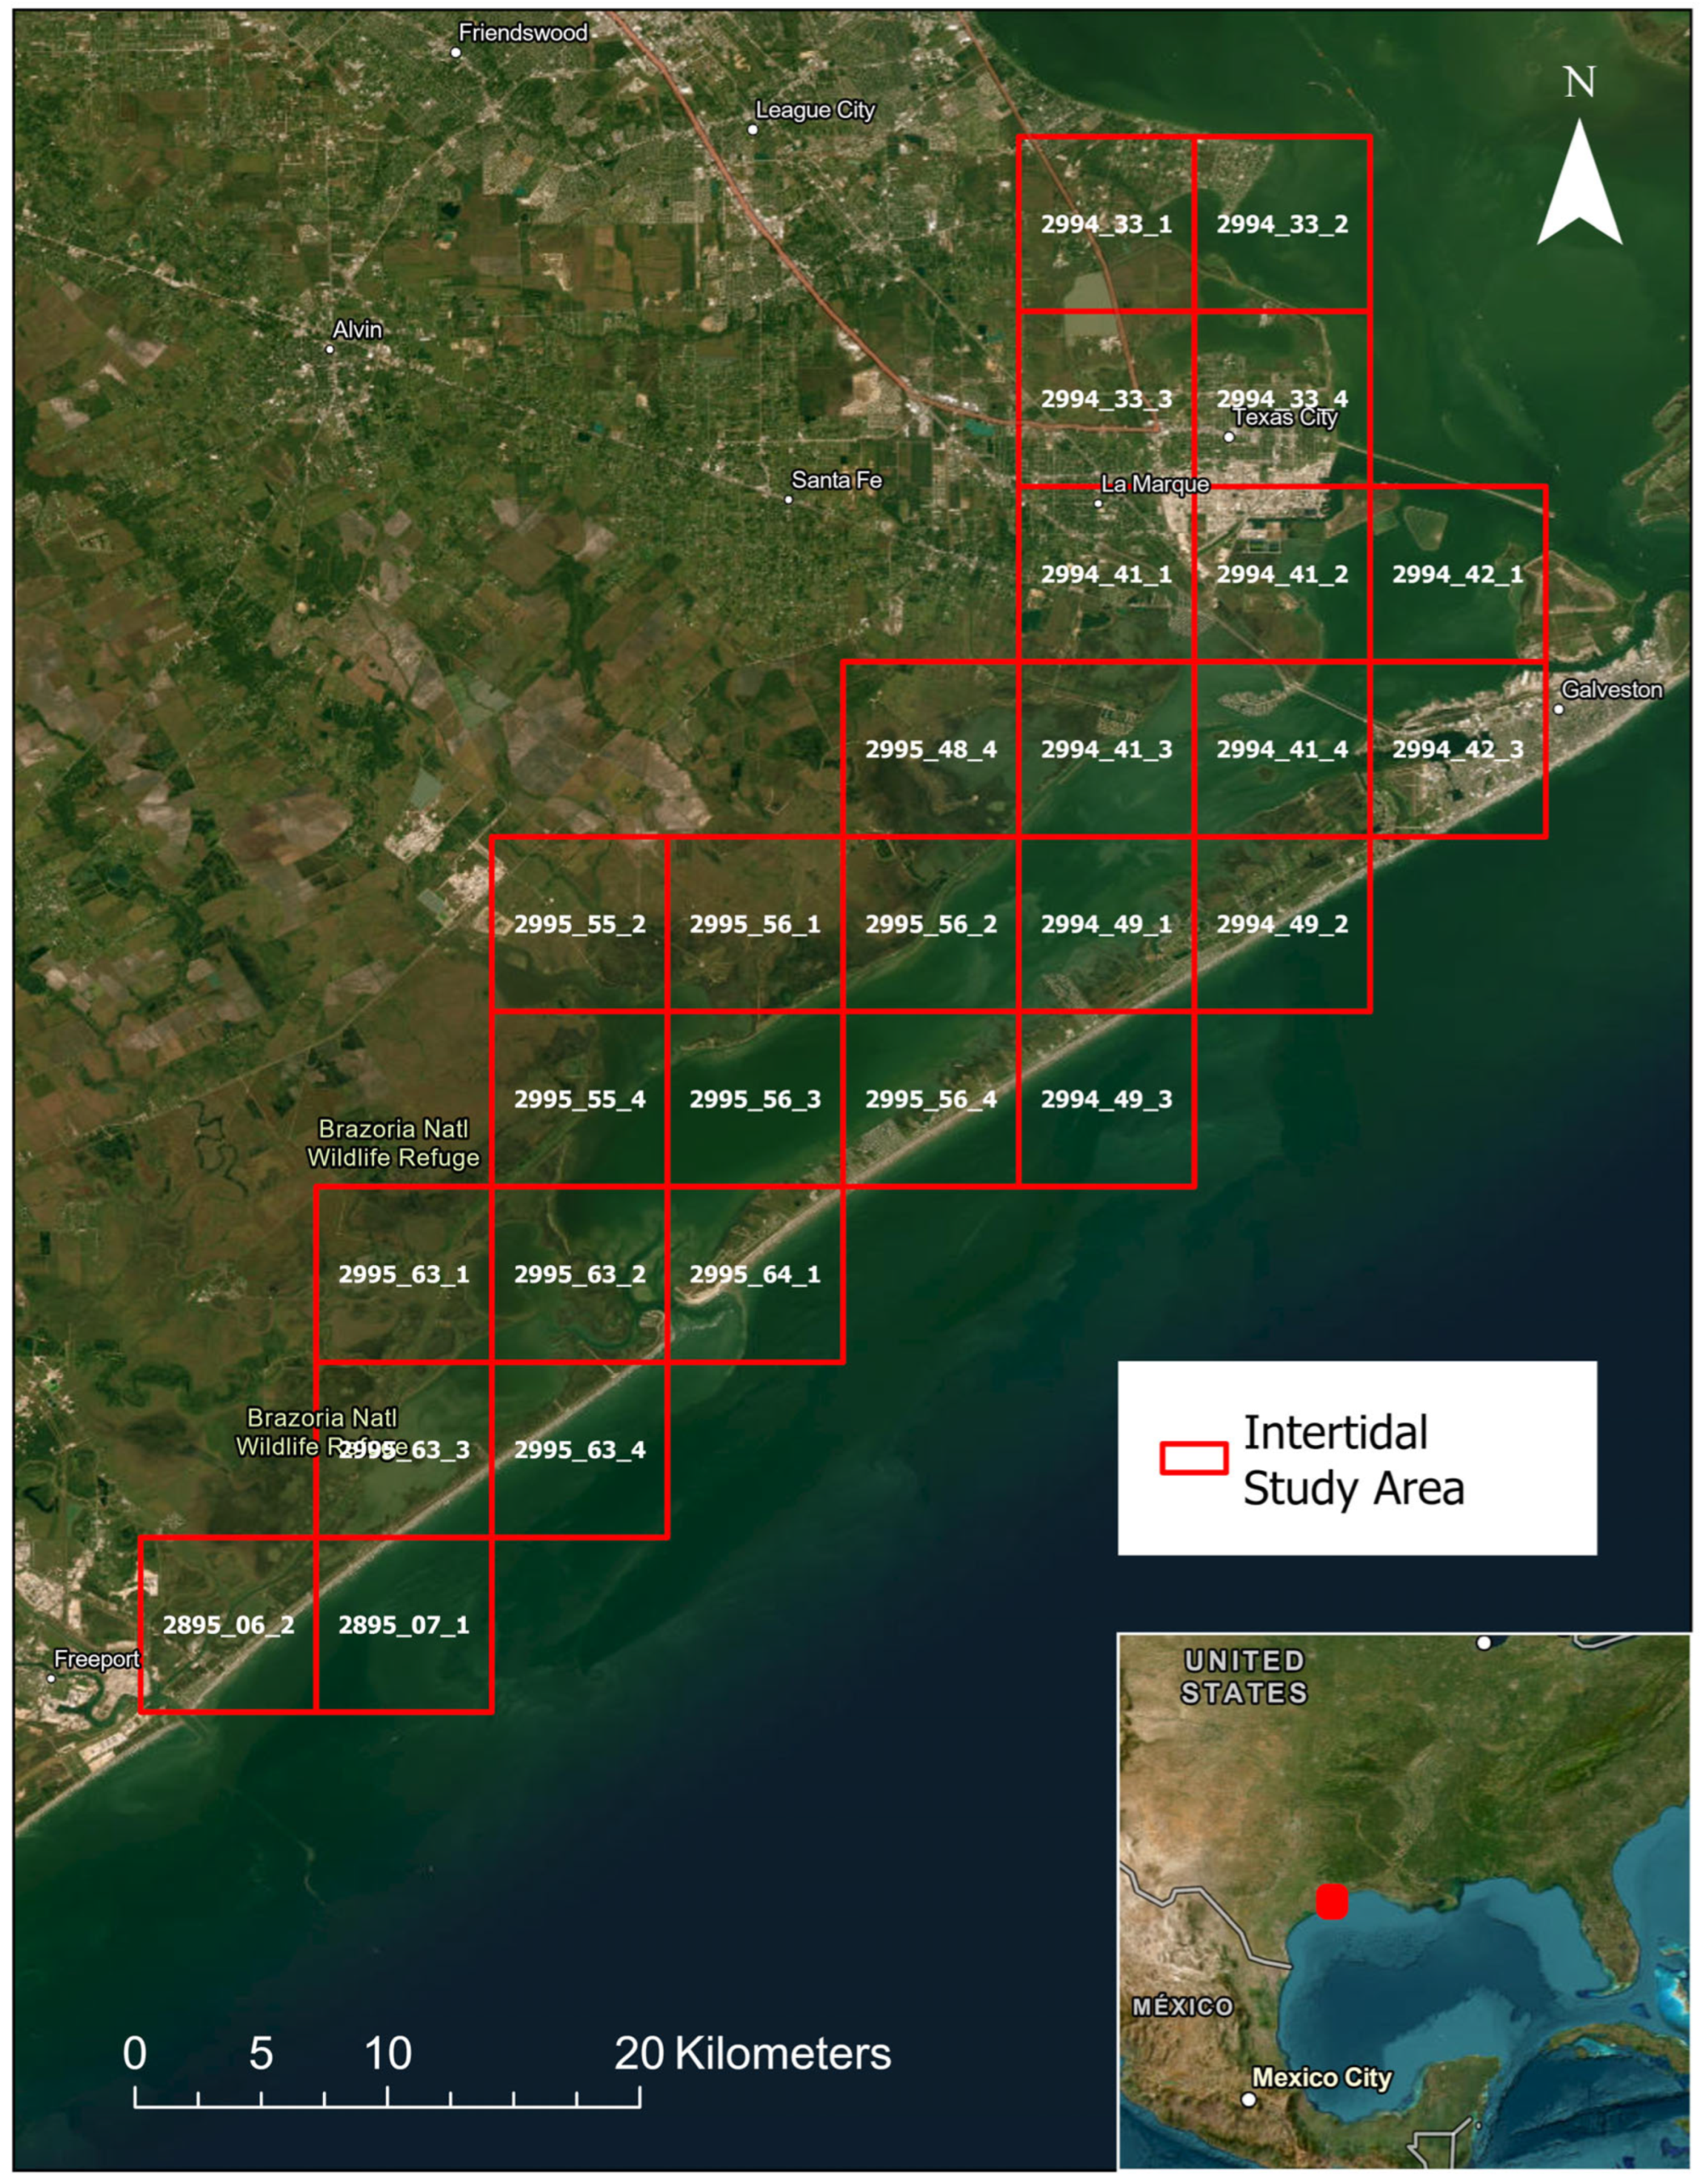
Figure 1. U.S. Geological Survey identified each Quarter Quadrant (QQ), with white numbering noting each QQ (in the individual red box) for West Galveston Bay, Texas. Insert picture has red box denoting Galveston Bay in Texas.
Ecologies 06 00036 g001
Figure 2. Reef characteristics, oyster density, and associated benthic macrofauna sampling layout on a reef. For reef characteristics, within a 0.25 m2 quadrat (A) with 16 evenly spaced points to determine percent reef cover and percent live oysters. A 1 m rugosity chain (illustrated by only location) for (B) was laid down to estimate vertical relief. (C) represents measurement of highest vertical oyster in quadrat A. Both and (D,E) portray 0.04 m2 quadrats where oyster metrics were quantified. Quadrat (D) also provides a spatial representation, along with oysters, for associated benthic macrofauna excavation sampling.
Ecologies 06 00036 g002
Figure 3. Percentage of reef covered by oyster shell (mean ± SE) within each QQ.
Ecologies 06 00036 g003
Figure 4. Mean percent of oyster shell cover at each sample location. Increased circle size indicates increased percentage of oyster shell cover.
Ecologies 06 00036 g004
Figure 5. Within a 0.25 m2 quadrat, the estimated percentage of reef covered by live oysters (mean ± SE) for representative reefs.
Ecologies 06 00036 g005
Figure 6. Mean percent of live oysters on the reef at each sample location. Increased circle size indicates increased percentage of live oysters.
Ecologies 06 00036 g006
Figure 7. Adjacent to a 0.25 m2 quadrat, the topographical heterogeneity was measured for each reef. Higher Rq values (mean ± SE) represent increased 3D structure on representative reefs [60].
Ecologies 06 00036 g007
Figure 8. Mean (±SE) reef rugosity at each sample location. Increased circle size indicates increased 3D structure on the reef.
Ecologies 06 00036 g008
Figure 9. Maximum reef height (mean ± SE) of the highest live oyster on representative reefs.
Ecologies 06 00036 g009
Figure 10. Mean reef height (in centimeters) at each sample location. Increased circle size indicates increased vertical growth on the reef.
Ecologies 06 00036 g010
Figure 11. Mean (±SE) abundance of live oysters per m2 on representative reefs.
Ecologies 06 00036 g011
Figure 12. Mean oyster abundance at each sample reef. Increased circle size indicates increased oyster abundance on the reefs.
Ecologies 06 00036 g012
Figure 13. Estimated intertidal oyster population size for each QQ.
Ecologies 06 00036 g013
Figure 14. Mean (±SE) shell height of live oysters on representative reefs.
Ecologies 06 00036 g014
Figure 15. Mean shell height at each sample location. Increased circle size indicates increased vertical growth on the reefs.
Ecologies 06 00036 g015
Figure 16. Mean (±SE) of oyster Condition Index of oysters on representative reefs.
Ecologies 06 00036 g016
Figure 17. Mean oyster Condition Index at each sample reef. Increased circle size indicates increased oyster Condition Index on the reefs.
Ecologies 06 00036 g017
Figure 18. Mean (±SE) for species richness for associated benthic macrofauna on representative oyster reefs.
Ecologies 06 00036 g018
Figure 19. Associated Benthic Macrofauna Species Richness at each sample reef based on 0.04 m2 quadrat sampling. Increased circle size indicates increased species richness on the reefs.
Ecologies 06 00036 g019
Figure 20. Mean (±SE) for species diversity of associated benthic macrofauna on representative oyster reefs.
Ecologies 06 00036 g020
Figure 21. Associated Benthic Macrofauna Species Diversity at each sample reef based on 0.04 m2 quadrat sampling. Increased circle size indicates increased species richness on the reefs.
Ecologies 06 00036 g021
Disclaimer/Publisher’s Note: The statements, opinions and data contained in all publications are solely those of the individual author(s) and contributor(s) and not of MDPI and/or the editor(s). MDPI and/or the editor(s) disclaim responsibility for any injury to people or property resulting from any ideas, methods, instructions or products referred to in the content.