Article

Distribution of Five Aquatic Plants Native to South America and Invasive Elsewhere under Current Climate

Department of Agricultural Sciences, University of Sassari, Viale Italia 39, 07100 Sassari, Italy
Ecologies 2021, 2(1), 27-42; https://doi.org/10.3390/ecologies2010003
Submission received: 10 December 2020 / Revised: 29 December 2020 / Accepted: 31 December 2020 / Published: 7 January 2021
(This article belongs to the Special Issue Feature Papers of Ecologies 2021)

Abstract

:
Biological invasions and climate pose two of the most important challenges facing global biodiversity. Certainly, climate change may intensify the impacts of invasion by allowing invasive plants to increase in abundance and further expand their ranges. For example, most aquatic alien plants in temperate climate are of tropical and subtropical origins and the northern limits of their ranges are generally determined by minimum winter temperatures, and they will probably expand their distributions northwards if climate warms. The distribution of five invasive aquatic plants in freshwater systems across continents were investigated. Their global distributions in the current climate were modeled using a recently developed ensemble species distribution model approach, specifically designed to account for dispersal constraints on the distributions of range-expanding species. It was found that the species appear capable of substantial range expansion, and that low winter temperature is the strongest factor limiting their invasion. These findings can be used to identify areas at risk of recently introduction of neophytes, and develop future monitoring programs for aquatic ecosystems, prioritizing control efforts, which enables the effective use of ecological niche models to forecast aquatic invasion in other geographic regions.

1. Introduction

Freshwater ecosystems are vulnerable to both alterations in climate and biological invasion [1]. In future years, water temperature is expected to increase, and the modification of precipitation events may alter flow regimes [2,3]. As modifications in climate alter aquatic ecosystems by increasing nutrient loading from the catchment areas to the lakes [4,5], influencing streamflow, amount and duration of ice cover, water quality and chemistry, then aquatic invasive species are predicted to invade previously uninhabitable areas [6,7], and even aquarium plants that are not currently invasive would likely become invasive due to the fact that most plants traded in aquaria are of tropical and subtropical origins [8,9,10]. Consequently, processes, such as flowering, nutrient uptake, and competition between species and the metabolic events, can be altered [11,12]. In addition, compared to terrestrial plants, aquatic plants are shown to have a higher probability of becoming invasive in new environments [13]. For example, Egeria densa Planch. (Hydrocharitaceae); Eichhornia crassipes (Mart.) Solms (Pontederiaceae) (Pontederia crassipes Mart.); Myriophyllum aquaticum (Vell.) Verdc. (Haloragaceae); Pistia stratiotes L. (Araceae), and Salvinia x molesta D.S. Mitch. (Salviniaceae) are five aquatic plant species native to South America and highly invasive elsewhere [14,15,16,17,18]. They have been introduced into Europe, North America, Australia, and New Zealand, where they have been increasingly expanding their ranges [19,20,21,22], and have been reported as the most damaging alien plants in South Africa’s freshwater systems [10].
In both terrestrial and freshwater ecosystems, species distribution models (SDMs) can be effectively used to generate risk maps that predict the relative suitability of habitat, if the introduction occurs outside the native range (e.g., [23,24,25,26,27,28,29,30]). Introduction events across continents (primary pathway) or spread after a single introduction (secondary pathway) [31] may promote the capacity of the species to respond to selection in new environments [32,33]. SDMs have been used to predict potential ranges under current and future climate conditions [34,35], for native and invasive species [36,37,38,39]. SDMs have generally been proven to reflect the correct response to climate change and other environmental gradients [40]. Species distributions are affected by many abiotic and biotic interactions [30,41,42], including anthropogenic factors [38]. However, climate is often regarded as a critical determinant of plant species ranges and ranges are correlated more strongly with climate than with any other factor especially on broad spatial scales [41,43]. This approach may only be appropriate if assumption of equilibrium is not violated (i.e., potential dispersal constraints and environmental tolerances are often ignored), and assuming there are no missing values in the climate space (i.e., not truncated niche) [44]. Distribution models identify sets of variables associated with the presence of invasive species to project their requirements onto the geographic space [45]. Matching the climate of the native range to non-native areas has provided very valuable information as to potential risks of establishment and spread. However, such an approach assumes that the same interactions between biotic and climatic factors that limit range size in the native range operate in the introduced range [46].
One assumption underlying SDMs is the principle of niche conservatism. This concept assumes that species tend to preserve their climatic and ecological requirements over time and space [47] or only change slowly over hundreds to millions of years [32,48]. However, during biological invasions, alien species could expand beyond their predicted climatic envelope into the invaded range (i.e., climatic niche shift), occupying new niches that are not predictable from knowledge of the native range alone. The species then change environmental tolerances to deal with the climate change [37]. Assuming niche conservatism, then invasive ranges can be predicted with models fitted with data from the native range [49]. However, the reliability of predictions provided by SDMs is questionable if niche shifts have truly taken place in different areas [47,48,50]. Many studies have investigated invasive plant species distribution through projection by SDMs [51,52,53] but only a few have considered non-native aquatic plant species [10,54,55,56]. Indeed, few aquatic plants have been studied with SDMs at the continental scale, for example Hydrilla verticillata [57], Elodea canadensis [54], E. densa, Ludwigia sp.pl., and M. aquaticum [58]. Nevertheless, some studies considered the distribution of some of these species and other invasive aquatic species (e.g., Ludwigia grandiflora Greuter and Burdet, and Myriophyllum heterophyllum Michaux) at a country scale or based on a limited set of algorithms or bioclimatic variables useful mostly for terrestrial plants [59,60].
Invasive plants have the potential for major further global range expansion. Therefore, this study aims to disentangle the role of hydroclimatic predictors on the occurrence of five South American invasive aquatic plants across continents, and determine which predictors influenced projected habitat suitability and potentially limit range expansion into unoccupied regions. Thus, the following questions were asked: (a) what is the potential for further invasive range expansion of these five species in the current climate? (b) What are the key climatic constraints shaping their occurrences? The predictions of high-risk areas for invasion provide valuable information for prevention, better surveillance, and rapid responses [61], as well as informing about the potential effects of climate on invasion risk.

2. Experimental Section

2.1. Study Species and Occurrence Data

Five well-known hydrophytes native to South America and invasive elsewhere were selected, namely Egeria densa, Eichhornia crassipes, Myriophyllum aquaticum, Pistia stratiotes, and Salvinia molesta [62,63,64] for distribution modeling. Among them, two are categorized as submerged (E. densa and M. aquaticum) and three as free-floating (E. crassipes, P. stratiotes, and S. molesta). These five-species were selected based on the high level of invasiveness reported by [65] in the risk assessment for aquatic species in South America. In addition to the native distribution, we distinguish locations where the species has become invasive within South America, but outside the historic native range (classified as alien in) were distinguished. Importantly, three of them (E. crassipes, M. aquaticum, and S. molesta) have been included in the list on invasive alien species of (European) Union concern (Regulation (EU) No. 1143/2014 of the European Parliament and of the Council of 22 October 2014, on the prevention and management of the introduction and spread of invasive alien species, hereafter, IAS Regulation). In addition, four of them are regulated by current Italian legislation (E. densa, E. crassipes, M. aquaticum, and S. molesta), identifying the most relevant regulated species. The Regulation establishes aspects as early warning and surveillance procedures, rapid eradications to avoid establishment and control systems [66].
Global species occurrences from their native and introduced ranges were obtained using the “Spocc” R package [67]. The package allowed to download occurrence data from the Global Biodiversity Information Facility (http://www.gbif.org), Atlas of Living Australia (http://www.ala.org.au), Biodiversity Information Serving Our Nation (http://www.bison.usgs.gov), iNaturalist (http://www.inaturalist.org), Ecoengine Interface (http://www.github.com/ropensci/ecoengine), iDigBio (http://www.idigbio.org), and Ocean Biographic Information System (http://www.iobis.org) (accessed February 2017). The occurrence data were supplemented with records retrieved from the literature (e.g., [68,69,70,71] http://www.splink.cria.org.br). Occurrence records with insufficient spatial precision (e.g., country or island centroids), potential errors (e.g., duplicates of the same sample), or that were outside of the coverage of the predictor layers (e.g., sea points, small islands) were excluded, as well as records collected before 1950.
Dubious records, such as those where the species has been introduced outside its climatic niche for attempts of establishment (e.g., those where winter frosts are known to kill the species or populations known to occupy climatically anomalous microhabitats) or cultivated were removed. For example, repeated introductions, of aquatic plant species, failed to establish in Germany up until 2005. However, since 2008, an established population of P. stratiotes has been permanently present in thermal sections of the River Erft [72]. In particular, S. molesta has been found in Austria, Belgium, France (Corsica), Germany, Italy, the Netherlands and Portugal, but it is not clear if reports represent established populations [73]. Botanic garden records were also excluded as well as occasional field observations (e.g., ephemeral presence of E. crassipes and P. stratiotes in parts of Germany, Russia, the Netherlands, and the Czech Republic [72,74]). Literature documenting failed establishments (e.g., non-permanent populations occurring in cold parts of USA that proliferate for summer and then die and survive or establish during the warmer months of the year, and may have an extremely limited (or no capacity) to overwinter under natural conditions [14,18]) was also considered [15,17,18,19,63,75].
After data cleaning, a total number of geographic records equal to 652 for E. densa, 3210 for E. crassipes, 1485 for M. aquaticum, 1688 for P. stratiotes, and 704 for S. molesta was obtained (Figure 1). Then, the records were gridded at a 0.25 × 0.25 degree resolution for global modeling (Table S1).

2.2. Climate and Freshwater System Data

Freshwater-specific climate data were collected from near-global environmental information for freshwater ecosystems (https://www.earthenv.org/streams; [76]). The dataset consists of near-global, spatially continuous, and freshwater-specific environmental variables in a standardized 1 km grid. The same author delineated the sub-catchment for each grid cell along the HydroSHEDS (Hydrological data and maps based on SHuttle Elevation Derivatives at multiple Scales, https://www.hydrosheds.org [77]), river network and summarized the upstream environment (climate, topography, land cover, surface geology, and soil) to each grid cell using various metrics (average, minimum, maximum, range, sum, inverse distance-weighted average, and sum). The hydroclimate layers were found to correlate more strongly with water temperature and flow rates than the equivalent bioclimatic variables (WorldClim database [78]), typically used in distribution modeling. Then, it was considered useful and novel for this specific aquatic research the use of the 19 long-term variables, there after called “hydroclimatic variables”. All variables were subsequently averaged across single lakes and reservoirs of the Global Lakes and Wetlands Database [79] that are connected to the river network.
Based on natural history data of each aquatic species, the following hydroclimatic and environmental variables were selected for the modeling: hydro 06 = minimum upstream temperature of coldest month (reflecting exposure to frost); hydro 10 = mean upstream temperature of warmest quarter (reflecting the growing season thermal regime) and hydro 18 (log10 (1 + hydro_18 transformed mm) = upstream precipitation of warmest quarter (seasonal drying out of waterbodies may reduce suitability). Then, the variance inflation factor (VIF, “usdm” R package [80,81]) was applied in order to exclude multi-collinearity between variables. Since the model have aquatic habitat requirements, projected suitability maps were filtered to only include cells containing aquatic ecosystems using the Global Lakes and Wetlands Database (GLWD) [79].

2.3. Background Domain

To generate potential distributions of the species in their native and invaded ranges, presence-background modeling (presence-only) were used, drawing the background points (pseudo-absences), using a biological-informed pseudo-absence selection approach [82]. This allows algorithms to contrast the environment at the species occurrence locations (e.g., data selected from suitable areas) against a sample of background environmental conditions (i.e., pseudo-absences). The background points are sampled from both an accessible region [83] and an unsuitable area for the species based on its environmental tolerances. As such, both available environmental data and prior biological knowledge were used to fit the model (Table 1).
Specifically, the background region comprised: (1) the accessible native range (i.e., minimum convex polygon created around native occurrences [84]); (2) accessible parts of the invaded range (i.e., the area that the species has potentially visited, called “M”). In other words, the area within which presences may exist and within which absences are meaningful, in that they represent sites with the broader background likely to have been tested by the species for suitability, but not occupied yet. In the Biotic, Abiotic, and Movement (BAM) diagram, A represents the geographic region with the appropriate set of abiotic factors for the species and may be regarded as the geographic expression of the fundamental niche; B is the region where the right combination of interacting species occurs and M are those parts of the world “accessible” to the species in some ecological sense, without barriers to movement and colonization [85]; and (3) highly unsuitable regions (i.e., areas outside “M”, where the species cannot occur). Table 1 shows the hydroclimatic variables used to define the unsuitable background region, based on the climatic conditions and environmental limits for the five species documented in the literature. According to the literature, it was assumed that the key environmental constraints on plant distributions are mostly determined by: mean minimum temperature of the coldest month ranges between <−3 and 0 °C (tolerance freezing temperatures and prolonged exposure to lethal frosts); mean temperature of the warmest quarter ranges between <10 and 11 °C (below the minimum growth temperature) and precipitation of the warmest quarter < 4–5 mm (only small and seasonally dry habitat is available, which is expected to be of low suitability) [62,63,72,86,87].
Areas outside “M” will be predicted at lower suitability levels and inclusion of these areas in the model makes the model look better than it actually is. Therefore, accessible area is used to attempt to account for dispersal constraints and the background sampling protocol is designed to exclude “suitable-but-not-reached” areas [83]. According to [82], dispersal limitations in unsuitable areas could underestimate occupancy in those regions. Nevertheless, this should not impede the prediction of the region suitable for invasion.
To control for spatial biases in recording effort, the target group approach was used [88]. For this, the background sampling was weighted in proportion to the tracheophyte record density on the Global Biodiversity Information Facility -GBIF- (i.e., weighted selection of background data, with higher probability sites being selected most often), which was assumed as a good proxy for recording the effort of the focal species. To sample as much of the background environment as possible, twenty background samples of 10,000 randomly generated points (i.e., pseudo-absences) were selected, which is sufficiently large to ensure model convergence (Figure S1).

2.4. Species Distribution Models SDMs

Species distribution models to predict potential suitable areas for the invasion of the five aquatic species were used, employing BIOMOD (biomod2 R package [89]). Each dataset (i.e., background samples from only the accessible area and background samples from both the accessible and unsuitable area) was randomly split into 80% for model training and 20% for model evaluation. Then, nine statistical algorithms were fitted with the default BIOMOD, including: three regression methods (1) generalized linear model (GLM); (2) generalized additive model (GAM); (3) multivariate adaptive regression splines (MARS) and two classification methods; (4) classification tree algorithm (CTA); (5) flexible discriminant analysis (FDA) and four machine learning methods; (6) artificial neural network (ANN); (7) generalized boosting model (GBM); (8) maximum entropy (MaxEnt); and (9) random forest (RF).
Variable importance was obtained, and variable response functions were produced using BIOMOD. Model predictive performance was assessed by calculating the Area Under the Receiver-Operator Curve (AUC) and True Skill Statistic (TSS) for model predictions on the evaluation data, which were reserved from model fitting. AUC can be interpreted as the probability that a randomly selected presence has a higher model-predicted suitability than a randomly selected background location [90]. This information was used to combine the predictions of the different algorithms to produce ensemble projections of the model. For this, the two algorithms with the lowest AUC were first rejected and then predictions of the remaining algorithms were averaged, weighted by their AUC (Table S2).

3. Results

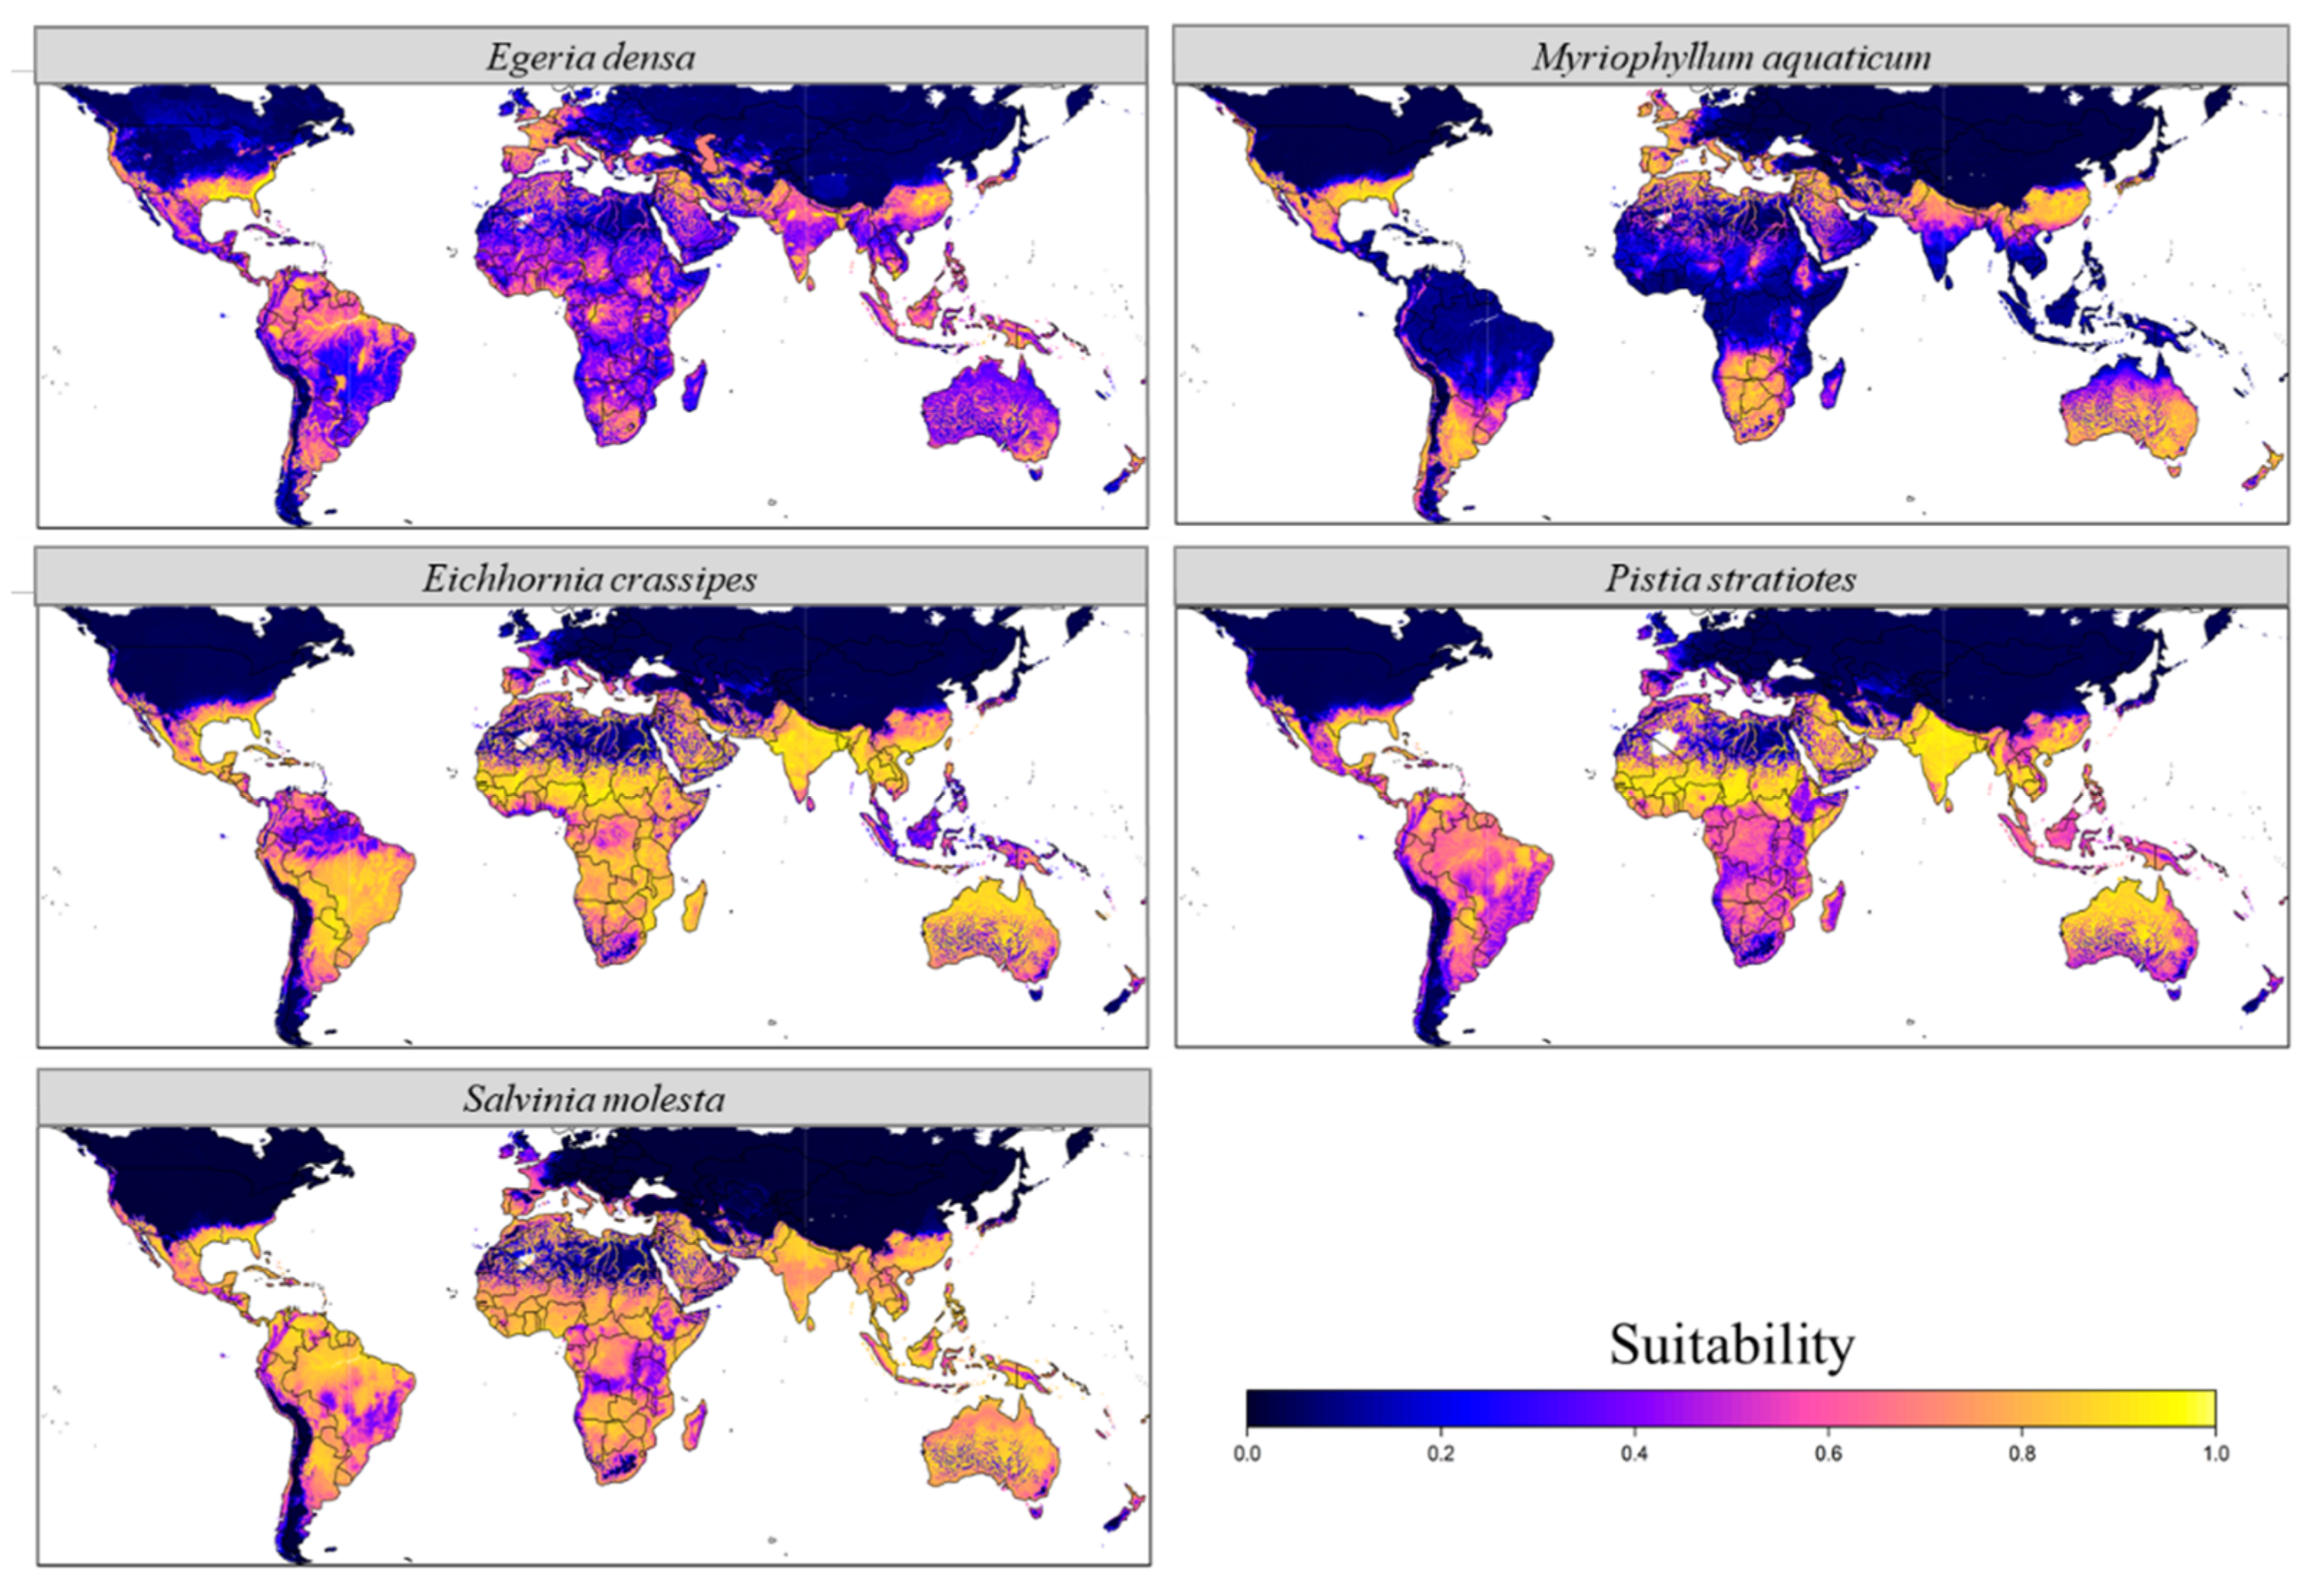
3.1. Current Potential Distribution

Acceptable numbers of grid cells with presences were obtained for modeling the five invasive aquatic species (645 grid cells for E. densa, 1077 for E. crassipes, 637 for M. aquaticum, 817 for P. stratiotes, and 237 for S. molesta). Figure 1 shows their current distribution and the regions considered highly unsuitable for these species based on the rules in Table 1. The areas estimated to be climatically suitable for the invasive aquatic species under current climatic conditions were plotted at global scale (Figure 2). The projection of E. densa, E. crassipes, and S. molesta models indicated high suitability throughout the tropical and subtropical regions of the world (areas in yellow, Figure 2). In addition, areas suitable for the distribution of M. aquaticum and P. stratiotes were found in subtropical areas. Non-native occurrences of the species were largely consistent with these projections. Among the five species, the potential geographical range for E. crassipes and S. molesta was predicted to be extremely broad. In general terms, their region is restricted by cold stress (Figure 3). No climatically suitable areas for the species were identified in the Andean cordillera in Chile (some high-altitude areas are too cold for persistence), but a high suitability in southeast North America, possible causing an invasion threat where there are sources of standing water. In Europe, models predict that E. densa and M. aquaticum may be able to invade widely in northern regions and relatively frost-free parts of Central Europe. In Australia, the suitable areas were located in the north (E. crassipes, P. stratiotes, and S. molesta) and east (M. aquaticum).

3.2. Model Evaluation

Across the models, the discrimination ability (AUC and TSS) between aquatic species records and grid cells without records (“pseudo-absences”) is shown in Table S2. The minimum and maximum AUC values from model outputs generated by ensemble model for the species ranged from 0.867 to 0.970. These results indicate a relatively high performance of the species distribution models. However, the inclusion of the unsuitable region inflates AUC values, as those places have no presences, and it is easy for the models to predict low suitability there. The variable importance of the fitted model algorithms and the ensemble suggested that suitability was most strongly determined by the minimum upstream temperature of coldest month ranged between 53.3% and 85% among the five species (Figure 3, Table S2). The response curve plots show that the ensemble model estimated biologically reasonable curves, with suitability limited by harsh frosts, low growing season temperatures particularly in the case of E. crassipes, low cover of large wetlands, and low precipitation in the growing season (Figure 3). The function also indicated that suitability was reduced if minimum temperatures were too high.

4. Discussion

4.1. Distribution in the Native Range

In this study, suitable areas for invasion under the current climate for five invasive aquatic plants were predicted, suggesting that extensive regions are predicted to be suitable for these species. They are all classified as invasive, which means they can have massive environmental and economic negative impacts over large areas.
In South America, where the species are native, but also introduced outside their native ranges, the highest suitability was obtained across Amazonia (e.g., E. densa, E. crassipes, P. stratiotes, and S. molesta). The climatic potential range appears to extend into cooler areas of Argentina than they have been reported (e.g., E. densa, E. crassipes, M. aquaticum, and S. molesta), in the lower slopes of the Andean cordillera in Colombia, and in evergreen forests in southern Venezuela—except for M. aquaticum—all characterized by dry and warm climates.
The proportion of suitable environments for aquatic species is predicted to decrease in the future in their native continent (e.g., E. densa and M. aquaticum) [58], and the potential bioclimatic range is conditional upon multiple factors that can impede the establishment in new environments [45].
Importantly, these species have their native range in South America and are recorded as invasive aliens in many regions inside their native continent, i.e., they act as alien in South America [65,68]. Distribution in the native continent may not be at equilibrium with the environment because the capacity of alien species to spread and occupy all climatically suitable habitats is limited by their dispersal ability constraints and environmental tolerances [44,91,92], which is often a feature of invasive aquatic species and is strongly associated with dispersal barriers at the boundaries of watersheds [93,94]. A strength of the modeling approach is that unoccupied but potentially climatically suitable parts of the native and non-native continents were excluded from the pseudo-absence sampling; thus, these regions were not erroneously modeled as unsuitable.

4.2. Distribution in the Non-Native Range

All of the major clusters of non-native records (e.g., Australia, Europe, southern USA, and South Africa) were projected to be suitable. Southern USA and the Mediterranean Basin were predicted as suitable regions for all the five species to invade. Northern Australia and India were projected to be suitable for E. crassipes, P. stratiotes, and S. molesta. The potential impacts of climate change in South Africa reveal, an according to [10], which may favor the expansion of E. crassipes and S. molesta. In North America, it is assumed that the presence of E. crassipes is due to repeated re-invasion from anthropogenic release by humans, rather than propagation by seed [63]. According to [95], bioclimatic models suggested an increase in emergent aquatic plant species followed by an expansion in their non-native distribution. The results therefore highlight that further range expansion appears likely for all species and there is a risk of colonization of new areas, but it is also an opportunity to manage the invasion process.
The northern limit of the potential distribution for E. crassipes in Europe is shaped by cold stress, according to the model, with climatically suitable habitat encircling the Pyrenees in southern France. All of the countries of the Mediterranean Basin and North Africa are at significant risk, in terms of degree of climatic suitability. The possible reason for the quite-restricted invasion of E. crassipes in Mediterranean regions (Italy, Portugal, Spain, Turkey, and Corsica, e.g., [16,96,97,98]) is very likely due to removal and control interventions taking place, and the fact that regrowth can occur mostly in spring and summer, with warmer climate conditions. Although prolonged cold weather may kill many plants, portions of the mat or the seeds may remain viable and allow regeneration when favorable conditions return. However, according to future climate change projections, a great potential for future range expansion lies in Europe [63]. Nonetheless, the standing water resources throughout the Mediterranean are critical to human survival and agriculture production due to the summer drought period that typifies the Mediterranean climate [15]. On the contrary, the climatic potential non-native range for M. aquaticum and E. densa appears to extend into cooler areas of north Europe. Importantly three of them (E. crassipes, M. aquaticum, and S. molesta) are included in the list of invasive alien species of (European) Union concern (Reg. no. 1143/2014).
In general, for all five species, the potential non-native range extends mostly towards west Europe, where summers are cool, but winters are mild (i.e., low probability to find frost and more likelihood to survive). The predicted range of M. aquaticum shows that this species has suitable climatic areas at latitudes, which are further north than those suitable to the others aquatic plants. This result is consistent with models assessed by [60] in Ireland and [58] at global scale, where their distribution could expand. In accordance with [58], M. aquaticum generally has the lowest habitat suitability throughout the world. The same authors reported that for E. densa and M. aquaticum, the proportion of suitable environments is predicted to decrease in the future in their native range, as well as in other areas of the world, where they have not yet been reported. However, the same authors reported—and this is in accordance with the results obtained in this study —that E. densa and M. aquaticum have a higher cold tolerance that may allow to thrive in Nordic countries.

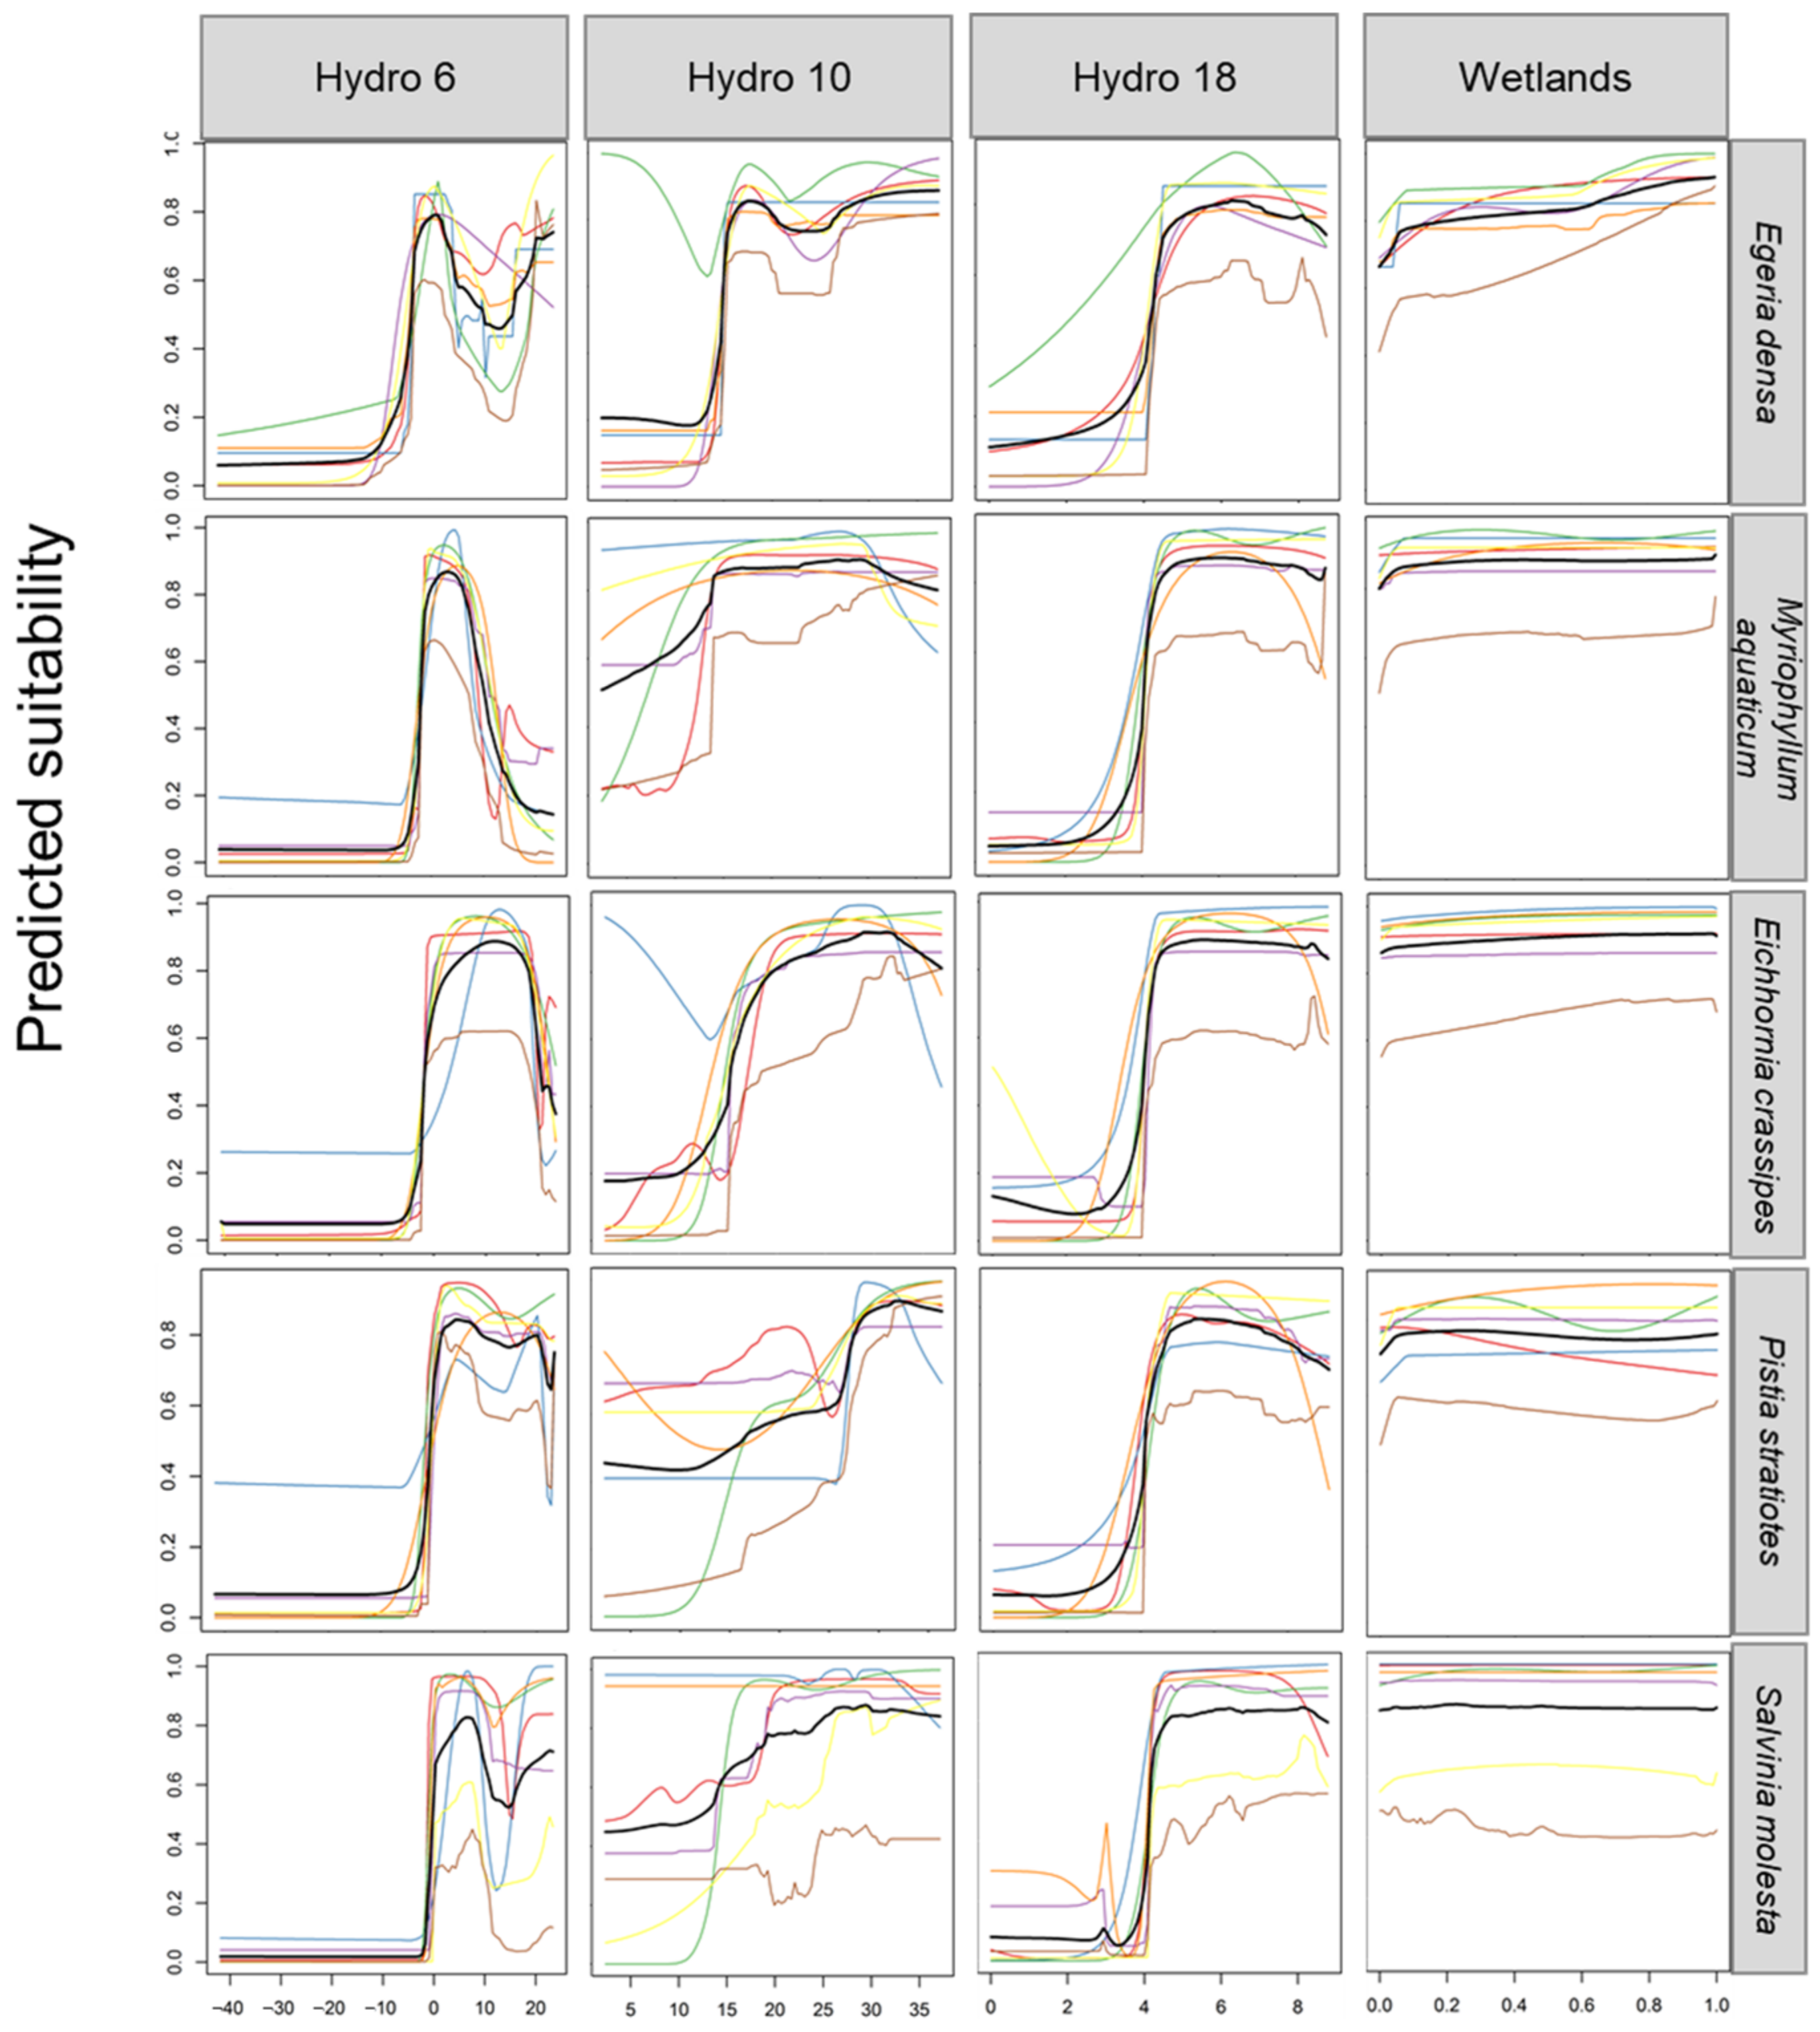
4.3. Climatic Limits to Occurrence

The predictions on the current climate ranges, of the five invasive aquatic species investigated in this study, reflect their current distribution and climatic associations. This suggests there are suitable (but not yet occupied) regions where the establishment is possible under the climatic and environmental conditions, but where invasion has not been reached through dispersal. According to [58], one reason could be the time, since introduction into their invasive range has not always allowed them to be in equilibrium with the environment, and likely has not realized all of their suitable environments yet, which is also seemingly the case in the native range, where they are restricted to particular watersheds. Since in many cases the species are not at equilibrium, model performance is not accurate during the invasion process, and false-absences may be misleading if they represent areas that have yet to be colonized [99] and are treated as pseudo-absences in model building. If suitable, unoccupied regions out of dispersal range are included in the background area, then the model will confuse lack of presence of the species due to dispersal limitations with a lack of presence due to environmental unsuitability, which may bias the fitting of species-environment and the prediction of potential distributions in novel regions. Nevertheless, if the accessible area is restricted by polygons around concentrated regions of occurrences (e.g., invasive range)—as in the biologically-informed approach, to reduce this bias within dispersal range of the occurrence [82,83]—the model can result in better model performance, more than if the models were built using a geographic background much larger than the core area of the species distribution [84].
The models developed here did not consider local abiotic factors, such as water body size, water depth, or water quality (pH, nutrients, salinity, and turbidity), or biotic interactions, which can influence the suitability of aquatic environments for the aquatic plants [74,100,101,102,103,104], or the rate of spread. In fact, these factors can be analyzed and modeled only at a finer scale. However, in general, climate is considered the driver most strongly associated with species distributions at global scale, but may be the least important factor associated with the regional or local distribution of aquatic invasive species [60]. In particular, water availability depends on precipitation regimes [1,55,105,106], while temperatures affect growth, survival, and reproduction [95]. According to [60], it is possible that a stronger association with climatic variables would emerge if climate variables more specific to freshwater habitats were available and used (e.g., maximum, minimum, and mean water surface temperatures). Unlike other distribution modeling studies for aquatic species, the models applied in this research have used the available hydroclimatic variables, which better reflect temperature and flow regimes in aquatic environments [76]. Nevertheless, wherever the water temperature is artificially warm enough (e.g., warming associated with industrial outflows, thermal waters), these species might establish. In addition, nutrients (eutrophication) and water drawdown can have positive effects on the overwintering of alien aquatic plant, as in the case of E. crassipes, at the northern margin of its distribution in China [107], or can promote their establishment and spread [108].

4.4. Implications for Climate Change

Invasion ecologists have attempted to predict possible effects of climate change on plant invasions and range expansions by projecting current species temperature limits onto maps of future temperature conditions [109]. In theory, the hydroclimatic variables used in this study can be produced for climate change scenarios, allowing a mapping of potential future distributions, but these are not currently available [76]. Nevertheless, examination of the species response curves suggests potential responses of the species to climate change. For example, the Mediterranean Basin is predicted to shift towards drier and warmer conditions [110]. The model response curves suggest that this warming is likely to increase suitability for all species. Possible mechanisms for this include increased survival through warmer winters, and longer growing seasons, permitting increased reproductive output. However, on the other side, lower precipitation may reduce suitability for the species in this region as a result of drying out of waterbodies or competition for water uses, such as crop irrigation [111]. In northern Europe, cold winters act as a survival barrier that prevents warm-water-adapted species from establishing self-sustaining populations [7]. Indeed, the distribution of E. crassipes and P. stratiotes is currently thought to be limited by cold, hard freezes, or ice cover [86]. Given the response curves of the five modeled species, aquatic invasive species may be better able to overwinter if temperatures increase, snowfall is reduced or seasonal ice cover melts earlier in the year [112]. In these regions, better overwinter survival may reduce the effectiveness of current management by mechanical means or hand pulling, as has been seen for Eichhornia species in North America [44]. Shorter winters at high latitudes will allow longer growing seasons, increasing the depths of macrophyte establishment [113]. Indeed, the occurrence of several warm winters in the late 1940s was responsible for the invasion of some non-native species (i.e., the spread of some introduced species appears to be temperature dependent) [114].
The niche of aquatic plants is not always conserved among different regions [115]. Therefore, habitat suitability in non-native range could be extended because of the current climate, resulting in the expansion of the distributions of all species, when they could disperse, but it is possible that the niche expansion could allow colonization of regions projected to be unsuitable. Studying niche shifts during current invasion could inform about the potential to undergo further niche shifts. The potential lack of niche conservatism in aquatic plants could be due to: (1) an unsuitable or incomplete set of explanatory variables; (2) genetic or epigenetic variation; or (3) phenotypic plasticity within species. According to [116], genetic variation may explain niche shift between continents, whereas phenotypic plasticity may be a more important factor in within-continent comparisons.

5. Conclusions

This study employs global-scale modeling approaches and predictions specifically developed for invasive non-native aquatic species distributions, using previous knowledge of the species tolerances and dispersal constraints. It is also one of the first studies to develop species distribution models using climatic predictors specifically produced for freshwater ecosystems. The models predicted that five highly invasive aquatic plants, natives to South America, have the potential for major further global range expansion in the current climate. Although the areas predicted as suitable for a species may not necessarily mean that the populations will establish there, it does offer useful information for detecting areas of potential invasion and spread [100] and, therefore, for prevention and early detection. A strong barrier to further range expansion is represented by low winter temperature, low summer temperature, and low precipitation, suggesting that warming of temperate regions may allow further poleward range expansion, while altered precipitation patterns in more arid regions could also affect suitability. As such, the distribution models provided in this study are useful to support risk assessment and management of these aquatic invasive plant species as they help in identifying regions that are currently at risk of invasion. It is suggested that a global-scale approach is useful for characterizing the species climate associations, but that further fine-tuning assessment of niche differences across the global range and assessment of the role of habitat conditions in determining local distribution patterns would also be extremely beneficial.

Supplementary Materials

The following are available online at https://www.mdpi.com/2673-4133/2/1/3/s1, Figure S1: Selected background grid cells used in the modeling of Egeria densa, Eichhornia crassipes, Myriophyllum aquaticum, Pistia stratiotes, and Salvinia molesta. Table S1: Number of occurrences before (raw data) and after cleaning procedure and numbers of grid cells with presences used for modeling. Table S2: Summary of the cross-validation predictive performance (AUC and TSS) and variable importance of the fitted model algorithms and the ensemble (AUC-weighted average of the best performing seven algorithms) for five South American occurring elsewhere as invasive non-native species. Variable importances are given as percentages for Hydro6 (mean minimum temperature of coldest month), Hydro10 (mean temperature of warmest quarter) and Hydro18 (precipitation of warmest quarter) and Global Lakes and Wetlands.

Funding

The study was funded by the COST Action TD1209 “European Information System for Alien Species” (Alien Challenge).

Institutional Review Board Statement

Not applicable.

Informed Consent Statement

Not applicable.

Acknowledgments

V.L. acknowledges support from the European Union LIFE Programme Preparatory Project LIFE IAP—RISK “Mitigating the threat of invasive alien plants in the EU through pest risk analysis to support the EU Regulation” (LIFE15 PRE/FR/000001). V.L. gratefully acknowledges Daniel Chapman support in R-code development, review, and editing of the manuscript.

Conflicts of Interest

The author declares no conflict of interest. The funders had no role in the design of the study; in the collection, analyses, or interpretation of data; in the writing of the manuscript, or in the decision to publish the results.

References

  1. Dudgeon, D.; Arthington, A.H.; Gessner, M.O.; Kawabata, Z.-I.; Knowler, D.J.; Lévêque, C.; Naiman, R.J.; Prieur-Richard, A.-H.; Soto, D.; Stiassny, M.L.J.; et al. Freshwater Biodiversity: Importance, Threats, Status and Conservation Challenges. Biol. Rev. 2006, 81, 163. [Google Scholar] [CrossRef] [PubMed]
  2. Whitehead, P.G.; Wilby, R.L.; Battarbee, R.W.; Kernan, M.; Wade, A.J. A Review of the Potential Impacts of Climate Change on Surface Water Quality. Hydrolog. Sci. J. 2009, 54, 101–123. [Google Scholar] [CrossRef]
  3. Watts, G.; Battarbee, R.W.; Bloomfield, J.P.; Crossman, J.; Daccache, A.; Durance, I.; Elliott, J.A.; Garner, G.; Hannaford, J.; Hannah, D.M.; et al. Climate Change and Water in the UK—Past Changes and Future Prospects. Progr. Phys. Geogr. Earth Environ. 2015, 39, 6–28. [Google Scholar] [CrossRef]
  4. Jeppesen, E.; Kronvang, B.; Jørgensen, T.B.; Larsen, S.E.; Andersen, H.E.; Søndergaard, M.; Liboriussen, L.; Bjerring, R.; Johansson, L.S.; Trolle, D.; et al. Recent Climate-Induced Changes in Freshwaters in Denmark. In Climatic Change and Global Warming of Inland Waters; Goldman, C.R., Kumagai, M., Robarts, R.D., Eds.; John Wiley & Sons, Ltd: Chichester, UK, 2012; pp. 155–171. ISBN 978-1-118-47059-6. [Google Scholar]
  5. Jeppesen, E.; Meerhoff, M.; Davidson, T.A.; Trolle, D.; Søndergaard, M.; Lauridsen, T.L.; Beklioglu, M.; Brucet, S.; Volta, P.; González-Bergonzoni, I.; et al. Climate Change Impacts on Lakes: An Integrated Ecological Perspective Based on a Multi-Faceted Approach, with Special Focus on Shallow Lakes. J. Limnol. 2014, 73. [Google Scholar] [CrossRef] [Green Version]
  6. Parmesan, C. Ecological and Evolutionary Responses to Recent Climate Change. Annu. Rev. Ecol. Evol. Syst. 2006, 37, 637–669. [Google Scholar] [CrossRef] [Green Version]
  7. Rahel, F.J.; Olden, J.D. Assessing the Effects of Climate Change on Aquatic Invasive Species. Conserv. Biol. 2008, 22, 521–533. [Google Scholar] [CrossRef]
  8. Brunel, S. Pathway Analysis: Aquatic Plants Imported in 10 EPPO Countries. EPPO Bull. 2009, 39, 201–213. [Google Scholar] [CrossRef]
  9. Verlinden, M.; De Boeck, H.J.; Nijs, I. Climate Warming Alters Competition between Two Highly Invasive Alien Plant Species and Dominant Native Competitors. Weed Res. 2014, 54, 234–244. [Google Scholar] [CrossRef]
  10. Hoveka, L.N.; Bezeng, B.S.; Yessoufou, K.; Boatwright, J.S.; Van der Bank, M. Effects of Climate Change on the Future Distributions of the Top Five Freshwater Invasive Plants in South Africa. S. Afr. J. Bot. 2016, 102, 33–38. [Google Scholar] [CrossRef]
  11. Meis, S.; Thackeray, S.J.; Jones, I.D. Effects of Recent Climate Change on Phytoplankton Phenology in a Temperate Lake. Freshw. Biol. 2009, 54, 1888–1898. [Google Scholar] [CrossRef]
  12. Thackeray, S.J.; Sparks, T.H.; Frederiksen, M.; Burthe, S.; Bacon, P.J.; Bell, J.R.; Botham, M.S.; Brereton, T.M.; Bright, P.W.; Carvalho, L.; et al. Trophic Level Asynchrony in Rates of Phenological Change for Marine, Freshwater and Terrestrial Environments: Phenological Change Across Major Environments. Glob. Change Biol. 2010, 16, 3304–3313. [Google Scholar] [CrossRef] [Green Version]
  13. Andreu, J.; Vilà, M. Risk Analysis of Potential Invasive Plants in Spain. J. Nat. Conserv. 2010, 18, 34–44. [Google Scholar] [CrossRef]
  14. Adebayo, A.; Briski, E.; Kalaci, O.; Hernandez, M.; Ghabooli, S.; Beric, B.; Chan, F.; Zhan, A.; Fifield, E.; Leadley, T.; et al. Water Hyacinth (Eichhornia crassipes) and Water Lettuce (Pistia stratiotes) in the Great Lakes: Playing with Fire? Aquat. Invasions 2011, 6, 91–96. [Google Scholar] [CrossRef] [Green Version]
  15. Kriticos, D.J.; Brunel, S. Assessing and Managing the Current and Future Pest Risk from Water Hyacinth, (Eichhornia crassipes), an Invasive Aquatic Plant Threatening the Environment and Water Security. PLoS ONE 2016, 11, e0120054. [Google Scholar] [CrossRef] [PubMed]
  16. Brundu, G.; Stinca, A.; Angius, L.; Bonanomi, G.; Celesti-Grapow, L.; D’Auria, G.; Griffo, R.; Migliozzi, A.; Motti, R.; Spigno, P. Pistia stratiotes L. and Eichhornia crassipes (Mart.) Solms.: Emerging Invasive Alien Hydrophytes in Campania and Sardinia (Italy). EPPO Bull. 2012, 42, 568–579. [Google Scholar] [CrossRef]
  17. EPPO Pest Risk Analysis for Salvinia Molesta. 2017. Available online: https://pra.eppo.int/pra/066665df-eff1-4804-9819-13dc5f6c47b4 (accessed on 13 February 2018).
  18. Millane, M.; Caffrey, J. Risk Assessment of Egeria Densa. 2014. Available online: http://nonnativespecies.ie/wp-content/uploads/2014/03/Egeria-densa-Large-flowered-Waterweed1.pdf (accessed on 15 June 2014).
  19. Yarrow, M.; Marín, V.H.; Finlayson, M.; Tironi, A.; Delgado, L.E.; Fischer, F. The Ecology of Egeria densa Planchón (Liliopsida: Alismatales): A Wetland Ecosystem Engineer? Rev. Chil. Hist. Nat. 2009, 82. [Google Scholar] [CrossRef] [Green Version]
  20. Hussner, A. Alien Aquatic Plant Species in European Countries: Alien Aquatic Plant Species in European Countries. Weed Res. 2012, 52, 297–306. [Google Scholar] [CrossRef]
  21. Thouvenot, L.; Haury, J.; Thiebaut, G. A Success Story: Water Primroses, Aquatic Plant Pests: Water Primroses, Aquatic Plant Pests. Aquat. Conserv. Mar. Freshw. Ecosyst. 2013. [Google Scholar] [CrossRef]
  22. Brundu, G. Plant Invaders in European and Mediterranean Inland Waters: Profiles, Distribution, and Threats. Hydrobiologia 2015, 746, 61–79. [Google Scholar] [CrossRef]
  23. Ficetola, G.F.; Thuiller, W.; Miaud, C. Prediction and Validation of the Potential Global Distribution of a Problematic Alien Invasive Species—The American Bullfrog: Predicting the Success of Invasions. Divers. Distrib. 2007, 13, 476–485. [Google Scholar] [CrossRef]
  24. Broennimann, O.; Guisan, A. Predicting Current and Future Biological Invasions: Both Native and Invaded Ranges Matter. Biol. Lett. 2008, 4, 585–589. [Google Scholar] [CrossRef] [PubMed]
  25. Jiménez-Valverde, A.; Peterson, A.T.; Soberón, J.; Overton, J.; Aragón, P.; Lobo, J.M. Use of Niche Models in Invasive Species Risk Assessments. Biol. Invasions 2011, 13, 2785–2797. [Google Scholar] [CrossRef]
  26. Hulme, P.E. Weed Risk Assessment: A Way Forward or a Waste of Time? J. Appl. Ecol. 2012, 49, 10–19. [Google Scholar] [CrossRef]
  27. Petitpierre, B.; Kueffer, C.; Broennimann, O.; Randin, C.; Daehler, C.; Guisan, A. Climatic Niche Shifts Are Rare Among Terrestrial Plant Invaders. Science 2012, 335, 1344–1348. [Google Scholar] [CrossRef] [PubMed] [Green Version]
  28. Wellenreuther, M.; Larson, K.W.; Svensson, E.I. Climatic Niche Divergence or Conservatism? Environmental Niches and Range Limits in Ecologically Similar Damselflies. Ecology 2012, 93, 1353–1366. [Google Scholar] [CrossRef]
  29. Guisan, A.; Tingley, R.; Baumgartner, J.B.; Naujokaitis-Lewis, I.; Sutcliffe, P.R.; Tulloch, A.I.T.; Regan, T.J.; Brotons, L.; McDonald-Madden, E.; Mantyka-Pringle, C.; et al. Predicting Species Distributions for Conservation Decisions. Ecol. Lett. 2013, 16, 1424–1435. [Google Scholar] [CrossRef]
  30. Lozano, V.; Marzialetti, F.; Carranza, M.L.; Chapman, D.; Branquart, E.; Dološ, K.; Große-Stoltenberg, A.; Fiori, M.; Capece, P.; Brundu, G. Modelling Acacia Saligna Invasion in a Large Mediterranean Island Using PAB Factors: A Tool for Implementing the European Legislation on Invasive Species. Ecol. Indic. 2020, 116, 106516. [Google Scholar] [CrossRef]
  31. Pergl, J.; Brundu, G.; Harrower, C.A.; Cardoso, A.C.; Genovesi, P.; Katsanevakis, S.; Lozano, V.; Perglová, I.; Rabitsch, W.; Richards, G. Applying the Convention on Biological Diversity Pathway Classification to Alien Species in Europe. Neobiota 2020, 62, 333–363. [Google Scholar] [CrossRef]
  32. Pearman, P.B.; Guisan, A.; Broennimann, O.; Randin, C.F. Niche Dynamics in Space and Time. Trends Ecol. Evol. 2008, 23, 149–158. [Google Scholar] [CrossRef]
  33. Alexander, J.M.; Edwards, P.J. Limits to the Niche and Range Margins of Alien Species. Oikos 2010, 119, 1377–1386. [Google Scholar] [CrossRef]
  34. Espíndola, A.; Pellissier, L.; Maiorano, L.; Hordijk, W.; Guisan, A.; Alvarez, N. Predicting Present and Future Intra-Specific Genetic Structure through Niche Hindcasting across 24 Millennia: Hindcasting-Based Phylogeography. Ecol. Lett. 2012, 15, 649–657. [Google Scholar] [CrossRef] [PubMed]
  35. Hughes, A.C.; Satasook, C.; Bates, P.J.J.; Bumrungsri, S.; Jones, G. The Projected Effects of Climatic and Vegetation Changes on the Distribution and Diversity of Southeast Asian Bats. Glob. Change Biol. 2012, 18, 1854–1865. [Google Scholar] [CrossRef]
  36. Thuiller, W.; Richardson, D.M.; Pysek, P.; Midgley, G.F.; Hughes, G.O.; Rouget, M. Niche-Based Modelling as a Tool for Predicting the Risk of Alien Plant Invasions at a Global Scale. Glob. Change Biol. 2005, 11, 2234–2250. [Google Scholar] [CrossRef]
  37. Broennimann, O.; Treier, U.A.; Müller-Schärer, H.; Thuiller, W.; Peterson, A.T.; Guisan, A. Evidence of Climatic Niche Shift during Biological Invasion. Ecol. Lett. 2007, 10, 701–709. [Google Scholar] [CrossRef] [PubMed] [Green Version]
  38. Liu, X.; Guo, Z.; Ke, Z.; Wang, S.; Li, Y. Increasing Potential Risk of a Global Aquatic Invader in Europe in Contrast to Other Continents under Future Climate Change. PLoS ONE 2011, 6, e18429. [Google Scholar] [CrossRef]
  39. O’Donnell, J.; Gallagher, R.V.; Wilson, P.D.; Downey, P.O.; Hughes, L.; Leishman, M.R. Invasion Hotspots for Non-Native Plants in Australia under Current and Future Climates. Glob. Change Biol. 2012, 18, 617–629. [Google Scholar] [CrossRef]
  40. Stephens, P.A.; Mason, L.R.; Green, R.E.; Gregory, R.D.; Sauer, J.R.; Alison, J.; Aunins, A.; Brotons, L.; Butchart, S.H.; Campedelli, T. Consistent Response of Bird Populations to Climate Change on Two Continents. Science 2016, 352, 84–87. [Google Scholar] [CrossRef] [Green Version]
  41. Mandle, L.; Warren, D.L.; Hoffmann, M.H.; Peterson, A.T.; Schmitt, J.; von Wettberg, E.J. Conclusions about Niche Expansion in Introduced Impatiens Walleriana Populations Depend on Method of Analysis. PLoS ONE 2010, 5, e15297. [Google Scholar] [CrossRef] [Green Version]
  42. Broennimann, O.; Fitzpatrick, M.C.; Pearman, P.B.; Petitpierre, B.; Pellissier, L.; Yoccoz, N.G.; Thuiller, W.; Fortin, M.-J.; Randin, C.; Zimmermann, N.E.; et al. Measuring Ecological Niche Overlap from Occurrence and Spatial Environmental Data: Measuring Niche Overlap. Glob. Ecol. Biogeogr. 2012, 21, 481–497. [Google Scholar] [CrossRef] [Green Version]
  43. Luoto, M.; Virkkala, R.; Heikkinen, R.K. The Role of Land Cover in Bioclimatic Models Depends on Spatial Resolution. Glob. Ecol. Biogeogr. 2006, 16, 34–42. [Google Scholar] [CrossRef]
  44. Václavík, T.; Meentemeyer, R.K. Invasive Species Distribution Modeling (ISDM): Are Absence Data and Dispersal Constraints Needed to Predict Actual Distributions? Ecol. Model. 2009, 220, 3248–3258. [Google Scholar] [CrossRef]
  45. Guisan, A.; Thuiller, W. Predicting Species Distribution: Offering More than Simple Habitat Models. Ecol. Lett. 2005, 8, 993–1009. [Google Scholar] [CrossRef]
  46. Wilson, J.R.; Richardson, D.M.; Rouget, M.; Procheş, Ş.; Amis, M.A.; Henderson, L.; Thuiller, W. Residence Time and Potential Range: Crucial Considerations in Modelling Plant Invasions. Divers. Distrib. 2007, 13, 11–22. [Google Scholar] [CrossRef]
  47. Wiens, J.J.; Ackerly, D.D.; Allen, A.P.; Anacker, B.L.; Buckley, L.B.; Cornell, H.V.; Damschen, E.I.; Jonathan Davies, T.; Grytnes, J.-A.; Harrison, S.P.; et al. Niche Conservatism as an Emerging Principle in Ecology and Conservation Biology: Niche Conservatism, Ecology, and Conservation. Ecol. Lett. 2010, 13, 1310–1324. [Google Scholar] [CrossRef] [PubMed]
  48. Wiens, J.J.; Graham, C.H. Niche Conservatism: Integrating Evolution, Ecology, and Conservation Biology. Annu. Rev. Ecol. Evol. Syst. 2005, 36, 519–539. [Google Scholar] [CrossRef] [Green Version]
  49. Peterson, A.T.; Vieglais, D.A. Predicting Species Invasions Using Ecological Niche Modeling: New Approaches from Bioinformatics Attack a Pressing Problem: A New Approach to Ecological Niche Modeling, Based on New Tools Drawn from Biodiversity Informatics, Is Applied to the Challenge of Predicting Potential Species’ Invasions. BioScience 2001, 51, 363–371. [Google Scholar] [CrossRef]
  50. Bennett, J.R.; Cumming, B.F.; Ginn, B.K.; Smol, J.P. Broad-Scale Environmental Response and Niche Conservatism in Lacustrine Diatom Communities: Scale and Environment in Diatom Communities. Glob. Ecol. Biogeogr. 2010, 19, 724–732. [Google Scholar] [CrossRef]
  51. Kriticos, D.J.; Sutherst, R.W.; Brown, J.R.; Adkins, S.W.; Maywald, G.F. Climate Change and the Potential Distribution of an Invasive Alien Plant: Acacia Nilotica ssp. indica in Australia: Climate Change and Invasive Plants. J. Appl. Ecol. 2003, 40, 111–124. [Google Scholar] [CrossRef]
  52. Qin, Z.; DiTommaso, A.; Wu, R.S.; Huang, H.Y. Potential Distribution of Two Ambrosia Species in China under Projected Climate Change. Weed Res. 2014, 54, 520–531. [Google Scholar] [CrossRef]
  53. Thalmann, D.J.K.; Kikodze, D.; Khutsishvili, M.; Kharazishvili, D.; Guisan, A.; Broennimann, O.; Müller-Schärer, H. Areas of High Conservation Value in Georgia: Present and Future Threats by Invasive Alien Plants. Biol. Invasions 2015, 17, 1041–1054. [Google Scholar] [CrossRef] [Green Version]
  54. Heikkinen, R.; Leikola, N.; Fronzek, S.; Lampinen, R.; Toivonen, H. Predicting Distribution Patterns and Recent Northward Range Shift of an Invasive Aquatic Plant: Elodea Canadensis in Europe. BioRisk 2009, 2, 1–32. [Google Scholar] [CrossRef]
  55. Alahuhta, J.; Heino, J.; Luoto, M. Climate Change and the Future Distributions of Aquatic Macrophytes across Boreal Catchments. J. Biogeogr. 2011, 38, 383–393. [Google Scholar] [CrossRef]
  56. Lopes, A.; Wittmann, F.; Schöngart, J.; Householder, J.E.; Piedade, M.T.F. Modeling of Regional- and Local-Scale Distribution of the Genus Montrichardia Crueg. (Araceae). Hydrobiologia 2017, 789, 45–57. [Google Scholar] [CrossRef]
  57. Peterson, A.T.; Papes, M.; Kluza, D.A. Predicting the Potential Invasive Distributions of Four Alien Plant Species in North America. Weed Sci. 2003, 51, 863–868. [Google Scholar] [CrossRef]
  58. Gillard, M.; Thiébaut, G.; Deleu, C.; Leroy, B. Present and Future Distribution of Three Aquatic Plants Taxa across the World: Decrease in Native and Increase in Invasive Ranges. Biol. Invasions 2017, 19, 2159–2170. [Google Scholar] [CrossRef]
  59. Gallardo, B.; Aldridge, D.C. The ‘Dirty Dozen’: Socio-Economic Factors Amplify the Invasion Potential of 12 High-Risk Aquatic Invasive Species in Great Britain and Ireland. J. Appl. Ecol. 2013, 50, 757–766. [Google Scholar] [CrossRef]
  60. Kelly, R.; Leach, K.; Cameron, A.; Maggs, C.A.; Reid, N. Combining Global Climate and Regional Landscape Models to Improve Prediction of Invasion Risk. Divers. Distrib. 2014, 20, 884–894. [Google Scholar] [CrossRef] [Green Version]
  61. Koncki, N.G.; Aronson, M.F.J. Invasion Risk in a Warmer World: Modeling Range Expansion and Habitat Preferences of Three Nonnative Aquatic Invasive Plants. Invasive Plant Sci. Manag 2015, 8, 436–449. [Google Scholar] [CrossRef] [Green Version]
  62. Williams, P.A.; Champion, P.; Council, N.R. Biological Success and Weediness of Existing Terrestrial Pest Plants and Aquatic Weeds in Northland; Land Care Research New Zealand Ltd.: Nelson, New Zealand, 2008; Volume 2008, pp. 51–52. [Google Scholar]
  63. Coetzee, J.A.; Hill, M.P.; Ruiz-Téllez, T.; Starfinger, U.; Brunel, S. Monographs on Invasive Plants in Europe N° 2: Eichhornia crassipes (Mart.) Solms. Bot. Lett. 2017, 164, 303–326. [Google Scholar] [CrossRef]
  64. Wang, C.-J.; Wan, J.-Z.; Qu, H.; Zhang, Z.-X. Climatic Niche Shift of Aquatic Plant Invaders between Native and Invasive Ranges: A Test Using 10 Species across Different Biomes on a Global Scale. Knowl. Manag. Aquat. Ecosyst. 2017, 27. [Google Scholar] [CrossRef] [Green Version]
  65. Lozano, V.; Brundu, G. Prioritisation of Aquatic Invasive Alien Plants in South America with the US Aquatic Weed Risk Assessment. Hydrobiologia 2018, 812, 115–130. [Google Scholar] [CrossRef]
  66. Brundu, G.; Armeli Minicante, S.; Barni, E.; Bolpagni, R.; Caddeo, A.; Celesti-Grapow, L.; Cogoni, A.; Galasso, G.; Iiriti, G.; Lazzaro, L.; et al. Managing Plant Invasions Using Legislation Tools: An Analysis of the National and Regional Regulations For Non-Native Plants in Italy. Ann. Bot. 2020, 10, 1–12. [Google Scholar] [CrossRef]
  67. Chamberlain, S.; Ram, K.; Hart, T. Spocc: R Interface to Many Species Occurrence Data Sources. R package version 1.1.0. 2020. Available online: https://CRAN.R-project.org/package=spocc (accessed on 31 July 2018).
  68. Lozano, V.; Chapman, D.; Brundu, G. Native and Non-Native Aquatic Plants of South America: Comparing and Integrating GBIF Records with Literature Data. Manag. Biol. Invasion 2017, 8, 443–454. [Google Scholar] [CrossRef] [Green Version]
  69. Jocou, A.I.; Fernández, C.; Gandullo, R. Macrófitas Acuáticas Vasculares Del Sistema de Drenaje Del Alto Valle de Río Negro, Patagonia (Argentina). Rev. Mus. Plata 2018, 3, 296–308. [Google Scholar] [CrossRef]
  70. Huaroto, B.D.W.R. Flora Vascular y Vegetación de los Humedales de Conococha, Ancash, Perú. Bachelor’s Thesis, Facultad de Ciencias Biológicas, Universidad Nacional Mayor De San Marcos, Lima, Peru, 2011. [Google Scholar]
  71. Fuentes, N.; Pauchard, A.; Sánchez, P.; Esquivel, J.; Marticorena, A. A New Comprehensive Database of Alien Plant Species in Chile Based on Herbarium Records. Biol. Invasions 2013, 15, 847–858. [Google Scholar] [CrossRef]
  72. Hussner, A. Long-Term Macrophyte Mapping Documents a Continuously Shift from Native to Non-Native Aquatic Plant Dominance in the Thermally Abnormal River Erft (North Rhine-Westphalia, Germany). Limnologica 2014, 48, 39–45. [Google Scholar] [CrossRef]
  73. Tanner, R.; Branquart, E.; Brundu, G.; Buholzer, S.; Chapman, D.; Ehret, P.; Fried, G.; Starfinger, U.; van Valkenburg, J. The Prioritisation of a Short List of Alien Plants for Risk Analysis within the Framework of the Regulation (EU) No. 1143/2014. Neobiota 2017, 35, 87–118. [Google Scholar] [CrossRef]
  74. Hussner, A.; Van De Weyer, K.; Gross, E.M.; Hilt, S. Comments on Increasing Number and Abundance of Non-Indigenous Aquatic Macrophyte Species in Germany: Non-Indigenous Aquatic Macrophytes in Germany. Weed Res. 2010, 50, 519–526. [Google Scholar] [CrossRef]
  75. EPPO Pest Risk Analysis for Pistia Stratiotes. 2017. Available online: https://pra.eppo.int/pra/675eccbf-c118-4132-a83f-29ac01a2ca1b (accessed on 13 February 2018).
  76. Domisch, S.; Amatulli, G.; Jetz, W. Near-Global Freshwater-Specific Environmental Variables for Biodiversity Analyses in 1 Km Resolution. Sci. Data 2015, 2, 150073. [Google Scholar] [CrossRef] [Green Version]
  77. Lehner, B.; Verdin, K.; Jarvis, A. New Global Hydrography Derived From Spaceborne Elevation Data. Eos Trans. 2008, 89, 93. [Google Scholar] [CrossRef]
  78. Hijmans, R.J.; Cameron, S.E.; Parra, J.L.; Jones, P.G.; Jarvis, A. Very High Resolution Interpolated Climate Surfaces for Global Land Areas. Int. J. Climatol. 2005, 25, 1965–1978. [Google Scholar] [CrossRef]
  79. Lehner, B.; Döll, P. Development and Validation of a Global Database of Lakes, Reservoirs and Wetlands. J. Hydrol. 2004, 296, 1–22. [Google Scholar] [CrossRef]
  80. Naimi, B.; Hamm, N.A.S.; Groen, T.A.; Skidmore, A.K.; Toxopeus, A.G. Where Is Positional Uncertainty a Problem for Species Distribution Modelling? Ecography 2014, 37, 191–203. [Google Scholar] [CrossRef]
  81. Babak, N. Uncertainty Analysis for Species Distribution Models. Package ‘Usdm’. 2017. Available online: https://CRAN.R-project.org/package=usdm (accessed on 25 June 2017).
  82. Chapman, D.; Pescott, O.L.; Roy, H.E.; Tanner, R. Improving Species Distribution Models for Invasive Non-native Species with Biologically Informed Pseudo-absence Selection. J. Biogeogr. 2019, 46, 1029–1040. [Google Scholar] [CrossRef] [Green Version]
  83. Barve, N.; Barve, V.; Jiménez-Valverde, A.; Lira-Noriega, A.; Maher, S.P.; Peterson, A.T.; Soberón, J.; Villalobos, F. The Crucial Role of the Accessible Area in Ecological Niche Modeling and Species Distribution Modeling. Ecol. Model. 2011, 222, 1810–1819. [Google Scholar] [CrossRef]
  84. Mainali, K.P.; Warren, D.L.; Dhileepan, K.; McConnachie, A.; Strathie, L.; Hassan, G.; Karki, D.; Shrestha, B.B.; Parmesan, C. Projecting Future Expansion of Invasive Species: Comparing and Improving Methodologies for Species Distribution Modeling. Glob. Change Biol. 2015, 21, 4464–4480. [Google Scholar] [CrossRef]
  85. Soberon, J.; Peterson, A.T. Interpretation of Models of Fundamental Ecological Niches and Species’ Distributional Areas. Biodiv. Inf. 2005, 2. [Google Scholar] [CrossRef] [Green Version]
  86. Owens, C.S.; Smart, R.M.; Stewart, R.M. Low Temperature Limits of Giant Salvinia. J. Aquat. Plant Manag. 2004, 42, 91–94. [Google Scholar]
  87. Wersal, R.; Baker, E.; Larson, J.; Dettloff, K.; Fusaro, A.; Thayer, D.; Pfingsten, I. Myriophyllum aquaticum (Vell.) Verdc. US Geological Survey, Nonindigenous Aquatic Species Database. U.S. Geological Survey: Gainesville, FL, USA. 2019. Available online: https://nas.er.usgs.gov/queries/FactSheet.aspx?speciesID=235 (accessed on 5 April 2018).
  88. Phillips, S.J.; Dudík, M.; Elith, J.; Graham, C.H.; Lehmann, A.; Leathwick, J.; Ferrier, S. Sample Selection Bias and Presence-Only Distribution Models: Implications for Background and Pseudo-Absence Data. Ecol. Appl. 2009, 19, 181–197. [Google Scholar] [CrossRef] [Green Version]
  89. Thuiller, W.; Georges, D.; Engler, R.; Breiner, F. Biomod2: Ensemble Platform for Species Distribution Modeling. 2020. Available online: https://CRAN.R-project.org/package=biomod2 (accessed on 26 February 2018).
  90. Manel, S.; Williams, H.C.; Ormerod, S.J. Evaluating Presence-Absence Models in Ecology: The Need to Account for Prevalence: Presence-Absence Modelling. J. Appl. Ecol. 2002, 38, 921–931. [Google Scholar] [CrossRef]
  91. Gallien, L.; Münkemüller, T.; Albert, C.H.; Boulangeat, I.; Thuiller, W. Predicting Potential Distributions of Invasive Species: Where to Go from Here?: Predicting Potential Distributions of Invasive Species. Divers. Distrib. 2010, 16, 331–342. [Google Scholar] [CrossRef]
  92. Chapman, D.S.; Makra, L.; Albertini, R.; Bonini, M.; Páldy, A.; Rodinkova, V.; Šikoparija, B.; Weryszko-Chmielewska, E.; Bullock, J.M. Modelling the Introduction and Spread of Non-Native Species: International Trade and Climate Change Drive Ragweed Invasion. Glob. Change Biol. 2016, 22, 3067–3079. [Google Scholar] [CrossRef] [PubMed]
  93. Reynolds, C.; Miranda, N.A.F.; Cumming, G.S. The Role of Waterbirds in the Dispersal of Aquatic Alien and Invasive Species. Divers. Distrib. 2015, 21, 744–754. [Google Scholar] [CrossRef] [Green Version]
  94. Clausen, P.; Nolet, B.A.; Fox, A.D.; Klaassen, M. Long-Distance Endozoochorous Dispersal of Submerged Macrophyte Seeds by Migratory Waterbirds in Northern Europe—A Critical Review of Possibilities and Limitations. Acta Oecol. 2002, 23, 191–203. [Google Scholar] [CrossRef]
  95. Hossain, K.; Yadav, S.; Quaik, S.; Pant, G.; Maruthi, A.Y.; Ismail, N. Vulnerabilities of Macrophytes Distribution Due to Climate Change. Theor. Appl. Climatol. 2017, 129, 1123–1132. [Google Scholar] [CrossRef]
  96. Téllez, T.R.; López, E.; Granado, G.; Pérez, E.; López, R.; Guzmán, J. The Water Hyacinth, Eichhornia Crassipes: An Invasive Plant in the Guadiana River Basin (Spain). Aquat. Invasions 2008, 3, 42–53. [Google Scholar] [CrossRef]
  97. Brundu, G.; Azzella, M.M.; Blasi, C.; Camarda, I.; Iberite, M.; Celesti-Grapow, L. The Silent Invasion of Eichhornia crassipes (Mart.) Solms. in Italy. Plant Biosyst. Int. J. Deal. Asp. Plant Biol. 2013, 147, 1120–1127. [Google Scholar] [CrossRef]
  98. Hussner, A.; Stiers, I.; Verhofstad, M.J.J.M.; Bakker, E.S.; Grutters, B.M.C.; Haury, J.; van Valkenburg, J.L.C.H.; Brundu, G.; Newman, J.; Clayton, J.S.; et al. Management and Control Methods of Invasive Alien Freshwater Aquatic Plants: A Review. Aquat. Bot. 2017, 136, 112–137. [Google Scholar] [CrossRef]
  99. Peterson, A.T.; Papeş, M.; Soberón, J. Rethinking Receiver Operating Characteristic Analysis Applications in Ecological Niche Modeling. Ecol. Model. 2008, 213, 63–72. [Google Scholar] [CrossRef]
  100. Zhu, G.; Gao, Y.; Zhu, L. Delimiting the Coastal Geographic Background to Predict Potential Distribution of Spartina alterniflora. Hydrobiologia 2013, 717, 177–187. [Google Scholar] [CrossRef]
  101. Feijoó, C.; García, M.E.; Momo, O.; Toja, J. Nutrient Absorption by the Submerged Macrophyte Egeria Dense Planch: Effect of Ammonium and Phosphorus Availability in the Water Column on Growth and Nutrient Uptake. Limnetica 2002, 2, 93–104. [Google Scholar]
  102. Hussner, A.; Meyer, C.; Busch, J. The Influence of Water Level and Nutrient Availability on Growth and Root System Development of Myriophyllum Aquaticum. Weed Res. 2009, 49, 73–80. [Google Scholar] [CrossRef]
  103. Jeppesen, E.; Kronvang, B.; Meerhoff, M.; Søndergaard, M.; Hansen, K.M.; Andersen, H.E.; Lauridsen, T.L.; Liboriussen, L.; Beklioglu, M.; Özen, A.; et al. Climate Change Effects on Runoff, Catchment Phosphorus Loading and Lake Ecological State, and Potential Adaptations. J. Environ. Qual. 2009, 38, 1930–1941. [Google Scholar] [CrossRef] [PubMed]
  104. Bornette, G.; Puijalon, S. Response of Aquatic Plants to Abiotic Factors: A Review. Aquat. Sci. 2011, 73, 1–14. [Google Scholar] [CrossRef]
  105. Heino, J.; Virkkala, R.; Toivonen, H. Climate Change and Freshwater Biodiversity: Detected Patterns, Future Trends and Adaptations in Northern Regions. Biol. Rev. 2009, 84, 39–54. [Google Scholar] [CrossRef] [PubMed]
  106. Kosten, S.; Kamarainen, A.; Jeppesen, E.; Van Nes, E.H.; Peeters, E.T.H.M.; Mazzeo, N.; Sass, L.; Hauxwell, J.; Hansel-Welch, N.; Lauridsen, T.L.; et al. Climate-Related Differences in the Dominance of Submerged Macrophytes in Shallow Lakes. Glob. Change Biol. 2009, 15, 2503–2517. [Google Scholar] [CrossRef]
  107. Yu, H.; Dong, X.; Yu, D.; Liu, C.; Fan, S. Effects of Eutrophication and Different Water Levels on Overwintering of Eichhornia Crassipes at the Northern Margin of Its Distribution in China. Front. Plant Sci. 2019, 10, 1261. [Google Scholar] [CrossRef] [PubMed]
  108. Huang, X.; Xu, X.; Liu, S.; Song, S.; Chang, S.; Liu, C.; Yu, D. Impact of Eutrophication on Root Morphological and Topological Performance in Free-Floating Invasive and Native Plant Species. Hydrobiologia 2019, 836, 123–139. [Google Scholar] [CrossRef]
  109. Zettlemoyer, M.A.; Schultheis, E.H.; Lau, J.A. Phenology in a Warming World: Differences between Native and Non-native Plant Species. Ecol. Lett. 2019, 22, 1253–1263. [Google Scholar] [CrossRef]
  110. Gritti, E.S.; Smith, B.; Sykes, M.T. Vulnerability of Mediterranean Basin Ecosystems to Climate Change and Invasion by Exotic Plant Species. J. Biogeogr. 2006, 33, 145–157. [Google Scholar] [CrossRef]
  111. Valverde, P.; Serralheiro, R.; de Carvalho, M.; Maia, R.; Oliveira, B.; Ramos, V. Climate Change Impacts on Irrigated Agriculture in the Guadiana River Basin (Portugal). Agric. Water Manag. 2015, 152, 17–30. [Google Scholar] [CrossRef] [Green Version]
  112. Hayhoe, K.; Wake, C.P.; Huntington, T.G.; Luo, L.; Schwartz, M.D.; Sheffield, J.; Wood, E.; Anderson, B.; Bradbury, J.; DeGaetano, A.; et al. Past and Future Changes in Climate and Hydrological Indicators in the US Northeast. Clim. Dyn. 2007, 28, 381–407. [Google Scholar] [CrossRef]
  113. Rooney, N.; Kalff, J. Inter-Annual Variation in Submerged Macrophyte Community Biomass and Distribution: The Influence of Temperature and Lake Morphometry. Aquat. Bot. 2000, 68, 321–335. [Google Scholar] [CrossRef]
  114. Johnson, T.B.; Evans, D.O. Size-dependent Winter Mortality of Young-of-the-year White Perch: Climate Warming and Invasion of the Laurentian Great Lakes. Trans. Am. Fish. Soc. 1990, 119, 301–313. [Google Scholar] [CrossRef]
  115. Alahuhta, J.; Ecke, F.; Johnson, L.B.; Sass, L.; Heino, J. A Comparative Analysis Reveals Little Evidence for Niche Conservatism in Aquatic Macrophytes among Four Areas on Two Continents. Oikos 2017, 126, 136–148. [Google Scholar] [CrossRef] [Green Version]
  116. Ackerly, D.D. Community Assembly, Niche Conservatism, and Adaptive Evolution in Changing Environments. Int. J. Plant Sci. 2003, 164, S165–S184. [Google Scholar] [CrossRef]
Figure 1. Distribution records of the five aquatic species that were modeled, plotted as white dots located inside the native range (red polygon) and in the invasive range for Egeria densa, Eichhornia crassipes, Myriophyllum aquaticum, Pistia stratiotes, and Salvinia molesta. Regions highlighted in orange are considered highly unsuitable for each of the five-investigated species and, therefore, included in the model background (pseudo-absences). Global maps exclude parts of the world that may be environmentally suitable, but are out of dispersal range (grey).
Ecologies 02 00003 g001
Figure 2. Global maps of projected suitability for Egeria densa, Eichhornia crassipes, Myriophyllum aquaticum, Pistia stratiotes, and Salvinia molesta. Establishment in the current climate. For enhancing visualization, the projection has been aggregated to a 0.25 × 0.25 degree resolution, by taking the maximum suitability of constituent higher resolution grid cells. The white areas located in North Africa have climatic conditions outside the range of the training data so were excluded from the projection.
Ecologies 02 00003 g002
Figure 3. Partial response plots for models fitted showing the predicted suitability. The thin colored lines show responses from the seven algorithms (generalized linear model (GLM): green; generalized boosting model (GBM): light blue; generalized additive model (GAM): orange; artificial neural network (ANN): yellow; flexible discriminant analysis (FDA): light brown; multivariate adaptive regression splines (MARS): purple; maximum entropy (MaxEnt): red), while the thick black line is the response of their ensemble. In each plot, other model variables are held at their median value in the training data.
Ecologies 02 00003 g003
Table 1. Hydroclimatic variables used to define the unsuitable conditions for establishment by the five study species. Values of the variables were defined based on a combination of prior biological knowledge about key constraints and the extreme values of environmental limits (i.e., growth, germination, and survival) for each species.
SpeciesHydro 6 (Mean Minimum Temperature during Coldest Month)Hydro 10 (Mean Temperature during Warmest Quarter)Hydro 18 (Precipitation of Warmest Quarter)
Egeria densa<−2 °C; stop growth at <6 degree but can survive at 1 degree under 15 cm of ice [62].>10 °C; growth is reported to commence [18]. It can survive in waters with temperatures of 3–35 °C [19].<4 mm; drought conditions could locally extirpate the species where water levels drop considerably [60].
Eichhornia crassipes<−3 °C; frost events limit its spread [63].>10 °C; limiting temperature for germination is 5–10 °C [63].<4 mm; germination occurs when substrates are exposed as water recedes and as dry substrates are moistened when water levels rise. Seeds survive in wet mud and are long-lived [63].
Myriophyllum aquaticum<−2 °C; growth and establishment may be curtailed subjected to icy or frosty conditions [18]. Tolerate freezing temperatures in California’s Bay [87].>10 °C; warm average temperature. Warmer temperatures enhance its capacity for establishment [87].<4 mm; precipitation driest month.
Pistia stratiotes<0 °C; prolonged exposure to lethal frosts [72].<0 °C; below the minimum growth temperature. Consistent with the temperature inhibiting seed germination [75].<5 mm; seasonal drying out of waterbodies may reduce suitability [75].
Salvinia molesta<0 °C; prolonged exposure to lethal frosts [86]. Buds are killed when exposed for more than two hours to temperatures below −3 °C.<10 °C; below the minimum growth temperature. <5 mm; seasonal drying out of waterbodies may reduce suitability [17].
Publisher’s Note: MDPI stays neutral with regard to jurisdictional claims in published maps and institutional affiliations.

