Article

Follow-Up of APSified–BMO-Based Retinal Microcirculation in Patients with Post-COVID-19 Syndrome

1
Department of Ophthalmology, Universitätsklinikum Erlangen, Friedrich-Alexander-Universität Erlangen-Nürnberg (FAU), 91054 Erlangen, Germany
2
Research Unit Analytical BioGeoChemistry, Helmholtz Zentrum München-German Research Center for Environmental Health, 85764 Neuherberg, Germany
3
Department of Internal Medicine 1, Universitätsklinikum Erlangen, Friedrich-Alexander-Universität Erlangen-Nürnberg (FAU), 91054 Erlangen, Germany
4
Infectious Diseases Section, Department of Internal Medicine 3, Rheumatology and Immunology, Universitätsklinikum Erlangen, Friedrich-Alexander-Universität Erlangen-Nürnberg (FAU), 91054 Erlangen, Germany
5
Deutsches Zentrum für Immuntherapie (DZI), Universitätsklinikum Erlangen, Friedrich-Alexander-Universität Erlangen-Nürnberg (FAU), 91054 Erlangen, Germany
*
Authors to whom correspondence should be addressed.
These authors contributed equally to this work.
Biophysica 2025, 5(4), 46; https://doi.org/10.3390/biophysica5040046
Submission received: 8 August 2025 / Revised: 7 October 2025 / Accepted: 12 October 2025 / Published: 16 October 2025

Abstract

Post-COVID-19 syndrome (PCS) is a multifactorial disorder comprising different subgroups. Our study aimed to investigate the longitudinal changes in retinal microcirculation in PCS patients. Eighty PCS patients were recruited at the Department of Ophthalmology at the Friedrich-Alexander University of Erlangen-Nürnberg. Retinal microcirculation was measured twice using optical coherence tomography angiography (OCT-A) within the superficial vascular plexus (SVP), intermediate capillary plexus (ICP), deep capillary plexus (DCP), and peripapillary region. Vessel density (VD) was calculated using the Erlangen Angio Tool with an APSified and Bruch’s membrane opening-based analyses. The least-squares means (LS-Means) of VD were 30.4 (SE = 0.168) vs. 30.3 (SE = 0.166) (SVP), 22.4 (SE = 0.143) vs. 22.2 (SE = 0.141) (ICP), 23.9 (SE = 0.186) vs. 23.8 (SE = 0.185) (DCP), and 27.4 (SE = 0.226) vs. 27.0 (SE = 0.224) (peripapillary) in patients with PCS at visits 1 and 2, respectively. The study cohort showed physically stable PCS symptoms with PEM/fatigue and concentration disorders as major symptoms and only a slight, clinically irrelevant improvement of the Bell Score. The multivariate longitudinal model confirmed the clinical observations by showing that VD did not change significantly during follow-up (p = 0.46). Strong interdependencies between the macular layers (p < 0.001) were observed. The data of the present study suggests that while overall APSified macular VD and BMO-based APSified peripapillary VD were stable within a PCS cohort of physically stable PCS symptoms, individual patients may experience coordinated microvascular changes, particularly within the macular plexuses. Together, the results support a model of heterogeneous yet biologically consistent microvascular response in PCS pathophysiology.

1. Introduction

Severe acute respiratory syndrome coronavirus 2 (SARS-CoV-2) induced acute coronavirus disease 2019 (COVID-19), with a total of over 777 million registered infections [1]. In addition, long-term consequences, known as post-COVID-19 syndrome (PCS), long COVID-19 (LC), or Post-Acute Sequelae of SARS-CoV-2 Infection (PASC), were reported. PCS is defined as a clinical phenotype with persisting or novel symptoms lasting more than 12 weeks after acute COVID-19 [2]. The prevalence of PCS varies greatly, ranging from 1.8 to 56.9%, depending on, e.g., vaccination status or severity of acute COVID-19 [3]. It is known that PCS can be ameliorated over time in a subset of patients, yet there is a subgroup that still experiences clinical, even partially worsened symptoms more than two years after acute infection [2].
PCS symptoms are diverse, including, e.g., fatigue, post-exertional malaise (PEM), and cardiac or neurological effects. The severity varies from mild restrictions to severe impairments, disrupting daily life and participation in social life. In addition to the individual burden, PCS critically affects national healthcare systems and even the economy [4]. Diagnosis and treatment of PCS are still challenging due to the lack of established objective biomarkers and the lack of causal therapy. The treatment is actually symptom-oriented, involving multidisciplinary approaches (e.g., supportive and rehabilitative care). The presence of PEM makes common therapy attempts, such as rehabilitation with physiotherapy, more challenging and complex [5].
The pathogenesis of PCS remains unclear. Multiple pathways interact in the complex pathophysiology. Viral persistence, persistent tissue damage, impaired microcirculation, and hypercoagulation with endothelial dysfunction (ED), autoimmune dysfunction, or reactivation of other persistent viruses (e.g., Epstein–Barr virus) have been hypothesized as important pathogenic factors [3]. The virus enters cells via the angiotensin-converting enzyme 2 (ACE2), which is a key enzyme of the renin–angiotensin–aldosterone system (RAAS) pathway and is expressed in the lungs, blood vessels, and other organs, including the retina [6]. Infected cells are damaged either directly by the virus itself or indirectly by the host immune response. When endothelial cells are affected by the virus, the induced apoptosis leads to increased endothelial inflammation, risk of immunethrombosis, and hypercoagulation, with consequently impaired microcirculation [7]. If these molecular alterations persist, chronic immune dysregulation and inflammation may cause ED and further intensify impaired microcirculation [8]. Replication-competent viral remnants may continuously stimulate the immune system and contribute to chronic inflammation [3].
The eye, often referred to as the “window to the body”, offers a non-invasive in vivo method to visualize retinochoroidal microcirculation via optical coherence tomography angiography (OCT-A) [9]. It is assumed that the retinal capillary vessels mirror the systemic microcirculation, as already shown in recent studies of PCS [10,11,12] and other systemic disorders [13,14]. Previous analyses of vessel density (VD) in patients with PCS have shown that retinal microcirculation, particularly in the intermediate capillary plexus (ICP), can be impaired [10,15,16]. As VD was observed to improve following a causal treatment attempt in a patient with PCS [17], these data support the role of the restricted microcirculation, as mapped by OCT-A, in the pathogenesis of PCS. To date, fewer studies have investigated retinal microcirculation in PCS over time [18,19,20]. Tracking potential changes is clinically important, as this could offer a non-invasive diagnostic tool. The aim of the present study was to investigate longitudinal changes in retinal microcirculation using OCT-A in patients with PCS.

2. Materials and Methods

2.1. Participants

The study was designed as a prospective, observational, unblinded, single-center study, conducted at the Department of Ophthalmology, Friedrich-Alexander University Erlangen-Nürnberg (FAU). A total of eighty (80) patients with PCS were recruited. SARS-CoV-2 infection was confirmed by reverse transcription polymerase chain reaction (PCR). The participants had a mild to moderate disease course without hospitalization. PCS was defined as the persistence of symptoms for more than 12 weeks after acute infection, according to the S1 Guideline [2]. Exclusion criteria included age under 18, pregnancy, epilepsy, and other systemic or ocular disorders affecting the retina. Demographic data are summarized in Table 1.
Medical histories and self-reported symptoms were recorded via interviews. Self-reported fatigue was assessed by the Bell Score. The Bell Score ranges from 0 to 100 (0 = worst; 100 = best) in increments of 10 to assess disability in myalgic encephalomyelitis/chronic fatigue syndrome (ME/CFS), and it is also applied to patients with PCS. Best-corrected visual acuity (BCVA) was measured using a Snellen chart, intraocular pressure (IOP) was assessed, and axial length was determined using an IOLMaster (Carl Zeiss Meditec, Oberkochen, Germany). Study participants attended two visits (baseline, visit1; follow-up, visit2). The duration since PCS onset was 303.72 ± 115.88 days at visit1. The mean follow-up interval was 278.42 ± 65.84 days. Each patient was informed and signed a declaration of consent in accordance with the guidelines of the Declaration of Helsinki. The study was approved by the local ethics committee.

2.2. Optical Coherence Tomography Angiography (OCT-A)

En face OCT-A scans of the macula and peripapillary region were performed using the Spectralis II optical coherence tomography angiography (OCT-A) system (Heidelberg Engineering, Heidelberg, Germany). OCT-A visualizes blood flow by repeatedly acquiring scans at the same physical position and measuring changes in the speckle pattern caused by moving objects. This signal is converted into a binary code (white = moving objects; black = static objects). The ratio of white to black signals is referred to as vessel density (VD). Retinal scans were subdivided into three macular layers, namely the superficial vascular plexus (SVP), intermediate capillary plexus (ICP), and deep capillary plexus (DCP), and one peripapillary scan.
The scan angle was 15° × 15°, with a lateral resolution of 5.7 µm/pixel, and the diameter of the ring was 0.8 mm. The scan area was 2.9 mm × 2.9 mm (total area: 8.41 mm2). OCTA en face projections of the SVP, ICP, DCP, and peripapillary region were automatically segmented and computed using the manufacturer’s software (Heidelberg Eye Explorer, version 1.12.1.0) (Figure 1). The SVP is delimited by the retinal nerve fiber layer (RNFL) and the inner plexiform layer (IPL [−]) segmentation boundaries. IPL [−] defines an anterior offset of −17 μm to the lower boundary of the inner plexiform layer. The ICP is delimited by the IPL [−] and IPL [+] segmentation boundaries. IPL [+] defines a posterior offset of +22 μm to the lower boundary of the inner plexiform layer. The DCP is delimited by the IPL [+] and the outer plexiform layer (OPL) segmentation boundaries. The correlation of the Spectralis II OCT-A plexuses to anatomical boundaries has been described previously [21]. All images were visually reviewed by an ophthalmology expert, and those that the expert considered to be of insufficient quality for routine clinical use were excluded. No quantitative metric was applied. The data were exported using SP-X1902 software (prototype software, version 6.12.4.710; Heidelberg Engineering, Heidelberg, Germany). The Anatomical Positioning System (APS; part of Glaucoma Module Premium Edition [GMPE], Heidelberg Engineering, Heidelberg, Germany) was implemented, enabling a precise alignment of OCT-A scans to each individual fovea-to-Bruch’s membrane opening center (FoBMOC) axis, a process referred to as “APS-ified”. In addition, peripapillary VD was calculated, based on BMO landmarks (BMO-based peripapillary VD), accurately defining the optic nerve head boundary. The scans were analyzed using the Erlangen-Angio-Tool (EA Tool; version 3.0; Matlab, R2017b The MathWorks, Inc., Natick, MA, USA), which provides high reproducibility and reliability for VD quantification [9].

2.3. Statistical Methods

For the analysis, all 12 sectors of the 4 plexuses (SVP, ICP, DCP, and peripapillary region) were used. The mixed-effects model was structured so that each patient had multiple measurements over time and for each eye, with gender and age as covariates. The patient’s eyes were included as a nested random effect. This accounts for individual differences and the fact that each patient can have different measurements for their left and right eyes. Additionally, we inserted a correlation structure (defined as corAR1) into the models. Then, the model effectively handled the repeated measures for each eye of a patient, acknowledging that data points from the same eye and patient were related. The models were applied to understand how different factors, such as PCS and age, affect the outcome variables (SVP, ICP, DCP, and peripapillary region). For analysis, we involved the measurements taken at subsequent time points to detect any changes over time. For the follow-up analysis, we separated the different sources of variability. This means that we separated the variability in measurements due to the fixed effects (class age) from the variability due to individual differences (random effects) and the repeated nature of the data. This approach improves accuracy, giving more accurate estimates of the effects of gender and age by accounting for the hierarchical structure of the data.
To investigate differences in VD across retinal layers and visits, a linear mixed-effects model was implemented. VD measurements were first averaged per eye, visit, and layer using group-wise summarization. The resulting dataset was used to fit a model with fixed effects for visit, retinal layer, gender, and age and a nested random effect for retinal layer within each patient to account for repeated measurements. No correlation structure was specified, as the data represented collapsed per-visit observations. All pairwise comparisons between layers were conducted using Tukey’s method to control for multiple testing. In all analyses, the p-value denotes the probability, under the null hypothesis for the tested effect, of observing a result at least as extreme as the one estimated; a smaller p-value indicates weaker compatibility between the observed data and the null model, but it is not the probability that the null hypothesis is true. A two-sided significance level of α = 0.05 was applied.
To quantify associations between continuous variables, Pearson correlation coefficients were computed. For two variables, x and y, the coefficient was defined as
r = Σ = 1 n x i x ¯ y i y ¯ Σ = 1 n x i x ¯ 2 Σ = 1 n y i y ¯ 2
Changes in the Bell Score and other clinical symptom ratings between baseline and follow-up were evaluated using the Wilcoxon signed-rank test with continuity correction. For each subject, paired differences between baseline and follow-up were ranked by absolute value, with ranks carrying the sign of the difference. The test statistic was the sum of signed ranks, which under the null hypothesis of no change approximates a normal distribution after applying a continuity correction. Two-sided p-values were calculated, with statistical significance defined at α = 0.05.
To visualize the distribution of VD values across layers, raincloud plots were generated. These plots combine half-violin plots (to show kernel density), boxplots (to display interquartile ranges), and jittered points (to represent individual eyes). Additionally, LS-Means for each layer at both visits were visualized using line plots with 95% confidence intervals, allowing comparison of model-predicted means over time. Additionally, the pairwise scatterplots and correlation coefficients were visualized to detect changes in retinal vessel density (ΔVD),
ΔVD = VDfollow-up − VDbaseline
across four vascular layers in PCS patients. All statistical analyses were performed in R (version R 4.3.2, R Foundation for Statistical Computing, Vienna, Austria) using RStudio (version 2023.09.1, Posit Software, Boston, MA, USA) as the integrated development environment. The following R packages were used: nlme, lme4, lmerTest, emmeans, ggplot2, and raincloudplots for the final data visualization, including raincloud and line plots.

3. Results

The major clinical symptoms of patients with PCS at visit1 were fatigue/PEM (94.74%), concentration disorders (93.75%), problems with psychological resilience (77.33%), muscle pain (73.08%), perception of tachycardia/brachycardia (63.75%), cold extremities (51.25%), paraesthesia in the extremities (58.44%), pain in joints (56.41%), dizziness (51.25%), and gastrointestinal complaints (44.16%). The Bell Score was 40.0 ± 18.00 at visit1. At follow-up (visit2), major clinical symptoms were fatigue/PEM (91.14%), concentration disorder (88.61%), perception of tachycardia/brachycardia (58.23%), muscle pain (69.62%), paraesthesia in the extremities (64.56%), problems with psychological resilience (58.23%), cold extremities (56.96%), pain in joints (54.43%), dizziness (44.3%), and gastrointestinal complaints (43.04%). The mean Bell Score at visit2 was 43.75 ± 19.70. In summary, the present study cohort comprises patients with PCS, showing PEM/fatigue and concentration disorders as major symptoms. PEM/fatigue was graded with a Bell Score of 40, representing a physical status of 50–70% of normal with moderate symptoms at rest and moderate to severe symptoms during exertion or activity. These major clinical symptoms remained stable throughout follow-up.
The Wilcoxon signed-rank test with continuity correction showed a slight, significant improvement in the Bell Score (p = 0.01595), yet the improvement did not reach the next Bell Score threshold of 50. All clinical symptoms showed no significant changes over the follow-up period (p > 0.05), except for “problems with psychological resilience” (p = 0.002). Thus, a PCS cohort with PEM/fatigue and concentration disorders with most likely clinically stable symptoms can be assumed.
The overall LS-Mean of the VD of the SVP, ICP, DCP, and peripapillary region of patients with PCS can be seen in Table 2 for baseline (visit1) and follow-up (visit2).
The multivariate longitudinal model confirmed that there were no significant overall changes in VD across the two visits (p = 0.46) and no significant visit × layer interactions. However, strong fixed effects for retinal layer were observed, confirming known anatomical differences in baseline VD values (Table 3). Age was a significant negative predictor, aligning with established vascular aging effects (Table 3).
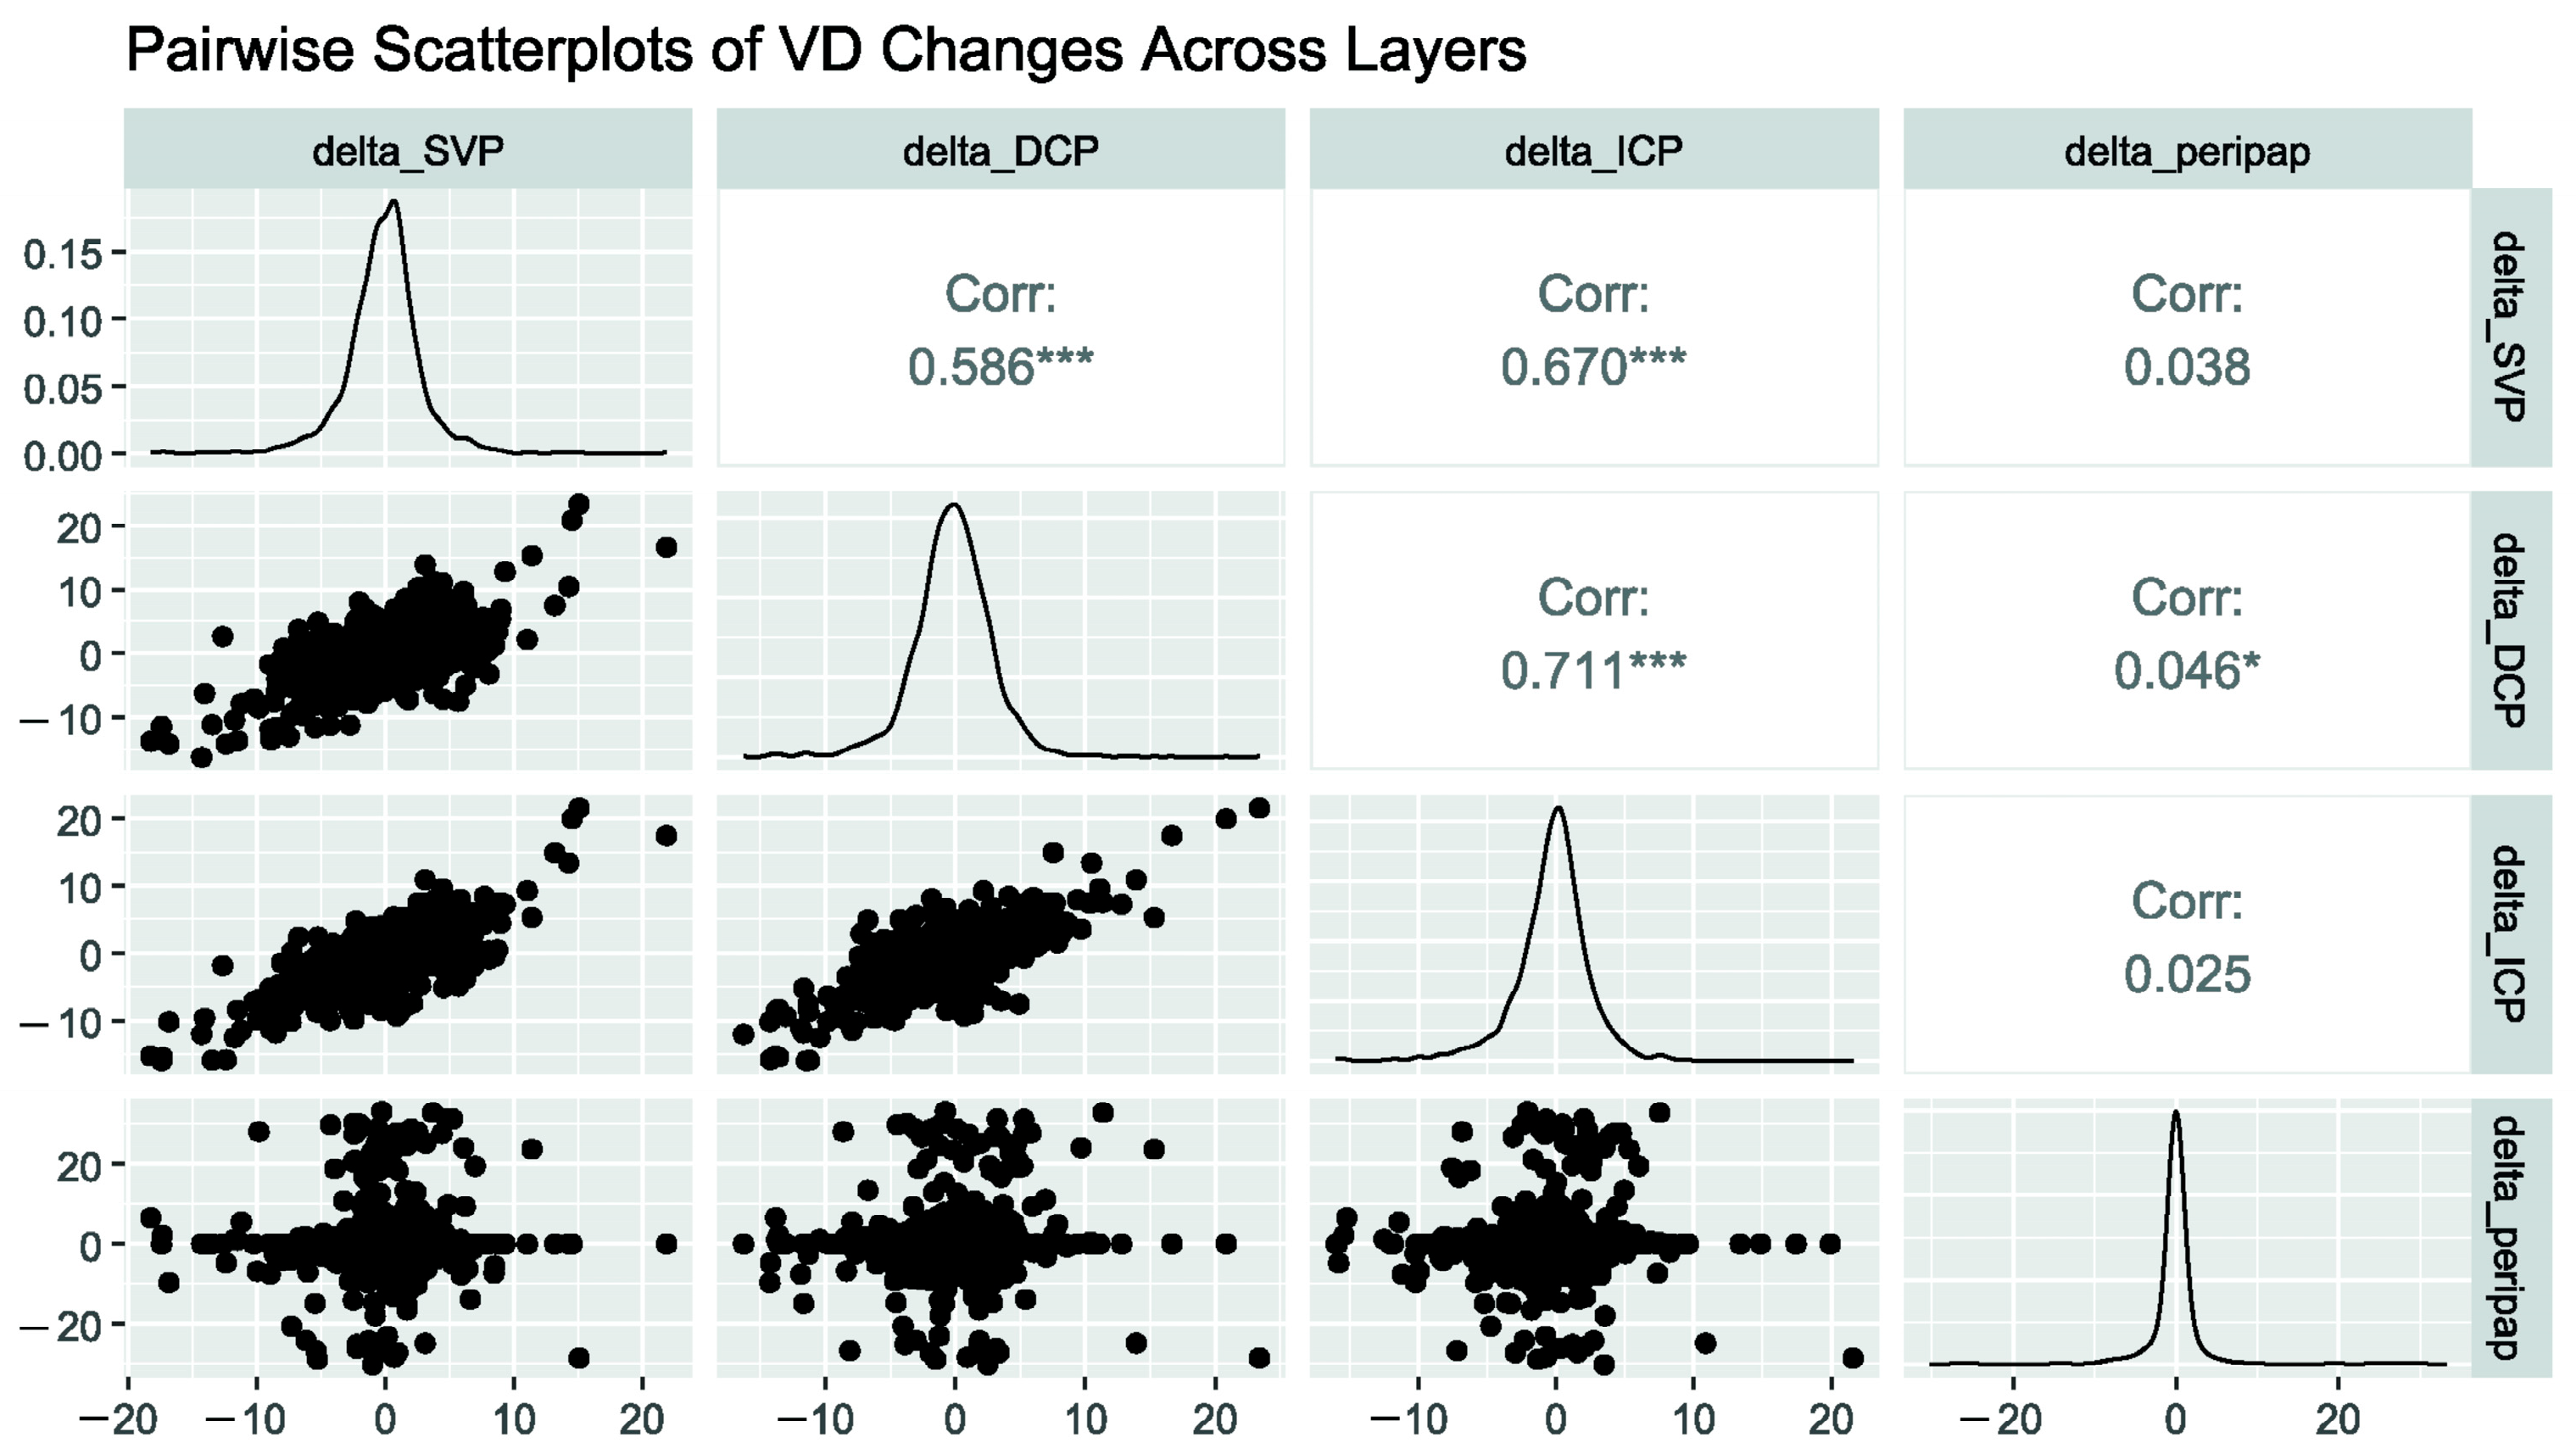
To explore interlayer microvascular dynamics in PCS, pairwise correlations between VD changes across retinal vascular layers were assessed. The ΔVD for each vascular layer was calculated as the difference between visit2 and visit1. As shown in Figure 2, changes in deep capillary plexus (ΔDCP) were strongly correlated with changes in the intermediate (ΔICP; r = 0.711, p < 0.001) and superficial (ΔSVP; r = 0.586, p < 0.001) plexuses. Similarly, ΔICP and ΔSVP were also significantly correlated (r = 0.670, p < 0.001). These findings indicate a coordinated pattern of microvascular alterations in the macular region. In contrast, changes in peripapillary VD were only weakly associated with macular plexuses (r < 0.05), suggesting that peripapillary and macular vascular beds may be differentially affected in PCS pathophysiology. The results of the overall VD analysis align with the correlation analysis of ΔVD values, which revealed strong interdependencies between macular layers (SVP, DCP, ICP), despite no overall visit-related change. This suggests that while group-level progression may not be detectable, individual patients may experience coordinated microvascular changes, particularly within the macular plexuses.
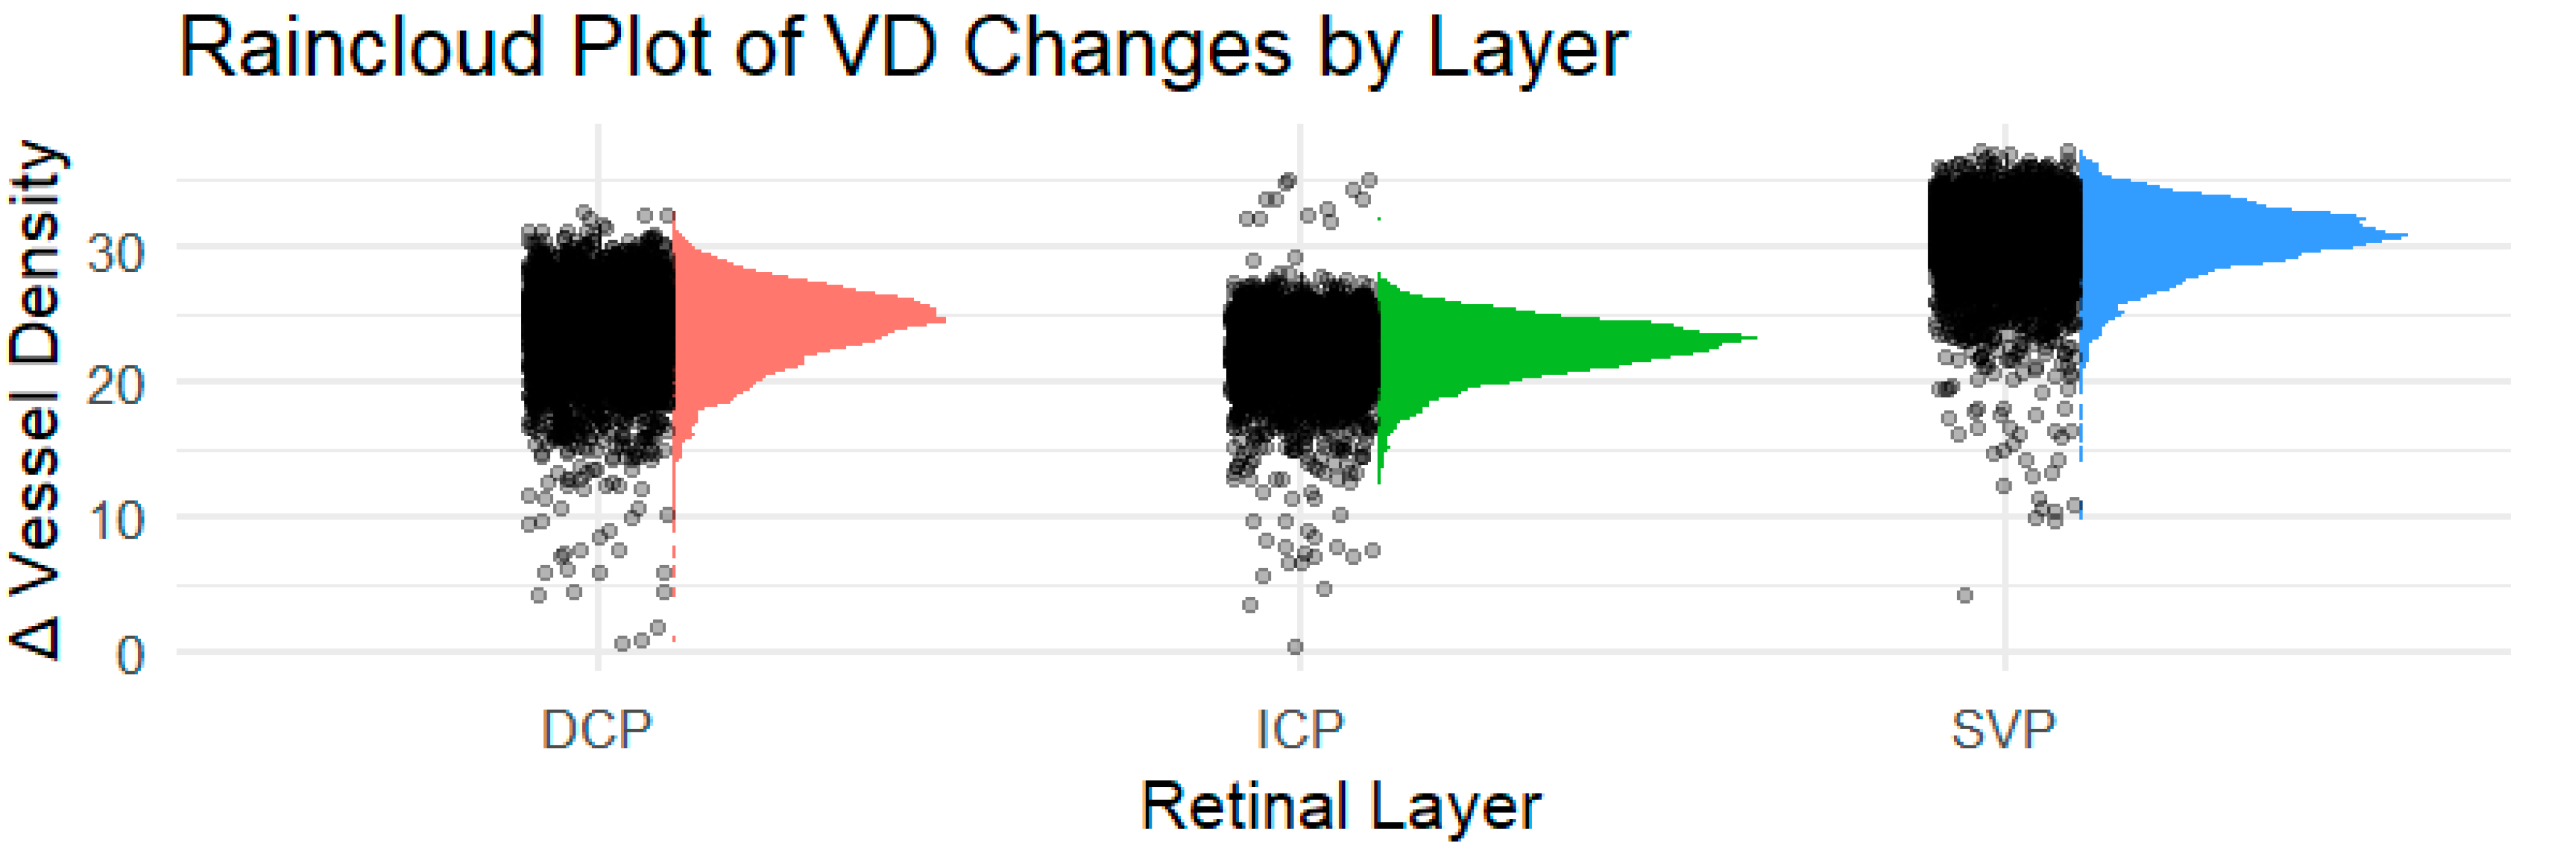
To visualize the distribution and variability of VD changes across the macular layers, a raincloud plot was included (Figure 3). This plot combines jittered individual data points, boxplots, and half-violin plots to depict both individual variation and group-level trends. The raincloud plot showed overlapping distributions for the changes in the SVP, ICP, and DCP, visually supporting the statistical findings of correlated but non-significant change in VD over time. It emphasizes the extent of interindividual variability while maintaining clarity regarding layer-specific anatomical characteristics.

4. Discussion

Although the COVID-19 pandemic ended in 2023, PCS is still challenging individuals, national healthcare systems, and economies. Its diagnosis is based on self-reported ongoing clinical symptoms after acute COVID-19 and exclusion of other known disorders. As PCS encompasses different molecular features and different clinical phenotypes, distinct subgroups of patients can be assumed. One of them was observed to show a restricted capillary microcirculation. It is hypothesized that, among other factors, endothelial dysfunction (ED), the formation of microclotting, and altered blood rheology interact, consequently leading to ischemia–reperfusion damage [22,23,24].
Capillary microcirculation can be visualized and quantified non-invasively by OCT-A mapping of the macular and peripapillary region. As recent data showed a reduced macula and peripapillary VD in patients with PCS, it was the aim of the present study to monitor VD in patients with PCS longitudinally. The results of the present study showed that physically stable PCS symptoms are mirrored within the VD of the retina, based on an individualized, BMO-based, APSified adapted VD analysis. Of interest, a strong interlayer capillary interaction was observed, suggesting a coordinated microvascular response in PCS: the vessel density changes (ΔVD) show strong correlations among the three retinal plexuses (SVP, ICP, and DCP), while their correlations with the peripapillary region are weak. This result could be caused by the anatomy of the different blood supply to the macula and ONH, which are supplied by the central retinal artery and the posterior ciliary arteries [25]. Additionally, the blood flow of the ONH is autoregulated by local mechanisms like endothelial cells, myogenic factors, and vascular smooth muscle cells, leading to the presumption that there is no common central control mechanism for the retina and ONH circulation [26]. As this correlation of VD changes was observed within the macular region but not in the peripapillary area, further research is necessary to elucidate this potential pathomechanistic feature.
OCT-A is a relatively new imaging technique based on OCT, enabling fast, high-resolution, non-invasive, dye-free, in vivo visualization of the vascular layers and choroid [27,28]. By sending out fast repeated laser light, which is reflected by the ocular tissue, the detected signal is processed into a binary image of the retina, depending on moving particles (like red blood cells (RBCs)) in contrast to the non-moving tissue [29]. OCT-A is already used for diagnosis and monitoring of ocular and systemic diseases like diabetic retinopathy, age-related macular degeneration, and glaucoma and neurodegenerative diseases like Alzheimer’s dementia [27]. A high to excellent reliability and reproducibility were observed for OCTA-A scans of the Spectralis OCT II, combined with the semiautomated EA-analysis tool [9]. With the implementation of the Anatomical Positioning System and BMO landmarks in the analysis software, the present study offers individually adapted longitudinal VD data in patients with PCS for the first time. The data of the present study showed that patients with physically stable PCS symptoms showed unchanged retinal VD, based on an individual BMO-based, APSified adapted VD analysis. It would be of interest for further studies—including different PCS patients’ groups with different follow-ups (different duration, patients with worsening of their symptoms)—to investigate whether changes in VD are associated with self-reported disease severity.
A comparison of the present study with other long-term studies in PCS is challenging due to varying patient cohorts, different devices with varying layer segmentations, differing scan sizes (between 3 × 3 mm2 and 6 × 6 mm2) [12], which affect resolution [28], and the use of different image analysis software (Table 4).
The data of the present study support a distinct and strong interaction of the capillary network within the retina in patients with PCS. With regard to the structure and anatomy of the retina, it is essential to consider that the SVP is a network of both large and small vessels directly connected to the retinal arteries and veins, which supply both the ICP and DCP [36]. The SVP contains the ganglion cell layer (GCL) and parts of the IPL, the ICP is embedded within the IPL and inner nuclear layer (INL), and the DCP surrounds the INL and the OPL [15]. The ICP and DCP consist of uniform capillaries, representing an end-artery capillary network without anastomotic connections [36]. It can be hypothesized that, despite the ICP’s vascular-rich nature and its high metabolic demands, it is more vulnerable to conditions such as inflammation, thrombosis, or retinal hypoxia due to the absence of anastomotic connections [20,37]. Correlations between the different retinal plexuses are not unique to PCS. They are well-known features in healthy and diseased eyes (e.g., diabetes [38]). While these correlations suggest coordinated microvascular dynamics, their clinical significance in PCS is not fully elucidated. It would be of interest to compare retinal characteristics of different disorders (e.g., glaucoma and PCS) to gain deeper insight into their potential pathophysiological relevance.
Although most studies investigating PCS with OCT-A scans used the more common segmentation of the retina into the SVP and DCP, there is histological evidence that indicates the presence of four vascular plexuses [39]. Since these findings were made, studies have been able to distinguish the ICP from the SVP and DCP in OCT-A [40] in both qualitative and functional terms. Several studies highlight the relevance of measuring the ICP: Schlick et al. observed significantly lower VD in the ICP in PCS patients compared to their controls, including a gender effect with women having lower VD in the SVP compared to males [16]. Szewczykowski et al. showed a significant reduction in the SVP, ICP, DCP, and peripapillary region 200 days after infection [10]. Hohberger et al. also found a significant reduction in the ICP in PCS patients [15]. One study measured the vessel area density (VAD) of the ICP with relevant reductions in the ICP and DCP in patients who recovered from COVID-19. However, the investigation period and the presence of PCS were not taken into account [37]. The ICP, inhabiting the inner nuclear layer, contains the COVID-19-targeted ACE2 [31,41]. The virus binds with high affinity via the spike protein to ACE2 receptors, which are most expressed in the endothelium, leading to ACE2 downregulation and, by this, to angiotensin II increase, promoting vasoconstriction, inflammation, endothelial dysfunction, and microthrombosis. The use of an increased subdivision of the retina into the SVP, ICP, and DCP could be advantageous in order to obtain a more differentiated analysis and avoid any potential masking of the ICP’s affection by the adjacent SVP or DCP, as is often observed in current studies.
The present study is not without limitations. Longitudinal follow-up was about 9 months; thus, potential long-term (>several years) changes will not be quantified within the present analysis. In addition, the study cohort showed a stable physical phenotype with PEM/fatigue and concentration disorders as major persistent symptoms. It would be of interest if a different group of PCS patients, with a different major symptom, would yield similar results.

5. Conclusions

The data of the present study showed that overall APSified macular VD and BMO-based APSified peripapillary VD were stable within a PCS cohort of physically stable PCS symptoms. The APSified BMO-based VD analysis seemed to mirror the clinical physical symptoms in a patient cohort with PEM/fatigue and concentration disorders as major symptoms. As strong intercapillary correlations were observed within the macular plexus, the results support a model of a heterogeneous yet biologically consistent microvascular response in this PCS subtype.

Author Contributions

Conceptualization, C.M. and B.H.; methodology, M.L., C.M., M.G., T.H. and B.H.; validation, B.H.; formal analysis, M.L. and S.Z.; investigation: C.R., J.H., C.S., T.S., F.R., D.A. and J.S.; resources, B.H.; data curation, C.R. and J.S.; writing—original draft preparation, C.R., M.L. and B.H.; writing—review and editing, C.R., M.L., M.F., P.L. and B.H.; visualization, C.R., M.L. and B.H.; supervision, B.H. and C.M.; project administration, P.L. and B.H.; funding acquisition, B.H. All authors have read and agreed to the published version of the manuscript.

Funding

The present study was funded by the German Federal Ministry of Research, Technology and Space (BMFTR): reCOVer (01EP2108A) and iIMMUNE_ACS (01EO2105). The funders had no role in the design of the study; in the collection, analyses, or interpretation of data; in the writing of the manuscript; or in the decision to publish the results.

Institutional Review Board Statement

The studies involving human participants were reviewed and approved by the ethics committee of the University of Erlangen-Nürnberg (Approval Code: 295_20 B; Approval Date: 18 August 2020).

Informed Consent Statement

The patients/participants provided their written informed consent to participate in this study.

Data Availability Statement

The datasets generated and/or analyzed during the current study are available from the corresponding author on reasonable request.

Acknowledgments

The present work was performed in fulfillment of the requirements for obtaining the degree Dr. med. dent. for C.R. The Department of Ophthalmology is part of the Universitaät of Erlangen-Nürnberg, Friedrich-Alexander-Universität Erlangen-Nürnberg (FAU), Germany.

Conflicts of Interest

B.H. and C.M.: Heidelberg engineering. The funders had no role in the design of the study; in the collection, analyses, or interpretation of data; in the writing of the manuscript; or in the decision to publish the results.

Abbreviations

ACE2Angiotensin-converting enzyme 2
BCVABest-corrected visual acuity
BMOBruch’s membrane opening
COVID-19Coronavirus disease 2019
DCPDeep capillary plexus
EDEndothelial dysfunction
FoBMOCFovea-to-Bruch’s membrane opening center
GCLGanglion cell layer
ICPIntermediate capillary plexus
INLInner nuclear layer
IOPIntraocular pressure
IPLInner plexiform layer
LCLong COVID-19 syndrome
LS-MeanLeast-squares mean
ME/CFSMyalgic encephalomyelitis/chronic fatigue syndrome
OPLOuter plexiform layer
PASCPost-Acute Sequelae of SARS-CoV-2 Infection
PCSPost-COVID-19 syndrome
PCRReverse transcription polymerase chain reaction
PEMPost-exertional malaise
POTSPostural orthostatic tachycardia syndrome
RAASRenin–angiotensin–aldosterone system

References

  1. World Health Organization (WHO). Coronavirus (COVID-19) Dashboard. 2025. Available online: https://data.who.int/dashboards/covid19/cases?n=c (accessed on 3 October 2025).
  2. Koczulla, A.R.; Ankermann, T.; Behrends, U.; Böing, S.; Berlit, P.; Brinkmann, F.; Franke, C.; Glöckl, R.; Gogoll, C.; Hummel, T.; et al. S1-Leitlinie Long/Post-COVID—Living Guideline. Pneumologie 2024, 75, 869–900. [Google Scholar]
  3. Greenhalgh, T.; Sivan, M.; Perlowski, A.; Nikolich, J. Long COVID: A clinical update. Lancet 2024, 404, 10453. [Google Scholar] [CrossRef]
  4. Jamies Daniell, J.B.; Paessler, D.; Heydecke, J.; Schoening, S.; McLennan, A. The rising cost of Long COVID and ME/CFS in Germany. 2025. Available online: https://mecfs-research.org/wp-content/uploads/2025/05/The-rising-cost-of-Long-COVID-and-MECFS-in-Germany.pdf (accessed on 15 June 2025).
  5. Frommhold, J.S.P.O. Post-COVID-Syndrom und Long-COVID Diagnostik, Therapie und Verlauf; Medizinisch Wissenschaftliche Verlagsgesellschaft: Berlin, Germany, 2023. [Google Scholar]
  6. Casagrande, M.; Fitzek, A.; Püschel, K.; Aleshcheva, G.; Schultheiss, H.-P.; Berneking, L.; Spitzer, M.S.; Schultheiss, M. Detection of SARS-CoV-2 in Human Retinal Biopsies of Deceased COVID-19 Patients. Ocul. Immunol. Inflamm. 2020, 28, 721–725. [Google Scholar] [CrossRef] [PubMed]
  7. Bonaventura, A.; Vecchié, A.; Dagna, L.; Martinod, K.; Dixon, D.L.; Van Tassell, B.W.; Dentali, F.; Montecucco, F.; Massberg, S.; Levi, M.; et al. Endothelial dysfunction and immunothrombosis as key pathogenic mechanisms in COVID-19. Nat. Rev. Immunol. 2021, 21, 319–329. [Google Scholar] [CrossRef]
  8. Davis, H.E.; McCorkell, L.; Vogel, J.M.; Topol, E.J. Long COVID: Major findings, mechanisms and recommendations. Nat. Rev. Microbiol. 2023, 21, 133–146. [Google Scholar] [CrossRef] [PubMed]
  9. Hosari, S.; Hohberger, B.; Theelke, L.; Sari, H.; Lucio, M.; Mardin, C.Y. OCT Angiography: Measurement of Retinal Macular Microvasculature with Spectralis II OCT Angiography—Reliability and Reproducibility. Ophthalmologica 2020, 243, 75–84. [Google Scholar] [CrossRef] [PubMed]
  10. Szewczykowski, C.; Mardin, C.; Lucio, M.; Wallukat, G.; Hoffmanns, J.; Schröder, T.; Raith, F.; Rogge, L.; Heltmann, F.; Moritz, M.; et al. Long COVID: Association of Functional Autoantibodies against G-Protein-Coupled Receptors with an Impaired Retinal Microcirculation. Int. J. Mol. Sci. 2022, 23, 7209. [Google Scholar] [CrossRef] [PubMed]
  11. Cennamo, G.; Reibaldi, M.; Montorio, D.; D′ANdrea, L.; Fallico, M.; Triassi, M. Optical Coherence Tomography Angiography Features in Post-COVID-19 Pneumonia Patients: A Pilot Study. Arch. Ophthalmol. 2021, 227, 182–190. [Google Scholar] [CrossRef] [PubMed]
  12. Jerratsch, H.; Beuse, A.; Spitzer, M.S.; Grohmann, C. The Current Status of OCT and OCTA Imaging for the Diagnosis of Long COVID. J. Clin. Transl. Ophthalmol. 2024, 2, 113–130. [Google Scholar] [CrossRef]
  13. Fu, X.; Ren, X.; Chen, W.; Chen, D. Reduced macular thickness and vascular density in abnormal glucose metabolism patients: A meta-analysis of optical coherence tomography (OCT) and OCT angiography studies. Chin. Med J. 2024, 137, 1054–1068. [Google Scholar] [CrossRef] [PubMed]
  14. Anjos, R.; Ferreira, A.; Barkoudah, E.; Claggett, B.; Pinto, L.A.; Miguel, A. Application of Optical Coherence Tomography Angiography Macular Analysis for Systemic Hypertension. A Systematic Review and Meta-analysis. Am. J. Hypertens. 2022, 35, 356–364. [Google Scholar] [CrossRef] [PubMed]
  15. Hohberger, B.; Ganslmayer, M.; Lucio, M.; Kruse, F.; Hoffmanns, J.; Moritz, M.; Rogge, L.; Heltmann, F.; Szewczykowski, C.; Fürst, J.; et al. Retinal Microcirculation as a Correlate of a Systemic Capillary Impairment After Severe Acute Respiratory Syndrome Coronavirus 2 Infection. Front. Med. 2021, 8, 676554. [Google Scholar] [CrossRef]
  16. Schlick, S.; Lucio, M.; Wallukat, G.; Bartsch, A.; Skornia, A.; Hoffmanns, J.; Szewczykowski, C.; Schröder, T.; Raith, F.; Rogge, L.; et al. Post-COVID-19 Syndrome: Retinal Microcirculation as a Potential Marker for Chronic Fatigue. Int. J. Mol. Sci. 2022, 23, 13683. [Google Scholar] [CrossRef]
  17. Hohberger, B.; Harrer, T.; Mardin, C.; Kruse, F.; Hoffmanns, J.; Rogge, L.; Heltmann, F.; Moritz, M.; Szewczykowski, C.; Schottenhamml, J.; et al. Neutralization of Autoantibodies Targeting G-Protein Coupled Receptors Improves Capillary Impairment and Fatigue Symptoms after COVID-19 Infection. Front. Med. 2021, 8, 754667. Available online: https://ssrn.com/abstract=3879488 (accessed on 11 March 2025). [CrossRef]
  18. Lyons, C.E.; Alhalel, J.; Busza, A.; Suen, E.; Gill, N.; Decker, N.; Suchy, S.; Orban, Z.; Jimenez, M.; Perez Giraldo, G.; et al. Non-Hospitalized Long COVID Patients Exhibit Reduced Retinal Capillary Perfusion: A Prospective Cohort Study. J. Imaging 2025, 11, 62. [Google Scholar] [CrossRef] [PubMed]
  19. Noor, M.; McGrath, O.; Drira, I.; Aslam, T. Retinal Microvasculature Image Analysis Using Optical Coherence Tomography Angiography in Patients with Post-COVID-19 Syndrome. J. Imaging 2023, 9, 234. [Google Scholar] [CrossRef] [PubMed]
  20. Ozturk, M.; Guler, D.K.; Oskan, E.E.; Onder, F. Long-Term Effects of COVID-19 on Optic Disc and Retinal Microvasculature Assessed by Optical Coherence Tomography Angiography. Diagnostics 2025, 15, 114. [Google Scholar] [CrossRef] [PubMed]
  21. Rocholz, R.; Teussink, M.; Dolz-Marco, R.; Holzhey, C.; Dechent, J.F.; Tafreshi, A.; Schulz, S. SPECTRALIS Optical Coherence Tomography Angiography (OCTA): Principles and Clinical Applications Heidelberg Engineering Academy. 2018. Available online: https://www.heidelbergengineering.com/int/news/spectralis-optical-coherence-tomography-angiography-principles-and-clinical-applications-69710055/ (accessed on 12 April 2025).
  22. Kuchler, T.; Günthner, R.; Ribeiro, A.; Hausinger, R.; Streese, L.; Wöhnl, A.; Kesseler, V.; Negele, J.; Assali, T.; Carbajo-Lozoya, J.; et al. Persistent endothelial dysfunction in post-COVID-19 syndrome and its associations with symptom severity and chronic inflammation. Angiogenesis 2023, 26, 547–563. [Google Scholar] [CrossRef] [PubMed]
  23. Kubánková, M.; Hohberger, B.; Hoffmanns, J.; Fürst, J.; Herrmann, M.; Guck, J.; Kräter, M. Physical phenotype of blood cells is altered in COVID-19. Biophys. J. 2021, 120, 2838–2847. [Google Scholar] [CrossRef] [PubMed]
  24. Pretorius, E.; Vlok, M.; Venter, C.; Bezuidenhout, J.A.; Laubscher, G.J.; Steenkamp, J.; Kell, D.B. Persistent clotting protein pathology in Long COVID/Post-Acute Sequelae of COVID-19 (PASC) is accompanied by increased levels of antiplasmin. Cardiovasc. Diabetol. 2021, 20, 1–18. [Google Scholar] [CrossRef] [PubMed]
  25. Gupta, N.; Motlagh, M.; Singh, G. Anatomy, Head and Neck, Eye Arteries. In StatPearls; StatPearls Publishing: Treasure Island, FL, USA, 2025. [Google Scholar]
  26. Orgül, S.; Gugleta, K.; Flammer, J. Physiology of perfusion as it relates to the optic nerve head. Surv. Ophthalmol. 1999, 43, S17–S26. [Google Scholar] [CrossRef] [PubMed]
  27. Gandhi, S.; Pattathil, N.; Choudhry, N. OCTA: Essential or Gimmick? Ophthalmol. Ther. 2024, 13, 2293–2302. [Google Scholar] [CrossRef] [PubMed]
  28. Kashani, A.H.; Chen, C.-L.; Gahm, J.K.; Zheng, F.; Richter, G.M.; Rosenfeld, P.J.; Shi, Y.; Wang, R.K. Optical coherence tomography angiography: A comprehensive review of current methods and clinical applications. Prog. Retin. Eye Res. 2017, 60, 66–100. [Google Scholar] [CrossRef] [PubMed]
  29. Hohberger, B.; Mardin, C.Y. OCT Angiography as an Interdisciplinary Diagnostic Tool for Systemic Diseases. Klin. Monbl. Augenheilkd 2021, 238, 1294–1298. [Google Scholar] [PubMed]
  30. Bilbao-Malavé, V.; González-Zamora, J.; de Viteri, M.S.; de la Puente, M.; Gándara, E.; Casablanca-Piñera, A.; Boquera-Ventosa, C.; Zarranz-Ventura, J.; Landecho, M.F.; García-Layana, A. Persistent Retinal Microvascular Impairment in COVID-19 Bilateral Pneumonia at 6-Months Follow-Up Assessed by Optical Coherence Tomography Angiography. Biomedicines 2021, 9, 502. [Google Scholar] [CrossRef] [PubMed]
  31. Jevnikar, K.; Meglič, A.; Lapajne, L.; Logar, M.; Valentinčič, N.V.; Petrovič, M.G.; Mekjavić, P.J. The Comparison of Retinal Microvascular Findings in Acute COVID-19 and 1-Year after Hospital Discharge Assessed with Multimodal Imaging—A Prospective Longitudinal Cohort Study. Int. J. Mol. Sci. 2023, 24, 4032. [Google Scholar] [CrossRef] [PubMed]
  32. Abrishami, M.; Hassanpour, K.; Hosseini, S.; Emamverdian, Z.; Ansari-Astaneh, M.-R.; Zamani, G.; Gharib, B.; Abrishami, M. Macular vessel density reduction in patients recovered from COVID-19: A longitudinal optical coherence tomography angiography study. Graefes Arch. Clin. Exp. Ophthalmol. 2022, 260, 771–779. [Google Scholar] [CrossRef] [PubMed]
  33. Burgos-Blasco, B.; Güemes-Villahoz, N.; Vidal-Villegas, B.; Martinez-De-La-Casa, J.M.; Garcia-Feijoo, J.; Donate-Lopez, J.; Martin-Sanchez, F.J.; Gonzalez-Armengol, J.J.; Mendez-Hernandez, C.D. One-Year Changes in Optic Nerve Head Parameters in Recovered COVID-19 Patients. Neuro-Ophthalmology 2022, 42, 476–482. [Google Scholar] [CrossRef]
  34. García, S.B.; Aragón, D.; Azarfane, B.; Trejo, F.; Garrell-Salat, X.; Sánchez-Montalvá, A.; Otero-Romero, S.; Garcia-Arumi, J.; Zapata, M.A. Persistent reduction of retinal microvascular vessel density in patients with moderate and severe COVID-19 disease. BMJ Open Ophthalmol. 2022, 7, e000867. [Google Scholar] [CrossRef]
  35. Castellino, N.; Longo, A.; Russo, A.; Bonfiglio, V.; Fallico, M.; Toro, M.D.; Cappellani, F.; Grillo, M.; Gaudio, A.; Cicero, L.L.; et al. COVID-19-related retinal microvasculopathy and systemic implications in patients with severe disease: Results from the Methuselah study. Front. Med. 2024, 11, 1294432. [Google Scholar] [CrossRef] [PubMed]
  36. Campbell, J.P.; Zhang, M.; Hwang, T.S.; Bailey, S.T.; Wilson, D.J.; Jia, Y.; Huang, D. Detailed Vascular Anatomy of the Human Retina by Projection-Resolved Optical Coherence Tomography Angiography. Sci. Rep. 2017, 7, srep42201. [Google Scholar] [CrossRef] [PubMed]
  37. Cosmo, E.; Frizziero, L.; Schiavon, S.; Cattelan, A.M.; Leoni, D.; Capizzi, A.; Torresin, T.; Midena, G.; Roveri, E.A.S.D.; Parrozzani, R.; et al. The neurovascular retinal involvement in a large population of patients recovered from COVID-19: An OCT and OCT angiography study. Eye 2024, 38, 1674–1680. [Google Scholar] [CrossRef] [PubMed]
  38. Lavia, C.; Couturier, A.; Erginay, A.; Dupas, B.; Tadayoni, R.; Gaudric, A. Reduced vessel density in the superficial and deep plexuses in diabetic retinopathy is associated with structural changes in corresponding retinal layers. PLoS ONE 2019, 14, e0219164. [Google Scholar] [CrossRef] [PubMed]
  39. Chan, G.; Balaratnasingam, C.; Yu, P.K.; Morgan, W.H.; McAllister, I.L.; Cringle, S.J.; Yu, D.-Y. Quantitative morphometry of perifoveal capillary networks in the human retina. Investig. Opthalmol. Vis. Sci. 2012, 53, 5502–5514. [Google Scholar] [CrossRef]
  40. Park, J.J.B.; Soetikno, B.T.B.; Fawzi, A.A. CHARACTERIZATION OF THE MIDDLE CAPILLARY PLEXUS USING OPTICAL COHERENCE TOMOGRAPHY AN-GIOGRAPHY IN HEALTHY AND DIABETIC EYES. Retina 2016, 36, 2039–2050. [Google Scholar] [CrossRef]
  41. Choudhary, R.; Kapoor, M.S.; Singh, A.; Bodakhe, S.H. Therapeutic targets of renin-angiotensin system in ocular disorders. J. Curr. Ophthalmol. 2017, 29, 7–16. [Google Scholar] [CrossRef] [PubMed]
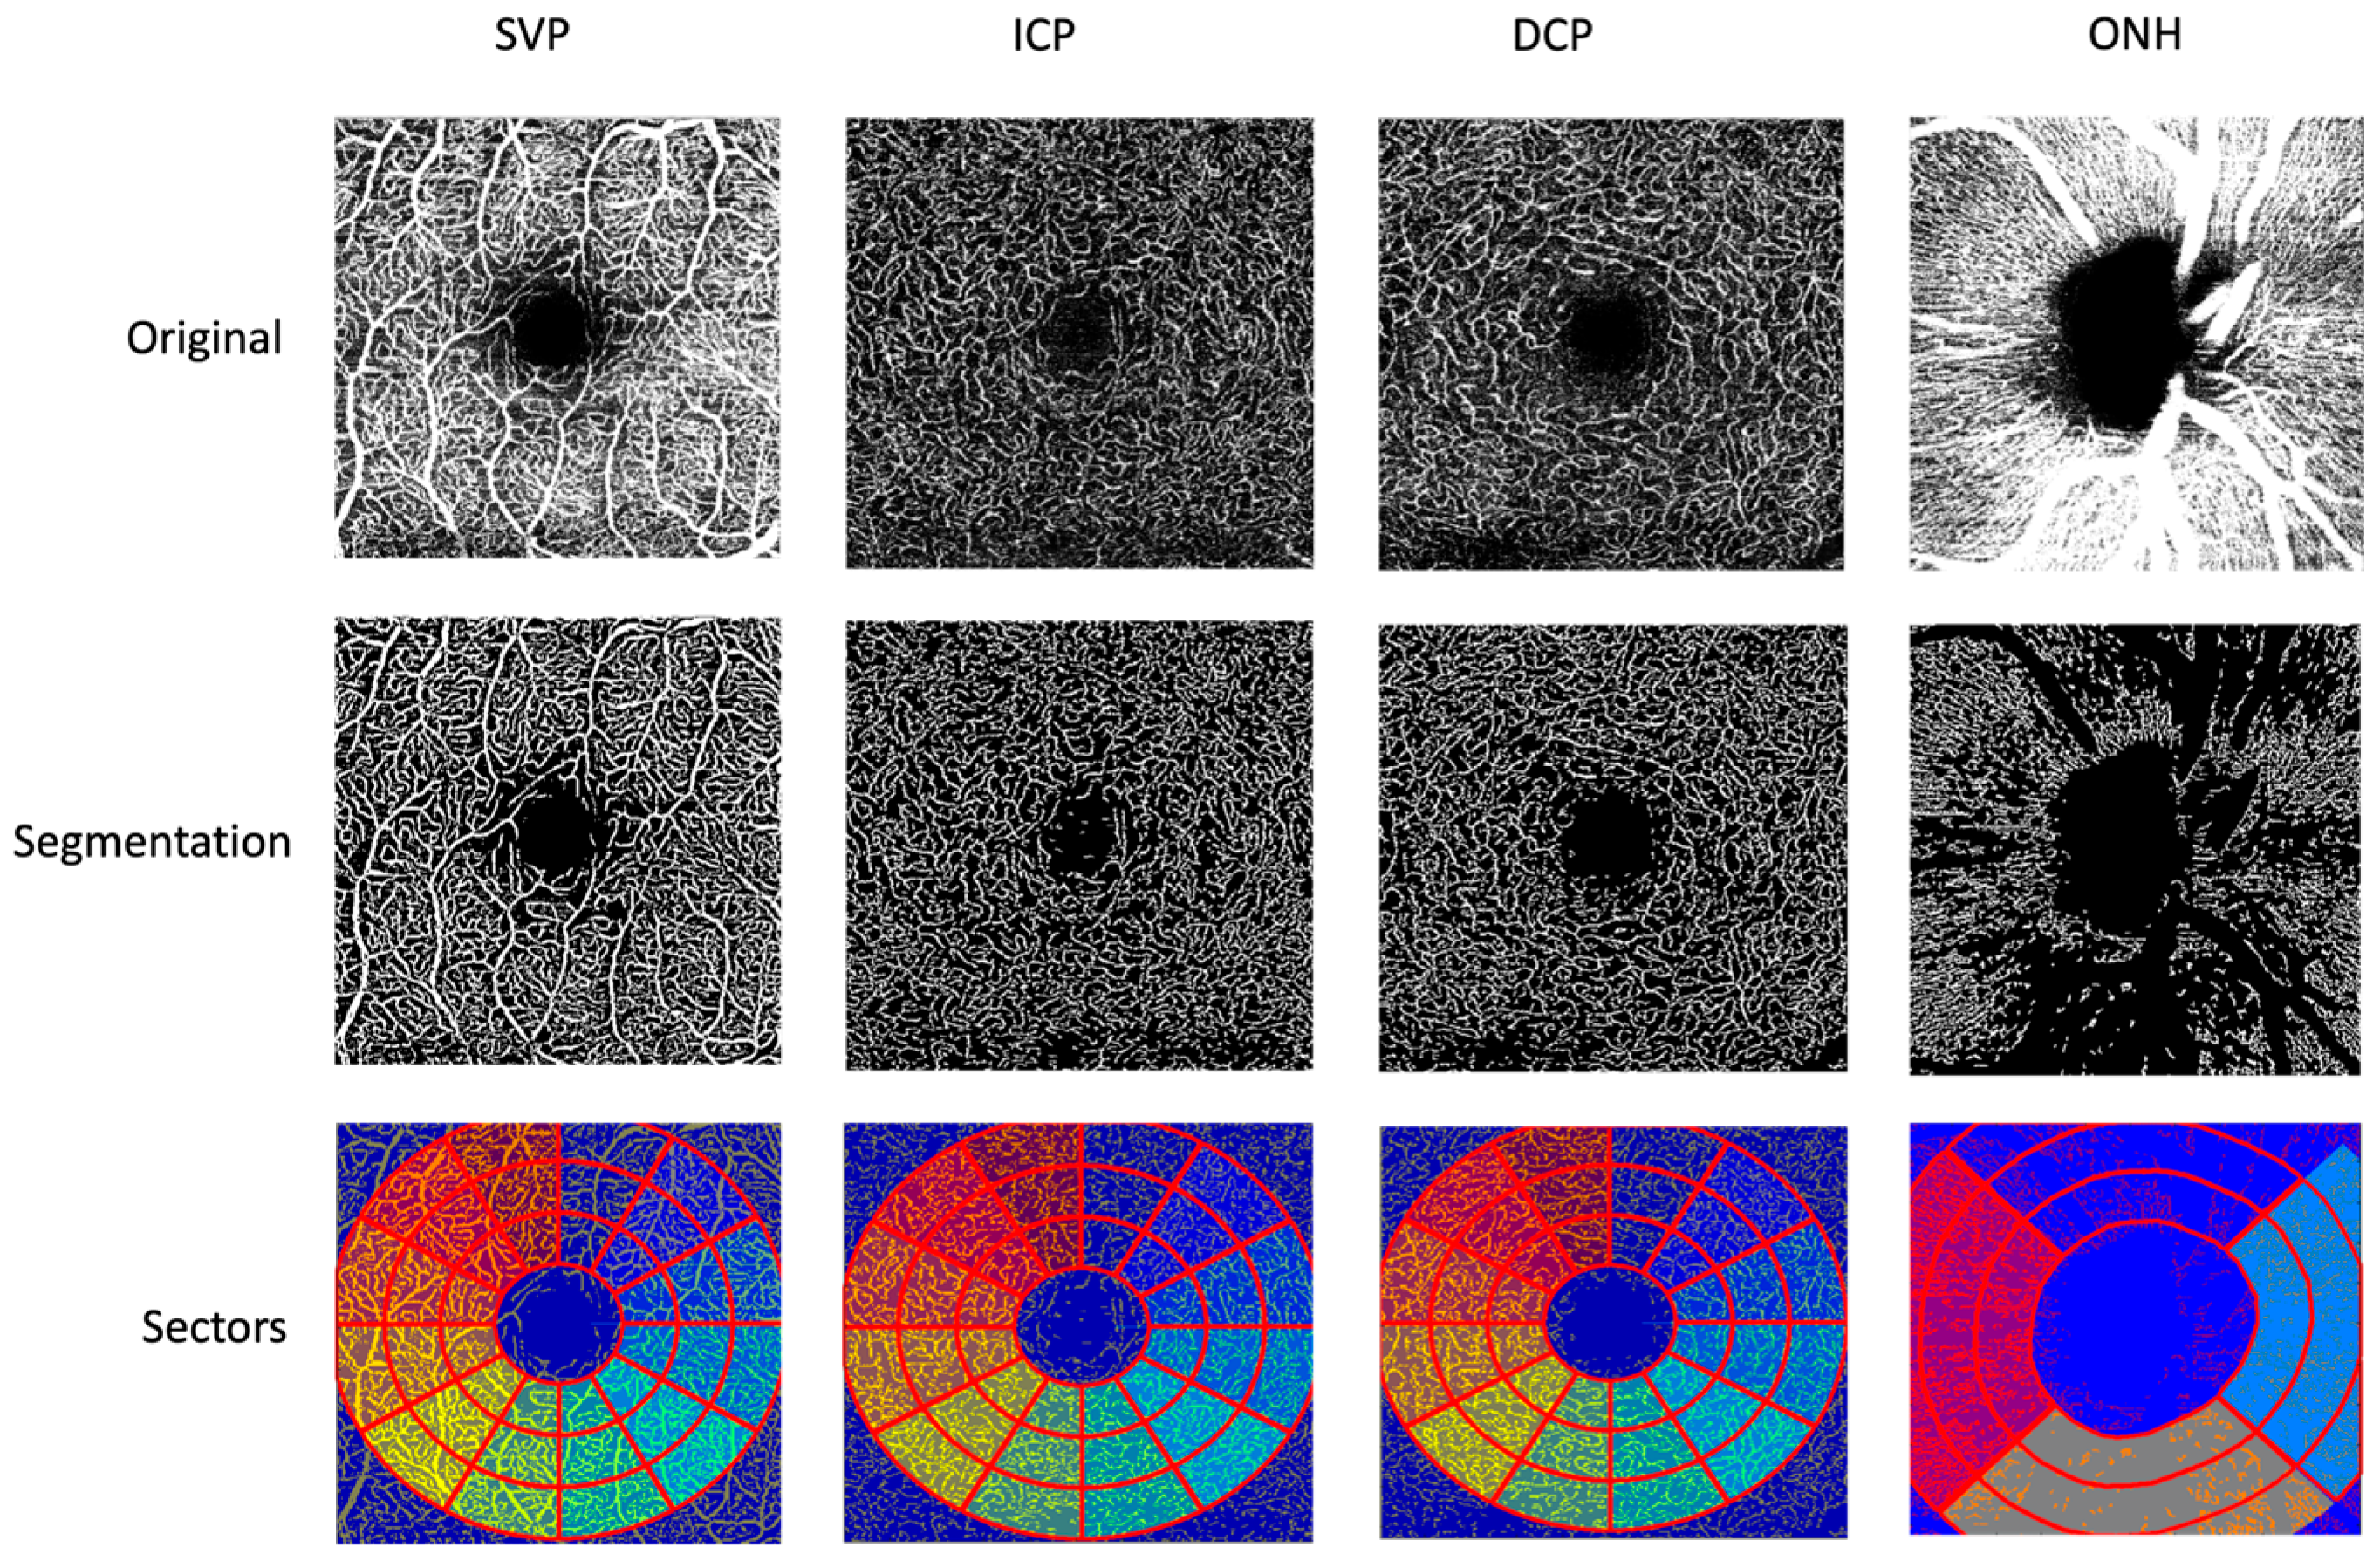
Figure 1. Spectralis en face OCT-A scans of the macula (SVP, ICP, DCP) and peripapillary region (ONH). The first line shows the original image. The second line displays the segmentation. The third line illustrates the 12 sectors of the macula indicated by a different color and the scan of the optic nerve head (ONH), where the four sectors used to compute the peripapillary VD are also color-coded. The macula was divided into 12 sectors arranged clockwise from 1 to 12, each covering a 30° angle. An inner circle of 0.4 mm defined the foveal area, which was excluded from the analysis. BMO-based segmentation defined the papilla by Heidelberg software. The peripapillary region was divided into four sectors, each with a 90° angle. Three concentric rings were added with an increasing radius of 0.35 mm for each increment. Abbreviations: superficial vascular plexus (SVP), intermediate capillary plexus (ICP), deep capillary plexus (DCP), optic nerve head (ONH).
Biophysica 05 00046 g001
Figure 2. Pairwise scatterplots and correlation coefficients for changes in retinal vessel density (ΔVD) across the four vascular layers in patients with PCS. Each point represents the change in vessel density from visit1 to visit2 for an individual eye. Histograms show the distribution of ΔVD values, while scatterplots display relationships between the pairs of layers. Pearson correlation coefficients are shown above the diagonal (* p < 0.05, *** p < 0.001). Strong correlations were observed between ΔDCP and both ΔSVP (r = 0.586) and ΔICP (r = 0.711), indicating coordinated microvascular alterations in the macular capillary plexuses. In contrast, peripapillary changes showed minimal association with the macular layers.
Biophysica 05 00046 g002
Figure 3. Raincloud plot showing the distribution of vessel density (VD) changes (ΔVD) across the three macular retinal layers: superficial vascular plexus (SVP), intermediate capillary plexus (ICP), and deep capillary plexus (DCP). Each distribution combines a half-violin plot (representing the kernel density), a boxplot (median and interquartile range), and individual data points (jittered for clarity). This visualization captures both the central tendency and variability of ΔVD across patients. Despite no statistically significant visit-related differences in the multivariate model, the plot highlights strong interindividual variability and visually supports the correlation between changes in macular layers.
Biophysica 05 00046 g003
Table 1. Demographic data of the study cohort. Values are presented as mean ± standard deviation; female (f); male (m); best-corrected visual acuity (BCVA); intraocular pressure (IOP).
NumberAgeGender (f/m)BCVAIOP [mmHg]Axial Length [mm]
Total8040.33 ± 1245/350.995 ± 014.6 ± 324.02 ± 1
Female4540.35 ± 12450.991 ± 014.91 ± 323.67 ± 1
Male3540.31 ± 11351.0 ± 014.20 ± 324.47 ± 1
Table 2. Overall LS-Mean of macular vessel density (VD) for the three measured layers, namely the SVP, intermediate capillary plexus (ICP), deep capillary plexus (DCP), and the peripapillary region of patients with PCS at the two timepoints. LS-Mean: the estimated marginal mean. SE: standard error of the LS-Mean. DF: degrees of freedom used in the estimation. Lower.CL and Upper.CL: lower and upper bounds of the 95% confidence interval for the LS-Mean, p-value.
GroupLS-MeanSEDFLower.CLUpper.CLp-Value
SVPPCS visit130.40.1683133030.7
PCS visit230.30.16631329.930.60.677
ICPPCS visit122.40.14331322.222.7
PCS visit222.20.14131321.922.50.263
DCPPCS visit123.90.18631423.524.3
PCS visit223.80.18531423.424.20.725
Peripapillary RegionPCS visit127.40.2263132727.9
PCS visit2270.22431326.527.40.142
Table 3. Multivariate longitudinal model with fixed effects (VD ~ visit * layer + gender + age) in patients with post-COVID-19 syndrome (PCS) during the follow-up period; superficial vascular plexus (SVP) and intermediate capillary plexus (ICP) vessel density; Estimate, SE: standard error, DF: degrees of freedom used in the estimation, t-value, and p-value.
ParameterEstimateSEDFt-Valuep-Value
(Intercept)26.740.5148052.35<0.0001
Visit0.090.124800.740.4606
ICP−1.890.30320−6.28<0.0001
SVP6.410.3032021.32<0.0001
Gender−0.380.24158−1.560.1208
Age−0.070.01158−6.56<0.0001
Visit–ICP0.240.184801.390.1662
Visit–SVP0.040.184800.260.7986
ContrastEstimateSEDFt-Valuep-Value
DCP-ICP1.520.14532010.486<0.0001
DCP-SVP−6.470.145320−44.598<0.0001
ICP-SVP−7.990.145320−55.084<0.0001
Table 4. Follow-up OCT-A studies investigating VD of macular and ONH in patients after COVID-19: cohort size, COVID-19 severity, imaging device, segmentation approach, follow-up duration, and reported main findings are listed; VD—vessel density; ONH—optic nerve head.
StudyCohort SizeCOVID-19 Severity/Inclusion CriteriaDeviceSegmentation ApproachDurationMain Findings
Ozturk, M. et al. [20]n = 40; PCS patientsMild to moderate SARS-CoV-2-induced pneumoniaAngioVue Imaging System version 2017.1, Optovue. Inc., Fremont, CA, USASCP and DCP, FAZ, 4.5 × 4.5 mm24 and 12 monthsProgressive decrease in foveal SVP and DCP and an increased FAZ
Noor et al. [19]n = 40; PCS patients Post-COVID-19 syndrome (persistent symptoms ≥ 12 weeks)Canon Xephilio OCTA-1 machine (Canon Medical Systems Europe B.V©, Amstelveen, The Netherlands)SCP, FAZ,
10 × 10 mm2 and 4 × 4 mm2
≈15 months No significant differences in VD of SCP and FAZ
Lyons et al. [18]n = 30; Neuro-PASC patients Neuro-PASC (long COVID-19 with persistent neurological symptoms)RTVue-XR Avanti system (Optovue, Inc., Fremont, CA, USA)SCP and DCP, FAZ, 3 × 3 mm2 scans~12 months No significant differences in VD of SCP, DCP, and FAZ
Bilbao-Malavé, V. et al. [30]n = 17; COVID-19 patientsBilateral pneumoniaDRI OCT Triton SS-OCT Angio (Topcon Medical Systems, Inc., Oakland, NJ, USA)SCP and DCP, FAZ area, 4.5 × 4.5 mm2 and 6 × 6 mm26 monthsNo differences at baseline, a reduced VD of SCP and DCP, and enlarged FAZ
Jevnikar, K. et al. [31]n = 30; COVID-19 patientsRecoveredTopcon DRI OCT Triton (Topcon Corp., Tokyo, Japan)SCP and DCP, FAZ, 3 × 3 mm212-month follow-upNo alterations in VD after one-year follow-up
Abrishami, M. et al. [32]n = 18; COVID-19 patientsRecovered from mild to moderate COVID-19AngioVue system (RTVue XR Avanti, Optovue, Fremont, CA, USA)SCP and DCP, FAZ, 3 × 3 mm2 1 and 3 monthsProgressive reduction in VD in DCP over 3 months; FAZ stable
Burgos-Blasco, B. et al. [32,33]n = 90; COVID-19 patientsHospitalized with moderate to severe COVID-19Cirrus HD-OCT 5000 with AngioPlex OCTAPeripapillary and macular SCP, 4.5 × 4.5 mm23 and 12 monthsIncreased VD at 12 months
Banderas García, S. et al. [34]n = 75; COVID-19 patientsModerate and severe COVID-19 (with demand for hospitalization)DRI OCT Triton Swept Source equipment (Topcon Corporation, Tokyo, Japan)SCP and DCP, 4.5 × 4.5 mm28 monthsPersistent reduction in VD of SCP and DCP
Castellino, N. et al. [35]n = 25; COVID-19 patientsHospitalization due to severe COVID-19AngioVue XR Avanti (Optovue Inc., Fremont, CA, USA)SCP and DCP, FAZ area, 6 × 6 mm2 1 and 12 monthsNo reversion of the reduced SCP and enlarged FAZ
Disclaimer/Publisher’s Note: The statements, opinions and data contained in all publications are solely those of the individual author(s) and contributor(s) and not of MDPI and/or the editor(s). MDPI and/or the editor(s) disclaim responsibility for any injury to people or property resulting from any ideas, methods, instructions or products referred to in the content.