Article

Exploring Therapeutic Dynamics: Mathematical Modeling and Analysis of Type 2 Diabetes Incorporating Metformin Dynamics

by
Alireza Mirzaee
1 and
Shantia Yarahmadian
2,*
1
Department of Electrical and Computer Engineering, University of Windsor, Windsor, ON N9B 3P4, Canada
2
Department of Mathematics and Statistics, Mississippi State University, Starkville, MS 39762, USA
*
Author to whom correspondence should be addressed.
Biophysica 2025, 5(3), 37; https://doi.org/10.3390/biophysica5030037
Submission received: 30 June 2025 / Revised: 5 August 2025 / Accepted: 12 August 2025 / Published: 14 August 2025

Abstract

Type 2 diabetes (T2D) is a chronic metabolic disorder requiring effective management to avoid complications. Metformin is a first-line drug agent and is routinely prescribed for the control of glycemia, but its underlying dynamics are complicated and not fully quantified. This paper formulates a control-oriented and interpretable mathematical model that integrates metformin dynamics into a classic beta-cell–insulin–glucose (BIG) regulation system. The paper’s applicability to theoretical and clinical settings is enhanced by rigorous mathematical analysis, which guarantees the model is globally bounded, well-posed, and biologically meaningful. One of the key features of the study is its global stability analysis using Lyapunov functions, which demonstrates the asymptotic stability of critical equilibrium points under realistic physiological constraints. These findings support the predictive reliability of the model in explaining long-term glycemic regulation. Bifurcation analysis also clarifies the dynamic interplay between glucose production and utilization by identifying parameter thresholds that signify transitions between homeostasis and pathological states. Residual analysis, which detects Gaussian-distributed errors, underlines the robustness of the fitting process and suggests possible refinements by including temporal effects. Sensitivity analysis highlights the predominant effect of the initial dose of metformin on long-term glucose regulation and provides practical guidance for optimizing individual treatment. Furthermore, changing the two considered metformin parameters from their optimal values—altering the dose by ±50% and the decay rate by ±20%—demonstrates the flexibility of the model in simulating glycemic responses, confirming its adaptability and its potential for optimizing personalized treatment strategies.

1. Introduction

Type 2 Diabetes Mellitus (T2DM) is a metabolic disease characterized by increased blood sugar levels due to insulin resistance and reduced insulin secretion from pancreatic beta-cells. This is a global public health problem, with an increasing prevalence due to physical inactivity, diet, and obesity [1]. During the past few decades, the prevalence of T2DM has grown exponentially. In 2019, the global age-standardized point incidence rate was 5283 per 100,000—a 49% increase since 1990 [2]. In addition to being common in adults, T2DM is also becoming a larger problem in children and adolescents, with a concerning increase in cases in younger populations [3].
The spectrum of complications of T2DM is broad, including microvascular (e.g., retinopathy, nephropathy, and neuropathy) and macrovascular (e.g., cardiac disease and stroke) complications [4,5]. Therefore, early detection, effective treatment, and targeted prevention strategies are required to address the growing global burden of T2DM and its complications.
Beta-cell dysfunction is a significant indicator in the early stages of T2DM. Research suggests that even when beta-cell mass is unchanged in prediabetic patients, beta-cell function is markedly impaired, with elevated basal insulin secretion and lowered insulin secretion both observed during the early stage of diabetes. This progressive malfunction in T2DM patients highlights the importance of targeting beta-cell function for diabetes prevention and therapy [6].
Beta-cell dysfunction is also affected by a variety of metabolic stresses, including endoplasmic reticulum stress, oxidative stress, and inflammatory signals. These factors contribute to dynamic beta-cell compensation and differentiation processes during T2DM progression. Dietary and exercise interventions have been shown to improve the functional capacity of beta-cells and offer potential therapeutic benefits [7].
Among all pharmacological treatment methods, metformin remains the first choice for T2DM patients, primarily due to its ability to reduce hepatic glucose production, increase insulin sensitivity, reduce intestinal glucose absorption, and improve gut microbial structure, which plays a key role in blood glucose homeostasis [8,9]. Unlike antibiotics, which cause an immediate and dramatic reduction in pathogen populations, metformin has a gradual effect on T2DM, reducing blood sugar levels over time by gently altering the body’s natural processes to regulate blood sugar. It also improves the survival and functionality of beta-cells by reducing oxidative stress and apoptosis [10].
Mathematical models of T2DM and its treatment have advanced significantly, but many of them are too complicated and difficult to interpret, which limits their applicability to real-world scenarios. Relatively few models specifically address the effects of metformin, and those that do tend to be complex mathematical constructs, making them difficult to use in clinical or research settings [11]. This requires a simpler but still useful model that not only captures the main mechanisms of metformin action but is also tractable and interpretable. Such a model might provide us with a better understanding of the interaction between metformin therapy and glucose control, as well as serve as an effective tool for decision-making and controlling blood glucose concentration.

1.1. Overview of Type 2 Diabetes Models

Mathematical modeling has emerged as a vital tool for elucidating the complex physiological processes underlying Type 2 Diabetes Mellitus (T2DM) and optimizing therapeutic strategies. These computational models provide a quantitative framework for simulating clinical scenarios, forecasting patient responses to treatments, and enhancing glycemic management before conducting experimental validation [12].
The intricate interactions among insulin secretion, glucose metabolism, drug response, and other physiological factors in T2DM complicate predictions of disease progression and treatment outcomes using conventional approaches. Mathematical models developed specifically for T2DM aim to capture the multifaceted relationships involving insulin resistance, glucose metabolism, beta-cell functionality, and other relevant physiological parameters critical for diabetes management.
Computational approaches, including machine learning algorithms, have been widely applied to investigate metformin’s therapeutic efficacy, demonstrating high predictive precision in predicting glycemic control after one year of treatment using baseline clinical variables [13,14]. Pharmacokinetic (PK) and pharmacodynamic (PD) models have provided insights into metformin’s physiological effects, including predictive signal transduction models for plasma metformin concentrations and fasting glucose profiles [15]. Additionally, physiologically based pharmacokinetic models simulate metformin distribution across tissues such as the stomach, intestines, liver, kidney, and heart, using established physiological parameters [16]. Genomic and proteomic data-driven models have further identified biomarkers, including genetic variants and protein markers, explaining inter-individual variability in metformin response [14,17].
Historically, research on diabetes modeling and control has predominantly targeted Type 1 Diabetes (T1D), primarily through artificial pancreas systems and multiple daily insulin injections [18,19]. Nonetheless, T1D models can be adapted for T2DM studies. For instance, the Bergman Minimal Model (BMM) has been foundational in understanding glucose regulation and diabetes pathogenesis [20]. Various BMM adaptations incorporate beta-cell dynamics to more realistically represent T2DM, incorporating factors such as beta-cell mass, insulin kinetics, and glucose metabolism [21,22].
Other influential factors in T2DM, such as incretin hormones driving insulin secretion, have also been integrated into mathematical models. These models have notably enhanced the interpretation of the Oral Glucose Tolerance Test (OGTT), enabling improved assessments of alpha and beta-cell dysfunction and insulin resistance, thereby providing a comprehensive picture of T2DM pathophysiology [23]. More complex models, like variations of the Sorensen model—which originally contained 22 differential equations representing glucose–insulin interactions across various organs—have been modified to reflect T2DM conditions by introducing components for subcutaneous insulin administration and simplifying dynamics for practical use [24,25,26].
Recent advancements have integrated physiological, pharmacokinetic, and pharmacodynamic methodologies to more accurately capture T2DM-specific pathophysiology, such as insulin sensitivity and gastric emptying effects. An example includes adapting the UVA/PADOVA T1D simulator for T2DM applications, necessitating modifications to accurately represent insulin resistance, beta-cell dysfunction, and disease progression [27]. Nevertheless, most existing T2DM models, such as those developed by Visentin et al. [27,28], do not explicitly incorporate metformin pharmacokinetics or solely simulate incretin hormones and gastric emptying without delineating metformin’s impact on hepatic gluconeogenesis and insulin sensitivity [11]. This underscores the need for a more comprehensive and intuitive model that explicitly incorporates metformin’s mechanism of action for better prediction of long-term glucose control and individual patient responses.
Models such as the Beta-cell–Insulin–Glucose (BIG) model extend traditional glucose–insulin dynamics by incorporating beta-cell mass, reflecting its crucial role in diabetes pathogenesis. The BIG model expands on the BMM by introducing a slow, glucose-dependent feedback loop to regulate beta-cell mass, thereby providing deeper insights into long-term therapeutic impacts, including lifestyle, pharmacologic, and insulin therapies [21].
Despite their utility, existing models, including BIG, have notable limitations, particularly in explicitly representing the pharmacokinetics and pharmacodynamics of treatments like metformin. Given metformin’s prominence as the first-line therapy for T2DM, there is a critical need for models that explicitly integrate its pharmacological effects into glucose–insulin feedback systems, alongside patient-specific physiological variables, to enhance therapeutic planning.
The proposed extended BIG model, which incorporates key factors such as delayed insulin action, glucose uptake, and the pharmacodynamics of metformin, strikes a balance between physiological accuracy and practical applicability. Its simplified complexity ensures rapid simulations, thereby providing accessible tools that facilitate real-time decision-making and effective diabetes management.

1.2. Motivations, Contributions, and Objectives

Despite widespread clinical use, the precise therapeutic dynamics of metformin in glycemic regulation remain complex and inadequately represented in existing mathematical models. Developing an accurate mathematical framework that captures the effects of metformin on glucose–insulin interactions is essential for enhancing Type 2 Diabetes Mellitus (T2DM) management and optimizing treatment strategies.
The primary motivation of this study is to create a practical, control-oriented mathematical model capable of effectively guiding T2DM treatment, suitable for both clinical and engineering applications. Complex, high-dimensional compartmental models involving numerous differential equations and extensive parameter tuning often present significant challenges in clinical settings. Thus, there is a critical need for a simplified yet robust model that accurately reflects the essential physiological interactions between glucose and insulin during metformin therapy. The goal is not an exhaustive physiological representation but rather a structured, interpretable framework that facilitates the design of therapeutic controllers and treatment strategies, enhancing accessibility for researchers and healthcare providers.
The proposed integrated model offers significant advancements in the study and management of T2DM. First, it incorporates metformin explicitly as a continuous-state variable within the classic Beta-cell–Insulin–Glucose (BIG) model, enabling detailed analysis of metformin’s effects on insulin sensitivity, hepatic glucose production, and beta-cell function. Unlike previous frameworks that primarily focus on glucose-insulin dynamics without explicit pharmacological considerations, this model systematically captures metformin’s therapeutic effects in a mathematically tractable form. Such a representation is particularly beneficial for developing predictive control strategies and optimizing medication administration.
Furthermore, rigorous mathematical analyses, including well-posedness, stability, and bifurcation analyses, have been conducted to ensure the robustness and biological plausibility of the model. These analyses identify key treatment parameters influencing glycemic control, thereby enabling improved clinical decision-making. By simulating long-term treatment scenarios, the model also provides valuable insights into the efficacy of various dosing strategies, contributing to individualized and effective treatment plans. This research makes the following key contributions:
  • Integration of Metformin into Glucose-Insulin Dynamics: Explicit incorporation of metformin into the classical BIG model as a continuous-state variable, enabling detailed examination of its impact on insulin sensitivity, hepatic glucose suppression, and glucose utilization. This inclusion captures the dual pharmacodynamic role of metformin in both hepatic and peripheral glucose regulation, enhancing the model’s capability to represent therapeutic interventions.
  • Development of a Control-Oriented Mathematical Model: Creation of a simplified yet analytically rigorous framework that enhances interpretability and applicability in both control-theoretic studies and clinical practice, contrasting with complex, high-dimensional models. The model supports the simulation of diverse metformin dosing profiles and allows for treatment scenario testing, aligning closely with real-world pharmacological practice.
  • Comprehensive Well-Posedness and Global Boundedness Analysis: Rigorous demonstration of the model’s mathematical well-posedness under biologically reasonable constraints, including local Lipschitz continuity, invariance of the non-negative orthant, and global boundedness, thereby confirming the existence, uniqueness, and biological relevance of solutions.
  • Global Stability and Bifurcation Analysis: Application of Lyapunov stability methods to confirm the robustness of equilibrium states under realistic conditions and identification of saddle-node bifurcations that mark transitions from homeostasis to pathological states, thereby linking glucose regulation dynamics with the pharmacological effects of metformin. This analysis provides novel theoretical insights into how treatment-driven parameters such as metformin concentration modulate the stability landscape of glucose regulation.
  • Identification of Critical Parameter Thresholds: Determination of parameter ranges crucial for maintaining glucose homeostasis, highlighting the balance between glucose production ( R 0 ) and utilization ( E G 0 ). Identifying these thresholds provides insights into physiological transitions between health and disease states.
  • Long-Term Treatment Scenario Simulations: Evaluation of various dosing strategies and pharmacokinetic scenarios through simulations, enhancing personalized therapeutic decision-making for effective long-term glycemic management. These simulations are supported by parameter sensitivity studies and validated using clinical data, reinforcing the model’s relevance and predictive capability.
In the subsequent section, we explore both the classical BIG model and the extended model incorporating metformin dynamics.

2. Materials and Methods

2.1. Beta Cell-Insulin-Glucose Dynamics and Metformin

Understanding the intricate interactions among beta-cell mass, insulin, glucose, and medications such as metformin is essential for effectively managing Type 2 Diabetes Mellitus (T2DM). These interactions are regulated by complex physiological mechanisms that ensure glycemic stability.

2.2. Insulin-Glucose Homeostasis

Insulin and glucose interact dynamically through a finely tuned feedback mechanism mediated by insulin receptors to maintain homeostasis. In healthy individuals, elevated blood glucose levels stimulate insulin secretion, enhancing glucose uptake by peripheral tissues and inhibiting hepatic glucose production.
Glucose and insulin levels are regulated to maintain a physiological equilibrium, typically around 90 mg/dL. In T2DM patients, however, this equilibrium is disrupted due to insulin resistance and beta-cell dysfunction, resulting in sustained hyperglycemia [29]. The basic Beta-cell–Insulin–Glucose (BIG) model, originally proposed by Topp et al. [21], is described in the subsequent subsection and serves as the foundation for the extended metformin-integrated model.

2.3. The BIG Model

The BIG (Beta-cell, Insulin, Glucose) model mathematically describes the dynamic interactions among glucose concentration, insulin secretion, beta-cell mass, and insulin sensitivity [21]. These relationships are governed by the following system of differential equations:
d G d t = R 0 ( E G 0 + S I I ) G , d I d t = B σ G 2 α + G 2 K I , d B d t = ( d 0 + r 1 G r 2 G 2 ) B , d S I d t = c S I .
where:
  • G is the blood glucose concentration,
  • R 0 is the net glucose production rate at zero glucose,
  • E G 0 is the glucose uptake rate at zero insulin,
  • S I represents insulin sensitivity,
  • I is the blood insulin concentration,
  • σ is the maximum insulin secretion rate,
  • K is the insulin clearance rate (hepatic, renal, and receptor-mediated uptake),
  • B is the beta-cell mass,
  • d 0 is the baseline beta-cell apoptosis rate,
  • r 1 and r 2 are coefficients for glucose-dependent beta-cell proliferation and death, respectively,
  • c is the rate of insulin sensitivity degradation.
Equation (1), which governs the glucose dynamics, illustrates the temporal evolution of glucose concentration G, which balances glucose production R 0 against glucose uptake, comprising both a baseline consumption rate E G 0 and insulin-mediated uptake S I I G . This clearly demonstrates insulin’s critical role in reducing blood glucose levels.
Insulin release is defined as a function of glucose concentration and the mass of beta-cells B. Insulin secretion is represented as a sigmoidal function of glucose concentration, G 2 α + G 2 , capturing the saturation effect at elevated glucose levels. Insulin clearance from the circulation is proportional to insulin concentration K I . Beta-cell mass dynamics are governed by glucose-dependent mechanisms: lower glucose concentrations enhance beta-cell proliferation r 1 G , while higher glucose concentrations promote apoptosis r 2 G 2 . Additionally, insulin sensitivity S I decreases exponentially at rate c, reflecting the progressive nature of insulin resistance.
The BIG model thus provides an essential mathematical foundation for analyzing the feedback interactions among glucose, insulin, and beta-cell dynamics, yielding valuable insights into the pathophysiology of Type 2 Diabetes Mellitus (T2DM) and informing therapeutic interventions. Table 1 summarizes the parameters and their corresponding baseline values used in the model.
This model serves as the basis for investigating pharmacological interventions, including metformin, as discussed in subsequent sections.

2.4. Metformin’s Role in Glycemic Regulation in T2DM

Metformin is a cornerstone medication for managing T2DM, primarily through its glucose-lowering effects. Its principal mechanism involves the suppression of hepatic gluconeogenesis, significantly reducing glucose release into the circulation [30,31,32]. Additionally, metformin promotes weight loss, thereby enhancing insulin sensitivity and improving overall glycemic control, making it a recommended first-line therapy [33]. Metformin also confers additional health benefits, including improved lipid profiles, reduced inflammation, and decreased cardiovascular risk, independent of its glucose-lowering properties [31,34]. Furthermore, its effects on the gut microbiome may contribute to improved glycemic outcomes [35].
To maintain clarity and model simplicity, this study specifically focuses on metformin’s impact on hepatic glucose production ( R 0 ) and insulin sensitivity ( S I ). Metformin administration reduces hepatic gluconeogenesis and enhances insulin sensitivity, thereby affecting blood glucose dynamics. Figure 1 provides a conceptual visualization of these interactions.

2.5. The Metformin-Integrated BIG Model

The proposed extended BIG model incorporates metformin ( U M ) explicitly into the glucose–insulin dynamics framework:
d G d t = ( 1 U M ) R 0 E G 0 + S I I G , d I d t = B σ G 2 α + G 2 K I , d B d t = d 0 + r 1 G r 2 G 2 B , d S I d t = c S I + d s U M , d U M d t = d u U M , U M ( 0 ) = U m 0 .
This system captures glucose metabolism, insulin secretion, beta-cell dynamics, insulin sensitivity, and metformin kinetics. The initial state of metformin ( U m 0 ) and the dose ( U M ) are critical parameters that influence the behavior of the system. Subsequent sections present rigorous analyses of the model’s well-posedness and stability, validating its clinical applicability.
Remark 1.
In this model U M is dimensionless. It is normalized relative to a reference dosage, which corresponds to the maximum effective therapeutic plasma concentration of metformin commonly observed in clinical settings. Specifically, we set: U M = M ( t ) M r e f , where M ( t ) is the concentration of metformin at time t (in mg/dL), and M r e f is a fixed reference concentration (typically 1 to 2 mg/dL based on pharmacokinetic data). This normalization ensures U M [ 0 , 1 ] , which simplifies both analysis and simulation while preserving biological interpretability. The variable B represents the beta-cell mass and is also treated as a normalized quantity, scaled relative to a healthy baseline mass B norm . That is, B ( t ) = Actual Beta-cell Mass ( t ) B norm . This normalization is common in minimal models, such as the BIG model of Topp et al. [21], which we have extended. It enables the tracking of relative changes in mass due to apoptosis or proliferation without requiring absolute mass data, which are difficult to obtain clinically.

2.6. Well-Posedness and Boundedness

In this section, we first analyze the well-posedness of the system of ordinary differential Equation (2). Starting from (2), we denote the state vector as X ( t ) = ( G ( t ) , I ( t ) , B ( t ) , S I ( t ) , U M ( t ) ) T and the right-hand side of the system (2) as F ( X ) .

2.7. Lipschitz Continuity

Lemma 1.
The vector field F ( X ) satisfies a local Lipschitz condition on any bounded domain, D, in R 5 .
Proof. 
We analyze each component of F ( X ) separately:
  • For F 1 ( X ) = ( 1 U M ) R 0 ( E G 0 + S I · I ) G :
    F 1 G = ( E G 0 + S I · I ) , F 1 I = S I · G , F 1 S I = I · G , F 1 U M = R 0 , F 1 B = 0 .
  • For F 2 ( X ) = B σ G 2 α + G 2 K I :
    F 2 G = B σ 2 G α ( α + G 2 ) 2 , F 2 I = K , F 2 B = σ G 2 α + G 2 , F 2 S I = F 2 U M = 0 .
  • For F 3 ( X ) = ( d 0 + r 1 G r 2 G 2 ) B :
    F 3 G = ( r 1 2 r 2 G ) B , F 3 B = d 0 + r 1 G r 2 G 2 , F 3 I = F 3 S I = F 3 U M = 0 .
  • For F 4 ( X ) = c S I + d s U M :
    F 4 S I = c , F 4 U M = d s , F 4 G = F 4 I = F 4 B = 0 .
  • For F 5 ( X ) = d u U M :
F 5 U M = d u , F 5 G = F 5 I = F 5 B = F 5 S I = 0 .
On any bounded domain D R 5 , all partial derivatives are bounded. Let M i be the bound for the partial derivatives of F i on D. By the Mean Value Theorem, for any X , Y D :
| F i ( X ) F i ( Y ) | M i X Y .
Taking L = max { M 1 , M 2 , M 3 , M 4 , M 5 } , we have:
F ( X ) F ( Y ) L X Y .
This establishes that F is locally Lipschitz continuous. □

2.8. Existence and Uniqueness

Theorem 1.
For any initial condition X ( 0 ) = X 0 R 5 , there exists a unique local solution to the ODE system.
Proof. 
By the Picard–Lindelöf theorem, since F ( X ) is continuous and locally Lipschitz, for any initial condition X ( 0 ) = X 0 , there exists T > 0 and a unique solution X : [ 0 , T ] R 5 such that:
X ( 0 ) = X 0 , d X d t = F ( X ) for all t [ 0 , T ] .
Lemma 2 (Invariance of the Non-negative Orthant).
Let D = { X = ( G , I , B , S I , U M ) R 5 G , I , B , S I , U M 0 } . If X 0 D , then X ( t ) D for all t [ 0 , T ] where X ( t ) is defined.
Proof. 
We analyze each component:
  • For U M : Equation d U M d t = d u U M has the explicit solution U M ( t ) = U M ( 0 ) e d u t . If U M ( 0 ) 0 , then U M ( t ) 0 for all t 0 .
  • For S I : The equation d S I d t = c S I + d s U M with U M ( t ) 0 has the solution:
    S I ( t ) = S I ( 0 ) e c t + 0 t d s e c ( t s )   U M ( s ) d s .
    If S I ( 0 ) 0 , then S I ( t ) 0 for all t 0 .
  • For B: If B ( 0 ) = 0 , then d B d t = 0 , so B ( t ) = 0 for all t. If B ( 0 ) > 0 , then B ( t ) > 0 for small t > 0 . If B ever reaches 0 at some time t 1 , then d B d t | t = t 1 = 0 , so B cannot become negative.
  • For I: If I ( 0 ) = 0 , then d I d t = B σ G 2 α + G 2 0 (assuming B , G 0 ), so I cannot become negative. If I ( 0 ) > 0 , then I ( t ) > 0 for small t > 0 . If I ever reaches 0 at some time t 1 , then d I d t | t = t 1 0 , so I cannot become negative.
  • For G: A similar analysis shows that G cannot become negative if G ( 0 ) 0 .
Therefore, the non-negative orthant D is invariant under the flow of the system. □

2.9. Boundedness and Global Existence

Theorem 2.
Under biologically reasonable parameter constraints ( d u , c , E G 0 , K , d 0 , r 1 , r 2 > 0 ), all solutions of the ODE system are bounded and exist globally (for all t 0 ).
Proof. 
We establish bounds for each component:
  • For U M ( t ) : The explicit solution U M ( t ) = U m 0 e d u t gives:
    0 U M ( t ) U m 0 for all t 0 .
  • For S I ( t ) : Using the variation of constants formula with the bounded input U M ( t ) :
    S I ( t ) = S I ( 0 ) e c t + 0 t d s e c ( t s )   U M ( s ) d s S I ( 0 ) e c t + d s U m 0 c ( 1 e c t ) .
    As t , S I ( t ) is bounded by max { S I ( 0 ) , d s U m 0 c } .
  • For G ( t ) : When G is sufficiently large, specifically if G > ( 1 U M ) R 0 E G 0 (assuming S I I 0 ), then d G d t < 0 . This creates an upper bound:
    G ( t ) max G ( 0 ) , R 0 E G 0 for all t 0 .
  • For I ( t ) : The term G 2 α + G 2 is bounded between 0 and 1. If I > B σ K , then d I d t < 0 . With B ( t ) bounded by some B m a x , we have:
    I ( t ) max I ( 0 ) , B m a x σ K for all t 0 .
  • For B ( t ) : If r 2 > 0 and G are sufficiently large, specifically if G > r 1 + r 1 2 4 d 0 r 2 2 r 2 , then d B d t < 0 . With G ( t ) bounded, B ( t ) is also bounded.
Since all state variables remain bounded for all t 0 , solutions cannot blow up in finite time. By standard extension theorems for ODEs, the local solution extends to a global one defined for all t 0 . □

2.10. Continuous Dependence

Theorem 3.
Solutions of the ODE system depend continuously on initial conditions and parameters.
Proof. 
For solutions X ( t ) and Y ( t ) with initial conditions X ( 0 ) and Y ( 0 ) , by Gronwall’s inequality:
X ( t ) Y ( t ) X ( 0 ) Y ( 0 ) e L t .
where L is the Lipschitz constant of F on the relevant domain.
This shows that for any ε > 0 and T > 0 , we can choose δ = ε e L T such that if X ( 0 ) Y ( 0 ) < δ , then X ( t ) Y ( t ) < ε for all t [ 0 , T ] . Similarly, if we denote the parameter vector as p = ( R 0 , E G 0 , σ , α , K , d 0 , r 1 , r 2 , c , d u , U m 0 ) and write the system as d X d t = F ( X , p ) , then for solutions X ( t , p 1 ) and X ( t , p 2 ) with the same initial condition but different parameter vectors,
X ( t , p 1 ) X ( t , p 2 ) C p 1 p 2 ( e L t 1 ) ,
for some constant C > 0 . This establishes continuous dependence on both initial conditions and the parameters. □

2.11. Well-Posedness

Theorem 4 (Well-Posedness).
The given ODE system is well-posed under biologically reasonable parameter constraints ( d u , c , E G 0 , K , d 0 , r 1 , r 2 > 0 ).
Proof. 
We have established:
  • Existence and Uniqueness: For any non-negative initial condition, there exists a unique solution.
  • Global Existence: Solutions exist for all t 0 and remain bounded.
  • Continuous Dependence: Solutions depend continuously on initial conditions and parameters.
These three properties together constitute the well-posedness of the ODE system. □
Remark 2.
The well-posedness established here ensures that the mathematical model is suitable for describing biological phenomena, with predictable behavior and controlled sensitivity to initial conditions and parameters.

2.12. Stability Analysis

Again, we denote the state vector X ( t ) = ( G ( t ) , I ( t ) , B ( t ) , S I ( t ) , U M ( t ) ) T and the right-hand side of the system (2) as F ( X ) .

2.13. Equilibrium Points

To find the equilibrium points, we set all derivatives to zero and solve the resulting system of algebraic equations. From the U M equation:
d U M d t = 0 d u U M = 0 U M = 0 ,
From the S I equation:
d S I d t = 0 c S I + d s U M = 0 S I = d s U M c = 0 ,
From the B equation:
d B d t = 0 d 0 + r 1 G r 2 G 2 B = 0 ,
This gives us either B = 0 or d 0 + r 1 G r 2 G 2 = 0 . From the I equation:
d I d t = 0 B σ G 2 α + G 2 K I = 0 I = B σ G 2 K ( α + G 2 ) ,
From the G equation:
d G d t = 0 ( 1 U M ) R 0 ( E G 0 + S I I ) G = 0 G = ( 1 U M ) R 0 E G 0 + S I I .

2.14. Characterization of Equilibrium Points

2.14.1. Equilibrium Point E 1

With U M = 0 , S I = 0 , and B = 0 , we get I = 0 and G = R 0 E G 0 . Therefore, our first equilibrium point is:
E 1 = R 0 E G 0 , 0 , 0 , 0 , 0 .

2.14.2. Potential Additional Equilibrium Points

If B 0 , then d 0 + r 1 G r 2 G 2 = 0 , which is a quadratic equation in G with roots:
G ± = r 1 ± r 1 2 4 d 0 r 2 2 r 2 .
For these to be equilibrium points, we need G ± = R 0 E G 0 , which imposes specific constraints on the parameters. If these constraints are satisfied, we could have additional equilibrium points with B 0 .

2.15. Local Stability Analysis

2.15.1. Linearization Around Equilibrium Points

The Jacobian matrix of the system (2) is:
J = E G 0 S I I G S I 0 G I R 0 2 B G σ α ( G 2 + α ) 2 K G 2 σ G 2 + α 0 0 B ( r 1 2 r 2 G ) 0 d 0 + r 1 G r 2 G 2 0 0 0 0 0 c d s 0 0 0 0 d u .

2.15.2. Stability of Equilibrium Point E 1

At E 1 = R 0 E G 0 , 0 , 0 , 0 , 0 , the Jacobian becomes:
J ( E 1 ) = E G 0 0 0 0 R 0 0 K R 0 2 σ E G 0 2 ( α + R 0 2 E G 0 2 ) 0 0 0 0 d 0 + r 1 R 0 E G 0 r 2 R 0 2 E G 0 2 0 0 0 0 0 c d s 0 0 0 0 d u ,
The eigenvalues of J ( E 1 ) are:
λ 1 = E G 0 ,
λ 2 = K ,
λ 3 = d 0 + r 1 R 0 E G 0 r 2 R 0 2 E G 0 2 ,
λ 4 = c ,
λ 5 = d u .
Since E G 0 , K, c, and d u are positive parameters, four of the eigenvalues are always negative. The stability of X 1 depends on the sign of λ 3 .

2.15.3. Stability Conditions for Equilibrium Point E 1

The eigenvalue λ 3 can be rewritten as:
λ 3 = d 0 + r 1 R 0 E G 0 r 2 R 0 2 E G 0 2 ,
= d 0 + r 1 G 1 r 2 G 1 2 .
where G 1 = R 0 E G 0 .
This is the same as evaluating the quadratic function q ( G ) = d 0 + r 1 G r 2 G 2 at G = G 1 . The roots of q ( G ) = 0 are precisely G ± = r 1 ± r 1 2 4 d 0 r 2 2 r 2 . Since r 2 > 0 (biologically reasonable), the quadratic q ( G ) is negative when G is between its roots and positive otherwise. Therefore:
Theorem 5 (Stability of Equilibrium Point E 1 ).
The equilibrium point E 1 = R 0 E G 0 , 0 , 0 , 0 , 0 is asymptotically stable if and only if:
r 1 r 1 2 4 d 0 r 2 2 r 2 < R 0 E G 0 < r 1 + r 1 2 4 d 0 r 2 2 r 2 .
assuming that the lower bound is positive.

2.15.4. Potential Additional Equilibrium Points

For the potential equilibrium points where G = G ± , one eigenvalue is identically zero by construction, since
d 0 + r 1 G ± r 2 G ± 2 = 0 .
As a result, these equilibrium points are non-hyperbolic, and their stability cannot be determined through linearization alone. However, under appropriate conditions, the stability of these nontrivial equilibrium points can be rigorously analyzed using center manifold theory.
Theorem 6.
Consider the extended Beta-cell–Insulin–Glucose (BIG) model with metformin dynamics given by the system:
d G d t = ( 1 U M ) R 0 ( E G 0 + S I · I ) G , d I d t = B · σ · G 2 α + G 2 K I , d B d t = ( d 0 + r 1 G r 2 G 2 ) B , d S I d t = c · S I + d s · U M , d U M d t = d u · U M ,
with all parameters positive. Let
G + : = r 1 + r 1 2 4 d 0 r 2 2 r 2
denote the larger root of the quadratic equation associated with the beta-cell turnover, and define the nontrivial equilibrium point:
E 2 : = G + , B σ G + 2 K ( α + G + 2 ) , B , 0 , 0 , B > 0 .
Then the following holds:
1. 
The Jacobian matrix evaluated at E 2 has one zero eigenvalue and four strictly negative eigenvalues. Thus, E 2 is non-hyperbolic, with a one-dimensional center subspace in the B-direction.
2. 
By the Center Manifold Theorem, there exists a one-dimensional center manifold W c passing through E 2 , locally expressible as:
G ( B ) = G + + a 1 B + a 2 B 2 + ,
where a 1 R is the first-order expansion coefficient.
3. 
The reduced dynamics on W c is given by:
d B d t = a 1 · r 1 2 4 d 0 r 2 · B 2 + O ( B 3 ) .
4. 
The sign of a 1 determines the local stability of the equilibrium point:
  • If a 1 > 0 , then d B d t < 0 and E 2 is locally asymptotically stable;
  • If a 1 < 0 , then d B d t > 0 and E 2 is unstable;
  • If a 1 = 0 , higher-order terms must be considered.
Proof. 
Let the vector field be denoted x = F ( x ) with x = ( G , I , B , S I , U M ) T R 5 , and consider the equilibrium point E 2 . Linearizing around E 2 , we find:
λ = 0 , E G 0 , K , c , d u ,
showing a one-dimensional center subspace. According to the Center Manifold Theorem, a locally invariant manifold W c exists and is tangent to the center subspace. Assuming a local expansion:
G ( B ) = G + + a 1 B + a 2 B 2 + ,
we substitute into:
d B d t = ( d 0 + r 1 G ( B ) r 2 G ( B ) 2 ) B ,
and use the identity:
d 0 + r 1 G + r 2 G + 2 = 0 ,
to obtain:
d B d t = ( r 1 2 r 2 G + ) a 1 r 2 a 1 2 B + B 2 = a 1 · r 1 2 4 d 0 r 2 · B 2 + O ( B 3 ) .
The sign of a 1 governs the behavior. This completes the proof. □
Building on the proposed model and the mathematical foundations presented within the aforementioned theories, the Results section examines the corresponding mathematical and numerical outcomes.

3. Results

This section presents a comprehensive series of mathematical and computer simulation outcomes to investigate the dynamic effects of metformin on glucose regulation. The analysis begins from a broad global stability and bifurcation analysis and continues to the physiological perspective, illustrating time-dependent changes in glucose concentration, insulin levels, beta-cell mass, insulin sensitivity, and metformin exposure under treated and untreated conditions for a prolonged duration of treatment. Subsequently, the mathematical model is validated by comparing predicted glucose concentrations with available clinical data. The accuracy and limitations of the model are further assessed by a thorough residual analysis. Finally, sensitivity analysis is performed to evaluate the impact of variations in metformin-related parameters on glucose dynamics, providing insight into the reliability of the proposed model consistent with its demonstrated well-posedness and stability.

3.1. Mathematical Results

We can decompose the system into subsystems for analysis:
  • U M Subsystem The equation d U M d t = d u U M has the explicit solution U M ( t ) = U M ( 0 ) e d u t . For d u > 0 , U M ( t ) 0 as t , regardless of the initial condition. Therefore, the U M subsystem is globally asymptotically stable with equilibrium U M = 0 .
  • S I Subsystem With U M ( t ) 0 , the equation d S I d t = c S I + d s U M becomes approximately d S I d t c S I for large t. For c > 0 , S I ( t ) 0 as t , regardless of the initial condition. Therefore, the S I subsystem is also globally asymptotically stable with equilibrium S I = 0 .
  • B-I-G Subsystem
    With U M = 0 and S I = 0 for large t, we have:
    d G d t = R 0 E G 0 G ,
    d I d t = B σ G 2 α + G 2 K I ,
    d B d t = ( d 0 + r 1 G r 2 G 2 ) B .

3.1.1. Lyapunov Function Approach

For the G equation with U M = 0 and S I = 0 , we can construct a Lyapunov function:
V ( G ) = 1 2 ( G G ) 2 .
where G = R 0 E G 0 . The derivative of V along trajectories is:
d V d t = ( G G ) d G d t ,
= ( G G ) ( R 0 E G 0 G ) ,
= ( G G ) R 0 E G 0 G ( G G ) ,
= ( G G ) ( R 0 E G 0 G ) E G 0 ( G G ) 2 ,
= E G 0 ( G G ) 2 .
For E G 0 > 0 , d V d t < 0 for all G G , indicating global asymptotic stability of G = R 0 E G 0 .

3.1.2. Long-Term Behavior Analysis

For the full system, we have several possibilities depending on the following parameters:
Case 1: r 1 r 1 2 4 d 0 r 2 2 r 2 < R 0 E G 0 < r 1 + r 1 2 4 d 0 r 2 2 r 2
In this case:
  • The equilibrium E 1 = R 0 E G 0 , 0 , 0 , 0 , 0 is locally asymptotically stable.
  • For the B equation: d B d t = ( d 0 + r 1 G r 2 G 2 ) B .
  • With G R 0 E G 0 , we have d B d t < 0 when B > 0 .
  • Therefore, B ( t ) 0 as t .
  • With B 0 , we have I ( t ) 0 as t .
  • The equilibrium E 1 appears to be globally asymptotically stable in this case.
Case 2: R 0 E G 0 > r 1 + r 1 2 4 d 0 r 2 2 r 2
In this case:
  • The equilibrium E 1 is unstable.
  • For the B equation: d B d t = ( d 0 + r 1 G r 2 G 2 ) B .
  • With G R 0 E G 0 , we have d B d t > 0 when B > 0 .
  • B ( t ) grows without bound, which is biologically unrealistic.
  • This suggests model limitations or the existence of other equilibria not captured in our analysis.
Case 3: 0 < R 0 E G 0 < r 1 r 1 2 4 d 0 r 2 2 r 2 (if positive)
This case is similar to Case 2, with the equilibrium E 1 being unstable.

3.1.3. Bifurcation Analysis

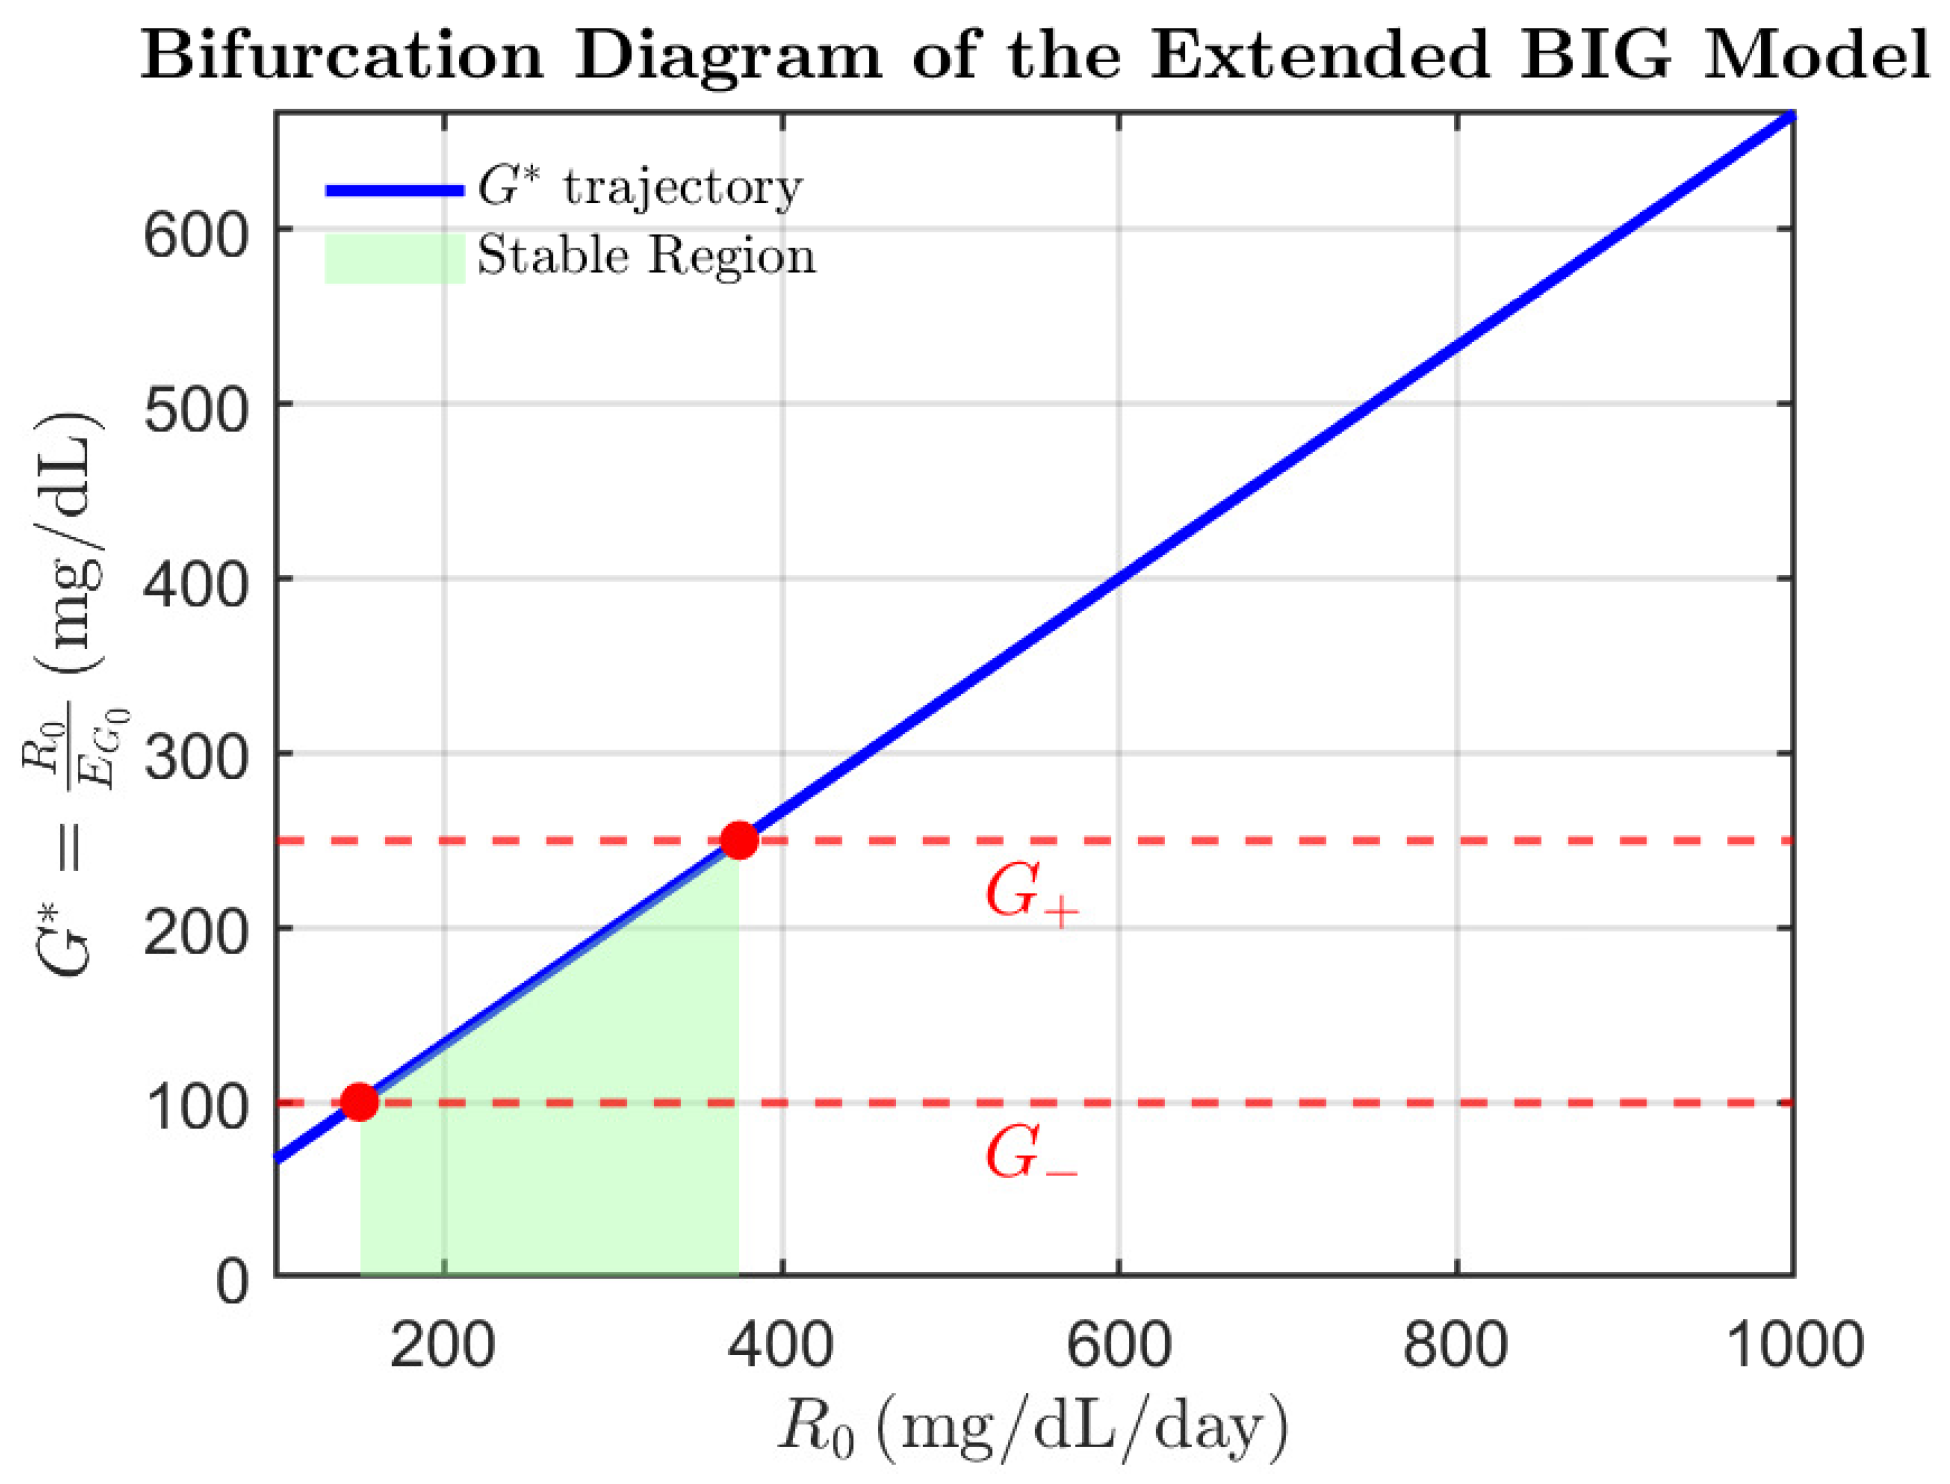
According to the discussions above, the system undergoes a saddle-node bifurcation when R 0 E G 0 passes through either of the critical values G ± = r 1 ± r 1 2 4 d 0 r 2 2 r 2 . At these bifurcation points:
  • One eigenvalue of the Jacobian becomes zero.
  • The equilibrium point changes stability.
  • In the case where R 0 E G 0 = G + or R 0 E G 0 = G , the equilibrium point is non-hyperbolic.
  • The dynamics on the center manifold typically exhibit saddle-node bifurcation behavior.

3.1.4. Summary of Stability and Bifurcation Analysis

  • Equilibrium Point:   E 1 = R 0 E G 0 , 0 , 0 , 0 , 0
    • Asymptotically stable if r 1 r 1 2 4 d 0 r 2 2 r 2 < R 0 E G 0 < r 1 + r 1 2 4 d 0 r 2 2 r 2 .
    • Unstable if R 0 E G 0 > r 1 + r 1 2 4 d 0 r 2 2 r 2 or R 0 E G 0 < r 1 r 1 2 4 d 0 r 2 2 r 2 (if positive).
    • This represents a state with no insulin and no beta-cells, where glucose is at a baseline level.
  • Global Stability:
    • The system components U M and S I always converge to 0 globally.
    • For the G-I-B subsystem, global stability depends on the relationship between R 0 E G 0 and the roots of d 0 + r 1 G r 2 G 2 = 0 .
    • When r 1 r 1 2 4 d 0 r 2 2 r 2 < R 0 E G 0 < r 1 + r 1 2 4 d 0 r 2 2 r 2 , the equilibrium X 1 appears to be globally asymptotically stable.
  • Bifurcations:
    • The system undergoes saddle-node bifurcations when R 0 E G 0 is equal to r 1 + r 1 2 4 d 0 r 2 2 r 2 or r 1 r 1 2 4 d 0 r 2 2 r 2 .
    • These bifurcations represent critical transitions in the system’s dynamics.

3.1.5. Biological Implications: Stability Analysis

The parameter R 0 in our model denotes the glucose production rate at zero glucose concentration. We propose a conceptual reproduction threshold, also denoted by R 0 , which captures the balance between glucose production and utilization, drawing inspiration from epidemiological modeling. In this context, we define:
R 0 = R 0 E G 0 G crit ,
where R 0 is the baseline glucose production rate, E G 0 is the insulin-independent glucose uptake rate, and G crit is a critical glucose concentration threshold beyond which pathological hyperglycemia emerges, often associated with the breakdown of beta-cell feedback mechanisms.
Alternatively, since the equilibrium glucose concentration at the pathological state E 1 is given by G = R 0 E G 0 , we can reformulate the reproduction threshold as:
R 0 : = G G th , where G th = r 1 + r 1 2 4 d 0 r 2 2 r 2 .
The threshold G th corresponds to the upper bifurcation boundary identified in our stability analysis and represents the critical tipping point beyond which beta-cell mass collapses.
  • Stability Criterion: When R 0 < 1 , i.e., G < G th , the system converges to the asymptotically stable equilibrium E 1 characterized by vanishing beta-cell mass. In contrast, if R 0 > 1 , the equilibrium becomes unstable, and the system may transition toward unbounded growth or oscillatory dynamics. This outcome is consistent with the results of our bifurcation and Lyapunov-based analysis but recasts the condition within a more intuitive, threshold-based epidemiological framework.

3.1.6. Biological Implications: Bifurcation

The stability analysis identifies parameter regimes in which the system maintains metabolic homeostasis, as well as critical thresholds where qualitative changes in system behavior emerge. These transitions may correspond to physiological shifts between normoglycemic and diabetic states. In particular, stability hinges on the balance between hepatic glucose production ( R 0 ) and utilization ( E G 0 ). When the ratio G = R 0 E G 0 remains within a critical range determined by the beta-cell dynamic parameters ( d 0 , r 1 , r 2 ), the system stabilizes at a glucose concentration that does not require active insulin secretion or functional beta-cell mass. However, deviations from this range can destabilize the equilibrium, potentially leading to pathological trajectories.
A bifurcation as shown in Figure 2, occurs when the equilibrium glucose concentration, given by G = R 0 E G 0 , intersects key threshold values defined by the roots of the beta-cell dynamic equation d 0 + r 1 G r 2 G 2 = 0 . This yields the critical points:
G ± = r 1 ± r 1 2 4 d 0 r 2 2 r 2 ,
which delineate the boundaries between physiologically distinct regimes.
When G ( G , G + ) , beta-cell proliferation and apoptosis are balanced, and the system converges to a pathological equilibrium E 1 , characterized by the depletion of beta-cell mass (B), insulin concentration (I), and insulin sensitivity ( S I ). This regime may correspond to late-stage Type 2 Diabetes Mellitus (T2DM), where endogenous insulin production is insufficient to maintain homeostasis.
In contrast, when G > G + , the system transitions out of the stable domain. This may result in unbounded beta-cell proliferation or the emergence of alternative equilibria with sustained insulin output and non-zero B. Such responses could represent early-stage compensatory mechanisms aimed at counteracting hyperglycemia, or, if unregulated, could give rise to physiologically implausible dynamics.
These bifurcation thresholds thus serve as critical indicators of disease progression. Surpassing them may signify a transition beyond the effective range of standard therapies such as metformin, underscoring the importance of early detection and targeted intervention strategies to maintain or restore glycemic control.
Together, subsequent simulations provide a comprehensive understanding of the role of metformin in glycemic regulation and the strengths and weaknesses of the proposed mathematical framework.

3.2. Computational Results

3.2.1. The Metformin-Integrated Model States Analysis

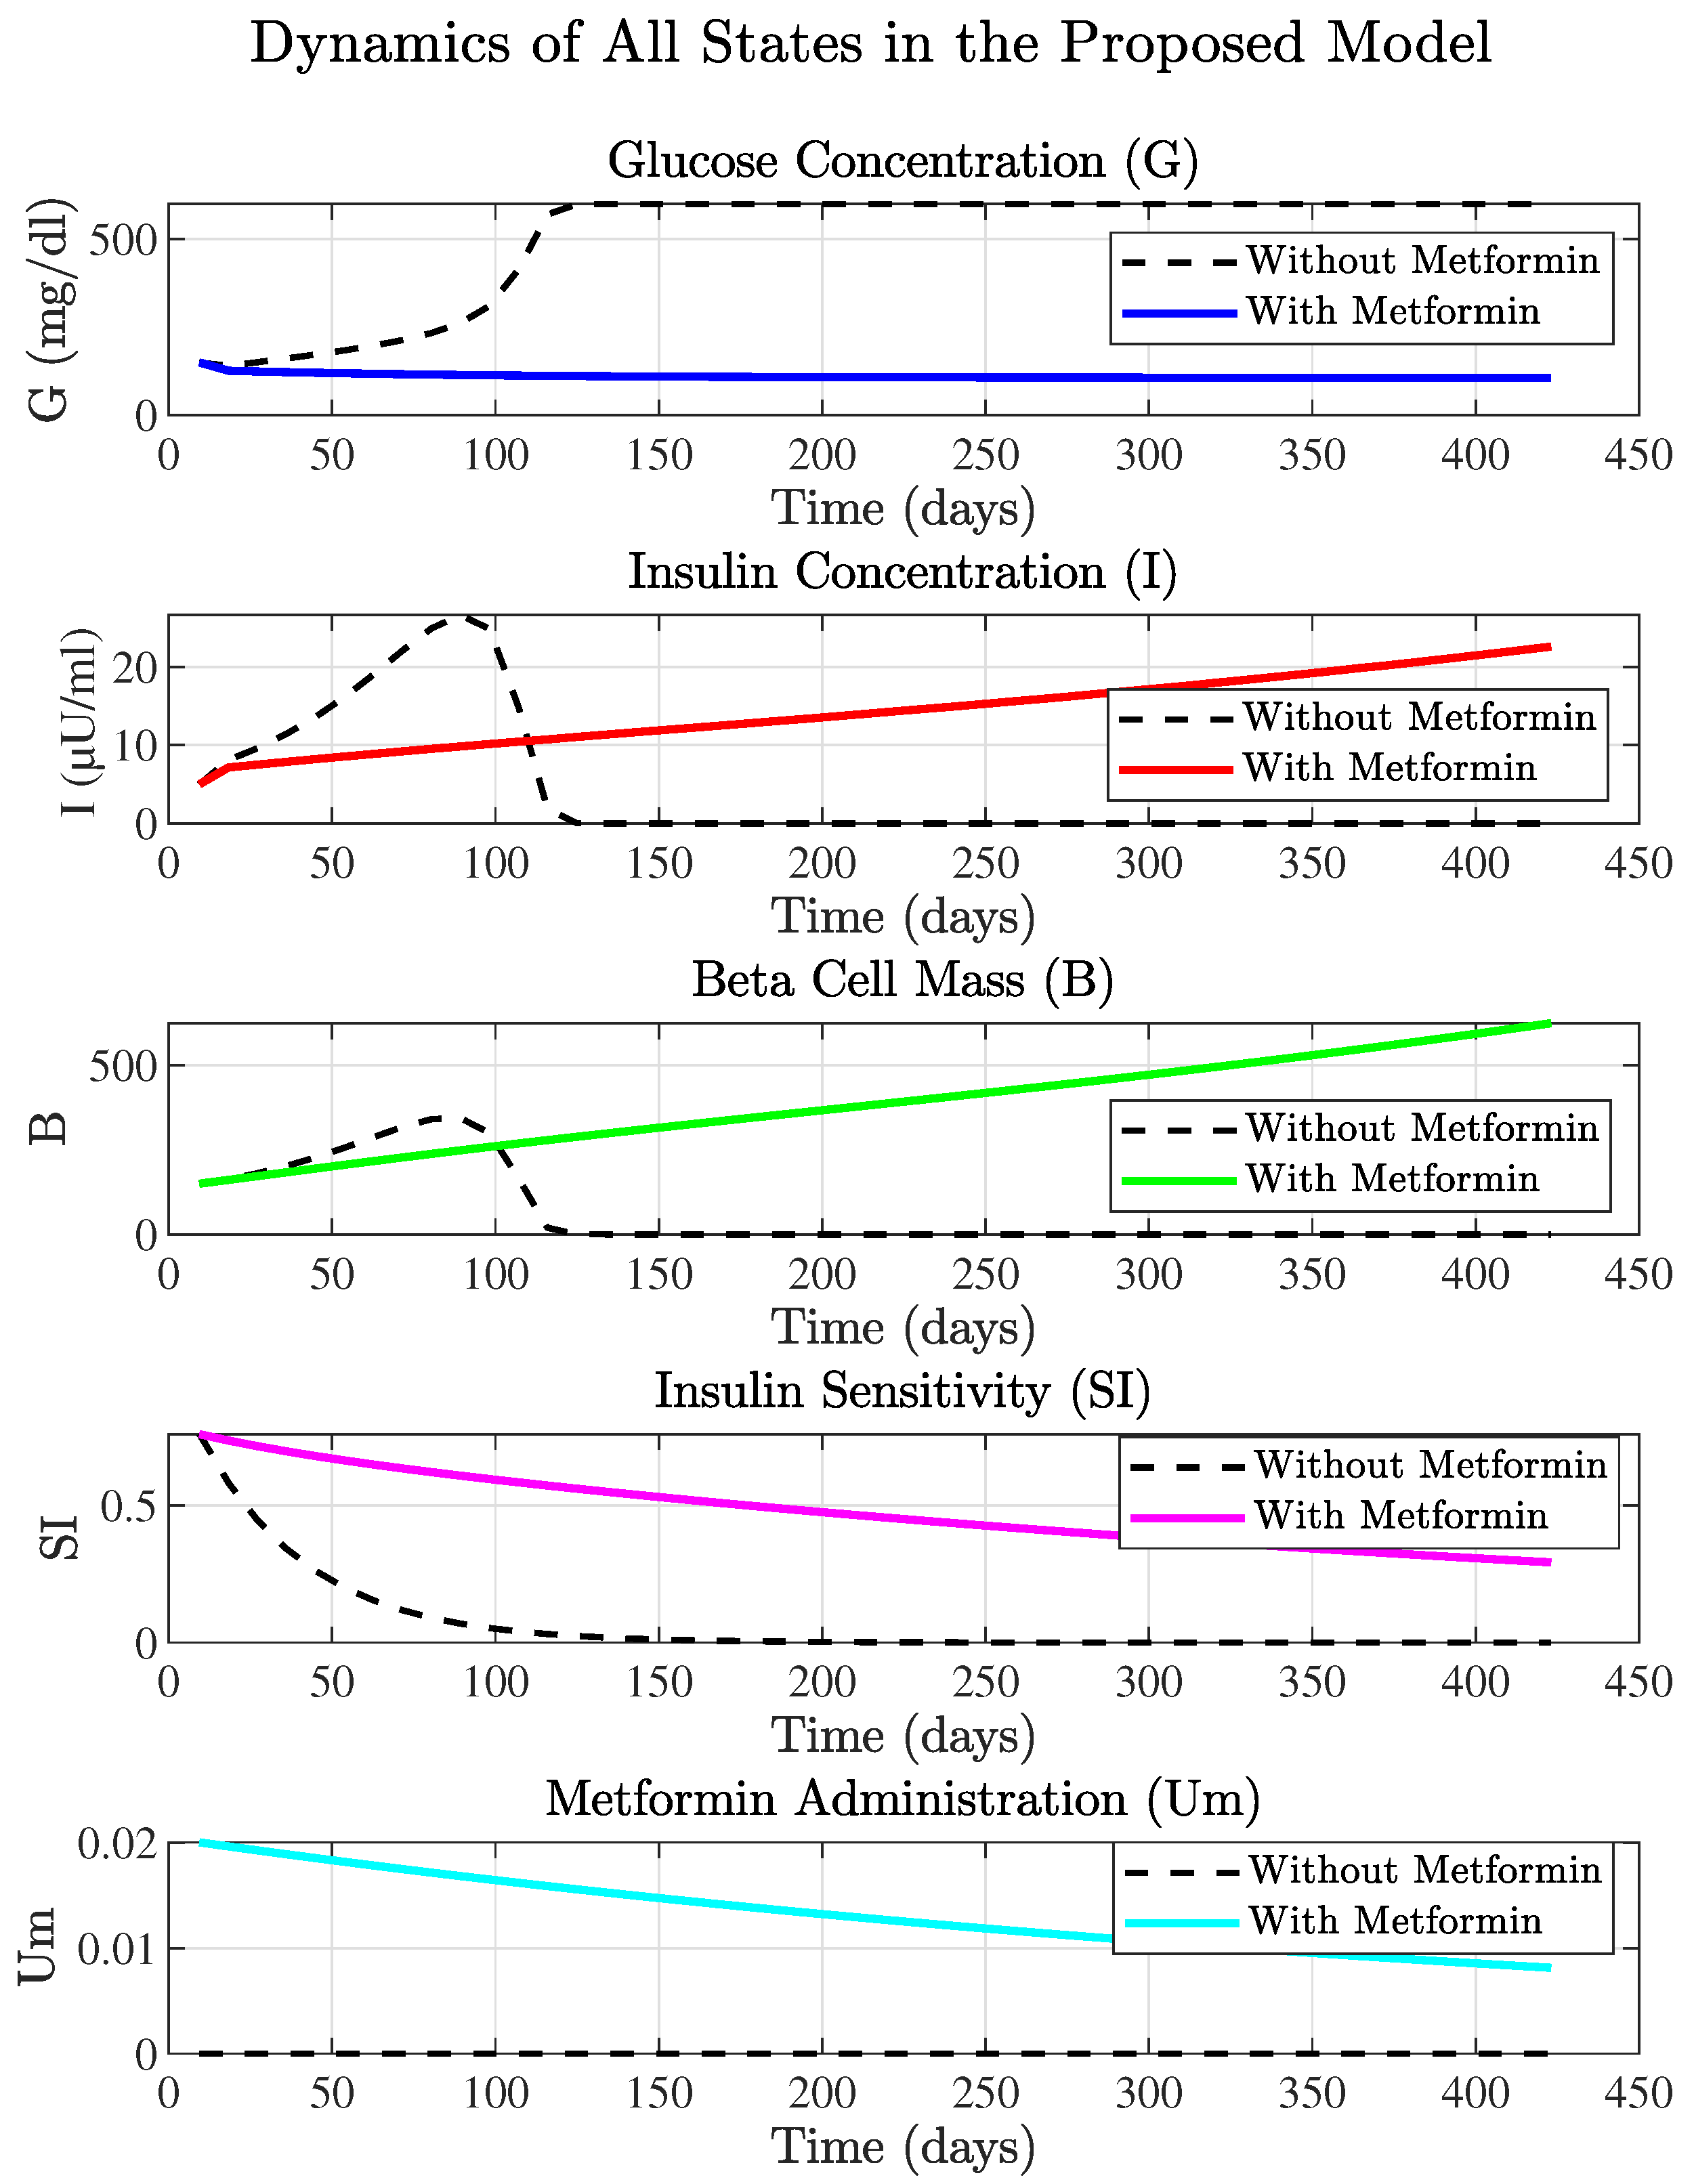
Figure 3 illustrates the dynamic changes of key physiological variables over time in two scenarios: metformin treatment and without metformin treatment.
The first subplot depicts the glucose concentration (G), which shows that metformin significantly stabilizes glucose levels, mitigating the sharp increases observed in the untreated scenario and confirming its glucose-lowering capability. The second subplot represents the insulin concentration (I), showing that metformin administration promotes a stable and controlled increase compared to fluctuations observed without treatment, indicating improved insulin regulation.
The third subplot illustrates beta-cell mass (B), highlighting that metformin treatment sustains a gradual and steady increase in beta-cell mass over time. In contrast, the untreated scenario initially exhibits an increase, followed by a subsequent decline, highlighting the potential protective effects of metformin on pancreatic beta-cells.
The fourth subplot, depicting insulin sensitivity ( S I ), demonstrates a slower decline in insulin sensitivity under metformin treatment compared to the untreated condition, suggesting beneficial effects on insulin resistance. Finally, the fifth subplot shows the concentration of metformin ( U M ), following an expected pharmacokinetic profile characterized by a controlled decrease over time.
Collectively, these results substantiate metformin’s effectiveness in stabilizing glucose homeostasis, enhancing insulin function, preserving beta-cell mass, and moderating insulin resistance. Further refinement of metformin-related parameters to improve the predictive accuracy and therapeutic applicability of the model is detailed in the subsequent subsection.

3.2.2. Metformin Parameter Tuning

To validate the accuracy of the proposed model, key simulation parameters were optimized using clinical data from [36].
The parameter optimization employed a nonlinear least squares fitting technique, iteratively adjusting metformin-specific parameters, particularly the initial metformin concentration ( U m 0 ) and its exponential decay rate ( d u ), to minimize the discrepancy between simulated glucose trajectories and observed clinical data.
Optimization was conducted using MATLAB R2023b’s lsqcurvefit function, with physiologically plausible bounds. The optimized parameter values obtained were U m 0 _ o p t = 0.02 and d u _ o p t = 0.0022 , effectively capturing metformin’s glucose-lowering effects.
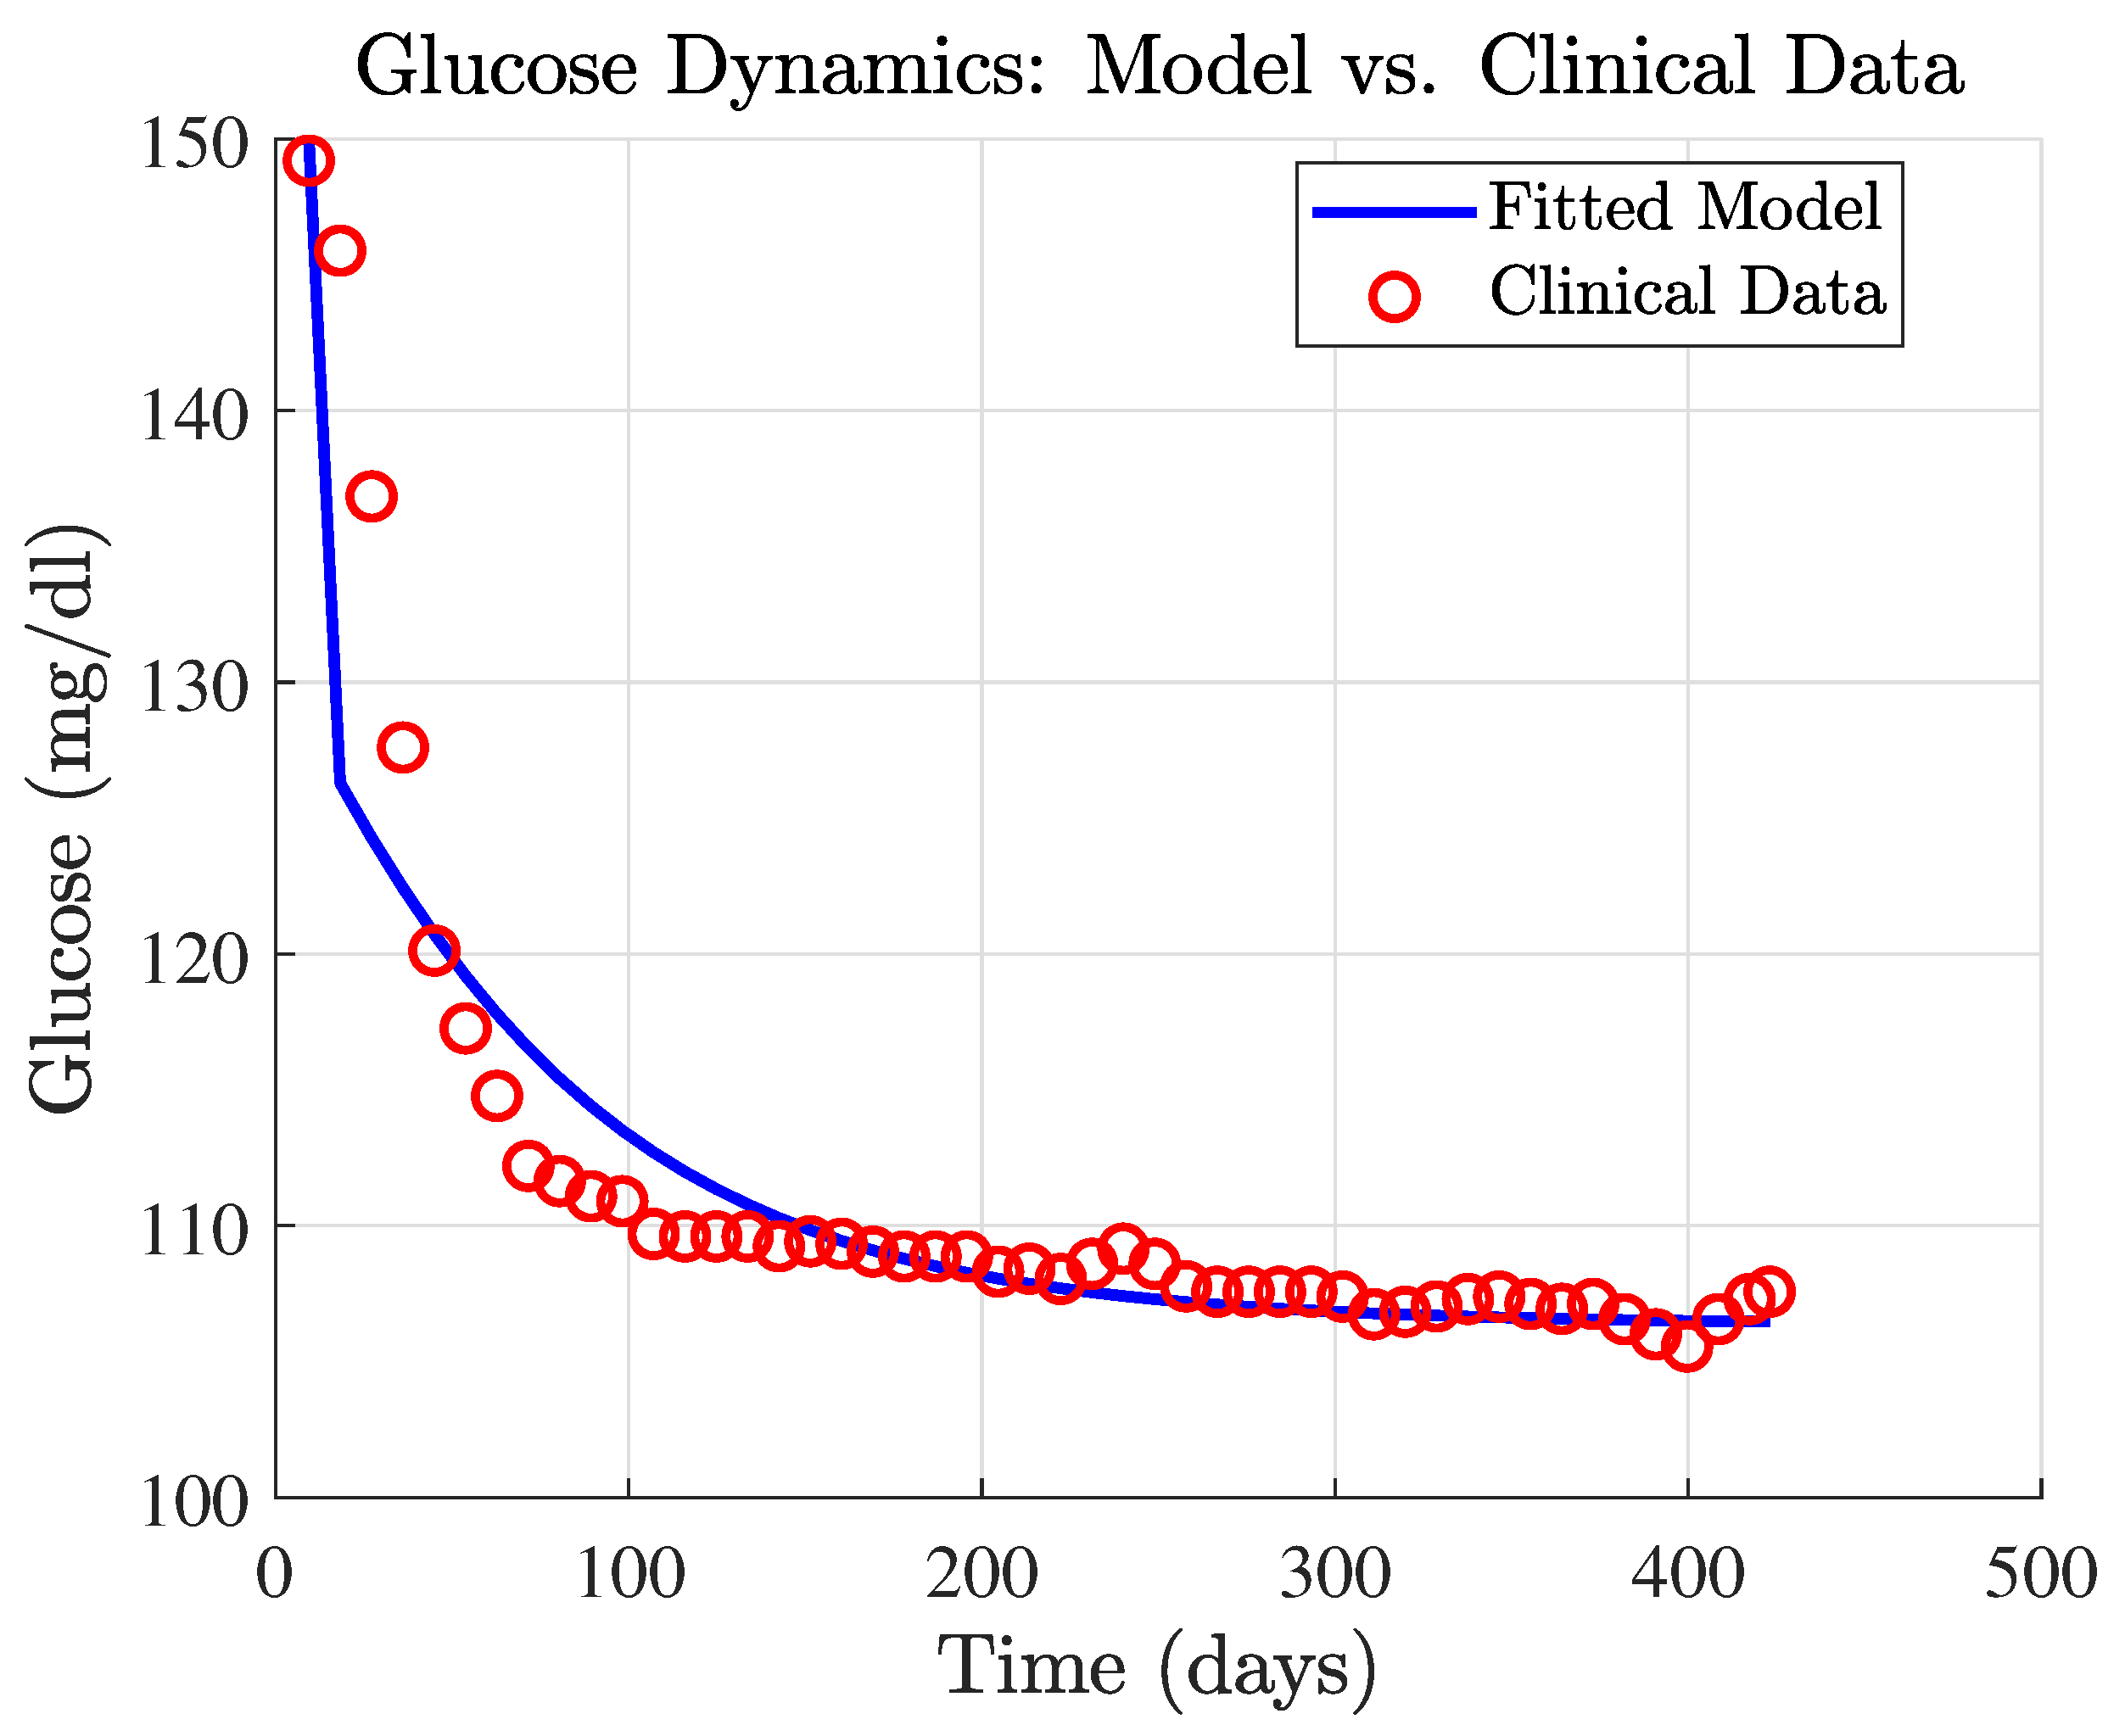
Figure 4 illustrates glucose dynamics over time in response to metformin treatment. The solid blue line represents model predictions, while red circles indicate clinical data points from [36]. Following metformin administration, the simulation demonstrates a rapid initial decrease in glucose levels, subsequently stabilizing over time, closely matching observed clinical outcomes.
Further simulations comparing scenarios with and without metformin clearly illustrate the effectiveness of the treatment in lowering and stabilizing glucose concentrations, in contrast to untreated cases where elevated glucose levels persist.
The strong concordance between simulated and clinical data supports the model’s validity, indicating that optimized metformin parameters accurately reflect its glycemic impact. This refined model forms the foundation for subsequent analyses, including residual and sensitivity assessments.

3.2.3. Residual Analysis of the Metformin Model

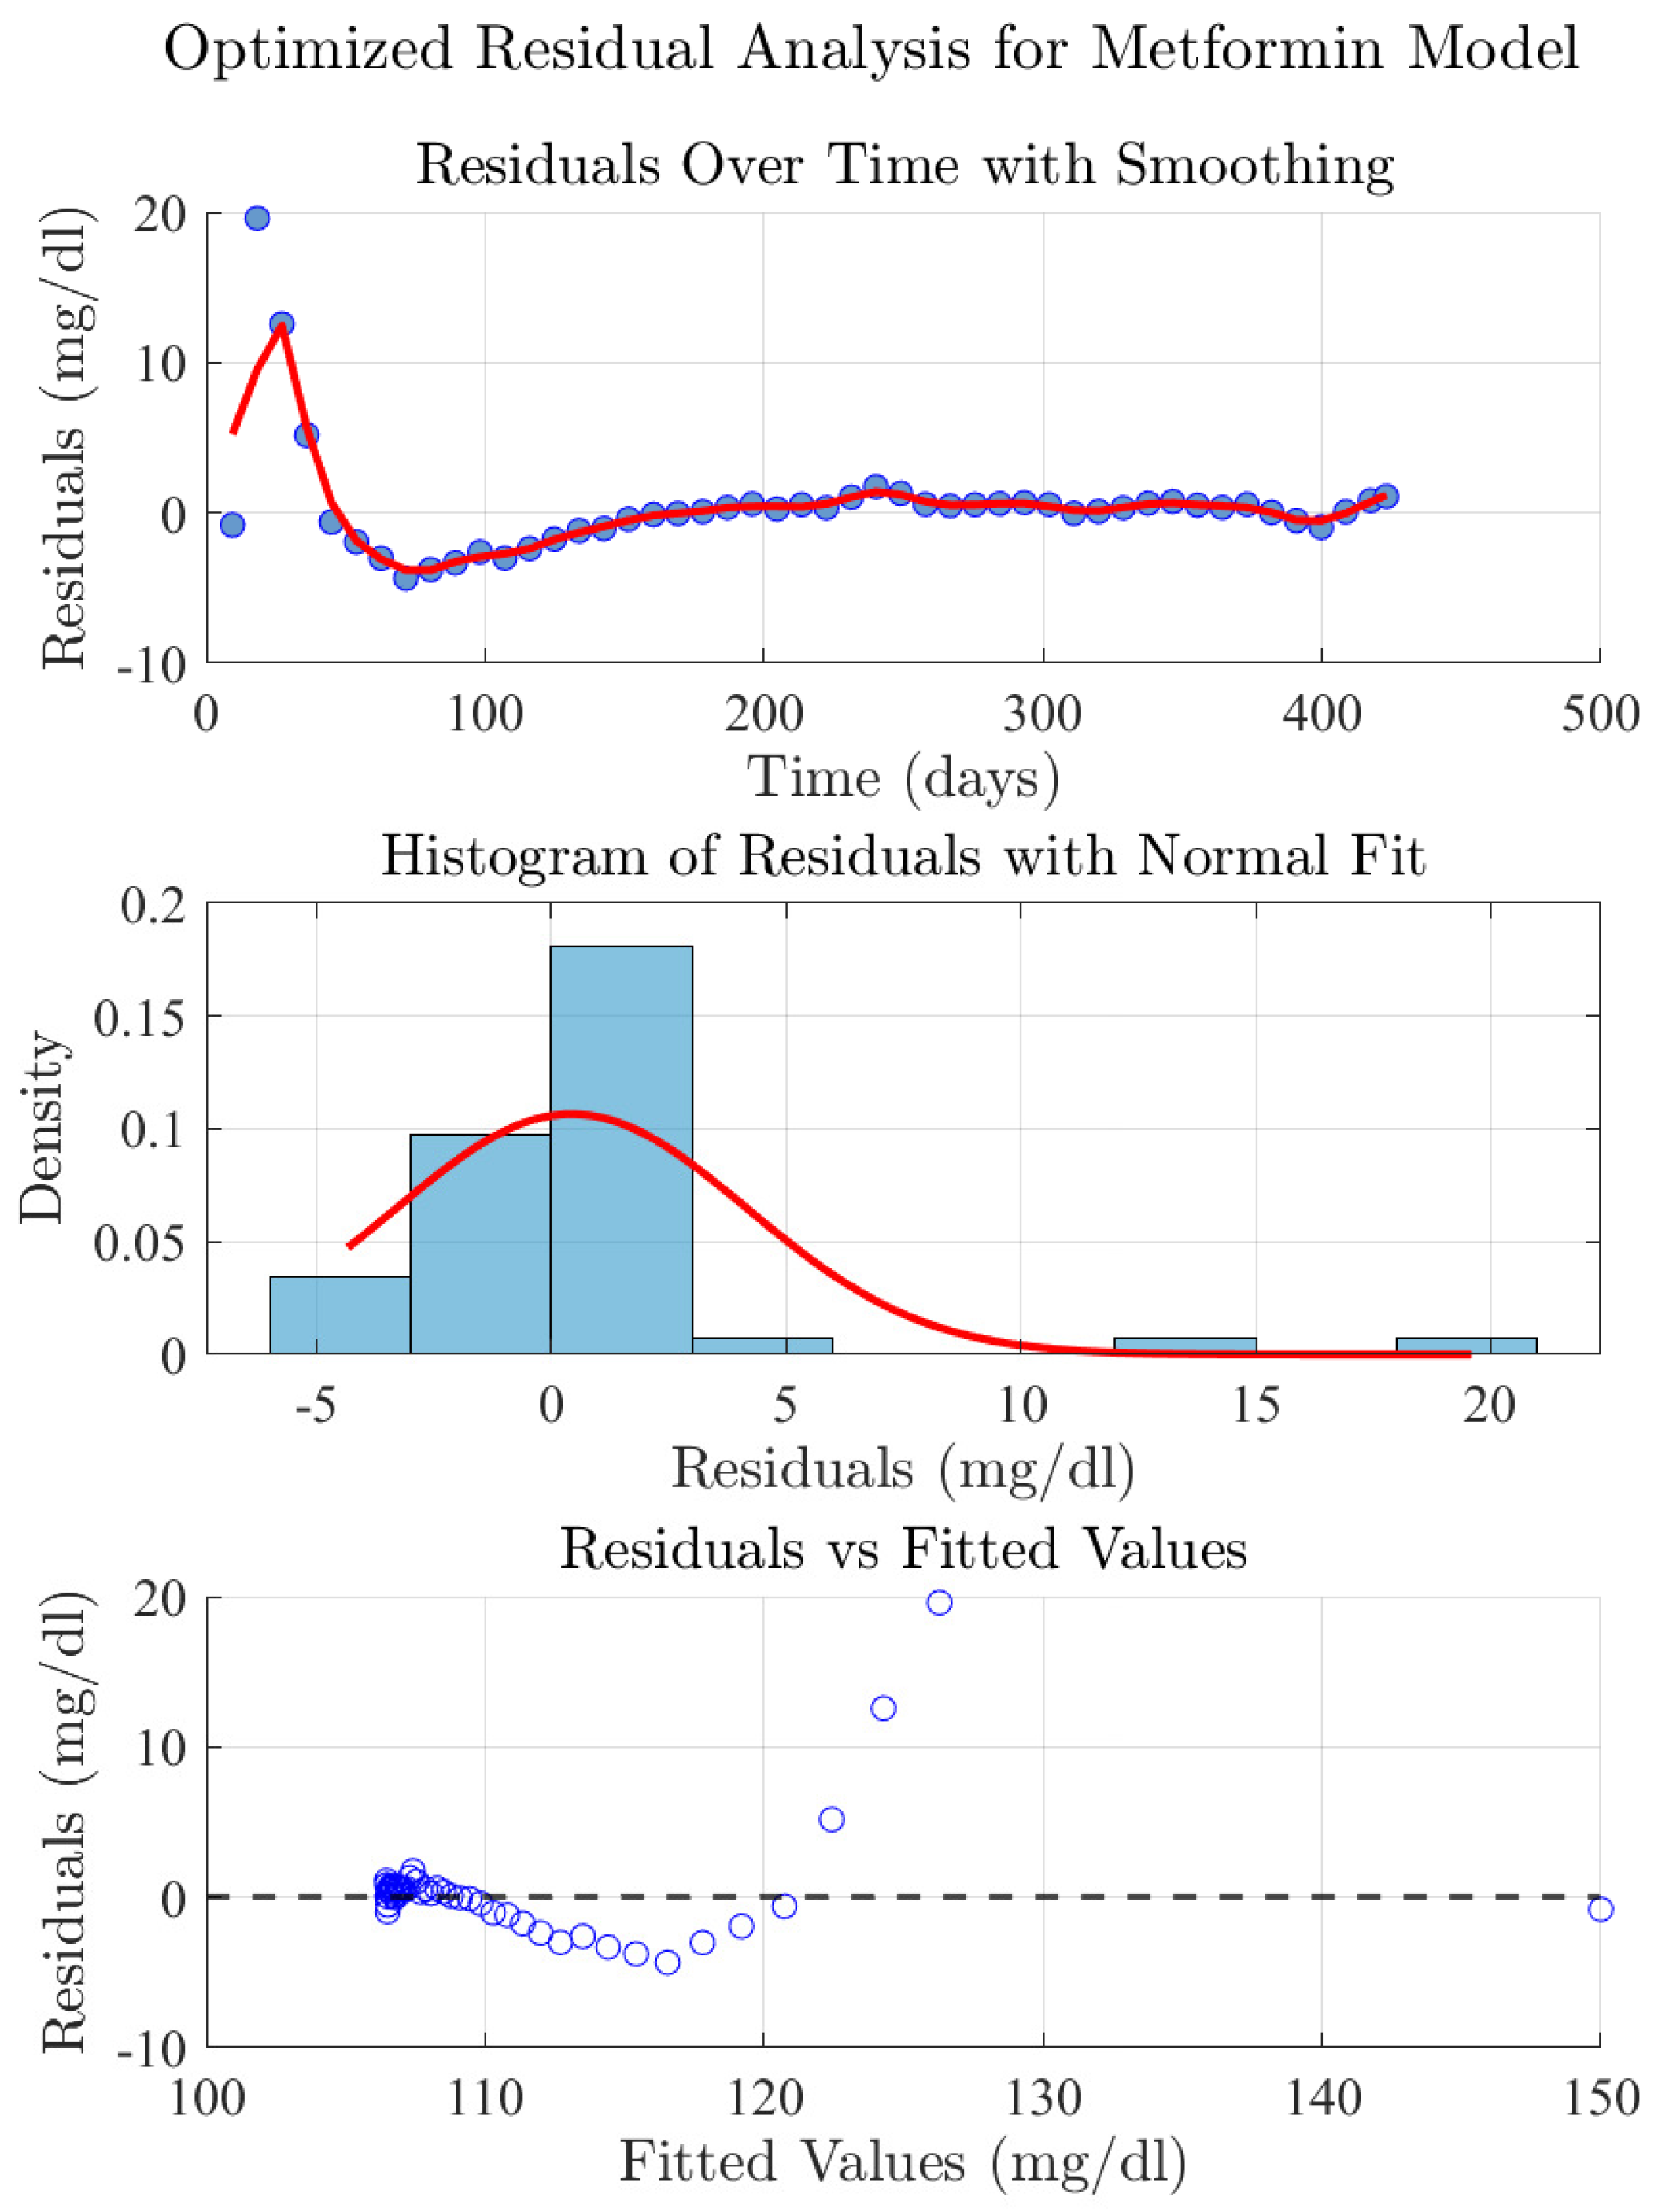
A residual analysis was conducted to evaluate model accuracy and identify potential limitations in the metformin-based glucose regulation model. Residuals, defined as the differences between clinical observations and model predictions, were systematically analyzed using multiple statistical visualizations.
Figure 5 presents key insights from the residual analysis. The top panel displays residuals over time (blue markers) along with a smoothing curve (red), highlighting potential systematic biases across different glucose regulation phases.
The middle panel shows a histogram of residuals with an overlaid normal distribution curve, facilitating assessment of residual normality. Any deviation from normality suggests possible biases or unmodeled physiological dynamics.
The bottom panel plots residuals against predicted glucose values. Patterns here could indicate systematic biases at specific glucose concentrations. Ideally, residuals should be randomly distributed around zero, confirming an unbiased predictive model.
Overall, this residual analysis provides critical insights into the model’s predictive performance. Although the optimized model aligns closely with clinical observations, minor discrepancies in specific glucose ranges suggest room for further refinement. Future research should focus on improving parameter tuning and incorporating additional physiological parameters to enhance predictive accuracy and robustness.

3.2.4. Sensitivity Analysis

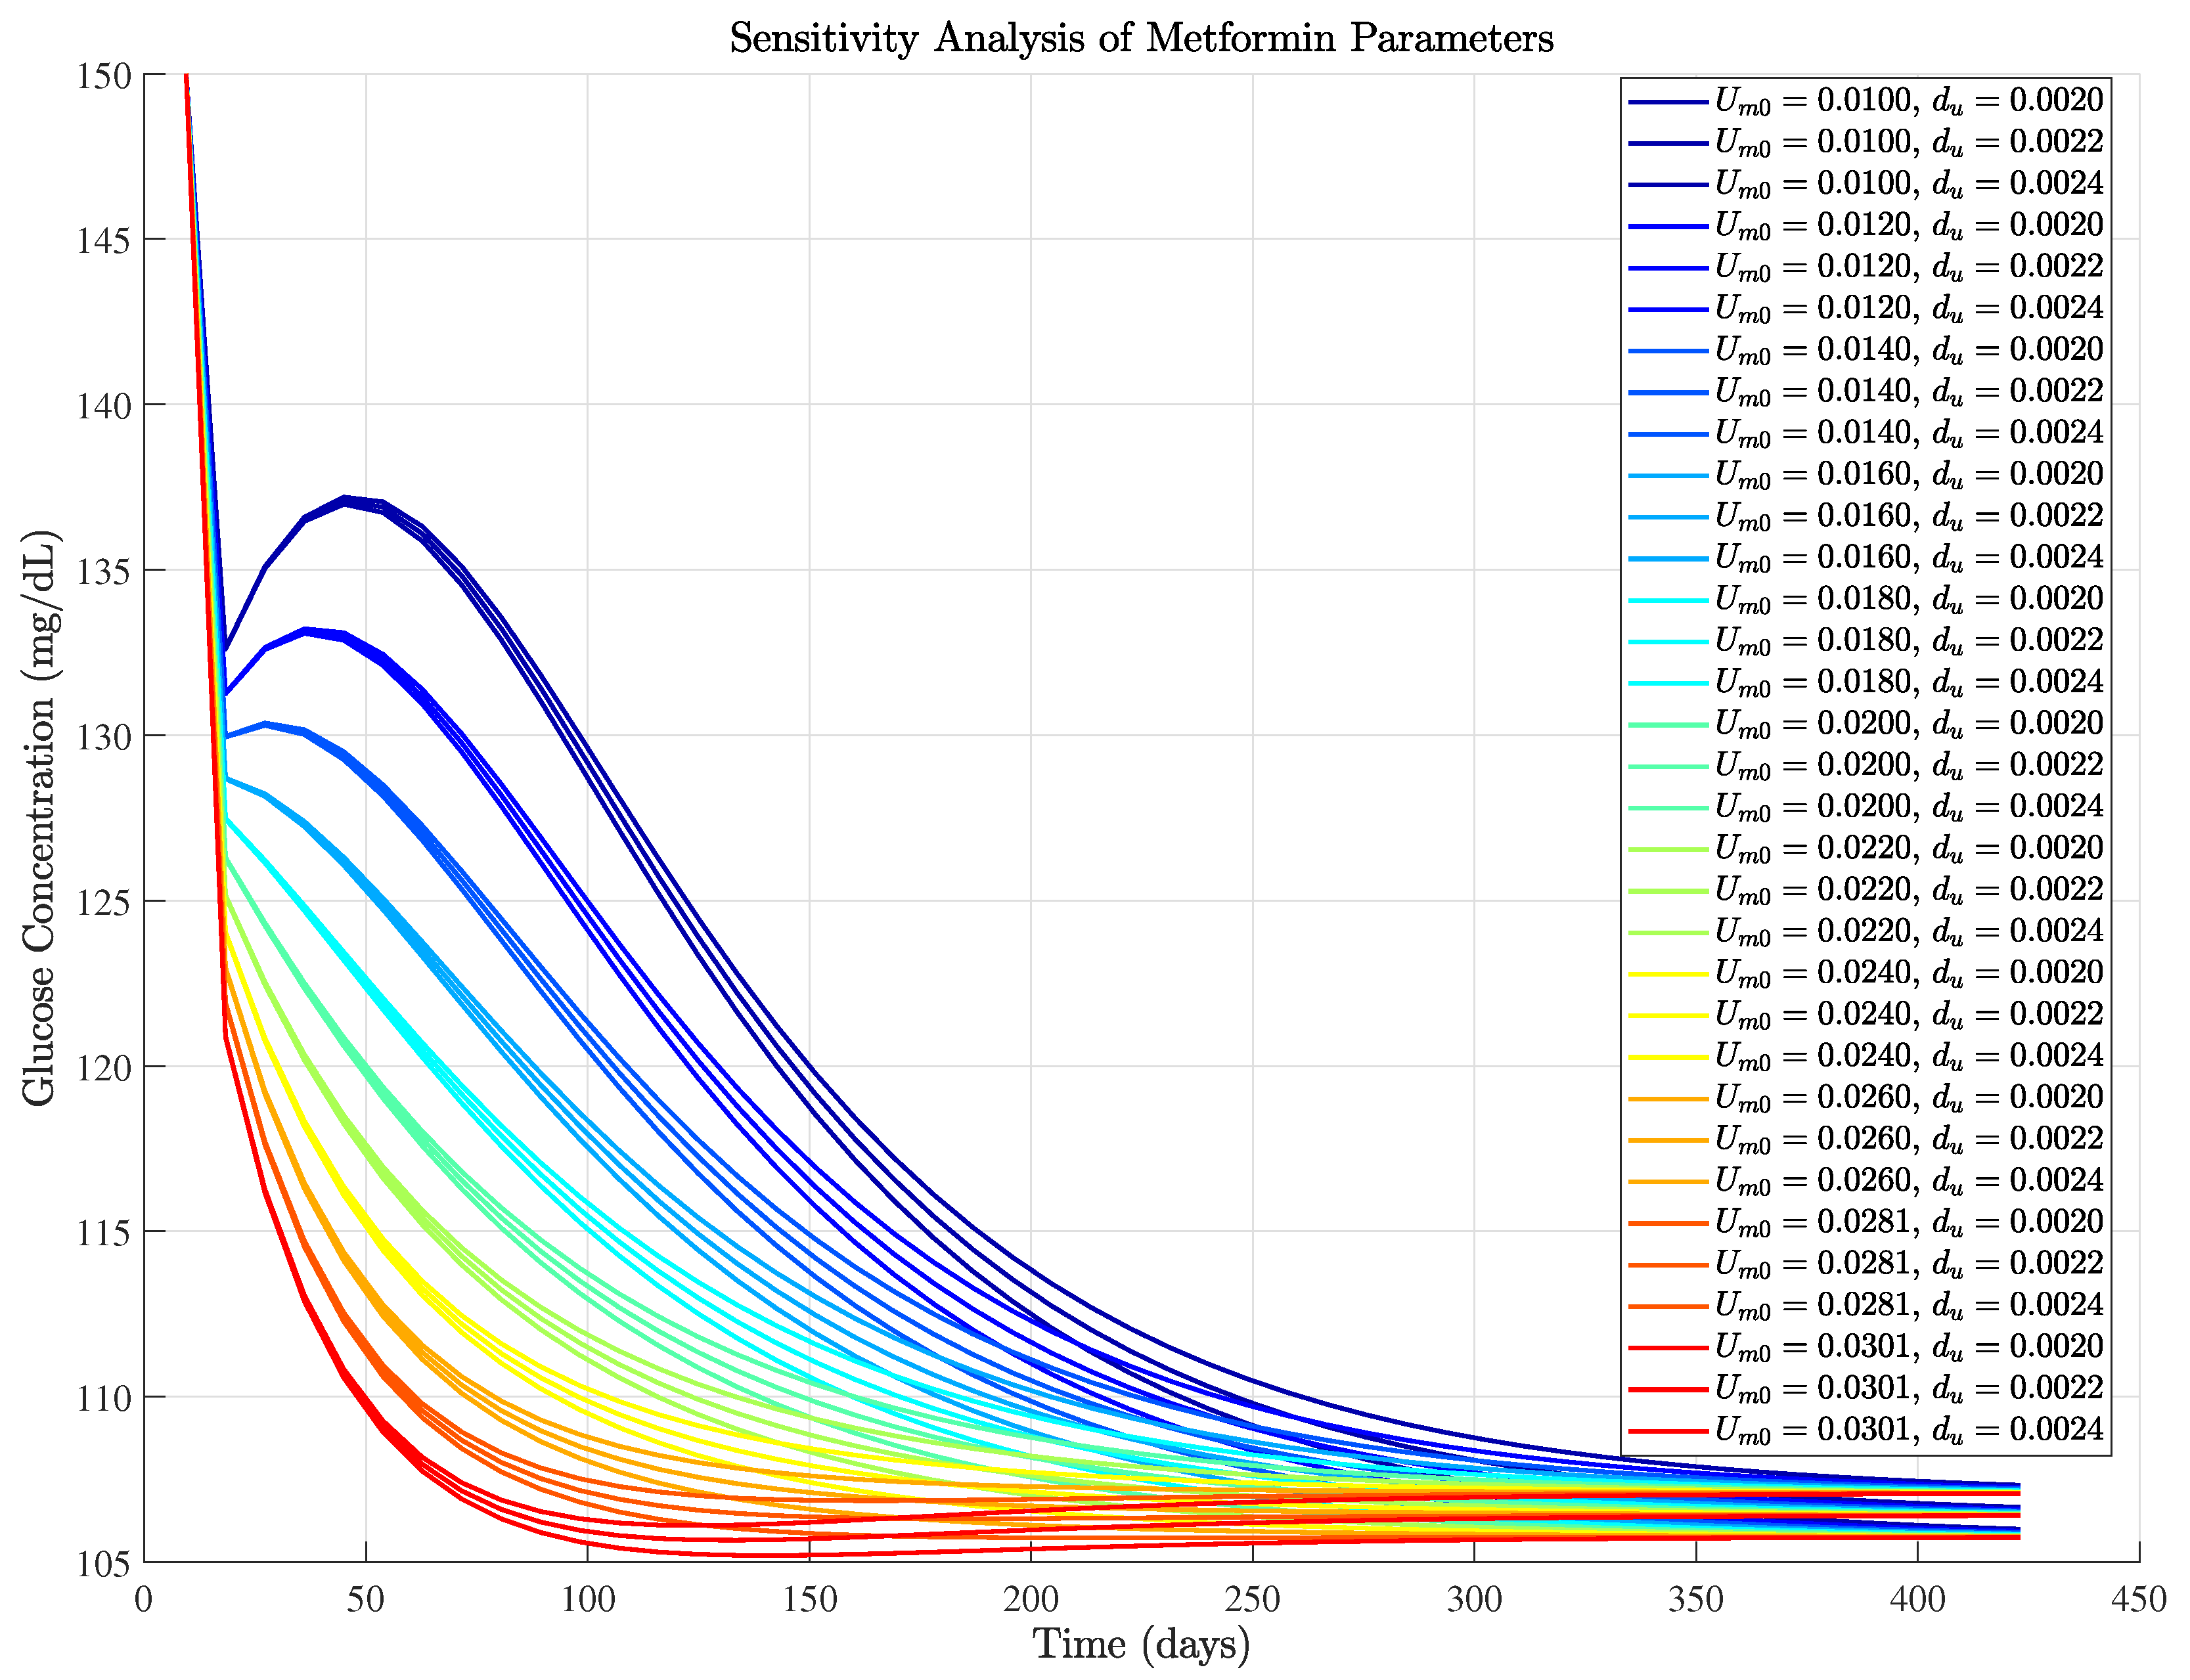
Figure 6 demonstrates the sensitivity of glucose concentration to variations in two key metformin parameters: the initial metformin level ( U m 0 ) and its exponential decay rate ( d u ). Simulations were conducted by varying U m 0 from 50% to 150% of the optimized value ( U m 0 o p t ) and adjusting d u by ± 10 % around its optimized value ( d u o p t ).
Each line represents the simulated glucose concentration trajectory over 450 days for specific combinations of U m 0 and d u . Color intensity, transitioning from red to blue, corresponds to increasing values of U m 0 . The legend provides exact parameter values used for each simulation.
Figure 6 clearly illustrates how glucose concentration profiles are notably influenced by both parameters. Higher initial metformin levels ( U m 0 ) generally lead to lower steady-state glucose values and steeper initial glucose declines. Moreover, variations in metformin decay rate ( d u ) also influence glucose trajectories, affecting both the long-term glucose equilibrium and the rate of glucose reduction.
The sensitivity analysis further indicates that variations in d u exert a smaller impact on glucose dynamics compared to variations in U m 0 , emphasizing the significance of the initial metformin dose for effective glycemic control.
In summary, simulation experiments validate the model’s ability to accurately replicate metformin’s glucose-lowering effects, with parameter tuning aligning closely with clinical observations. Sensitivity analyses underscore the greater influence of the initial metformin dose ( U m 0 ) relative to its decay rate ( d u ). Residual analysis identified opportunities for model refinement, while dynamic state analysis highlighted metformin’s role in stabilizing blood glucose and moderating disease progression. These insights reinforce the model’s potential applicability in optimizing therapeutic strategies for Type 2 Diabetes Mellitus.

4. Discussion

Given the substantial complexity associated with the incorporation of the diverse and interconnected mechanisms through which metformin exerts its effects, the current model strategically focuses on hepatic glucose dynamics as a foundational step. We acknowledge the critical role of other pathways, such as intestinal glucose absorption, intestinal microbiota modulation, and oxidative stress mitigation, and actively work to integrate these dimensions into future iterations to enhance both physiological fidelity and predictive power of the model.
We also agree that the incorporation of genomic insights, as demonstrated in studies [14,17], holds considerable promise to advance personalized therapeutic modeling. In the context of Type 2 Diabetes, genetic variability substantially influences beta-cell function, insulin sensitivity, and responsiveness to pharmacological interventions. In this study, we have prioritized capturing the dynamic interaction between glucose, insulin, and metformin using well-validated population-level clinical data from [36] for model calibration and validation.
As part of our ongoing research, we aim to expand the model by incorporating genomic data, focusing on polymorphisms known to affect metformin pharmacokinetics and pharmacodynamics (such as SLC22A1 and ATM), beta-cell function (e.g., TCF7L2 and MTNR1B), and insulin signaling pathways (e.g., IRS1 and PPARG). This integrative approach will facilitate the development of a more individualized and mechanistically informed framework for evaluating therapeutic results.

5. Conclusions

Type 2 Diabetes Mellitus (T2DM) is a chronic metabolic disorder that necessitates effective management to prevent severe complications. Although metformin is routinely prescribed as a first-line therapy for glycemic control, its detailed pharmacodynamics and pharmacokinetics remain complex and not entirely quantified. This paper introduces an interpretable, control-oriented mathematical model integrating metformin’s pharmacological dynamics within the beta-cell-insulin-glucose regulatory framework.
The proposed model has been rigorously validated, meets biologically realistic parameter constraints, and confirms the existence, uniqueness, and boundedness of solutions. Stability and bifurcation analyses have identified critical thresholds that mark transitions between homeostatic and pathological states, clarifying essential regulatory mechanisms. Clinical validation through parameter optimization using fasting plasma glucose data demonstrates strong predictive capabilities, further corroborated by residual analysis indicating Gaussian-distributed errors. The sensitivity analysis underscores the significant influence of the initial dose of metformin compared to its decay rate, highlighting the need for precise dose optimization.
In addition, the model elucidates the multifaceted actions of metformin, including the preservation of beta-cell function and the attenuation of insulin resistance progression. These findings position the developed model as a robust predictive tool, suitable for designing individualized therapeutic strategies.
Future research may expand this framework by incorporating additional physiological effects of metformin, such as its impacts on lipid metabolism, the gut microbiome, and inflammatory pathways, providing a more comprehensive dynamic characterization. Due to the model’s control-oriented structure, further exploration of advanced control methodologies is warranted, potentially leading to tailored and personalized treatment protocols. Such advances promise to improve therapeutic precision and efficacy, significantly contributing to personalized medical interventions for the management of T2DM.

Author Contributions

A.M. was responsible for the conceptual development of the mathematical model and the implementation of the computational simulations. S.Y. contributed to all aspects of the mathematical analysis, including theoretical formulation, analytical derivations, and interpretation of results. All authors have read and agreed to the published version of the manuscript.

Funding

This research received no external funding.

Institutional Review Board Statement

This study did not involve any experiments with human participants or animals performed by any of the authors.

Informed Consent Statement

Not applicable.

Conflicts of Interest

The authors declare that they have no conflicts of interest.

References

  1. Lu, X.; Xie, Q.; Pan, X.; Zhang, R.; Zhang, X.; Peng, G.; Zhang, Y.; Shen, S.; Tong, N. Type 2 diabetes mellitus in adults: Pathogenesis, prevention and therapy. Signal Transduct. Target. Ther. 2024, 9, 262. [Google Scholar] [CrossRef]
  2. Safiri, S.; Karamzad, N.; Kaufman, J.S.; Bell, A.W.; Nejadghaderi, S.A.; Sullman, M.J.; Moradi-Lakeh, M.; Collins, G.; Kolahi, A.A. Prevalence, deaths and disability-adjusted-life-years (DALYs) due to type 2 diabetes and its attributable risk factors in 204 countries and territories, 1990–2019: Results from the global burden of disease study 2019. Front. Endocrinol. 2022, 13, 838027. [Google Scholar] [CrossRef] [PubMed]
  3. Perng, W.; Conway, R.; Mayer-Davis, E.; Dabelea, D. Youth-onset type 2 diabetes: The epidemiology of an awakening epidemic. Diabetes Care 2023, 46, 490–499. [Google Scholar] [CrossRef] [PubMed]
  4. Aikaeli, F.; Njim, T.; Gissing, S.; Moyo, F.; Alam, U.; Mfinanga, S.G.; Okebe, J.; Ramaiya, K.; Webb, E.L.; Jaffar, S.; et al. Prevalence of microvascular and macrovascular complications of diabetes in newly diagnosed type 2 diabetes in low-and-middle-income countries: A systematic review and meta-analysis. PLoS Glob. Public Health 2022, 2, e0000599. [Google Scholar] [CrossRef] [PubMed]
  5. Pop-Busui, R.; Januzzi, J.L.; Bruemmer, D.; Butalia, S.; Green, J.B.; Horton, W.B.; Knight, C.; Levi, M.; Rasouli, N.; Richardson, C.R. Heart failure: An underappreciated complication of diabetes. A consensus report of the American Diabetes Association. Diabetes Care 2022, 45, 1670–1690. [Google Scholar] [CrossRef]
  6. Cohrs, C.M.; Panzer, J.K.; Drotar, D.M.; Enos, S.J.; Kipke, N.; Chen, C.; Bozsak, R.; Schoniger, E.; Ehehalt, F.; Distler, M.; et al. Dysfunction of Persisting beta Cells Is a Key Feature of Early Type 2 Diabetes Pathogenesis. Cell Rep. 2020, 31, 107469. [Google Scholar] [CrossRef]
  7. Lv, C.; Sun, Y.; Zhang, Z.Y.; Aboelela, Z.; Qiu, X.; Meng, Z.X. Beta-cell dynamics in type 2 diabetes and in dietary and exercise interventions. J. Mol. Cell Biol. 2022, 14, mjac046. [Google Scholar] [CrossRef]
  8. Huang, H.; Lorenz, B.R.; Zelmanovitz, P.H.; Chan, C.B. Metformin preserves β-cell compensation in insulin secretion and mass expansion in prediabetic nile rats. Int. J. Mol. Sci. 2021, 22, 421. [Google Scholar] [CrossRef]
  9. Forslund, K.; Hildebrand, F.; Nielsen, T.; Falony, G.; Le Chatelier, E.; Sunagawa, S.; Prifti, E.; Vieira-Silva, S.; Gudmundsdottir, V.; Krogh Pedersen, H. Disentangling type 2 diabetes and metformin treatment signatures in the human gut microbiota. Nature 2015, 528, 262–266. [Google Scholar] [CrossRef]
  10. Marchetti, P.; Del Guerra, S.; Marselli, L.; Lupi, R.; Masini, M.; Pollera, M.; Bugliani, M.; Boggi, U.; Vistoli, F.; Mosca, F.; et al. Pancreatic islets from type 2 diabetic patients have functional defects and increased apoptosis that are ameliorated by metformin. J. Clin. Endocrinol. Metab. 2004, 89, 5535–5541. [Google Scholar] [CrossRef]
  11. López-Palau, N.E.; Olais-Govea, J.M. Mathematical model of blood glucose dynamics by emulating the pathophysiology of glucose metabolism in type 2 diabetes mellitus. Sci. Rep. 2020, 10, 12697. [Google Scholar] [CrossRef]
  12. Nazirun, N.N.N.; Wahab, A.A.; Selamat, A.; Fujita, H.; Krejcar, O.; Kuča, K.; Seng, G.H. Prediction Models for Type 2 Diabetes Progression: A Systematic Review. IEEE Access 2024, 12, 161595–161619. [Google Scholar] [CrossRef]
  13. Murphree, D.H.; Arabmakki, E.; Ngufor, C.; Storlie, C.B.; McCoy, R.G. Stacked classifiers for individualized prediction of glycemic control following initiation of metformin therapy in type 2 diabetes. Comput. Biol. Med. 2018, 103, 109–115. [Google Scholar] [CrossRef] [PubMed]
  14. Villikudathil, A.T.; McGuigan, D.H.; English, A. Exploring metformin monotherapy response in Type-2 diabetes: Computational insights through clinical, genomic, and proteomic markers using machine learning algorithms. Comput. Biol. Med. 2024, 171, 108106. [Google Scholar] [CrossRef] [PubMed]
  15. Chae, J.W.; Baek, I.H.; Lee, B.Y.; Cho, S.K.; Kwon, K.I. Population PK/PD analysis of metformin using the signal transduction model. Br. J. Clin. Pharmacol. 2012, 74, 815–823. [Google Scholar] [CrossRef]
  16. Zake, D.M.; Kurlovics, J.; Zaharenko, L.; Komasilovs, V.; Klovins, J.; Stalidzans, E. Physiologically based metformin pharmacokinetics model of mice and scale-up to humans for the estimation of concentrations in various tissues. PLoS ONE 2021, 16, e0249594. [Google Scholar] [CrossRef]
  17. Long, J.; Fang, Q.; Shi, Z.; Miao, Z.; Yan, D. Integrated biomarker profiling for predicting the response of type 2 diabetes to metformin. Diabetes Obes. Metab. 2024, 26, 3439–3447. [Google Scholar] [CrossRef]
  18. Mirzaee, A.; Dehghani, M.; Mohammadi, M. Optimal impulsive blood glucose control through multiple injections. Chaos Solitons Fractals 2021, 152, 111326. [Google Scholar] [CrossRef]
  19. Mirzaee, A.; Dehghani, M.; Abolpour, R.; Mohammadi, M.; Sadabadi, M.S. Robust Optimal Impulsive Blood Glucose Control Exploiting a Direct Searching Algorithm. IEEE Sens. J. 2023, 23, 3183–3193. [Google Scholar] [CrossRef]
  20. Bergman, R. Origins and History of the Minimal Model of Glucose Regulation. Front. Endocrinol. 2021, 11, 583016. [Google Scholar] [CrossRef]
  21. Topp, B.; Promislow, K.; Devries, G.; Miura, R.M.; Finegood, D.T. A model of β-cell mass, insulin, and glucose kinetics: Pathways to diabetes. J. Theor. Biol. 2000, 206, 605–619. [Google Scholar] [CrossRef]
  22. Boxonov, Z.; Rozikov, U. Stability analysis of a three-dimensional system of Topp model with diabetes. arXiv 2024, arXiv:2405.00323. [Google Scholar] [CrossRef]
  23. Subramanian, V.; Bagger, J.I.; Harihar, V.; Holst, J.J.; Knop, F.K.; Villsboll, T. An Extended Minimal Model of OGTT: Estimation of Alpha- and Beta-Cell Dysfunction, Insulin Resistance, and the Incretin Effect. Am. J.-Physiol.-Endocrinol. Metab. 2024, 326, E182–E205. [Google Scholar] [CrossRef] [PubMed]
  24. Farahmand, B.; Dehghani, M.; Vafamand, N.; Mirzaee, A.; Boostani, R.; Pieper, J.K. Robust nonlinear control of blood glucose in diabetic patients subject to model uncertainties. ISA Trans. 2023, 133, 353–368. [Google Scholar] [CrossRef] [PubMed]
  25. Pompa, M.; Panunzi, S.; Borri, A.; De Gaetano, A. A comparison among three maximal mathematical models of the glucose-insulin system. PLoS ONE 2021, 16, e0257789. [Google Scholar] [CrossRef] [PubMed]
  26. Banzi, W.; Kambutse, I.; Dusabejambo, V.; Rutaganda, E.; Minani, F.; Niyobuhungiro, J.; Mpinganzima, L.; Ntaganda, J.M. Mathematical Modelling of Glucose-Insulin System and Test of Abnormalities of Type 2 Diabetic Patients. Int. J. Math. Math. Sci. 2021, 2021, 6660177. [Google Scholar] [CrossRef]
  27. Visentin, R.; Schiavon, M.; Bonet, J.; Riz, M.; Wagenhuber, B.; Dalla Man, C. Tailoring the Padova Type 2 Diabetes Simulator for Treatment Guidance in Target Populations. IEEE Trans. Biomed. Eng. 2024, 71, 1780–1788. [Google Scholar] [CrossRef]
  28. Visentin, R.; Cobelli, C.; Dalla Man, C. The Padova Type 2 Diabetes Simulator from Triple-Tracer Single-Meal Studies: In Silico Trials Also Possible in Rare but Not-So-Rare Individuals. Diabetes Technol. Ther. 2020, 22, 892–903. [Google Scholar] [CrossRef]
  29. Galicia-Garcia, U.; Benito-Vicente, A.; Jebari, S.; Larrea-Sebal, A.; Siddiqi, H.; Uribe, K.B.; Ostolaza, H.; Martín, C. Pathophysiology of Type 2 Diabetes Mellitus. Int. J. Mol. Sci. 2020, 21, 6275. [Google Scholar] [CrossRef]
  30. Rena, G.; Hardie, D.G.; Pearson, E.R. The mechanisms of action of metformin. Diabetologia 2017, 60, 1577–1585. [Google Scholar] [CrossRef]
  31. Foretz, M.; Guigas, B.; Viollet, B. Understanding the glucoregulatory mechanisms of metformin in type 2 diabetes mellitus. Nat. Rev. Endocrinol. 2019, 15, 569–589. [Google Scholar] [CrossRef]
  32. Hirst, J.A.; Farmer, A.J.; Ali, R.; Roberts, N.W.; Stevens, R.J. Quantifying the Effect of Metformin Treatment and Dose on Glycemic Control. Diabetes Care 2012, 35, 446–454. [Google Scholar] [CrossRef] [PubMed]
  33. Ray, R.; Haq, A.U.; Chaudhry, R.; Burra, S.; Batool, A.; Masmoum, M.D.; Ullah, I. Efficacy of Metformin in Weight Management and Glycemic Control in Type 2 Diabetes: An Updated Systematic Review and Meta-Analysis. J. Adv. Med. Med. Res. 2024, 36, 225–239. [Google Scholar] [CrossRef]
  34. Sanchez-Rangel, E.; Inzucchi, S. Metformin: Clinical use in type 2 diabetes. Diabetologia 2017, 60, 1586–1593. [Google Scholar] [CrossRef]
  35. He, D.; Han, H.; Fu, X.; Liu, A.; Zhan, Y.; Qiu, H.; Ma, L.; Zhang, X.; Wang, X. Metformin Reduces Blood Glucose in Treatment-Naive Type 2 Diabetes by Altering the Gut Microbiome. Can. J. Diabetes 2021, 46, 150–156. [Google Scholar] [CrossRef]
  36. Winter, W.D.; DeJongh, J.; Post, T.; Ploeger, B.; Urquhart, R.; Moules, I.; Eckland, D.; Danhof, M. A mechanism-based disease progression model for comparison of long-term effects of pioglitazone, metformin and gliclazide on disease processes underlying type 2 diabetes mellitus. J. Pharmacokinet. Pharmacodyn. 2006, 33, 313–343. [Google Scholar] [CrossRef]
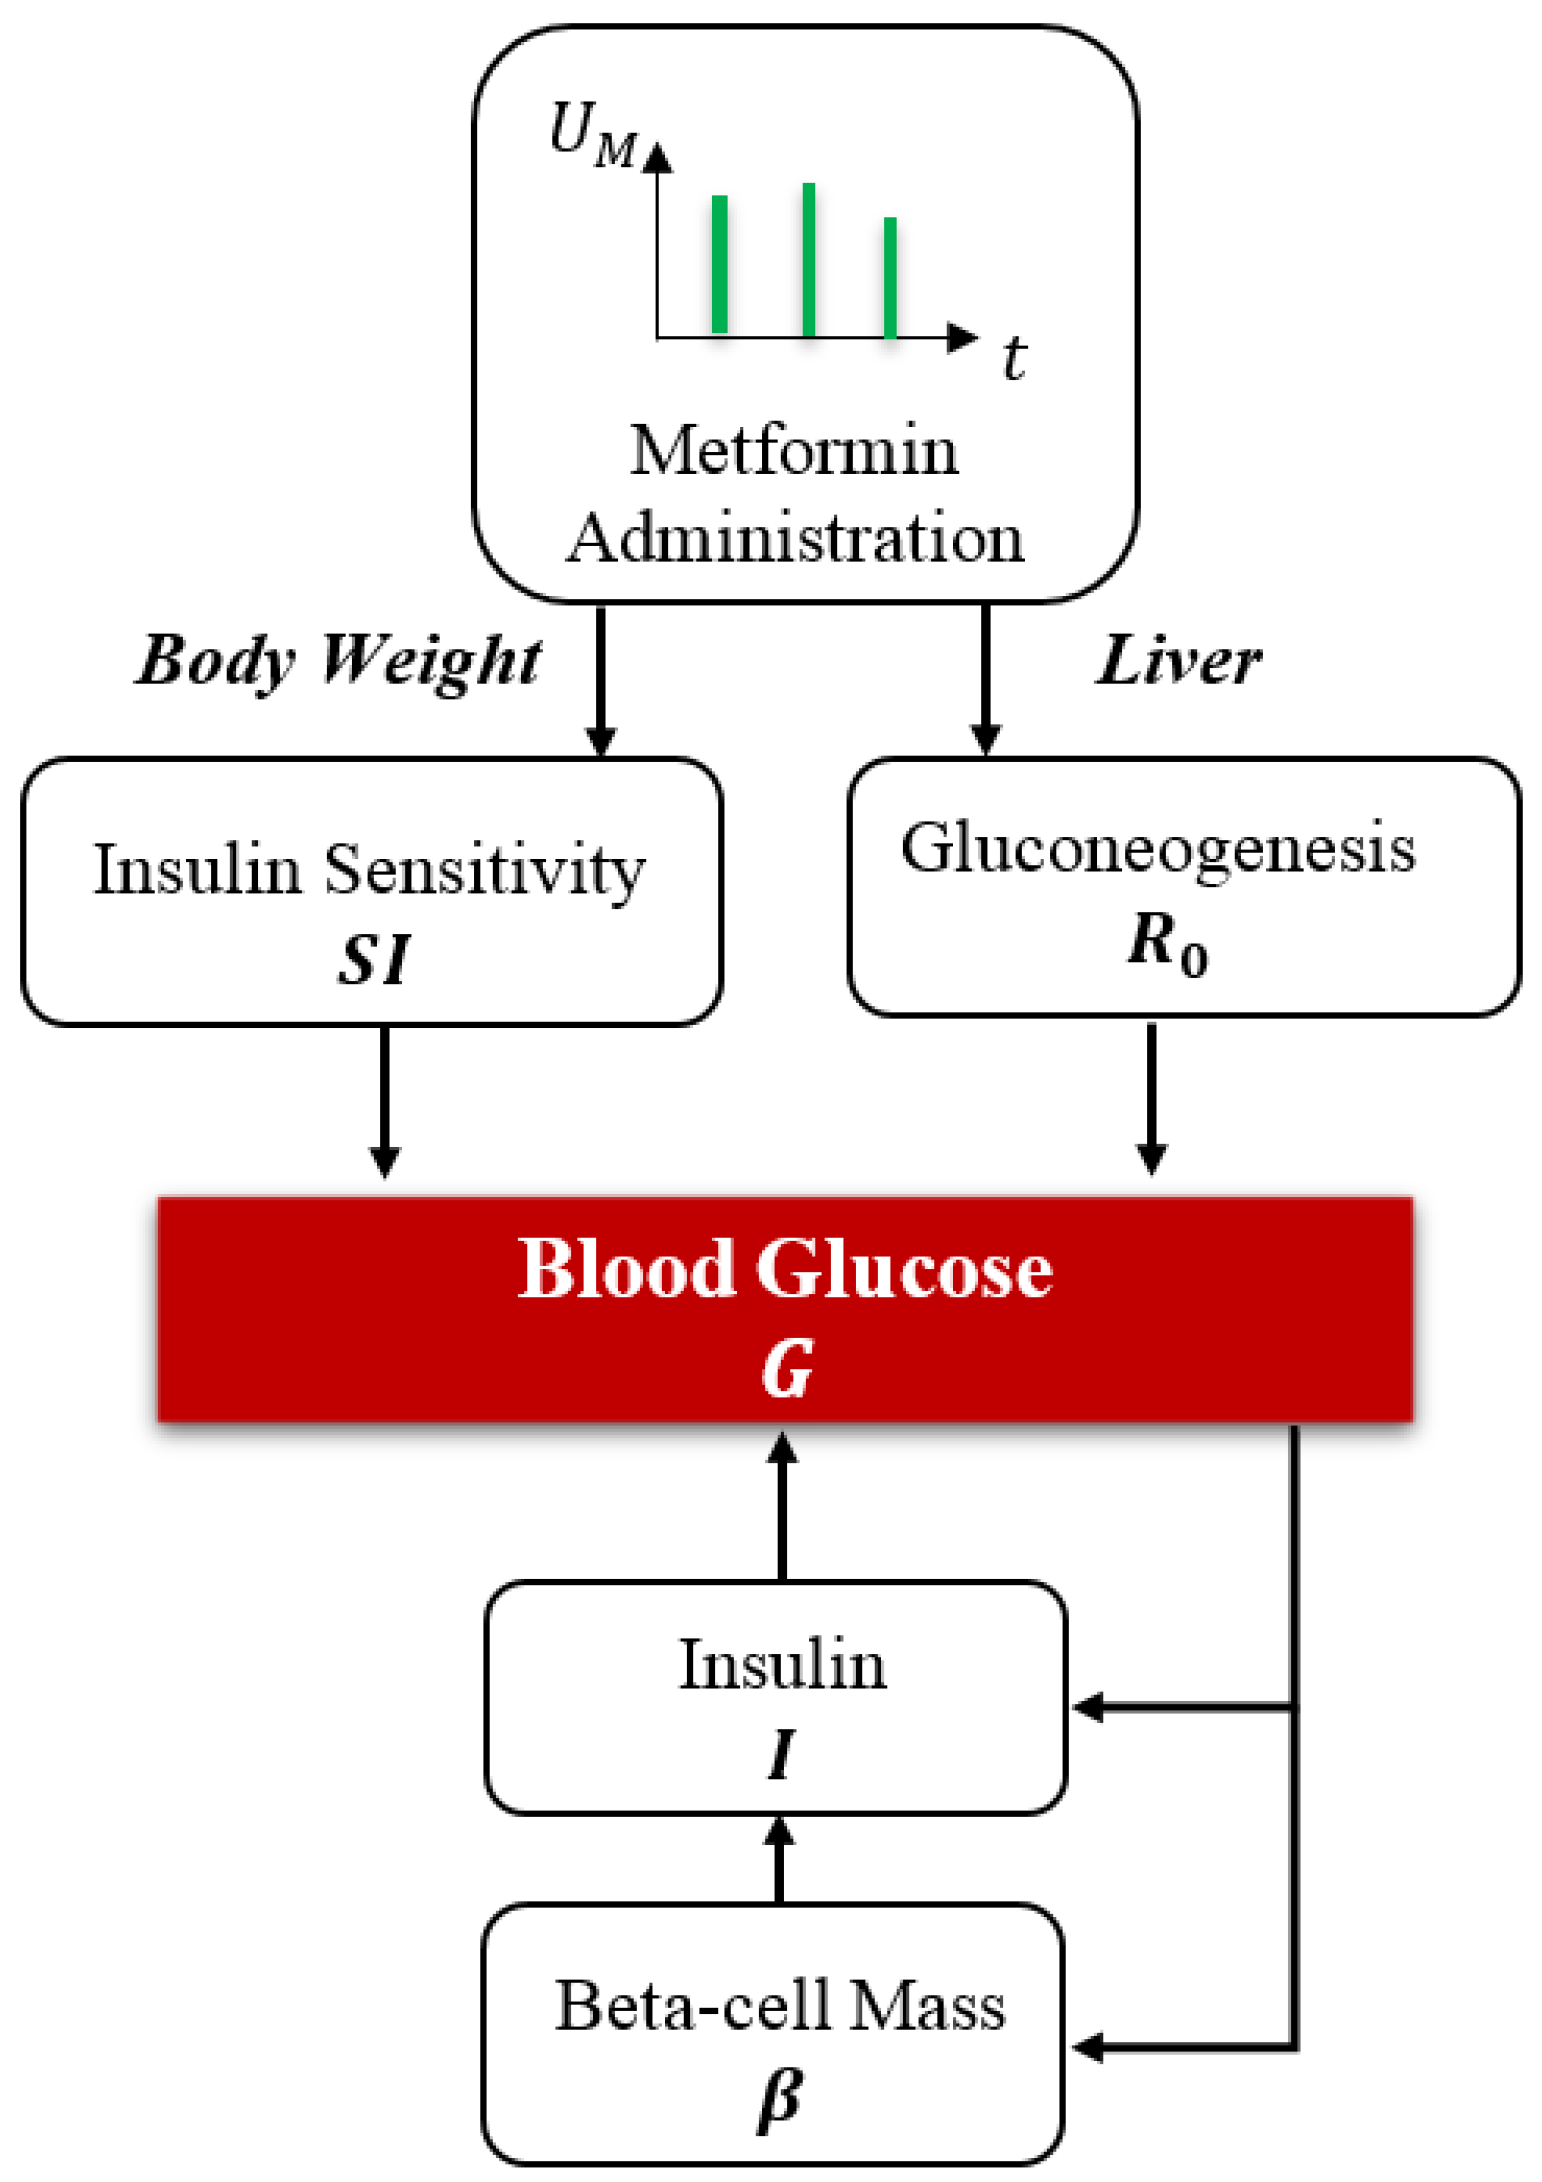
Figure 1. Illustration of metformin’s mechanism within the BIG model, highlighting its effects on insulin sensitivity and hepatic gluconeogenesis, leading to improved glycemic control.
Biophysica 05 00037 g001
Figure 2. The bifurcation diagram of the metformin-extended BIG model.
Biophysica 05 00037 g002
Figure 3. Dynamic changes in key physiological state variables over time under conditions of metformin treatment and no treatment.
Biophysica 05 00037 g003
Figure 4. Comparison of metformin-induced glucose reduction: Model predictions versus the clinical data reported in [36].
Biophysica 05 00037 g004
Figure 5. Residual Analysis of the Metformin Model: (Top) Residual time series with smoothing curve; (Middle) Histogram of residuals with normal distribution fit; (Bottom) Residuals versus predicted glucose values.
Biophysica 05 00037 g005
Figure 6. Sensitivity analysis illustrating glucose concentration responses to variations in initial metformin level ( U m 0 ) and metformin decay rate ( d u ).
Biophysica 05 00037 g006
Table 1. Parameters of the BIG model [21].
ParameterValueUnits
      E G 0 1.44d−1
      R 0 864mg·dL−1·d−1
      σ 43.2μU·mL−1·d−1
      α 20,000mg2·dL−2
     K432d−1
      d 0 0.06d−1
      r 1 0.84 × 10 3 mg−1·dL·d−1
      r 2 0.24 × 10 5 mg−2·dL2·d−1
     c 0.03 d−1
      d s 1μU−1·mL·d−2
      d u 0.005 d−1
Disclaimer/Publisher’s Note: The statements, opinions and data contained in all publications are solely those of the individual author(s) and contributor(s) and not of MDPI and/or the editor(s). MDPI and/or the editor(s) disclaim responsibility for any injury to people or property resulting from any ideas, methods, instructions or products referred to in the content.