Review

Keeping Cells Alive in Microscopy

by
Herbert Schneckenburger
1,* and
Christoph Cremer
2,3,4
1
Institute of Applied Research, Aalen University, 73430 Aalen, Germany
2
Kirchhoff-Institute for Physics, University Heidelberg, 69120 Heidelberg, Germany
3
Max Planck Institute for Polymer Research, 55128 Mainz, Germany
4
Institute of Molecular Biology (IMB), 55128 Mainz, Germany
*
Author to whom correspondence should be addressed.
Biophysica 2025, 5(1), 1; https://doi.org/10.3390/biophysica5010001
Submission received: 27 November 2024 / Revised: 31 December 2024 / Accepted: 2 January 2025 / Published: 6 January 2025
(This article belongs to the Special Issue Live Cell Microscopy)

Abstract

:
Light microscopy has emerged as one of the fundamental methods to analyze biological systems; novel techniques of 3D microscopy and super-resolution microscopy (SRM) with an optical resolution down to the sub-nanometer range have recently been realized. However, most of these achievements have been made with fixed specimens, i.e., direct information about the dynamics of the biosystem studied was not possible. This stimulated the development of live cell microscopy imaging approaches, including Low Illumination Fluorescence Microscopy, Light Sheet (Fluorescence) Microscopy (LSFM), or Structured Illumination Microscopy (SIM). Here, we discuss perspectives, methods, and relevant light doses of advanced fluorescence microscopy imaging to keep the cells alive at low levels of phototoxicity.

1. Introduction

Live cell microscopy is often the basis for understanding fundamental mechanisms of cell physiology. This may be essential for the detection of metabolic pathways, origin of diseases, interaction with pharmacological agents, or improved understanding of the dynamic interplay between nuclear genome structure and transcription. However, for all of these studies, cells should be kept viable and physiologically intact. This requires controlled (typically constant) temperature, availability of oxygen and nutrient fluids, cell–cell contacts, as well as low cytotoxicity and phototoxicity of the molecular species involved. For optical experiments, e.g., microscopy, this implies that exposure to radiation should be minimized over a large spectrum of wavelengths. While in the ultraviolet (UV) part of the spectrum, local ablation or molecular damage (e.g., DNA strand breaks, see reviews [1,2,3]) are dominating effects, a combination of photochemical, photothermal, and opto-mechanical effects may contribute to cell damage in the visible part.
Generally, cell damage diminishes with increasing wavelength of radiation, when photon energy is no longer sufficient to induce molecular damage or ablation, and when the number of molecules absorbing light and inducing phototoxic effects decreases. This is indicated in Figure 1, which shows the viability of U-373MG glioblastoma cells upon increasing light exposure with wavelengths of 375 nm, 514 nm, or 633 nm. In this experiment, single cells were seeded and exposed to light doses up to 300 J/cm2. Then, after 7 days, the percentage of cells which were able to form colonies (plating efficiency) was determined. Cells were regarded as viable upon less than 10% reduction in the plating efficiency at 0 J/cm2, i.e., upon application of light doses up to 25, 100, or 200 J/cm2 at wavelengths of 375, 514, or 633 nm, respectively. This corresponds to 4 min, 16 min, or 32 min of solar irradiation with approximately 100 mW/cm2.
Cell viability may depend on whether irradiation occurs continuously or by short pulses and on whether whole cells or only small parts, e.g., membrane or certain organelles, are exposed to radiation. Whole cells are commonly illuminated in wide-field or laser scanning microscopy, whereas small parts are irradiated when laser micro-beam techniques (reviewed, e.g., in [5,6,7]) are applied. These different applications are distinguished in Section 2 and Section 3 of this manuscript.

2. Whole Cell Illumination

2.1. Mechanisms Involved

-
Photochemical reactions occur if light is absorbed by photosensitizing molecules, which are able to transfer their excitation energy to adjacent molecules, thus creating radicals or highly reactive singlet oxygen (1O2). These species may cause photo-oxidation with subsequent cell destruction. Absorbing molecules include the coenzymes nicotinamide adenine dinucleotide (NADH, absorption maximum: 350 nm) [8] as well as flavin mono- and dinucletide (FMN/FAD; absorption maxima: 380 nm and 440 nm) [9], and porphyrin related molecules (with an absorption wavelength below 620 nm). However, while free porphyrins have a high quantum yield for creating singlet oxygen [10], this potential is reduced when porphyrins are bound within hemoglobin, myoglobin, or cytochromes. At wavelengths in the far UV, the most important phototoxic effect is produced upon light absorption by DNA (with a maximum of around 260 nm), which creates photo-dimers.
-
Photothermal reactions occur upon absorption of radiation and energy conversion to heat. Main absorbers are water molecules (λ ≤ 250 nm, λ ≥ 1100 nm), porphyrin molecules (bound, e.g., within cytochromes, 350 nm ≤ λ ≤ 620 nm), and proteins (λ ≤ 300 nm). Thus, in the wavelength range of 620 nm ≤ λ ≤ 1100 nm (“therapeutic window”), absorption is comparably low, but increases at 400–600 nm, the typical excitation range for light microscopy.
-
Opto-mechanical destruction of molecular bonds occurs at photon energies above 4 eV, corresponding to wavelengths below 300 nm. This is the spectral range of far UV or X-ray microscopy. At longer wavelengths, cell or tissue disruption may occur by intensive picosecond or femtosecond laser pulses. The focus on these laser pulses is used for ablation, hole drilling, gene transfection, and other kinds of micro-manipulation reported in Section 3.1. However, in many applications of light microscopy, these effects do not play a major role.

2.2. Microscopy Methods and Their Compatibility with Low Light Exposure

2.2.1. General

In Section 1, non-phototoxic light doses up to 25 J/cm2 (375 nm), 100 J/cm2 (514 nm), and 200 J/cm2 (633 nm) were specified for native cells, i.e., cells without any staining or transfection. After staining with various blue or green absorbing dyes or transfection with a Green Fluorescent Protein (GFP) encoding plasmid, the limit of non-phototoxic light doses was often around 10 J/cm2, corresponding to about 100 s of solar irradiation [4,11]. Since this limit was about the same for continuous wave (cw) excitation and for a quasi-continuous train of short excitation pulses [11], it also holds for laser scanning or Fluorescence Lifetime Imaging (FLIM) microscopy (see below).
With a given “light dose budget” of about 10 J/cm2 and a tolerable irradiance of around 100 mW/cm2 (solar irradiance), one can estimate a possible number of exposures under non-phototoxic conditions. Wide-field microscopy appears possible with an exposure time of around one second, thus permitting about 100 images to be recorded. For Confocal Laser Scanning Fluorescence Microscopy (CLSM) [12,13,14], a recording time of 4–5 s per image is often preferable, so that 20–25 images can be measured under non-phototoxic conditions. If several layers of a sample are imaged, and if for each layer the whole sample is illuminated, this implies that a sample can be imaged with 20–25 exposures from top to bottom. For example, for a cell with a 20 µm diameter, 20 selective planes shifted by 1 µm between one another in the axial direction can be recorded under physiological live cell conditions.
Figure 2a shows the principal setup of CLSM with a laser beam focused on the sample. Only fluorescence signals from the focal plane (comprising its adjacent layers, as given by the optical resolution along the optical axis) can pass a small pinhole located in front of the detector (e.g., photomultiplier). By moving the sample in the vertical direction, various planes can be detected (see examples in Figure 2b,c) and combined into a 3-dimensional image. However, for recording each plane, the whole sample has to be illuminated, and the light doses of each exposure have to be summed up. An alternative technique is Light Sheet (Fluorescence) Microscopy (LSFM), where excitation of the sample occurs in a horizontal direction, and only the illuminated plane is recorded, which is specified by the thickness of the light sheet. Therefore, the whole “light dose budget” is available for each plane, and thus, this technique is preferable for long-time exposures or for repeated measurements of individual planes [15,16,17]. Light sheet illumination can be realized either by a cylindrical lens (usually of low or moderate aperture to reach a sufficient depth of focus) or by scanning an exciting laser beam. The light sheet depicted in Figure 2d,e can be moved in the axial direction, but for imaging individual planes, the objective lens has to be shifted simultaneously. Often, the shifts in the light sheet and the objective lens have to be corrected for the refractive index of the medium, where the sample is embedded. An appropriate setup for mechanical correction is described in [18], but corrections by software are also possible. Images from individual planes can be combined into a 3-D image similar to CLSM.
Usually, the resolution in microscopy is given by the Abbe criterion r ≥ λ/2 AN [19] or the Rayleigh criterion r = 0.61 λ/AN [20] (with AN corresponding to the numerical aperture of the microscope objective lens) and may attain about 200 nm for high aperture objective lenses (AN ≥ 1.4). Generally, the Rayleigh criterion holds for fluorescence microscopy, with λ corresponding to the detection wavelength for wide-field microscopy and the excitation wavelength for laser scanning microscopy, if the whole 0th maximum of the diffraction pattern (Airy disk), with a radius of 2r, passes the pinhole. If the pinhole is kept smaller, the resolution can theoretically be enhanced by a factor around 1.4 [21], but the exposure time needed for each image increases, and the number of images, which can be recorded within the limiting light dose becomes much smaller. Airy Scan Microscopy (with multiple detectors behind the pinhole [21,22]) or Image Scan Microscopy (with 2D camera detection [23]) possibly avoids this problem, since enhanced resolution may occur without diminution of fluorescence photon collection.

2.2.2. Super-Resolution Microscopy

During the last 30 years, microscopy techniques have been developed, which substantially overcome the resolution defined by the Abbe or Rayleigh criterion. These techniques are summarized under the term Super-Resolution Microscopy (SRM) [13,24,25,26,27,28,29,30,31,32,33,34] and include Airy Scan as well as Image Scan Microscopy. A further SRM method that exploits a suitable patterning of illumination to enhance resolution by around a factor of 2 is Structured Illumination Microscopy (SIM [35,36,37,38,39,40,41,42,43,44,45,46]). Here, the sample is commonly illuminated by two interfering laser beams (Figure 3a), typically creating a sinusoidal light pattern that may be rotated to obtain isotropic resolution in a lateral plane. Images are recorded for at least three rotation angles (e.g., 0°, 60°, and 120°) and three phases (0, 2π/3, and 4π/3) of the interference pattern, so that a super-resolution image is calculated from a minimum of nine individual images. Summing up the spatial frequencies, kAbbe resulting from the Abbe criterion, and kIP, resulting from the interference pattern in the plane of the sample, give a resolution r = (kAbbe + kIP)−1 ≥ 100 nm (see Figure 3b,c for a comparison with wide-field microscopy). Structured illumination appears possible in non-phototoxic conditions, but recording nine images to calculate one structured image implies that only about 10 SIM images can be obtained with a light dose of 10 J/cm2.
Structured Illumination Microscopy (SIM) was used to detect mitochondria, actin filaments, as well as the Golgi apparatus dynamics in three dimensions and with high resolution [41]. Other in vivo SIM applications include 3D imaging of live neural populations [47], the dynamics of the endoplasmic reticulum, and microtubules in living cells with up to 255 frames per second [48], as well as ultra-long excitation near-infrared SIM with deep tissue penetration depth of tumor microenvironments in mice [49]. The SIM principle of resolution enhancement was also used in optics with low numerical aperture AN. The longer the wavelength, the more the light-induced generation of chemical radicals can be reduced [38]. For example, at a wavelength of 532 nm, the photochemical evaluation function according to the current safety standard [50] for 532 nm is only 1/16 of the value for 488 nm, the commonly used wavelength in commercial scanning laser opthalmology (SLO) [51]. This small phototoxicity allowed the application of structured illumination ophtalmology (532 nm) to perform super-resolving retina diagnostics of the live human eye [38]. In this case, the human eye lens with its AN = 0.1–0.3 and a focal length (“working distance”) of about 2.2 cm (ca. 130 times larger than the working distance of a typical AN = 1.4 lens) was used to create on the retina a sinusoidal illumination pattern with an average intensity of about 100 mW/cm2. According to safety rules [50], there was no intraocular risk even with continuous illumination at the wavelength applied. For example, a 100 s illumination would correspond to a tolerable total light dose of 10 J/cm2.
In case that structured illumination is realized by interference along the optical axis using two opposite objective lenses [31,52,53,54], this may enhance axial resolution with little photobleaching. In recent years, the limit of conventional axial resolution has been surpassed also by further SRM approaches including Standing Wave Field Microscopy (SWFM) [53,54,55], or Spatially Modulated Illumination (SMI) Microscopy [52,56]. Experimentally, for λex = 488 nm and an AN = 1.4 objective lens, an axial resolution of about 100 nm (according to the Rayleigh criterion) has been demonstrated for SWFM, while the time integrated laser power was more than 100 times lower than that required for a CLSM image of the same object [54]. Hence, for a wavelength compatible with imaging of whole live cells (e.g., 647 nm), the best optical resolution around 130 nm along the optical axis is predicted. In the case of optically isolated objects, SMI has been used to determine the axial extension (size) of small, optically isolated fluorescent objects down to about a 40 nm diameter with an optimal precision in the few nm range; it also allowed the axial positioning of such structures down to the 1 nm scale [52]. Since the SWFM/SMI excitation mechanisms are the same as in conventional wide-field fluorescence microscopy, these techniques allow for the limitation of the irradiance and, thus, of the phototoxicity to the same low levels. For example, the SMI approach has been applied to measure in nuclei of live U2OS cells (λex = 488 nm, AN = 1.2 water) the size of a small chromatin domain labeled with Green Fluorescent Protein (GFP) [56].
A variety of high resolution methods are summarized under the term Single Molecule Localization Microscopy (SMLM), where individual molecules within a specimen are recorded with high precision [56,57,58,59,60,61,62,63,64]. If N photons are detected from a single molecule, its localization can be determined with a precision of Δx = Δx0/√N, with Δx0 related to the resolution r according to the Rayleigh criterion. In the absence of background, the best precision localization of Δx = 7 nm would result from N = 100 and Δx = 3.5 nm from N = 400 [63]. Generally,, however, a much higher photon budget is required [31,57,63].
Presently, SMLM works well for specimens up to a few µm of thickness (e.g., cell monolayers), with a single molecule localization precision down to the few nm range [52,63,64]; in special cases, even a sub-nm optical resolution has been realized experimentally by SMLM [57]. The thinner the sample or the illuminated part of the sample, the better the optical conditions for imaging. In the case of surface-based SMLM, Total Internal Reflection Microscopy (TIRFM) [65,66] may be applied to reduce the background, while for localization of single molecules in the interior of living cells or tissue, confocal techniques or (in individual cases) light sheet illumination [67] have been reported. Generally, SMLM techniques using homogenous wide-field illumination need an irradiance, which is typically up to several orders of magnitude larger than the irradiance in conventional microscopy, i.e., up to 50 kW/cm2 [68] (see also Table 1), as well as a prolonged exposure time of a few seconds up to minutes, so that the risk of phototoxic cell damage is very high.
The SMLM of fluorophores like Atto 488, GFP, etc., usually requires either periodic illumination with low UV intensities and bleaching at larger wavelengths, or illumination around 488 nm, but with higher illumination intensities (kW/cm2 range). Under these conditions, the SMLM of unfixed cells (live at the beginning of SMLM imaging) is possible [29,69], but a long maintenance of an undisturbed physiological state is unlikely. Since the phototoxicity decreases drastically with the wavelength used, this problem may be overcome with fluorophores, which can be excited at much longer wavelengths. For example, to image the dynamics of human histone H2B protein in living HeLa cells by SMLM at about 20 nm resolution, Wombacher et al. [70] applied ATTO655 fluorophores excited at 647 nm with an intensity of 0.5–5 kW cm−2. Their data indicated that these intensities of red laser light applied for 30 min did not cause obvious single cell damage. Assuming that the HeLa cells have a nuclear size of 150 µm2, an illumination time of 30 min corresponded to a total dose around 1.4 J/nucleus. In other SMLM applications of live cell imaging [71], whole cell excitation intensities ≤ 10 kW∕cm2 at 561, 657, or 752 nm, and weak 405 nm activation intensities (typically up to 3 W∕cm2), were used for membrane imaging.
To realize live cell SMLM in thick cell aggregates (50 to 150 µm, compared to a few µm for cell monolayers), Zanacchi et al. [72] used a cylindrical lens to create the required superimposed activation (405 nm) and readout (561 nm) light sheets for photactivation of monomeric Cherry (H2B-PAmCherry). Activation and readout laser intensities were 50 W cm−2 and 8 kW cm−2, respectively; the total acquisition time was 2.5 min, with 33 frames per second, and the localization precision of single molecules was around 35 nm. With regard to the wavelengths used, the intensities applied appear to be rather high to keep the cells fully alive for a longer period. However, the possibility to study dynamic processes in live cell aggregates, such as spheroids at a single molecule resolution for a few minutes, already should be regarded as substantial progress. To lower the phototoxicity in live cell SMLM, the cellular area of interest might be limited, e.g., by the appropriate focusing of the exciting laser beam to a cellular area of a few µm2 diameter. If, for example, for a given SMLM application a whole cell irradiance of 500 W/cm2 is required [70], and if instead of the whole cellular area of 200 µm2, a region of interest of only 2 µm2 is illuminated (e.g., containing a specifically labeled multi-protein complex, or a small chromatin domain), the total photon energy load to the cell is expected to be 100 times smaller (under else equal conditions).
Another high-resolution SRM technique based on laser scanning microscopy is Stimulated Emission Depletion (STED) Microscopy [73,74,75,76,77,78] (Figure 4). Here, the enhancement of resolution is due to the suppression of fluorescence in the outer regions of a diffraction-limited illumination spot by the stimulated emission using a (second) donut-shaped laser beam (depletion beam), thus confining the measured fluorescence signal in the relevant spectral range to its central part. Thus, while a resolution down to a small nm range has been achieved experimentally [79], the irradiance typically exceeds that of a conventional fluorescence microscope by a factor of 104–105. Since fluorescence blocking by STED typically entails average intensities of a few kW/cm2 over the irradiated field and several MW/cm2 during the short dwell time of the laser on each spot (Airy disk), discerning fluorophores closer than d = 20 nm requires donut intensities of about 0.1–1 GW/cm2 [80] and may cause severe damage to living specimens However, experience has shown that at least for short times and small fields of view (a few µm in diameter) STED microscopy may be applied to living cells. For example, Westphal et al. [81] performed video-rate STED (28 frames per second) of fluorescently labeled synaptic vesicles with a focal spot size of 62 nanometers in live neurons, and measured the vesicles’ mobility within the highly confined space of synaptic boutons. For this, the intensities applied were 3.5–6 MW/cm2 for the excitation and 400 MW/cm2 for the depletion beam, respectively. However, the average power of the MaiTai Ti: sapphire laser used (with a pulse width in the order of 100 fs, a repetition rate of 80 MHZ, and a tuning range in the infrared) was only a few watts [82]. When using the photon energy delivered, e.g., by a 3-watt laser for a small cellular field of view of 4.5 µm2 (compared to an entire cell area of about 200 µm2), one might expect that the incident photon number would be smaller by a factor (200 µm2)/(4.5 µm2). If so, STED microscopy may indeed permit live cell SRM measurements with reduced phototoxicity during short times, provided that the field of analysis is restricted to an appropriately small cellular area of interest.
Recently, the problem of high phototoxicity was reduced with the introduction of MINFLUX and MINSTED nanoscopy [80,83,84,85] techniques based on the localization and tracking of single molecules in the intensity minimum of a donut-shaped laser beam. MINFLUX/MINSTED presently achieves an isotropic nanometer optical resolution (presently down to about 1 nm), with a localization precision in the Angström range. In contrast to conventional STED, these methods require only moderate light exposure since the on/off separation of spatially tight fluorophores is not performed by the doughnut, but by the on/off switching of individual fluorophores [80].
Usually, only normalized intensities are provided in the literature (e.g., [83,85]), which makes it difficult to quantify phototoxic effects in detail. If one assumes an incident continuous wave laser beam of 1 mW being focused to an Airy disk-shaped spot of 0.2 µm diameter (area 0.03 µm2), a focal intensity of about 3 MW/cm2 would be estimated. This suggests that in typical CLSM imaging applications, the local irradiance during the short dwell time on a single spot may already be far above the threshold for physiological live cell imaging. If one regards the total energy dose delivered to the specimen (e.g., 60 mJ at an irradiation time of 1 min), this is relatively low. Nonetheless, 1 mW of average incident laser power distributed over an entire cellular area would still pose a non-negligible risk for undisturbed live cell observations (e.g., 500 W/cm2, assuming a cellular area of 200 µm2). Table 1 summarizes the maximum light dose, typical irradiance, recording time, and maximum number of images acquired under non-phototoxic conditions for various methods of light microscopy.
According to Table 1, the typical illumination intensities of STED and photoswitching-based SMLM [13,31,56,57,58,59,60,62,63,64,65,66,67,68,69,70,71,86,87,88,89,90] exceed the phototoxicity limits for long-term live cell microscopy by far. However, if STED/SMLM is restricted to a sufficiently short observation time, or to a small region of interest (ROI) (e.g., AROI = 1 µm2 instead of 400 µm2 for the total cell area AC), the total number of photons is appropriately reduced (e.g., by the factor AC/AROI = 400). But even this much smaller photon load appears to be still too high to keep cells viable in the sense of undisturbed proliferation capability. Nonetheless, the experimental evidence [70,83,90] indicates that at least some specific cellular nanostructures may still be studied with these SRM methods under live cell conditions.

3. Focused Illumination

3.1. Visible Irradiation

While whole cells or even larger tissue samples are illuminated in various kinds of microscopy (as shown above), small areas, typically 1 µm2 or less, are irradiated by focused laser beams used as laser scissors, laser tweezers, or optoporation systems [5,6,7,46,91]. Mechanisms of cell damage are principally the same in both cases; however, an increasing role of multi-photon processes should be considered when laser light is focused on small spots and often applied as ultra-short pulses. This favors local damage via opto-mechanical destruction, whereas the viability of the whole cell is less affected. Liang et al. [92] performed more detailed wavelength-dependent studies on cell viability during focused laser irradiation and found the highest survival rates (as a percent of cells capable of clonal growth) at 800–850 nm and 950–1000 nm. Cell viability was maintained up to an irradiance of 26 MW/cm2 or 52 MW/cm2, and an irradiation time of 3, 5, or 10 min, thus corresponding to light doses between 4.68 and 31.2 GJ/cm2. Schneckenburger et al. [93] specified light doses up to 1 GJ/cm2 (8.3 MW/cm2 within 120 s) by applying around 670 nm (high-power laser diode) as well as at 1064 nm (Nd:YAG laser), at which cell viability was maintained, i.e., the percentage of colony formation (“plating efficiency”) was reduced by less than 10% in comparison with non-irradiated controls. At these wavelengths, one-photon absorption by water and most cellular pigments, as well as two-photon absorption by the coenzymes nicotinamide adenine dinucleotide (NADH) and flavin mono- or dinucleotide, were rather low. This proves that non-phototoxic light doses used in applications like laser tweezers exceed non-phototoxic light doses applied to whole cells by several orders of magnitude. Obviously, energy applied to a small spot may cause local damage, whereas excessive energy is dissipated over the cell and its environment, where it may reach a non-toxic level. The survival of cells in a laser tweezer system during experiments from several seconds to minutes favors numerous applications, e.g., micromanipulation [94], measurement of adhesion forces [95,96,97], deformability of cells [98,99] or single cell sorting, often in combination with microfluidics or chip technologies [100,101].
Generally, the light dose of about 10 J/cm2 and the irradiance of 100 mW/cm2 (solar irradiance at sea level), which are regarded as non-phototoxic for unfocused light, are increased considerably upon focusing. For example, focusing an eye lens with a numerical aperture between 0.1 and 0.2 [102] results in an irradiance of around 9 W/cm2 [38], and produces irreversible damage to the retina almost immediately. Furthermore, criteria, such as the proliferation rate, may not sufficiently include, for example, the influence of genetic modifications on the normal physiology of the cells. On the other side, for live cell imaging directed toward analyzing a short time level, e.g., the mobility of cellular components such as transcription factors [103], or toward studying the dynamics of membrane complexes and nucleosome clusters [70,71,90], the maintenance of long term cellular viability will be less relevant. Hence, the acceptable photo-damage in live cell microscopy will also depend on the type of research intended.

3.2. UV Irradiation

In addition to wide-field microscopy using homogeneous illumination with single-photon or multiphoton excitation [104], a variety of focused laser scanning methods has been applied for live cell imaging, such as confocal laser scanning fluorescence microscopy (CLSM), STED, Minflux/Minsted etc. (see above). The shorter (under otherwise equal conditions) the exciting wavelength was, the more enhanced the optical resolution. Hence, it should be desirable to use wavelengths as short as possible. For example, if at an excitation wavelength of 500 nm, an optical lateral resolution of about 200 nm is achieved in a conventional CLSM mode and an optical lateral resolution of about 100 nm is achieved in the Airy Scan mode; the use of a wavelength of 250 nm should permit an optical resolution down to 50 nm in the Airy Scan mode. However, while such a short wavelength would be ideal from the point of view of resolution, it would produce substantial problems for live cell imaging.
For example, a UV laser microbeam with a wavelength of 257.3 nm and a minimum spot diameter of approximately 0.5 µm has been used to irradiate small regions in interphase cells of the V-79 subline of Chinese hamster cells [105]. The incident energy, which was necessary to induce a significant decrease in proliferation, was 30 to 60 times larger after micro-irradiation of the cytoplasm than after micro-irradiation of the nucleoplasm. This confirms that the most sensitive cellular target for UV irradiation is the nuclear genome. In these studies, the incident energy dose per cell, which was compatible with about 50% cell proliferation after the micro-irradiation of the nucleoplasm was approximately 0.2 nJ/cell nucleus, corresponding to a local energy density within the laser focus of several 10 mJ/cm2. Similar energy doses were applied using UV laser micro-irradiation (with a spot diameter of about 1 µm) to live Chinese hamster interphase cells, resulting in a substantial labeling of the irradiation sites by antibodies against the UV-dimers produced by the 257 nm irradiation [106]. In combination with chemical substances like caffeine, such nuclear doses were sufficient to induce severe modifications of chromatin condensation in mammalian cells [107].
To elucidate a possible effect of the distribution of UV-induced photo-lesions (pyrimidine dimers), fibroblastoid Chinese hamster cells synchronized by mitotic selection were micro-irradiated in the G1 phase, using a low-power UV laser microbeam (λ = 257 nm); the incident energy was either concentrated on a small part of the nucleus (mode 1) or distributed over the whole nucleus (mode 2). Following micro-irradiation, the cells were incubated with 3H-thymidine for 2 h and thereafter processed for autoradiography. The findings [108] suggested that within the investigated range of energy doses (≈0.4 nJ/nucleus to 150 nJ/nucleus) and local energy densities (≈0.3 mJ/cm2 to 100 mJ/cm2), the total amount of unscheduled DNA synthesis (UDS) depends on the total number of dimers, but not on their spatial distribution in nuclear DNA.
Low doses of laser UV microirradiation (257 nm) were reported to also induce severe effects on embryonic development in insects [109]. Here, Drosophila embryos were locally irradiated with a 257 nm laser UV microbeam during blastoderm and germ band stages. The doses used did not eliminate nuclei or cells at once, but up to 50% of the adult survivors from irradiated eggs carried defects in the thorax. In these studies, a laser spot with a 10 µm diameter (energy: 500 or 1000 nJ) resulted in a local energy density of 160 mJ/cm2 and a local illumination intensity of 635 mW/cm2 or 1270 mW/cm2; the laser spot with a 20 µm diameter corresponded to a local light exposure of 160 mW/cm2 or 320 mW/cm2, respectively. Irradiation of wild-type Drosophila blastoderms with a UV laser microbeam with a 20 µm focal spot diameter and local energy densities of about 200 mJ/cm2 (total energy doses of about 700 mJ/nucleus) frequently resulted in localized cuticle defects in the ensuing larvae [110].
The low thresholds for cellular phototoxicity after UV micro-irradiation, with a wavelength (of 257 nm) in the absorption maximum of DNA, may be compared with the effects produced at longer wavelengths with homogeneous illumination. Due to their functional role, retina cells appear to be especially suited to explore the physiological limits of phototoxicity. For example, in studies with apes, Höh et al. [111]—using a wavelength of 441 nm and 1000 s of illumination of the Fovea, with an energy density of 30 J/cm2 (corresponding to an intensity of 30 mW/cm2 during the exposure time of 1000 s)—did not induce a visus reduction. In total, 60 J/cm2 (60 mW/cm2) resulted in a temporary visus reduction after 5 days and a recovery after 20–30 days; at 90 J/cm2 (90 mW/cm2), a permanent visus reduction without recovery was observed. This would correspond to an energy dose in the range of (4.5–13.5) × 10−5 J/nucleus, i.e., around four orders of magnitude higher than at 257 nm (see above), if the average area of the retina cell nuclei was 150 µm2 (30–90 J/cm2). To conclude, the available experimental evidence confirms the statements that typically live cell fluorescence microscopy imaging using wavelengths above 530 nm and illumination intensities below 100 mW/cm2 for whole cell irradiation can be performed with physiologically intact cells.

4. Discussion and Conclusions

For many years, light microscopy of fixed specimens has been one of the most important research tools of biology and medicine. The microscopy of live cells was restricted to a relatively few special cases, although its possibility had already been demonstrated by Antony van Leeuwenhoek when he first observed live structures later known as bacteria [112]. For many reasons, it became more desirable to also apply microscopy to live cells. The invention of phase microscopy [113] was an important step—which is presently used in all biomedical laboratories worldwide to monitor, e.g., cell cultures—and it is a necessary tool for a variety of cell manipulations, such as cloning [114,115]. However, such imaging approaches do not readily allow for the detailed analysis of specific cellular structures. Therefore, appropriate discrimination is required using, e.g., fluorescence techniques. While in fixed cells, this enabled an extended light microscopic image analysis of the most specific cell components, down to individual proteins as well as RNA and DNA sequences at the nanometer resolution, it created substantial challenges to keep the cells simultaneously alive. In this report, a short overview is given on state-of-the-art microscopy imaging with respect to its use in live cell analysis, such as wide-field microscopy, Confocal Laser Scanning Microscopy (CLSM), or Light Sheet Fluorescence Microscopy (LSFM), as well as Super Resolution Microscopy (SRM), including Structured Illumination Microscopy (SIM), Stimulated Emission depletion (STED) microscopy with its variants (MINFLUX/MINSTED), and Single Molecule Localization Microscopy (SMLM). To obtain a criterion for the applicability of such imaging methods in view of keeping cells alive, we considered, in particular, the photonic burden (illumination intensity and total energy delivered) in connection with these methods. Some main conclusions are:
-
The most sensitive cellular target with respect to cellular viability (in terms of proliferation potential) is the cell nucleus.
-
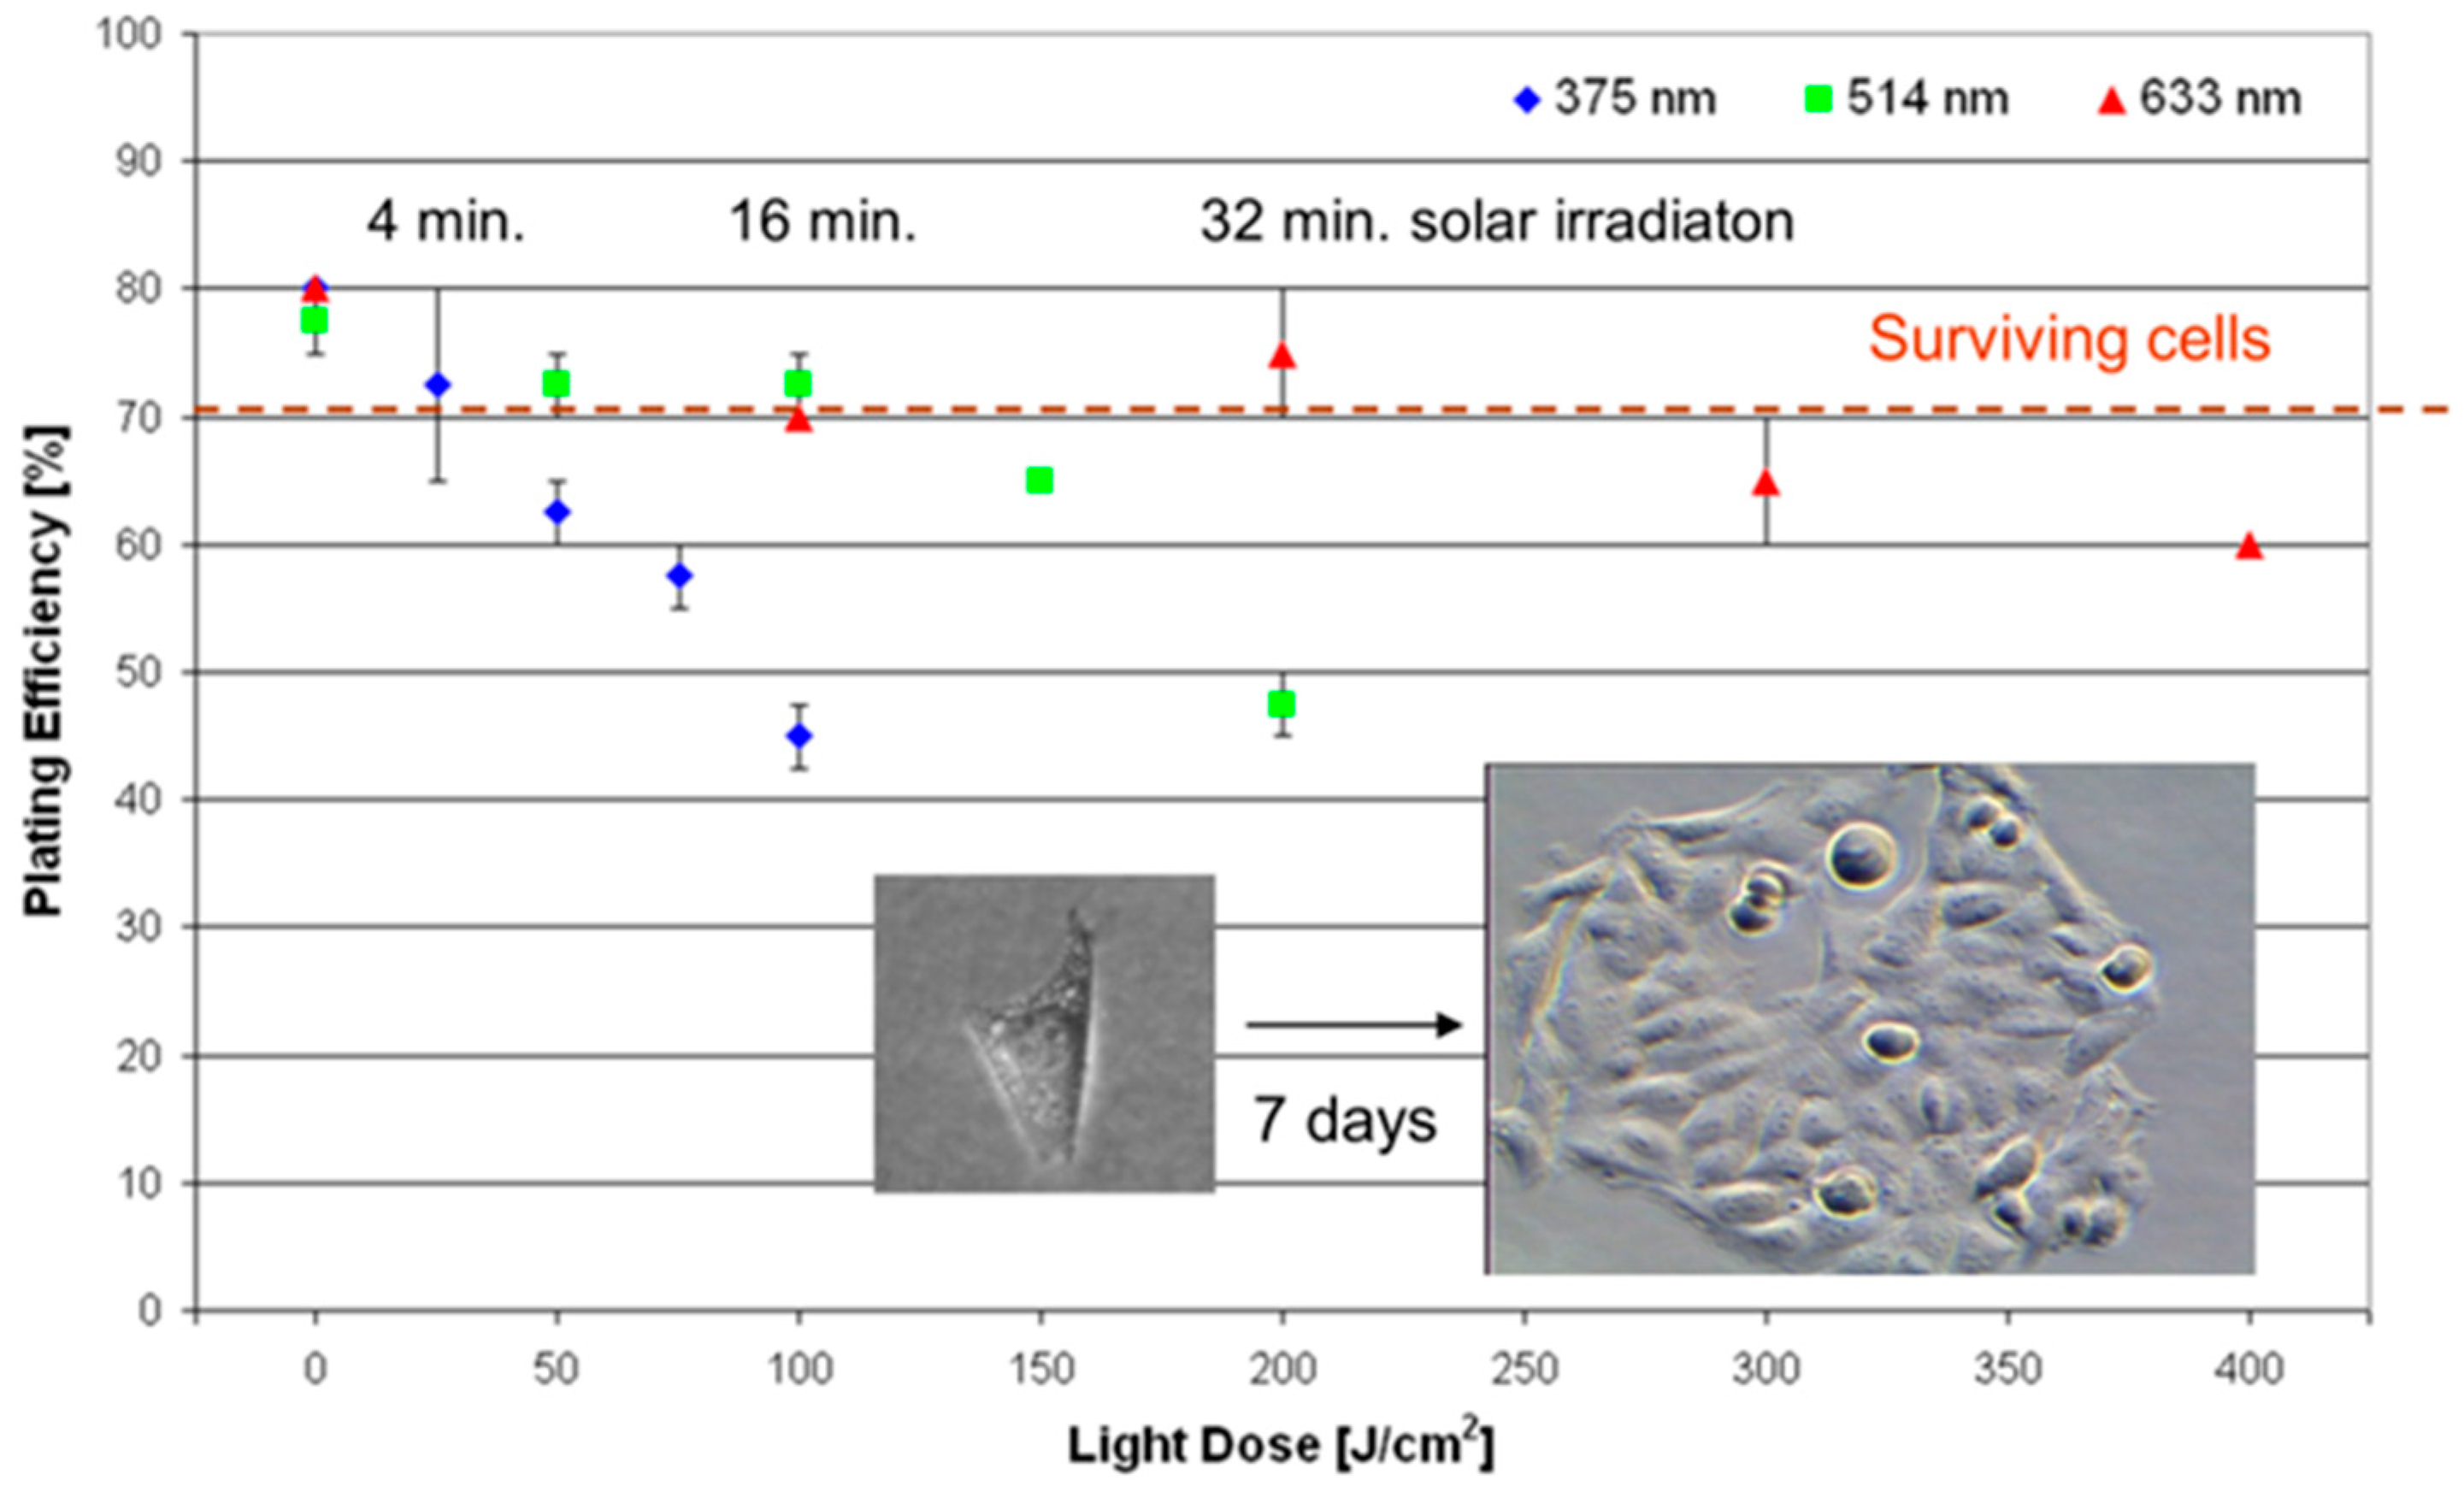
In whole cell irradiation, a profound dependence on the illuminating wavelength exists; while far UV light (absorption maximum of nucleic acids) is highly damaging, the phototoxicity decreases considerably with increasing excitation wavelength.
-
Super-Resolution Fluorescence Microscopy, with linear excitation modes (e.g., SIM, MINFLUX, and linear excitation localization) and wavelengths with low photonic energy, is largely compatible with a live cell status, especially if restricted to a small cellular region of interest.
-
Live cell applications of Super-Resolution Fluorescence microscopy using non-linear excitation modes (e.g., photoswitching based SMLM; STED) appear to be possible under specific conditions, (such as long excitation wavelengths and small fields of illumination), in particular, for short-term analyses of cellular nanostructures.
Software-based solutions may further contribute to reduce the phototoxicity toward living cells. In 2008, Hoebe et al. reported on a method called Controlled Light Exposure Microscopy (CLEM) with a non-uniform illumination of the field of view [116]. This permited the reduction of light exposure in the strongly fluorescent parts of the sample and, thus, the total number of excited fluorophore molecules. Self-learning algorithms may potentially help control the illumination of each pixel exactly in the future, such that its fluorescence can be well detected and localized, and that its phototoxicity can be kept at a minimum. Further development in camera and sensor technology as well as photo-stable fluorescent dyes and novel labeling procedures (using, e.g., nanographenes [117]) will contribute to an optimization of fluorescence imaging with low phototoxicity even down to the single-molecule level.

Author Contributions

H.S. and C.C. wrote this manuscript and contributed equally to the text. All authors have read and agreed to the published version of the manuscript.

Funding

This review received no external funding.

Institutional Review Board Statement

Not applicable.

Informed Consent Statement

Not applicable.

Data Availability Statement

Not applicable.

Acknowledgments

This manuscript includes the authors’ own experiments in cooperation with David Baddeley, Gerrit Best, Udo Birk, Sarah Bruns, Thomas Bruns, Thomas Cremer, Michael Hausmann, Rainer Heintzmann, Margit Lohs-Schardin, Verena Richter, Florian Schock, Michael Wagner, Petra Weber, and Christian Zorn.

Conflicts of Interest

The authors declare no conflicts of interest.

References

  1. Cadet, J.; Berger, M.; Douki, T.; Morin, B.; Raoul, S.; Ravanat, J.L.; Spinelli, S. Effects of UV and visible radiation on DNA-final base damage. Biol. Chem. 1997, 378, 1275–1286. [Google Scholar] [PubMed]
  2. Nakanishi, M.; Niida, H.; Murakami, H.; Shimada, M. DNA damage responses in skin biology—Implications in tumor prevention and aging acceleration. J. Dermatol. Sci. 2009, 56, 76–81. [Google Scholar] [CrossRef] [PubMed]
  3. Richa; Sinha, R.P.; Häder, D.P. Physiological aspects of UV-excitation of DNA. Top. Curr. Chem. 2015, 356, 203–248. [CrossRef]
  4. Schneckenburger, H.; Richter, V.; Wagner, M. Live-Cell Optical Microscopy with Limited Light Doses; SPIE Spotlight Series; SPIE: Bellingham, WA, USA, 2018; Volume 42, 38p, ISBN 9781510622593. [Google Scholar]
  5. Berns, M.W. A history of laser scissors (microbeams). Methods Cell Biol. 2007, 82, 1–58. [Google Scholar] [CrossRef] [PubMed]
  6. Ashkin, A. Optical trapping and manipulation of neutral particles using lasers. Proc. Natl. Acad. Sci. USA 1997, 94, 4853–4860. [Google Scholar] [CrossRef]
  7. Greulich, K.O. Micromanipulation by Light in Biology and Medicine: The Laser Microbeam and Optical Tweezers; Birkhäuser: Basel, Switzerland; Boston, MA, USA; Berlin, Germany, 1999. [Google Scholar]
  8. Scott, T.G.; Spencer, R.G.; Leonard, N.J.; Weber, G. Emission properties of NADH. Studies of fluorescence lifetimes and quantum efficiencies of NADH, AcPyADH and simplified synthetic models. J. Am. Chem. Soc. 1970, 92, 687–695. [Google Scholar] [CrossRef]
  9. Galland, P.; Senger, H. The role of flavins as photoreceptors. J. Photochem. Photobiol. B 1988, 1, 277–294. [Google Scholar] [CrossRef]
  10. Ormond, A.B.; Freeman, H.S. Dye Sensitizers for Photodynamic Therapy. Materials 2013, 6, 817–840. [Google Scholar] [CrossRef]
  11. Schneckenburger, H.; Weber, P.; Wagner, M.; Schickinger, S.; Richter, V.; Bruns, T.; Strauss, W.S.; Wittig, R. Light exposure and cell viability in fluorescence microscopy. J. Microsc. 2012, 245, 311–318. [Google Scholar] [CrossRef]
  12. Jonkman, J.; Brown, C.M.; Wright, G.D.; Anderson, K.I.; North, A.J. Tutorial: Guidance for quantitative confocal microscopy. Nat. Protoc. 2020, 15, 1585–1611. [Google Scholar] [CrossRef]
  13. Ehrenberg, M. The Nobel Prize in Chemistry 2014 (Press Release). Available online: http://www.nobelprize.org/nobel_prizes/chemistry/laureates/2014/ (accessed on 1 January 2025).
  14. Masters, B.R. Selected Papers on Confocal Microscopy; SPIE Milestone Series; SPIE Optical Engineering Press: Bellingham, WA, USA, 1996; Volume MS 131. [Google Scholar]
  15. Huisken, J.; Swoger, J.; del Bene, F.; Wittbrodt, J.; Stelzer, E.H.K. Optical sectioning deep inside live embryos by SPIM. Science 2004, 305, 1007–1009. [Google Scholar] [CrossRef] [PubMed]
  16. Santi, P.A. Light sheet fluorescence microscopy: A review. J. Histochem. Cytochem. 2011, 59, 129–138. [Google Scholar] [CrossRef] [PubMed]
  17. Pampaloni, F.; Chang, B.-J.; Stelzer, E.H.K. Light sheet-based fluorescence microscopy (LSFM) for the quantitative imaging of cells and tissues. Cell Tissue Res. 2015, 360, 129–141. [Google Scholar] [CrossRef] [PubMed]
  18. Bruns, T.; Schickinger, S.; Schneckenburger, H. Single plane illumination module and micro-capillary approach for a wide-field microscope. J. Vis. Exp. 2014, 15, e51993. [Google Scholar] [CrossRef]
  19. Abbe, E. Beiträge zur Theorie des Mikroskops und der mikroskopischen Wahrnehmung. Arch. Mikrosk. Anat. 1873, 9, 413–418. [Google Scholar] [CrossRef]
  20. Rayleigh, L. On the Theory of Optical Images, with Special Reference to the microscope. Lond. Edinb. Dublin Philos. Mag. J. Sci. 1896, 42, 167–195. [Google Scholar] [CrossRef]
  21. Wu, X.; Hammer, J.A. ZEISS Airyscan: Optimizing Usage for Fast, Gentle, Super-Resolution Imaging. Methods Mol. Biol. 2021, 2304, 111–130. [Google Scholar] [CrossRef]
  22. Weisshart, K. The Basic Principle of Airyscanning. Carl Zeiss. 2014. Available online: https://pages.zeiss.com/rs/896-XMS-794/images/ZEISS-Microscopy (accessed on 1 January 2025).
  23. Müller, C.B.; Enderlein, J. Image Scanning Microscopy. Phys. Rev. Lett. 2010, 104, 198101. [Google Scholar] [CrossRef]
  24. Cremer, C.; Masters, B.R. Resolution enhancement techniques in microscopy. Eur. Phys. J. H 2013, 38, 281–344. [Google Scholar] [CrossRef]
  25. Sydor, A.M.; Czymmek, K.J.; Puchner, E.M.; Mennella, V. Super-resolution microscopy: From single molecules to supramolecular assemblies. Trends Cell Biol. 2015, 25, 730–748. [Google Scholar] [CrossRef]
  26. Galbraith, C.G.; Galbraith, J.A. Super-resolution microscopy at a glance. J. Cell Sci. 2011, 124, 1607–1611. [Google Scholar] [CrossRef] [PubMed]
  27. Toraldo di Francia, G. Resolving power and information. J. Opt. Soc. Am. 1955, 45, 497–499. [Google Scholar] [CrossRef]
  28. Cox, S. Super-resolution imaging in live cells. Dev. Biol. 2015, 40, 175–181. [Google Scholar] [CrossRef] [PubMed]
  29. Cremer, C.; Kaufmann, R.; Gunkel, M.; Pres, S.; Weiland, Y.; Müller, P.; Ruckelshausen, T.; Lemmer, P.; Geiger, F.; Degenhard, S.; et al. Superresolution imaging of biological nanostructures by spectral precision distance microscopy. Biotechnol. J. 2011, 6, 1037–1051. [Google Scholar] [CrossRef] [PubMed]
  30. Shtengel, G.; Galbraith, J.A.; Galbraith, C.G.; Lippincott-Schwartz, J.; Gillette, J.M.; Manley, S.; Sougrat, R.; Waterman, C.M.; Kanchanawong, P.; Davidson, M.W.; et al. Interferometric fluorescent super-resolution microscopy resolves 3D cellular ultrastructure. Proc. Natl. Acad. Sci. USA 2009, 106, 3125–3130. [Google Scholar] [CrossRef]
  31. Birk, U. Super-Resolution Microscopy-A Practical Guide; Wiley-VCH: Weinheim, Germany, 2017; ISBN 978-3-527-34133-7. [Google Scholar]
  32. Heintzmann, R. Answers to fundamental questions in superresolution microscopy. Phil. Trans. R.Soc. A 2021, 379, 20210105. [Google Scholar] [CrossRef]
  33. Schermelleh, L.; Ferrand, A.; Huser, T.; Eggeling, C.; Sauer, M.; Biehlmaier, O.; Drummen, G.P.C. Super-resolution microscopy demystified. Nat. Cell Biol. 2019, 21, 72–84. [Google Scholar] [CrossRef]
  34. Fornasiero, E.F.; Opazo, F. Super-resolution imaging for cell biologists: Concepts, applications, current challenges and developments. Bioessays 2015, 37, 436–451. [Google Scholar] [CrossRef]
  35. Gustafsson, M.G.; Shao, L.; Carlton, P.M.; Wang, C.J.R.; Golubovskaya, I.N.; Cande, W.Z.; Agard, D.A.; Sedat, J.W. Three-Dimensional Resolution Doubling in Wide-Field Fluorescence Microscopy by Structured Illumination. Biophys. J. 2008, 94, 4957–4970. [Google Scholar] [CrossRef]
  36. Hirvonen, L.M.; Wicker, K.; Mandula, O.; Heintzmann, R. Structured illumination microscopy of a living cell. Eur. Biophys. J. 2009, 38, 807–812. [Google Scholar] [CrossRef]
  37. Heintzmann, R.; Cremer, C. Lateral modulated excitation microscopy: Improvement of resolution by using a diffraction grating. Proc. SPIE 1999, 3568, 185–196. [Google Scholar] [CrossRef]
  38. Schock, F.; Best, G.; Celik, N.; Heintzmann, R.; Dithmar, S.; Cremer, C. Structured illumination ophthalmoscope: Super-resolution microscopy on the living human eye. Phil. Trans. R. Soc. A 2022, 380, 20210151. [Google Scholar] [CrossRef] [PubMed]
  39. Allen, J.R.; Ross, S.T.; Davidson, M.W. Structured illumination microscopy for superresolution. Chem. Phys. Chem. 2014, 15, 566–576. [Google Scholar] [CrossRef] [PubMed]
  40. Chakrova, N.; Heintzmann, R.; Rieger, B.; Stallinga, S. Studying different illumination patterns for resolution improvement influorescence microscopy. Opt Exp. 2015, 23, 31367–31383. [Google Scholar] [CrossRef]
  41. Li, D.; Shao, L.; Chen, B.-C.; Zhang, X.; Zhang, M.; Moses, B.; Milkie, D.E.; Beach, J.R.; Hammer, J.A.; Pasham, M.; et al. Extended resolution structured illumination imaging of endocytic and cytoskeletal dynamics. Science 2015, 349, aab3500. [Google Scholar] [CrossRef]
  42. Gustafsson, M.G.L. Nonlinear structured-illumination microscopy: Wide-field fluorescence imaging with theoretically unlimited resolution. Proc Natl Acad. Sci. USA 2005, 102, 13081–13086. [Google Scholar] [CrossRef]
  43. Heintzmann, R.; Huser, T. Super-resolution structured illumination microscopy. Chem. Rev. 2017, 117, 13890–13908. [Google Scholar] [CrossRef]
  44. Gustafsson, M.G.L. Surpassing the lateral resolution limit by a factor of two using structured illumination microscopy. J. Microsc. 2000, 198, 82–87. [Google Scholar] [CrossRef]
  45. Kraus, F.; Miron, E.; Demmerle, J.; Chitiashvili, T.; Budco, A.; Alle, Q.; Matsuda, A.; Leonhardt, H.; Schermelleh, L.; Markaki, Y. Quantitative 3D structured illumination microscopy of nuclear structures. Nat. Protoc. 2017, 12, 1011–1027. [Google Scholar] [CrossRef]
  46. Schneckenburger, H. Lasers in Live Cell Microscopy. Int. J. Mol. Sci. 2022, 23, 5015. [Google Scholar] [CrossRef]
  47. Supekar, O.D.; Sias, A.; Hansen, S.R.; Martinez, G.; Peet, G.C.; Peng, X.; Bright, V.M.; Hughes, E.G.; Restrepo, D.; Shepherd, D.P.; et al. Miniature structured illumination microscope for in vivo 3D imaging of brain structures with optical sectioning. Biomed. Opt. Exp. 2022, 13, 2531. [Google Scholar] [CrossRef] [PubMed]
  48. Löschberger, A.; Novikau, Y.; Netz, R.; Spindler, M.C.; Benavente, R.; Klein, T.; Kleppe, D.I. Super-Resolution Imaging by Dual iterative Structured Illumination Microscopy, Carl Zeiss. 2017. Available online: https://www.zeiss.com/microscopy/en/products/light-microscopes/super-resolution-microscopes/elyra-7.html? (accessed on 1 January 2025).
  49. Wang, F.; Ma, Z.; Zhong, Y.; Salazar, F.; Xu, C.; Ren, F.; Qu, L.; Wu, A.M.; Dai, H. In vivo NIR-II structured-illumination light-sheet microscopy. Proc Natl Acad. Sci. USA 2021, 118, e2023888118. [Google Scholar] [CrossRef] [PubMed]
  50. ISO 15004-2:2007; Ophthalmic Instruments—Fundamental Requirements and Test Methods, Part 2: Light Hazard Protection. International Organization for Standardization: Geneva, Switzerland, 2019. Available online: https://www.iso.org/standard/38952.html (accessed on 1 January 2025).
  51. Fischer, J.; Otto, T.; Delori, F.; Pace, L.; Staurenghi, G. Scanning Laser Ophthalmoscopy (SLO). In High Resolution Imaging in Microscopy and Ophthalmology. New Frontiers in Biomedical Optics; Bille, J.F., Ed.; Springer: Berlin/Heidelberg, Germany, 2019. Available online: https://www.ncbi.nlm.nih.gov/books/NBK554043/ (accessed on 1 January 2025).
  52. Cremer, C.; Schock, F.; Failla, A.V.; Birk, U. Modulated illumination microscopy: Application perspectives in nuclear nanostructure analysis. J. Microsc. 2024, 296, 121–128. [Google Scholar] [CrossRef] [PubMed]
  53. Lanni, F.; Bailey, B.; Farkas, D.L.; Taylor, D.L. Excitation field synthesis as a means for obtaining enhanced axial resolution in fluorescence microscopes. Bioimaging 1993, 1, 187–196. [Google Scholar] [CrossRef]
  54. Frohn, J.; Knapp, H.; Stemmer, A. True optical resolution beyond the Rayleigh limit achieved by standing wave illumination. Proc. Natl. Acad. Sci. USA 2000, 97, 7232–7236. [Google Scholar] [CrossRef]
  55. Bailey, B.; Farkas, D.; Taylor, D.L.; Lanni, F. Enhancement of axial resolution in fluorescence microscopy by standing-wave excitation. Nature 1993, 366, 44–48. [Google Scholar] [CrossRef]
  56. Reymann, J.; Baddeley, D.; Gunkel, M.; Lemmer, P.; Stadter, W.; Jegou, T.; Rippe, K.; Cremer, C.; Birk, U. High precision structural analysis of subnuclear complexes in fixed and live cells via spatially modulated illumination (SMI) microscopy. Chromosome Res. 2008, 16, 367–382. [Google Scholar] [CrossRef]
  57. Reinhardt, S.C.M.; Masullo, L.A.; Baudrexel, I.; Steen, P.R.; Kowalewski, R.; Eklund, A.S.; Strauss, S.; Unterauer, E.M.; Schlichthaerle, T.; Strauss, M.T.; et al. Ångström-resolution fluorescence microscopy. Nature 2023, 617, 711–716. [Google Scholar] [CrossRef]
  58. Betzig, E.; Patterson, G.H.; Sougrat, R.; Lindwasser, O.W.; Olenych, S.; Bonifacino, J.S.; Davidson, M.W.; Lippincott-Schwartz, J.; Hess, H.F. Imaging intracellular fluorescent proteins at nanometer resolution. Science 2006, 313, 1642–1645. [Google Scholar] [CrossRef]
  59. Rust, M.J.; Bates, M.; Zhuang, X. Sub-diffraction-limit imaging by stochastic optical reconstruction microscopy (STORM). Nat. Methods 2006, 3, 793–796. [Google Scholar] [CrossRef]
  60. Hess, S.T.; Girirajan, T.P.; Mason, M.D. Ultra-High Resolution Imaging by Fluorescence Photoactivation Localization Microscopy. Biophys. J. 2006, 91, 4258–4272. [Google Scholar] [CrossRef] [PubMed]
  61. Cox, S.; Rosten, E.; Monypenny, J.; Jovanovic-Talisman, T.; Burnette, D.T.; Lippincott-Schwartz, J.; E Jones, G.; Heintzmann, R. Bayesian localization microscopy reveals nanoscale podosome dynamics. Nat. Methods 2011, 9, 195–200. [Google Scholar] [CrossRef] [PubMed]
  62. Ha, T. Single-molecule methods leap ahead. Nat. Methods 2014, 11, 1015–1018. [Google Scholar] [CrossRef] [PubMed]
  63. Cremer, C.; Szczurek, A.; Schock, F.; Gourram, A.; Birk, U. Super-resolution microscopy approaches to nuclear nanostructure imaging. Methods 2017, 123, 11–32. [Google Scholar] [CrossRef]
  64. Gelléri, M.; Chen, S.-Y.; Hübner, B.; Neumann, J.; Kröger, O.; Sadlo, F.; Imhoff, J.; Hendzel, M.J.; Cremer, M.; Cremer, T.; et al. True-to-scale DNA-density maps correlate with major accessibility differences between active and inactive chromatin. Cell Rep. 2023, 42, 112567. [Google Scholar] [CrossRef]
  65. Reck-Peterson, S.L.; Derr, N.D.; Stuurman, N. Imaging single molecules using total internal reflection fluorescence microscopy (TIRFM). Cold Spring Harb. Protoc. 2010, 2010, pdb.top73. [Google Scholar] [CrossRef]
  66. Luo, W.; He, K.; Xia, T.; Fang, X. Single-molecule monitoring in living cells by use of fluorescence microscopy. Anal. Bioanal. Chem. 2013, 405, 43–49. [Google Scholar] [CrossRef]
  67. Ritter, J.G.; Veith, R.; Veenendaal, A.; Siebrasse, J.P.; Kubitscheck, U. Light Sheet Microscopy for Single Molecule Tracking in Living Tissue. PLoS ONE 2010, 5, e11639. [Google Scholar] [CrossRef]
  68. Barentine, A.E.; Lin, Y.; Courvan, E.M.; Kidd, P.; Liu, M.; Balduf, L.; Baddeley, D. An integrated platform for high-throughput nanoscopy. Nat. Biotechnol. 2023, 41, 1549–1556. [Google Scholar] [CrossRef]
  69. Lakadamyali, M. Super-Resolution Microscopy: Going Live and Going Fast. Chem. Phys. Chem. 2014, 15, 630–636. [Google Scholar] [CrossRef]
  70. Wombacher, R.; Heidbreder, M.; van de Linde, S.; Sheetz, M.P.; Heilemann, M.; Cornish, V.W.; Sauer, M. Live-cell super-resolution imaging with trimethoprim conjugates. Nat. Methods 2010, 7, 717–719. [Google Scholar] [CrossRef] [PubMed]
  71. Shim, S.-H.; Xia, C.; Zhong, G.; Babcock, H.P.; Vaughan, J.C.; Huang, B.; Wang, X.; Xu, C.; Bi, G.-Q.; Zhuang, X. Super-resolution fluorescence imaging of organelles in live cells with photoswitchable membrane probes. Proc. Natl. Acad. Sci. USA 2012, 109, 13978–13983. [Google Scholar] [CrossRef] [PubMed]
  72. Zanacchi, F.C.; Lavagnino, Z.; Donnorso, M.P.; Del Bue, A.; Furia, L.; Faretta, M.; Diaspro, A. Live-cell 3D superresolution imaging in thick biological samples. Nat. Methods 2017, 8, 1047–1049. [Google Scholar] [CrossRef] [PubMed]
  73. Hell, S.W.; Wichmann, J. Breaking the diffraction resolution limit by stimulated emission: Stimulated-emission-depletion fluorescence microscopy. Opt. Lett. 1994, 19, 780–782. [Google Scholar] [CrossRef]
  74. Wildanger, D.; Medda, R.; Kastrup, L.; Hell, S. A compact STED microscope providing 3D nanoscale resolution. J. Microsc. 2009, 236, 35–43. [Google Scholar] [CrossRef]
  75. Blom, H.; Widengren, J. STED microscopy—Towards broadened use and scope of applications. Curr. Opin. Chem. Biol. 2014, 20, 127–133. [Google Scholar] [CrossRef]
  76. Hofmann, M.; Eggeling, C.; Jakobs, S.; Hell, S.W. Breaking the diffraction barrier in fluorescence microscopy at low light intensities by using reversibly photoswitchable proteins. Proc. Natl. Acad. Sci. USA 2005, 102, 17565–17569. [Google Scholar] [CrossRef]
  77. Hell, S.W. Microscopy and its focal switch. Nat. Methods 2009, 6, 24–32. [Google Scholar] [CrossRef]
  78. Chmyrov, A.; Keller, J.; Grotjohann, T.; Ratz, M.; D’Este, E.; Jakobs, S.; Eggeling, C.; Hell, S.W. Nanoscopy with more than 100,000 ‘Doughnuts’. Nat. Methods 2013, 10, 737–740. [Google Scholar] [CrossRef]
  79. Rittweger, E.; Han, K.Y.; Irvine, S.E.; Eggeling, C.; Hell, S.W. STED microscopy reveals crystal colour centres with nanometric resolution. Nat. Photonics 2009, 3, 144147. [Google Scholar] [CrossRef]
  80. Weber, M.; Leutenegger, M.; Stoldt, S.; Jakobs, S.; Mihaila, T.S.; Butkevich, A.N.; Hell, S.W. MINSTED fluorescence localization and nanoscopy. Nat. Photonics 2021, 15, 361–366. [Google Scholar] [CrossRef] [PubMed]
  81. Westphal, V.; Rizzoli, S.O.; Lauterbach, M.A.; Kamin, D.; Jahn, R.; Hell, S.W. Video-Rate far-field optical nanoscopy dissects synaptic vesicle movement. Science 2008, 320, 246–249. [Google Scholar] [CrossRef] [PubMed]
  82. Mai Tai® One Box Ti:Sapphire Ultrafast Lasers. Spectra Physic. 2014. Available online: https://www.spectra-physics.com/en/f/mai-tai-ultrafast-laser (accessed on 1 January 2025).
  83. Balzarotti, F.; Eilers, Y.; Gwosch, K.C.; Gynnå, A.H.; Westphal, V.; Stefani, F.D.; Elf, J.; Hell, S.W. Nanometer resolution imaging and tracking of fluorescent molecules with minimal photon fluxes. Science 2016, 355, 606–612. [Google Scholar] [CrossRef] [PubMed]
  84. Gwosch, K.C.; Pape, C.; Balzarotti, J.K.; Hoess, F.; Ellenberg, P.; Ries, J.; Hell, S.W. MINFLUX nanoscopy delivers 3D multicolor nanometer resolution in cells. Nat. Methods 2020, 17, 217–224. [Google Scholar] [CrossRef] [PubMed]
  85. Sahl, S.J.; Matthias, J.; Inamdar, K.; Weber, M.; Khan, T.A.; Brüser, C.; Jakobs, S.; Becker, S.; Griesinger, C.; Broichhagen, J.; et al. Direct optical measuerement of intramolecular distances with Angström precision. Science 2024, 386, 180–187. [Google Scholar] [CrossRef]
  86. Huang, B.; Wang, W.; Bates, M.; Zhuang, X. Three-dimensional super-resolution imaging by stochastic optical reconstruction microscopy. Science 2008, 319, 810–813. [Google Scholar] [CrossRef]
  87. Heilemann, M.; van de Linde, S.; Schüttpelz, M.; Kasper, R.; Seefeldt, B.; Mukherjee, A.; Tinnefeld, P.; Sauer, M. Subdiffraction-resolution fluorescence imaging with conventional fluorescent probes. Angew. Chem. Int. Ed. 2008, 47, 6172–6176. [Google Scholar] [CrossRef]
  88. Lemmer, P.; Gunkel, M.; Baddeley, D.; Kaufmann, R.; Urich, A.; Weiland, Y.; Reymann, J.; Müller, P.; Hausmann, M.; Cremer, C. SPDM: Light microscopy with single-molecule resolution at the nanoscale. Appl. Phys. B 2008, 93, 1–12. [Google Scholar] [CrossRef]
  89. Huang, B.; Jones, S.A.; Brandenburg, B.; Zhuang, X. Whole-cell 3D STORM reveals interactions between cellular structures with nanometer-scale resolution. Nat. Methods 2008, 5, 1047–1052. [Google Scholar] [CrossRef]
  90. Ricci, M.A.; Manzo, C.; Garcıa-Parajo, M.F.; Lakadamyali, M.; Cosma, M.P. Chromatin fibers are formed by heterogeneous groups of nucleosomes in vivo. Cell 2015, 160, 1145–1158. [Google Scholar] [CrossRef]
  91. Schneckenburger, H. Laser-assisted optoporation of cells and tissues—A mini-review. Biomed. Opt. Express 2019, 10, 2883–2888. [Google Scholar] [CrossRef] [PubMed]
  92. Liang, H.; Vu, K.T.; Krishnan, P.; Trang, T.C.; Shin, D.; Kimel, S.; Berns, M.W. Wavelength dependence of cell cloning efficiency after optical trapping. Biophys. J. 1996, 70, 1529–1533. [Google Scholar] [CrossRef] [PubMed]
  93. Schneckenburger, H.; Hendinger, A.; Sailer, R.; Gschwend, M.H.; Strauss, W.S.; Bauer, M.; Schütze, K. Cell viability in optical tweezers: High power red laser diode versus Nd:YAG laser. J. Biomed. Opt. 2000, 5, 40–44. [Google Scholar] [CrossRef] [PubMed]
  94. Greulich, K.O. Manipulation of cells with laser microbeam scissors and optical tweezers: A review. Rep. Prog. Phys. 2017, 80, 026601. [Google Scholar] [CrossRef]
  95. Khalili, A.A.; Ahmad, A.R. A Review of Cell Adhesion Studies for Biomedical and Biological Applications. Int. J. Mol. Sci. 2015, 16, 18149–18184. [Google Scholar] [CrossRef]
  96. Park, S.; Kim, J.; Yoon, S.H. A Review on Quantitative Measurement of Cell Adhesion Strength. J. Nanosci. Nanotechnol. 2016, 16, 4256–4273. [Google Scholar] [CrossRef]
  97. Arbore, C.; Perego, L.; Sergides, M.; Capitanio, M. Probing force in living cells with optical tweezers: From single-molecule mechanics to cell mechanotransduction. Biophys. Rev. 2019, 11, 765–782. [Google Scholar] [CrossRef]
  98. Musielak, M. Red blood cell-deformability measurement: Review of techniques. Clin. Hemorheol. Microcirc. 2009, 42, 47–64. [Google Scholar] [CrossRef]
  99. Priezzhev, A.; Lee, K. Potentialities of laser trapping and manipulation of blood cells in hemorheologic research. Clin. Hemorheol. Microcirc. 2016, 64, 587–592. [Google Scholar] [CrossRef] [PubMed]
  100. Arai, F.; Ng, C.; Maruyama, H.; Ichikawa, A.; El-Shimy, H.; Fukuda, T. On chip single-cell separation and immobilization using optical tweezers and thermo-sensitive hydrogel. Lab Chip 2005, 5, 1399–1403. [Google Scholar] [CrossRef]
  101. Wang, X.; Chen, S.; Kong, M.; Wang, Z.; Costa, K.D.; Li, R.A.; Sun, D. Enhanced cell sorting and manipulation with combined optical tweezer and microfluidic chip technologies. Lab Chip 2011, 11, 3656–3662. [Google Scholar] [CrossRef] [PubMed]
  102. Kaschke, M.; Donnerhacke, K.-H.; Rill, M.S. Optical Devices in Ophthalmology and Optometry: Technology, Design Principles, and Clinical Applications; Wiley: Hoboken, NJ, USA, 2014. [Google Scholar] [CrossRef]
  103. Szczurek, A.T.; Dimitrova, E.; Kelley, J.R.; Blackledge, N.P.; Klose, R.J. The Polycomb system sustains promoters in a deep OFF state by limiting pre-initiation complex formation to counteract transcription. Nat. Cell Biol. 2024, 26, 1700–1711. [Google Scholar] [CrossRef] [PubMed]
  104. Peker, B.; Rausch, M. Microscopy of Organoids. Breakthrough in live cell microscopy of 3D cellular models. Microsc. Anal. 2020, 34, 15–17. [Google Scholar]
  105. Cremer, C.; Cremer, T.; Zorn, C.; Schoeller, L. Effects of laser-uv-microirradiation (λ = 257 nm) on proliferation of Chinese hamster cells. Radiat. Res. 1976, 66, 106–121. [Google Scholar] [CrossRef] [PubMed]
  106. Cremer, C.; Cremer, T.; Fukuda, M.; Nakanishi, K. Detection of Laser-uv-microirradiation induced DNA photolesions by immunofluorescent staining. Hum. Genet. 1980, 54, 107–110. [Google Scholar] [CrossRef]
  107. Zorn, C.; Cremer, T.; Cremer, C.; Zimmer, J. Laser-uv-micro-irradiation of interphase nuclei and posttreatment with caffeine: A new approach to establish the arrangement of interphase chromosomes. Hum. Genet. 1976, 35, 83–89. [Google Scholar] [CrossRef]
  108. Cremer, C.; Cremer, T.; Jabbur, G. Laser-uv-microirradiation of Chinese hamster cells: The influence of the distribution of photolesions on unscheduled DNA synthesis. Photochem. Photobiol. 1981, 33, 925–928. [Google Scholar] [CrossRef]
  109. Lohs-Schardin, M.; Sander, K.; Cremer, C.; Cremer, T.; Zorn, C. Localized ultraviolet laser microbeam irradiation of early Drosophila embryos: Fate maps based on location and frequency of adult defects. Develop. Biol. 1979, 68, 533–545. [Google Scholar] [CrossRef]
  110. Nüsslein-Volhard, C.H.; Lohs-Schardin, M.; Sander, K.; Cremer, C. A dorso-ventral shift of embryonic primordia in a new maternal-effect mutant of Drosophila. Nature 1980, 283, 474–476. [Google Scholar] [CrossRef]
  111. Höh, A.E.; Ach, T.; Amberger, R.; Dithmar, S. Lichtexposition bei vitreoretinaler Chirurgie. Ophthalmologe 2008, 105, 898–904. [Google Scholar] [CrossRef]
  112. Available online: https://en.wikipedia.org/wiki/Antonie_van_Leeuwenhoek (accessed on 1 January 2025).
  113. Zernike, F. Das Phasenkontrastverfahren bei der mikroskopischen Beobachtung. Phys. Zeitschr. 1935, 36, 848–851. [Google Scholar]
  114. Campbell, K.H.S.; McWhir, J.; Ritchie, W.A.; Wilmut, I. Sheep cloned by nuclear transfer from a cultured cell line. Nature 1996, 380, 64–66. [Google Scholar] [CrossRef] [PubMed]
  115. Wilmut, I.; Schnieke, A.E.; McWhir, J.; Kind, A.J.; Campbell, K.H.S. Viable offspring derived from fetal and adult mammalian cells. Nature 1997, 385, 810–813. [Google Scholar] [CrossRef] [PubMed]
  116. Hoebe, R.A.; Van der Voort, H.T.; Stap, J.; Van Noorden, C.J.; Manders, E.M. Quantitative determination of the reduction of phototoxicity and photobleaching by controlled light exposure microscopy. J. Microsc. 2008, 231 Pt 1, 9–20. [Google Scholar] [CrossRef]
  117. Zhu, X.; Chen, Q.; Zhao, H.; Yang, Q.; Goudappagouda; Gelléri, M.; Ritz, S.; Ng, D.; Koynov, K.; Parekh, S.H.; et al. Intrinsic Burst-Blinking Nanographenes for Super-Resolution Bioimaging. J. Am. Chem. Soc. 2024, 146, 5195–5203. [Google Scholar] [CrossRef]
Figure 1. Plating efficiency of U373-MG glioblastoma cells upon whole cell irradiation with wavelengths of 375, 514, or 633 nm and variable light doses. Percentage of cells forming colonies within 7 days after seeding. Values represent medians ± MADs (median absolute deviations). Cells are regarded as viable after a less than 10% reduction in the plating efficiency, measured at 0 J/cm2, i.e., up to 25, 100, or 200 J/cm2 after illumination with wavelengths of 375, 514, or 633 nm, respectively. Inset: the principle of the colony-forming assay. Reproduced from [4] with modifications.
Biophysica 05 00001 g001
Figure 2. Principle of CLSM; (a) selected planes of a cell spheroid transfected with membrane-associated GFP at 15 µm (b) or 60 µm (c) from its edge (CLSM); principle of light sheet illumination and fluorescence detection (d), as well as the technical realization of illumination in LSFM (e).
Biophysica 05 00001 g002
Figure 3. Principle of Structured Illumination Microscopy (SIM) with interfering first diffraction orders of an optical grating or a spatial light modulator in the focus of a collimating lens. The interference pattern is imaged in the plane of the sample by the tube lens (TL) and the microscope objective lens (Obj) with an intermediate focus in the microscope aperture A (a); fluorescent polystyrene beads, 200 nm in size, recorded by wide-field microscopy (b) or SIM (c) with doubling of resolution. Reproduced from [46] with modifications.
Biophysica 05 00001 g003
Figure 4. Principle of STED microscopy (explanations see text).
Biophysica 05 00001 g004
Table 1. Non-phototoxic light doses and the maximum number of images for various methods of 3D live cell microscopy with conventional fluorescent markers or fluorescent proteins, as deduced from Reference. [4]; (*) a SIM image requires light exposure for nine images, including switching time; (**) for Single Molecule Localization Microscopy, far-read or near-infrared absorbing markers are often used; for STED Microscopy, red-absorbing dyes are commonly used. In both cases, the maximum tolerable light dose is considerably higher than for conventional blue–green absorbing dyes. For CLSM and STED microscopy, the average values over the entire irradiated field (whole cells) are given. An irradiance of 100 mW/cm2 corresponds approximately to solar irradiance at sea level. A minimum recording time of 1 s per image is assumed for manually operated systems, which can be reduced to the 100 ms range for automated systems, thus decreasing the exposure time and increasing the maximum number of images.
MethodMax. Light Dose
             [J/cm2]
Irradiance [mW/cm2]Record. Time [s]Max. Number of Images
Wide-field microscopy101001100
SIM1010010 (*)10
CLSM10100520
Light Sheet
(N layers)
101001N × 100
Single Molecule
Localization
100 (**)50,000 to 1,000,00030≤1
STED10−50 (**)3,000,0001≤1
Disclaimer/Publisher’s Note: The statements, opinions and data contained in all publications are solely those of the individual author(s) and contributor(s) and not of MDPI and/or the editor(s). MDPI and/or the editor(s) disclaim responsibility for any injury to people or property resulting from any ideas, methods, instructions or products referred to in the content.

