Article

Probing Biochemical Differences in Lipid Components of Human Cells by Means of ATR-FTIR Spectroscopy

1
Department of Experimental Medicine, University of Campania “Luigi Vanvitelli”, 80138 Naples, Italy
2
Department of Mathematics and Physics, University of Campania “Luigi Vanvitelli”, 81100 Caserta, Italy
*
Author to whom correspondence should be addressed.
Biophysica 2023, 3(3), 524-538; https://doi.org/10.3390/biophysica3030035
Submission received: 19 July 2023 / Revised: 21 August 2023 / Accepted: 28 August 2023 / Published: 1 September 2023
(This article belongs to the Special Issue Biomedical Optics)

Abstract

:
Infrared spectroscopy has emerged as a promising technique for studying the composition of biological samples like lipids that play important roles in cellular functions and are involved in various diseases. For this reason, lipids are a target of interest in many biomedical studies. The objective of the present study is to utilize Fourier-Transform Infrared (FT-IR) spectroscopy to examine the main lipid components of human cells (phosphatidylcholine, phosphatidylethanolamine, phosphatidylserine, phosphatidylinositol, C18 ceramide, sphingosine-1-phosphate, ceramide-1-phosphate, sphingomyelin, cholesterol, and triolein). FT-IR analysis on the previously mentioned lipid samples was performed in Attenuated Total Reflection (ATR) mode. The obtained spectra clearly evidence the contributions of the different functional groups that are present in the examined samples. Detailed assignments of spectral features were carried out in agreement with the literature. Similarities and differences among the different types of commercial lipid samples are evidenced and discussed, with particular attention to phospholipid and sphingolipid components. A quantitative analysis of phosphatidylinositol and sphingomyelin spectra using a ratiometric approach is reported. Moreover, a reconstruction procedure of FT-IR spectra of complex lipids useful for chemometrics applications is described. These representative examples of the potential use of the results of the present study can certainly contribute to a larger use of FT-IR spectroscopy in lipidomics.

1. Introduction

In the field of biological research, understanding the intricate molecular composition of human cells is crucial for unraveling the complex mechanisms that govern various physiological processes. Among the diverse biomolecules present within cells, lipids play a fundamental role in numerous cellular functions, ranging from energy storage to cell signaling. Lipids encompass a wide array of chemically distinct molecules, each with their unique properties and functions. Therefore, gaining a comprehensive understanding of the lipid components within human cells necessitates powerful analytical techniques that can provide detailed molecular information.
Fourier Transform Infrared (FT-IR) spectroscopy and, in particular, Attenuated Total Reflection–FTIR (ATR-FTIR) spectroscopy can be recognized as very valuable tools for lipid analysis by probing their vibrational modes in a nondestructive way [1,2,3,4,5]. By measuring the absorbance of infrared light in the midinfrared region, ATR-FTIR spectroscopy can provide valuable insights into the biochemical structure and composition of lipids present in human cells. By harnessing the unique spectral fingerprint of lipids, FT-IR spectroscopy allows the identification and quantification of different lipid classes and subtypes within cellular samples [5]. Moreover, it provides information regarding the organization and physical state of lipids, such as their degree of saturation and oxidation, acyl chain length, and chain packing. By exploring lipid metabolism, lipid-related diseases, drug targeting and delivery, as well as membrane biophysics, this technique can significantly contribute to the development of innovative therapeutic approaches and the identification of potential biomarkers for disease diagnosis and prognosis.
In the literature, many research groups have reported the use of ATR-FTIR analysis for investigating the changes occurring in lipid components of human cells and tissues as a result of diseases such as cancer [6,7,8,9]. Alternatively, Severcan et al. investigated the use of FT-IR spectroscopy for evidencing the changes induced in lipid by diabetes disease [10]. Guleken et al. that individuated changes in lipid metabolism in the blood serum of endometriosis-affected patients using the above-mentioned technique [11].
ATR-FTIR spectroscopy has been adopted for evaluating the effects of drugs in cell lipid components. Gasper et al. [12,13] investigated the changes occurring in cell lipidome due to Ouabain drug, a drug commonly used in cancer treatment.
FT-IR spectroscopy has also been adopted for characterizing the changes induced in lipid components by ionizing radiation [14,15,16]. This vibrational technique also allowed the characterization of the role of lipid components in the protective effect of amifostine against damaging induced by ionizing radiation on rat brains [17]. Amifostine is a radioprotective agent that can be adopted in clinics for reducing the side effects of radiotherapy treatment. Moreover, FT-IR spectroscopy has allowed the acquisition of information about the effects on lipids induced by environment pollution [18,19].
Obviously, FT-IR and ATR-FTIR spectroscopies have contributed to the assessment of many other aspects of lipid behavior in human cells, as can be evinced by the large number of papers devoted to this topic. In Refs. [6,7,20,21,22,23,24,25,26], a certain number of significant results are reported. As said before, the above-mentioned techniques are recognized as very valuable tools for lipid analysis, as testified by their use in lipidomics [27] and high-throughput technology [28,29].
The relevance of ATR-FTIR spectroscopy in the study of the changes induced in lipid components by physicochemical agents moved our interest towards the use of this technique for investigating lipid samples extracted from human cells exposed to external physical agents. As a preliminary step of this investigation, we aim at performing a detailed analysis of the infrared spectra of the most relevant lipid components in human cells (phosphatidylcholine, phosphatidylethanolamine, phosphatidylserine, phosphatidylinositol, C18 ceramide, sphingosine-1-phosphate, ceramide-1-phosphate, sphingomyelin, cholesterol and triolein).
In order to have very reproducible results, we decided to use commercial samples for examining these lipids by employing ATR acquisition geometry that is generally considered the most appropriate for this kind of sample [1,2,3,4,5]. Good-quality spectra were obtained, and the similarity and differences among the infrared spectra of various lipids are evidenced and discussed. In addition, a quantitative analysis of some spectra was performed using a ratiometric approach [13,17,30], and a convolution procedure useful for chemometrics applications is proposed [31]. The present investigation can make a useful contribution to the use of FT-IR spectroscopy for advancing our understanding of cellular lipid biology and its implications in various physiological and pathological processes.

2. The Presence of Lipids in Human Cells

This section presents a concise and insightful overview of the fundamental properties characterizing the principal lipid constituents within human cells. It is important to underscore that the list of scrutinized lipids (four phospholipids, four sphingolipids and cholesterol) also encompasses triolein, a well-established model frequently employed for investigating lipid metabolism and digestion [32].
Lipids, a class of molecules soluble in organic solvents yet insoluble in water, assume a pivotal role in the constitution of cell membranes and lipid bilayers. Their primary functions encompass diverse roles such as energy storage, thermal insulation, protective shielding, cellular signaling and regulatory modulation. The main phospholipids found in biological membranes are phosphatidylcholines (PC), a family of phospholipids that include choline as a headgroup and are typically the most prevalent phospholipid in animals and plants, making up frequently close to 50% of the total. They make up a significant portion of biological membranes and are mostly present in the exoplasmic, or outer leaflet, of a cell membrane, as well as in pulmonary surfactant [33,34]. Phosphatidylethanolamines (PEs) are found in all living cells and are particularly prevalent in neurological tissue, such as the white matter of the brain, nerves, neural tissue and the spinal cord. In the process of cell division known as cytokinesis, PEs contribute with membrane fusion and the breakdown of the contractile ring. PE has several functions in humans, including blood clotting, liver lipoprotein production, the spread of infectious prions without the use of proteins or nucleic acids and heart blood flow [35,36,37,38]. Phosphatidylserine (PS), or more specifically a glycerophospholipid, is the main class of acidic phospholipids that make up 13–15% of the phospholipids in the human cerebral cortex. It is composed of serine attached via a phosphodiester linkage to the third carbon of glycerol and two fatty acids attached via ester linkage to the first and second carbons. In the plasma membrane, PS is localized exclusively in the cytoplasmic leaflet, where it is a component of the protein docking sites required for the activation of a number of important signaling pathways, including the Akt, protein kinase C (PKC) and Raf-1 signaling pathways, which are known to promote neuronal survival, neurite growth and synaptogenesis. It is important for cell cycle signaling, particularly in the context of apoptosis. These signaling mechanisms are significantly influenced by changes in the PS level in neurons’ plasma membrane [39,40,41,42]. Phosphatidylinositol (PI) is a glycerophospholipid with a glycerol backbone, two nonpolar fatty acid tails and a phosphate group substituted with an inositol polar head group (an amphiphilic lipid with a polar and nonpolar region). The molecules are negatively charged at physiological pH thanks to the phosphate group. Phosphoinositides, which are PI in phosphorylated forms, are crucial for lipid signaling, cell signaling and membrane trafficking [43].
Sphingolipids are the second major component of lipids in the cell membrane, a subclass of amphipathic lipids that all include a sphingoid base backbone that is N-acylated with different fatty acid chains. This group consists of lipids such ceramide, sphingosin-1-phosphate (S1P), ceramide-1-phosphate (C1P) and sphingomyelin (SM).
Ceramide (Cer) is a crucial lipid molecule found in cell membranes, serving as the backbone for various sphingolipids. Cer is made up of fatty acid chain lengths ranging from 14 to 26 carbon atoms connected to sphingosine via an amide linkage (N-acetylsphingosine). It plays important roles in cellular processes such as differentiation, proliferation, apoptosis and the stress response in cells cancer and cancer therapy. Because of these characteristics, Cers are frequently referred to as the “messenger of cell death” [44,45,46,47]. Cer can be generated through two pathways: de novo synthesis, involving the condensation of serine and palmitoyl CoA, and the salvage pathway, which recycles sphingosine or hydrolyzes complex sphingolipids [48]. Cer synthesis and sphingomyelinases have been identified as important targets in chemotherapy and radiation therapy. Chemotherapeutic drugs and radiation therapy cause cell death by raising the levels of Cer, promoting the synthesis of new Cer molecules and triggering the activation of enzymes that ultimately result in apoptosis [49,50,51]. Cer has diverse intracellular targets, including protein kinase C isoforms and protein kinase CAPK/KSR, which play roles in cell differentiation and death. Cer is produced shortly after radiation exposure through SM hydrolysis and DNA damage-independent pathways. Overall, radiation-induced cell damage initiates distinct signaling pathways that result in increased intracellular Cer levels [52,53,54]. Sphingosin-1-phosphate (S1P), also known as lysosphingolipid, a bioactive lipid mediator, is a signaling sphingolipid. Sphingosine, with a phosphate group attached at position 1, forms the phosphosphingolipid known as S1P. Cer is converted to sphingosine by the enzyme ceramidase, which is mainly found in plasma membranes. Sphingosine kinase (SK) isoenzymes then phosphorylate sphingosine. The two known isoenzymes are SK1 and SK2. While SK2 is primarily expressed in the liver and kidney, SK1 is highly expressed in the spleen, lung and leukocytes. S1P is a significant regulator of the vascular and immunological systems, and it controls angiogenesis, vascular stability and permeability in the vascular system. Scientists have identified S1P as essential to human health and a factor in several diseases, including cancer, because of its function in the development of new blood vessels [55,56,57,58]. Ceramide 1-phosphate (C1P) is thought to be found in the cytosolic leaflet of cellular membranes, since it is detected in animal tissues at levels comparable to S1P. In neutrophils, mast cells and macrophages, relatively significant concentrations of palmitoylated (C16) C1P have been found. Phosphatases carry out the reverse reaction to synthesize Cer, indicating that Cer and C1P are easily interconvertible in cells. These enzymes include a particular phosphatidate phosphohydrolase, C1P phosphatase, as well as lysosomal acid sphingomyelinase. To ensure that cells function effectively, the activities of the enzymes involved in synthesis and catabolism must be carefully regulated. Nevertheless, any disruption to this equilibrium can lead to metabolic dysfunction or disease. Cer is associated with a reduction in cell development and enhancement of apoptosis, in contrast to S1P and C1P, which are associated with increased cell growth and survival. Plasma C1P is thought to have a role in the recruitment of stem/progenitor cells to injured organs and may encourage their vascularization with the potential to be used in regenerative medicine. Cer prevents cell proliferation that has been induced by this method by increasing the activity of the enzyme lipid phosphate phosphatase, which results in the dephosphorylation of C1P [59]. Sphingomyelin (SM) is referred to as the predominant sphingolipid in intracellular and plasma membranes (it is mostly found in the bilayer’s outer (extracellular) leaflet). Sphingomyelinase breaks down SM into Cer and water-soluble phosphorylcholine in response to cellular stress. Nearly 85% of all sphingolipids, 10% to 20% of all plasma membrane lipids and 4% to 18% of all sarcolemma membrane lipids are found in SM. Signal transmission, membrane budding, cellular proliferation, differentiation and apoptotic pathways are just a few of the biological processes in which SM participates. It has also been noted as being essential to control cancerous cell proliferation. Therefore, due to its critical function in proliferation, differentiation and apoptosis, altered physicochemical properties of SM may contribute to cancer cells’ resistance to antitumor drugs by helping them avoid apoptosis, as has already been demonstrated for certain cisplatin (CIS) and doxorubin [60]. SM level variations that cause membrane disruption may control signaling pathways [61]. Cholesterol is a substance with a waxy, fat-like texture that is present in the cells of the body. It is synthesized by the liver and can also be obtained from certain foods. Cholesterol plays a crucial role in the body as it is essential to produce hormones, vitamin D and substances involved in food digestion. There are two primary types of cholesterol: low-density lipoprotein (LDL) cholesterol and high-density lipoprotein (HDL) cholesterol. LDL cholesterol is often referred to as “bad” cholesterol due to its tendency to accumulate plaque within the arteries. High levels of LDL cholesterol pose a significant risk for heart disease and stroke. On the other hand, HDL cholesterol is considered “good” cholesterol because it assists in removing LDL cholesterol from the bloodstream, thereby reducing the risk of heart disease. Triolein is a type of triglyceride, which is a type of fat molecule composed of three fatty acids and a glycerol molecule. Triolein specifically is composed of three oleic acid molecules, a type of unsaturated fatty acid and a glycerol molecule. Triolein is commonly used in research as a model for studying lipid metabolism and digestion. It is also used in the production of cosmetics and pharmaceuticals, as well as in the food industry as an emulsifier and flavor enhancer. In the body, triolein is broken down by enzymes called lipases into its component fatty acids and glycerol, which can then be used for energy or storage. Excessive consumption of triolein, along with other dietary fats, can contribute to the development of obesity and other health problems if not balanced with physical activity and a healthy diet.
In Table 1 the structures of the main lipids present in human cells and investigate in the present work are reported.
As far as concerns FT-IR spectra, lipids have characteristic absorption bands in the infrared spectrum due to the functional groups present in their chemical structure. In particular, the FT-IR spectra cell membrane lipids are characterized by two main regions: the high wavenumber range (3100–2800 cm−1) that is related to C-H stretching vibrations and principally associated to hydrocarbon chains and the low wavenumber region of the spectrum (below 1800 cm−1) that is basically due to the polar headgroups of lipids. The C-H stretching bands associated with the lipid hydrocarbon chain region are not significantly influenced by other vibrational modes, even when complex samples such as biological systems are considered. Information about the hydrocarbon chain structure can be obtained by examining the spectral features of the bands (position, intensity and width) placed in this region [5].
The different lipids can be identified by considering the spectral range associated with the lipid polar headgroup. For example, in this region, the contributions related to the C=O stretching mode positioned around 1740 cm−1 and the phosphate group near 1240 and 1080 cm−1 for the antisymmetric and symmetric modes are characteristics of phospholipids and cholesterol. It is well known that each lipid shows a particular FT-IR spectrum in the region characterized by wavenumbers lower than 1800 cm−1. This feature has been used by different authors for identifying the various components in lipid mixtures [6,7].

3. Materials and Methods

3.1. Lipid Commercial Samples

The following lipids were purchased from Sigma–Aldrich (Milan) and used as references without further purification: L-a-phosphatidylcholine (liver from bovine), phosphatidylethanolamine (1,2-diacyl-sn-glycero-3-phosphoethanolamine, >97%), phosphatidylserine (1,2-Diacyl-sn-glycero-3-phospho-L-serine solution >97%, from bovine brain), L-a-phosphatidylinositol (liver from bovine), C18 ceramide (d18:1/18:0), sphingosine-1-phosphate (d17:1), ceramide-1-phosphate (95%, from bovine brain), sphingomyelin (from porcine), cholesterol and triolein. Lipids were all dissolved in chloroform at a concentration of 10 mg/mL and stored at −20 °C. The commercial lipids used in the present investigation are those more readily available. Their purity level guarantees that only negligeable contributions from eventual contaminants may be present in the acquired infrared spectra.

3.2. Attenuated Total Reflection–FourierTransform Infrared (ATR-FTIR) Spectroscopy

FT-IR spectra were obtained using a Perkin Elmer Spectrum One spectrometer (PerkinElmer, Shelton, CT, USA) equipped with Universal ATR (UATR) accessory. All spectra were collected using 32 scans in the range from 4000 to 600 cm−1 with a 4 cm−1 spectral resolution. The analyzed wavenumber regions were 3300–2700 cm−1 and 1800–600 cm−1, where the contributions of different functional groups are present. Small aliquots of lipid solution (5 μL) were deposited on the diamond crystal of UATR and left to dry before acquiring the spectra. For each processed sample, a background measurement was also acquired. Before collecting the spectra, the ATR crystal was cleaned with acetone and left to dry. Samples were analyzed in triplicate. Preliminary analyses as baseline correction were made using the Perkin Elmer software. The acquired spectra were normalized adopting the Standard Normal Variate (SNV) method [62] using the Origin software (Version 9.0, OriginLab Corporation, Northampton, MA, USA).
The FT-IR spectra obtained for the different lipids were employed to show the feasibility of two data analysis procedures among the many available in the field of infrared spectroscopy [62]. A quantitative analysis of the FT-IR spectra using a ratiometric approach was performed for PI and SM samples [5,17,63]. In addition, a representative example of the use of the spectral data of the investigated samples is reported in the following. The presented example indicates the possibility of using the spectral data of lipid components for a software reconstruction of spectra of complex lipid mixture that can be compared with experimental data [6,7].

4. Results and Discussion

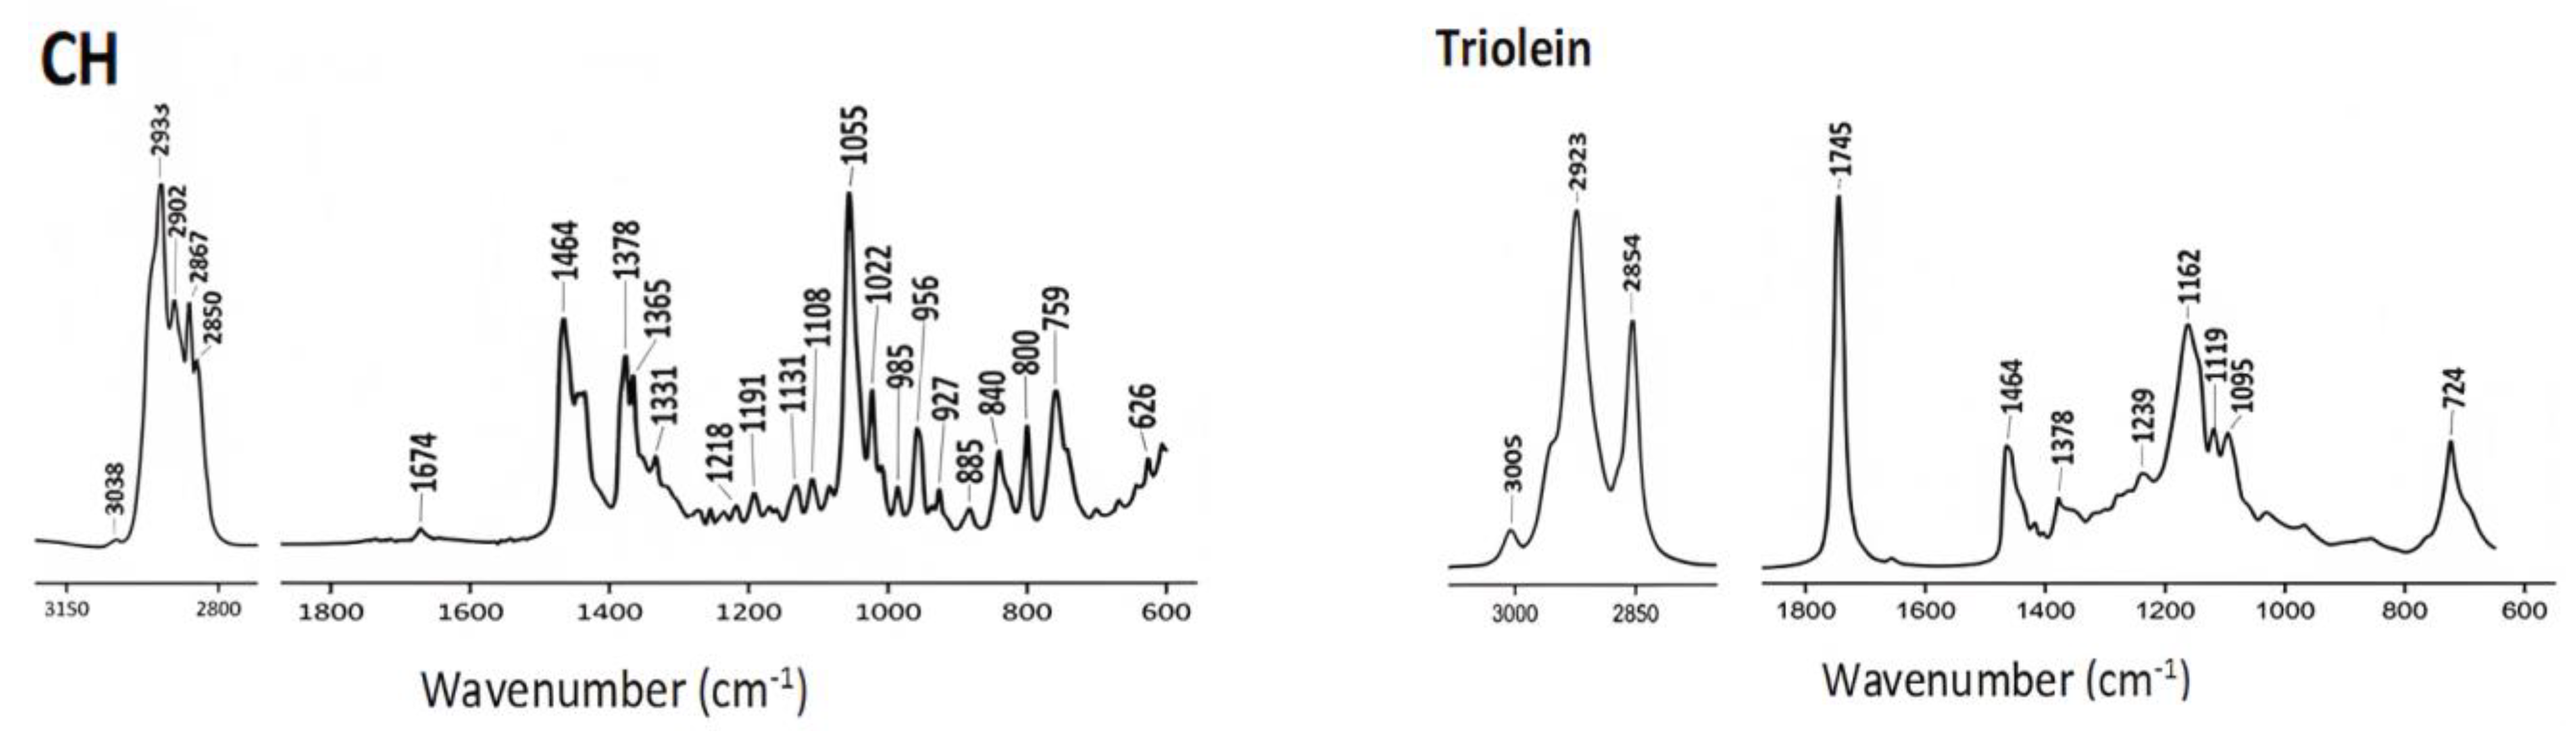
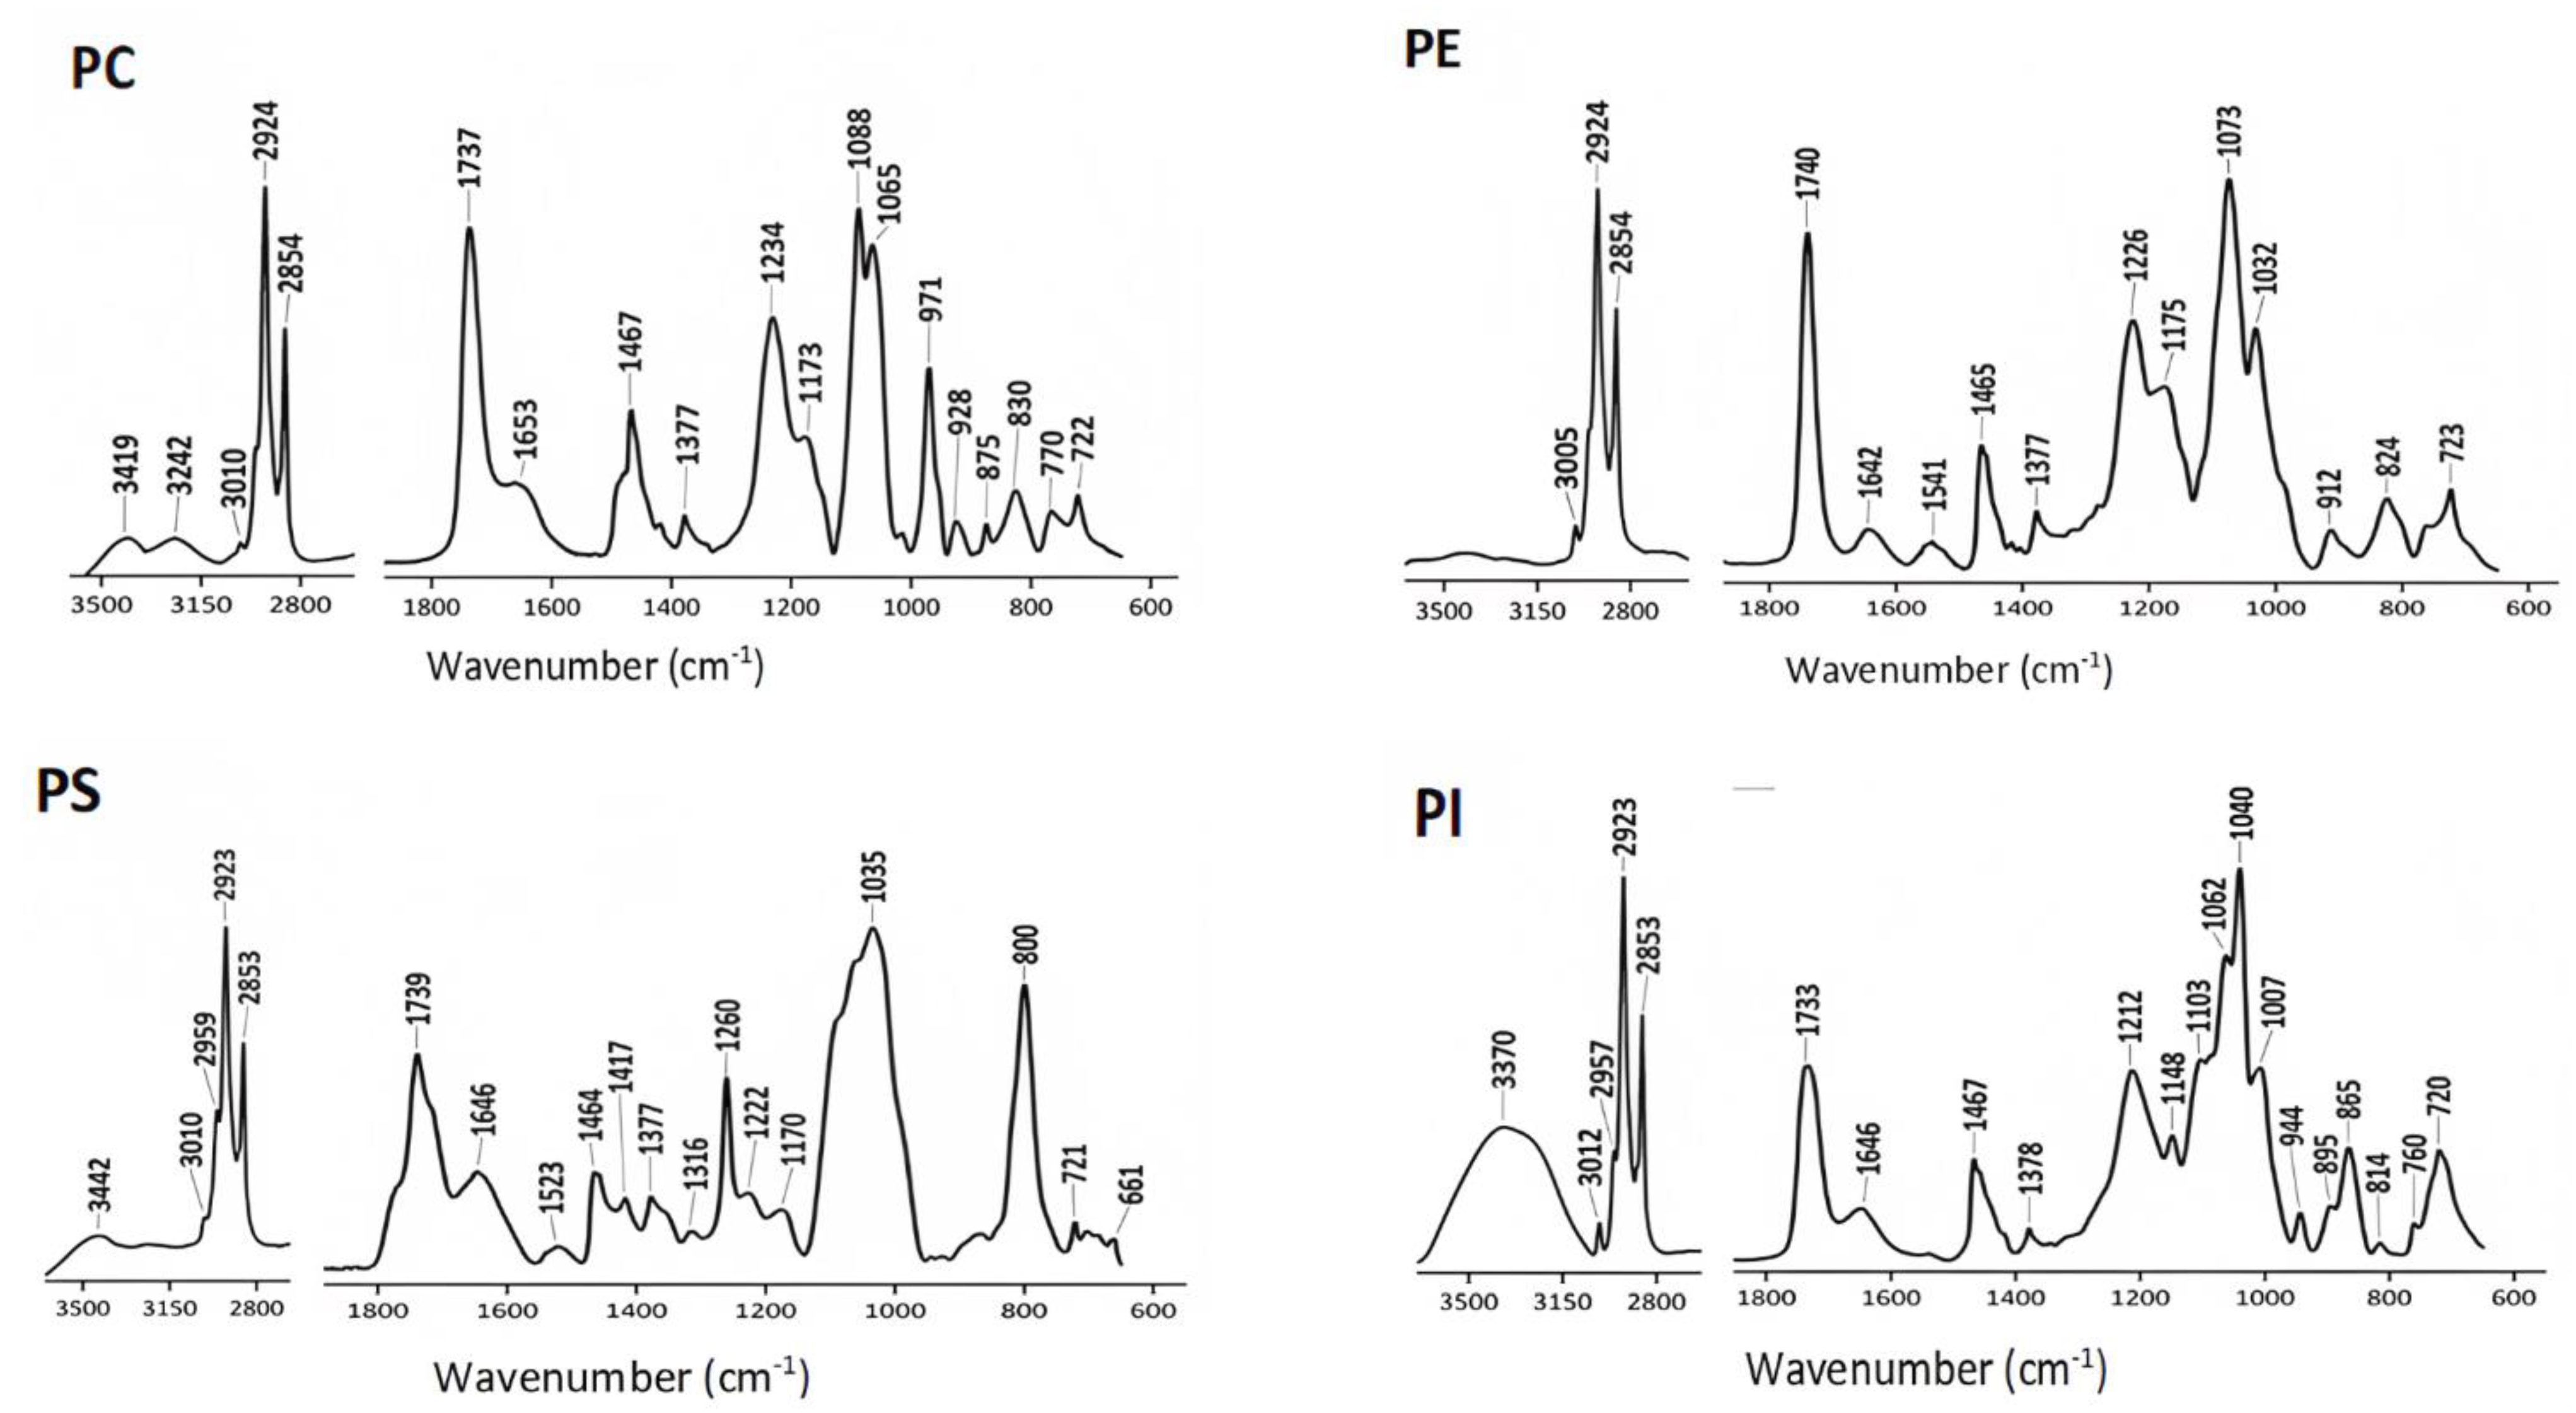
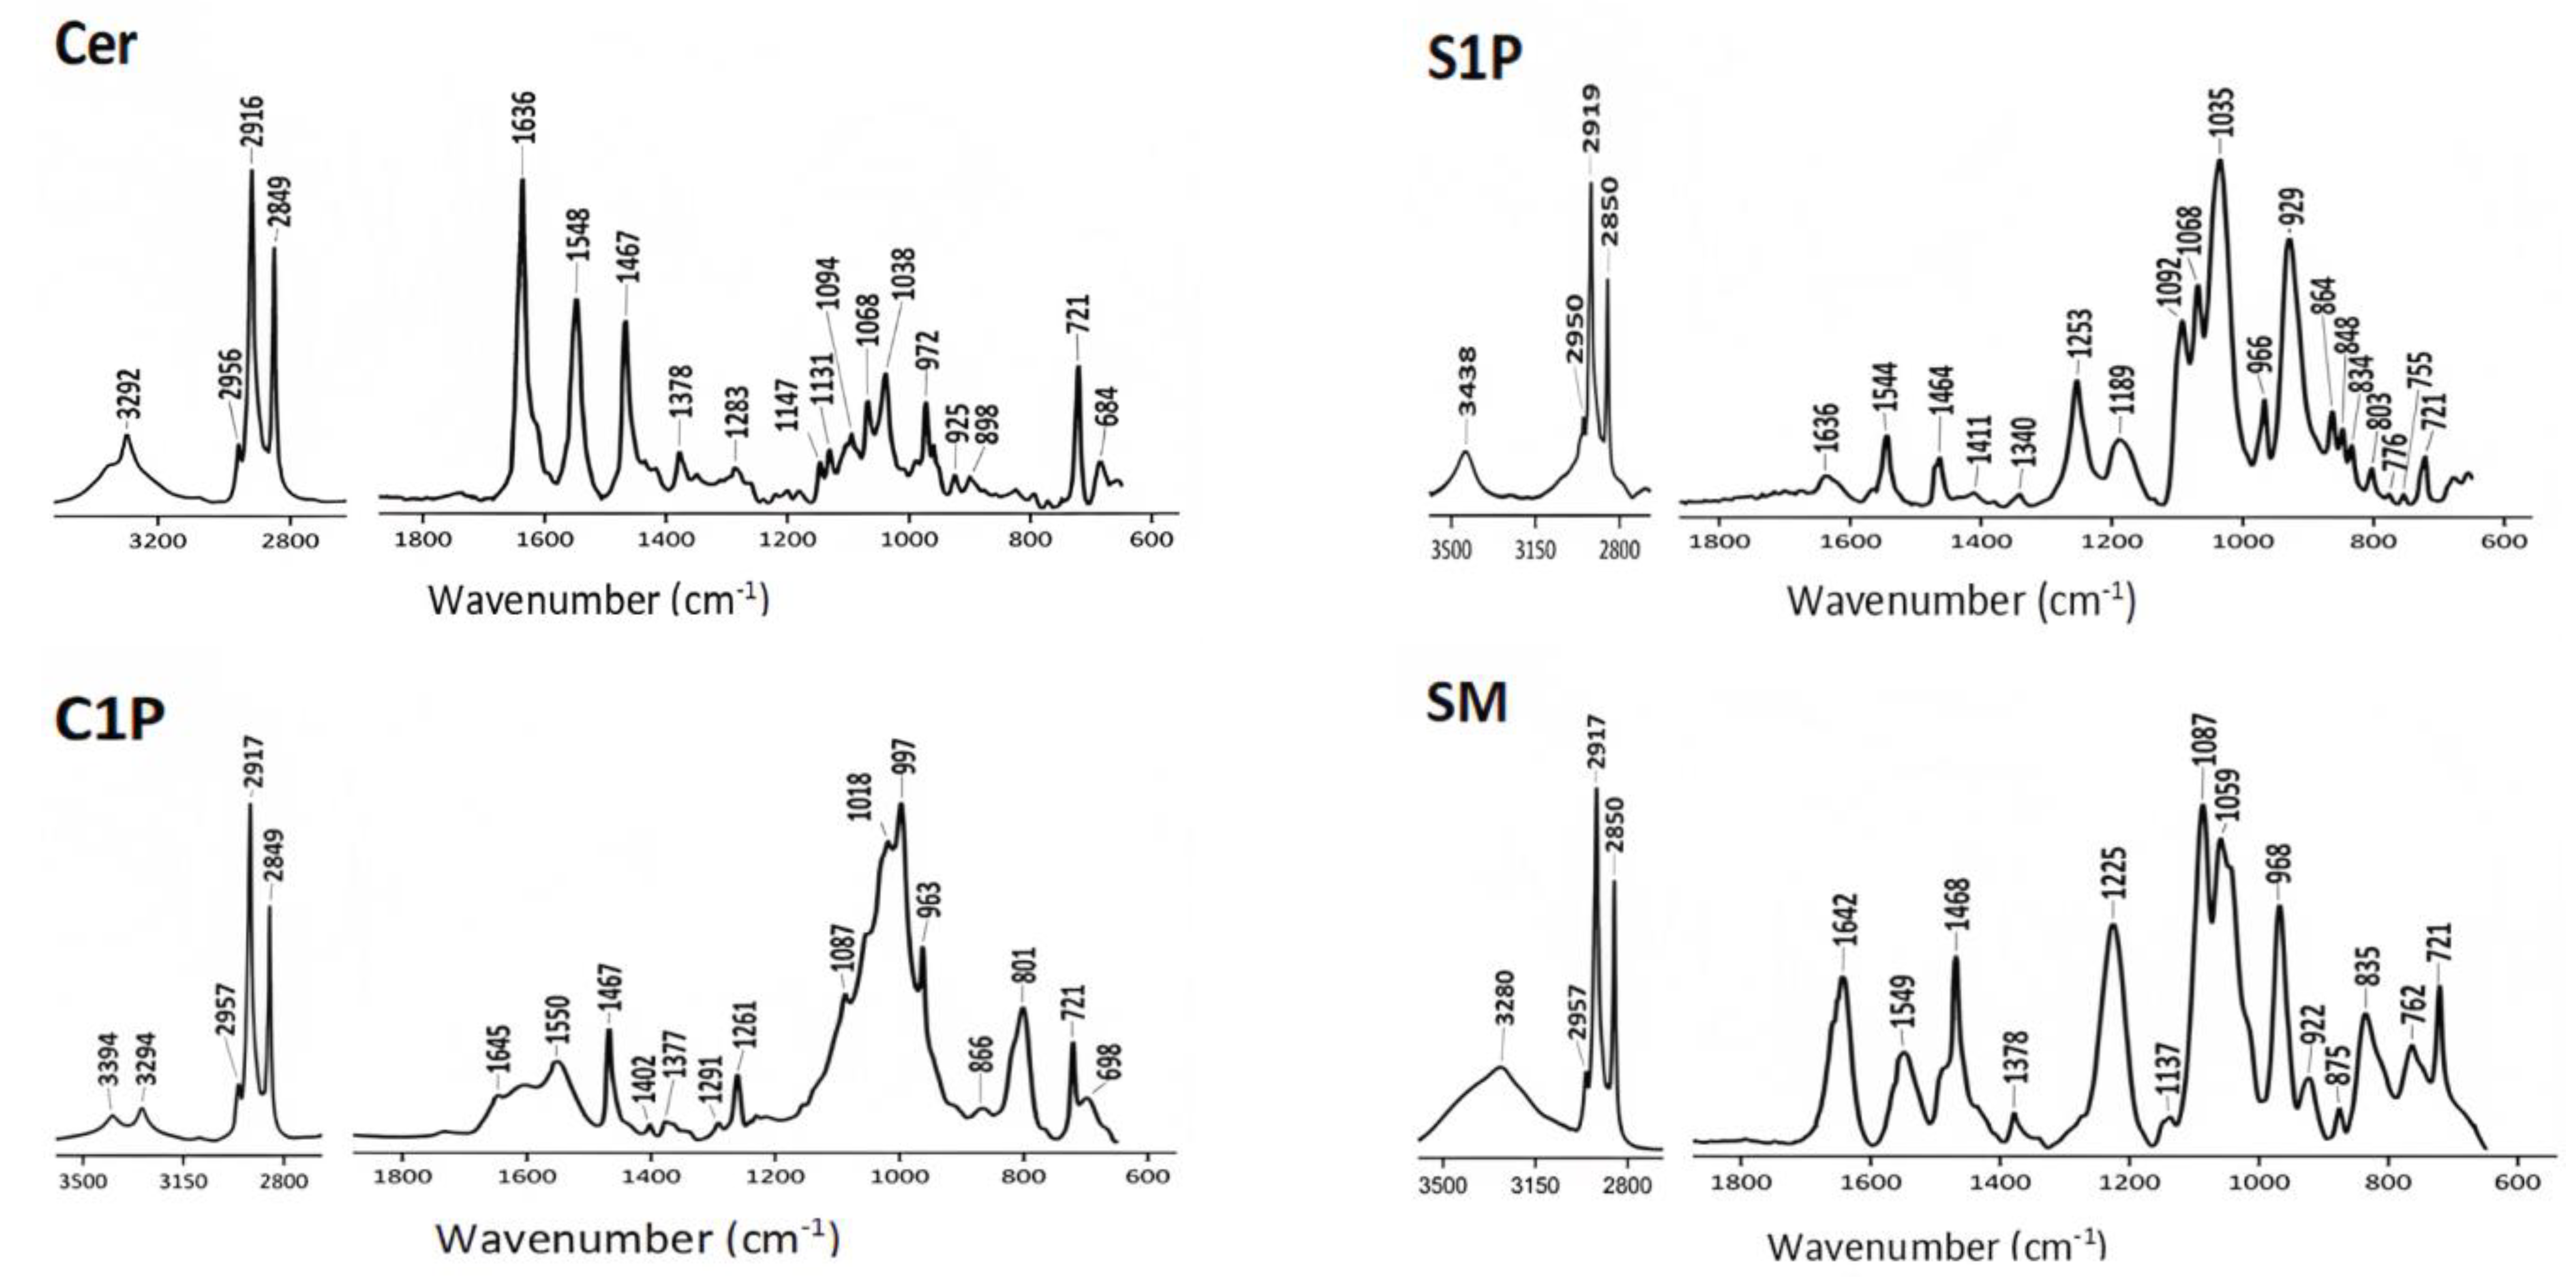
4.1. ATR-FTIR Spectra of Commercial Lipids

The ATR-FTIR spectra of the four phospholipids investigated here are reported in Figure 1 and are in qualitative agreement with those reported in Refs. [6,7]. As mentioned before, the C-H stretching vibrations cause the absorption between 3400 and 2800 cm−1 that primarily come from the hydrocarbon chains. For PE, PC and PS samples, the most relevant contribution is located around 2924, 2854 cm−1 and is due to the asymmetric and symmetric stretching mode of the CH2 group, respectively. PI samples also show a significant contribution at 3370 cm−1 that can be ascribed to asymmetric stretching of the OH group. The low wavenumber region of the spectra (1800 and 600 cm−1) is dominated by the polar head groups of the lipids and can be considered the fingerprint region for distinguishing the different lipids.
In this region, the peak located around 1740 cm−1 represents the major contribution for all the investigated phospholipids samples and is related to the stretching mode of the C=O group. For PE, PI and PC samples, another considerable feature is present around 1465 cm−1 and is attributed to the bending mode of the CH3 group. The spectral region between 1200 and 900 cm−1 is really very different for the four phospholipid components, but for all of them, the contributions of the phosphate group can be noticed. In particular, the structures positioned at ~1222 and 1080 cm−1 are present and can be attributed to antisymmetric and symmetric PO 2 groups, respectively. In Table S1, the positions of all the different peaks for investigated phospholipids and their assignments are reported. The assignments were carried out in agreement with Refs. [1,2,64,65]. In Figure 2, the ATR-FTIR spectra of the investigated sphingolipids are reported. In the high-wavenumber region, in addition to the above-mentioned contributions due to asymmetric (~2916 cm−1) and symmetric (~2850 cm−1) stretching mode of CH2 group, there is also a faint feature due to the asymmetric stretching mode of the CH3 functional group.
As far as concerns the fingerprint region, as expected, there is the largest variability among the four investigated sphingolipids. For these samples, the peaks located around 1640 and 1548 cm−1 are particularly relevant, since they can be ascribed to C=O stretching (Amide I) and to N-H bending (Amide II) vibrations, respectively. These contributions have different intensities for the various examined samples. Similar features are also present in the protein spectrum due to peptide bond. Cer compounds exhibit well-defined peaks at 1548, 1467 and 1038 and 721 cm−1 that are attributed to NH, CH3 and CO group bending. The peak at 721 cm−1 is due to CH bending mode contribution. SM samples presents similar contributions located at 1549,1468 and 721 cm−1. Moreover, SM spectrum shows features at 1225 and 1087 cm−1 that can be attributed to antisymmetric and symmetric stretching of the PO 2 group, respectively, and further evident contributions at 1059 cm−1 due to the stretching of CO-O-C and C-O-P-O-C at 968 cm−1 attributed to the stretching vibrations of the N+(CH3)3) and O-CH3 groups. The C1P spectrum is characterized by a large band centered on 997 cm−1, ascribed to the C=O stretching mode. In this band, it is possible to recognize the contributions due to the symmetric PO 2 group (1087 cm−1) and the one located at 967 cm−1 that has been attributed to the stretching vibrations of the N+(CH3)3) and O-CH3 groups. In the fingerprint region, the S1P spectrum contributions at 1253 cm−1 (due to antisymmetric PO 2 group stretching mode), 1035 cm−1 (attributed to stretching mode of C-O-P group) and 929 cm−1 (ascribed to different contributions from C=C and C-H bonds) can be easily recognized. In Table S2, the positions of all different peaks for the investigated sphingolipids and their tentative assignments are summarized. The assignments were carried out in agreement with Refs. [1,2,64,65]. In Figure 3, the ATR-FTIR spectra obtained from cholesterol and triolein samples are reported.
The ATR-FTIR spectrum of CH samples shows substantial differences from the other spectra previously discussed. This neutral lipid does not show the typical contributions of stretching vibrations of the C-H groups in the 3100–2800 cm−1 range. In fact, the C-H stretching vibration modes are centered at 2933 cm−1 for cholesterol. The features located at 1464 and 1378 can be ascribed to C-H deformation modes. Some contributions that are shown at 1055, 1022, 956, 840 and 800 cm−1 are specific for CH, and their tentative assignments are given in Table S3. The triolein spectrum is less structured and presents, in the high wavenumber region, two features at 2923 and 2854 cm−1 that can be ascribed to the asymmetric and symmetric stretching modes of the CH2 group. An intense peak is present at 1745 cm−1, and it is due to the C=C stretching mode. A large feature is also located at 1162 cm−1 that can be due to the C-C stretching mode. In Table S4, the other spectral characteristics of triolein spectrum are reported. As previously stated, in Tables S1–S4, the positions and the assignments of the contributions of the various functional groups are reported for each investigated lipid sample. The assignments were carried out according to Refs. [1,2,7,64,65,66,67,68]. All the reported spectra are in substantial agreement with those reported in Refs. [7,66,68] for some of the samples investigated here.

4.2. Ratiometric Analysis of ATR-FTIR Lipid Spectra

As mentioned before, a very large number of data analysis procedures are available for FT-IR spectra processing [62,63,69,70]. Among the various more or less sophisticated univariate and multivariate approaches [71], quantitative details can be obtained from FT-IR spectra by using a ratiometric analysis in which the ratio values between the intensity or the area of selected bands are evaluated [15,17,30]. In Table 2, a list of some useful ratios is reported, and their values are estimated for PI and SM samples, as representative examples of the ratiometric approach. In the case of lipid samples, this approach allows the evaluation of various characteristics, such as unsaturation level, chain length, chain ordering and lipid phase transitions [6,17,63]. In Table 2, the numerical values present the major difference for the (4) ratio related to carbonyl content, as expected by taking into account the considered samples. The evaluation of ratios between the areas or the intensities of selected bands of infrared spectra is particularly useful for estimating changes induced in a certain class of samples by the interaction with physicochemical agents, as reported in Refs. [17,63,72]. In fact, many researchers used some of the presented ratios for evaluating the effects of interaction between cells and tissues with external agents. For example, Cakmak et al. used the (1), (2), (3), (4) and (6) ratios of Table 2 for highlighting the protective influence of amifostine, an established cytoprotective adjuvant utilized to reduce the side effects stemming from specific chemotherapy drugs and radiation therapy. The study delineated its impact within two distinct cerebral regions, the white matter (VM) and gray matter (GM) areas. The increase in lipid quantities observed within treated cells underlined the safeguarding efficacy of this relevant medication. The authors also observed an increase in the ratios of carbonyl, olefinic/CH and CH3 groups relative to lipids in the irradiated (WM) and (GM) regions of the brain. This indicates that lipids were undergoing oxidation, leading to the creation of degradation products containing more carbonyl esters. This suggests that exposure to ionizing radiation might increase the concentration of unsaturated fatty acids in the brain. These changes in the composition and concentration of lipids are recognized for their impact on membrane structure and thickness, potentially causing modifications in ion channels and receptors, disrupting the normal functioning of brain tissue (see Ref. [17] and references therein). Also, Abdelrazzak et al. [63] adopted the ratios reported in Table 2 and others presented in Ref. [30] for investigating the structural damages in the cell membrane lipids as a result of the oxidative stress in abscopal liver tissue of rats. Lipid damage was evidenced by a decrease in ratios (1) and (2). The (2) ratio was also assumed as an indicator of changes in the methylation degree. Moreover, our previous papers [15,16] represent other significative examples of the use of ratios between the areas of selected bands for investigating different processes occurring in the lipid components of cells exposed to ionizing detection.

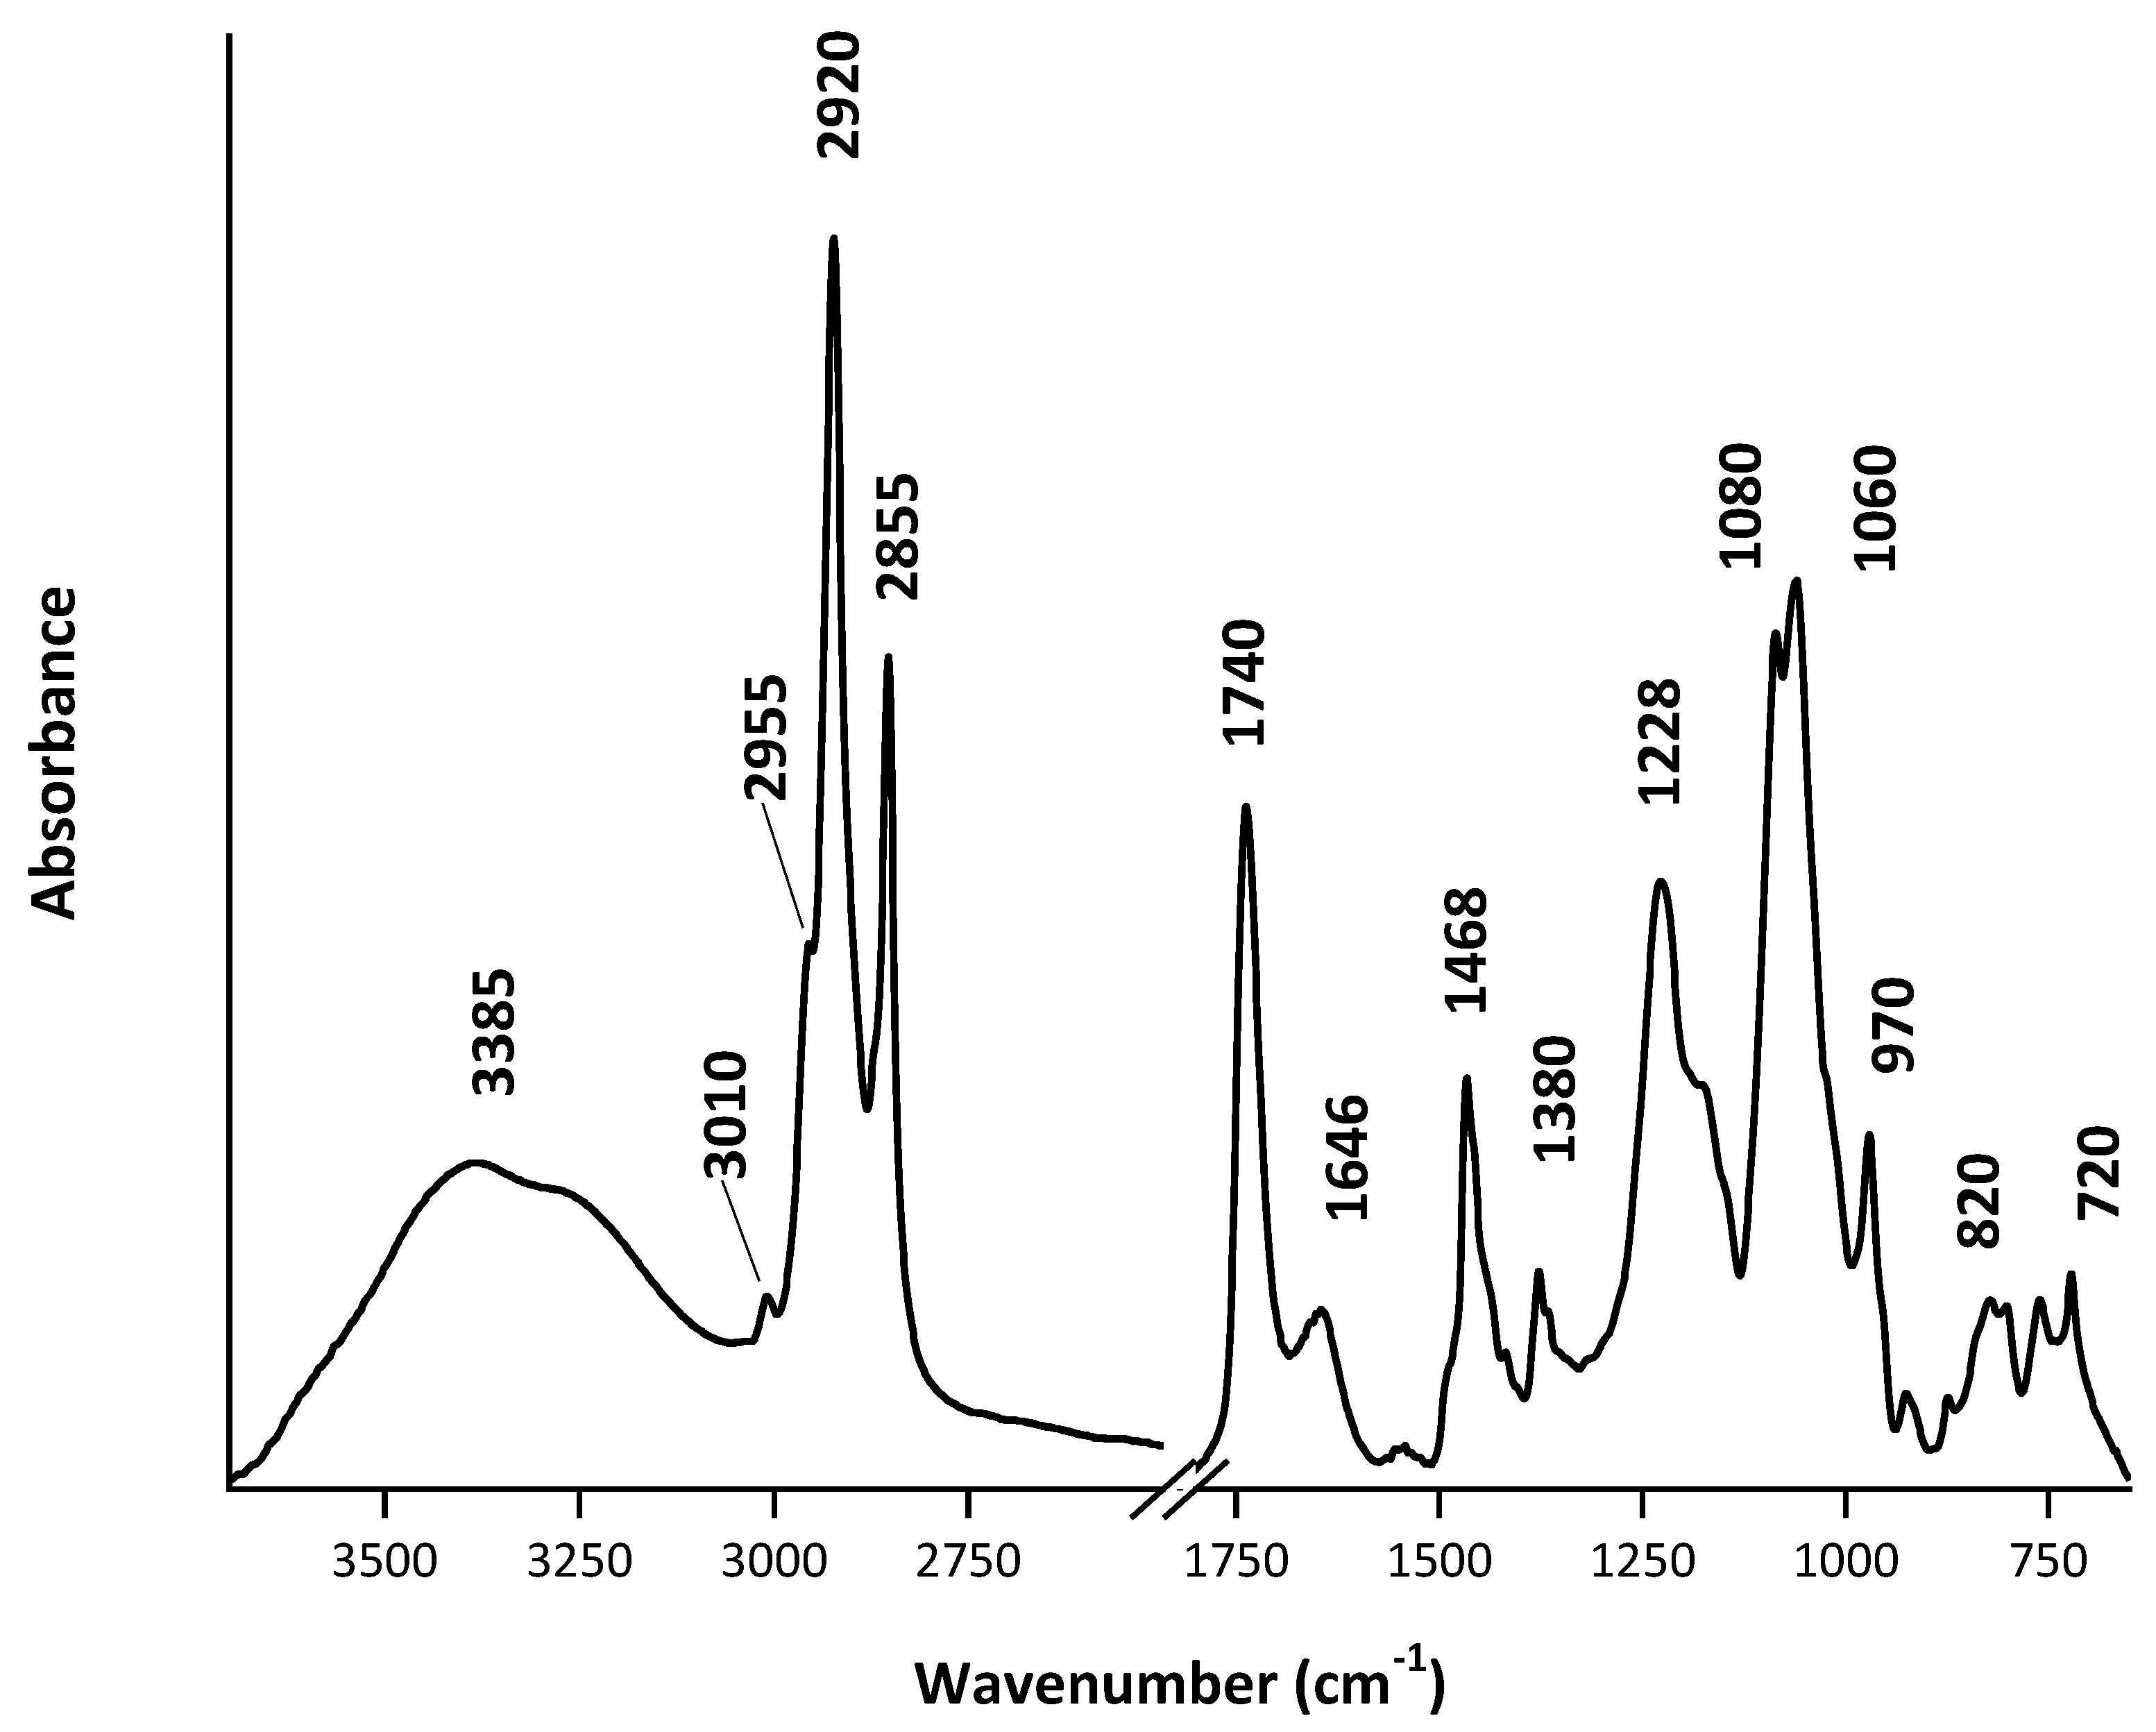
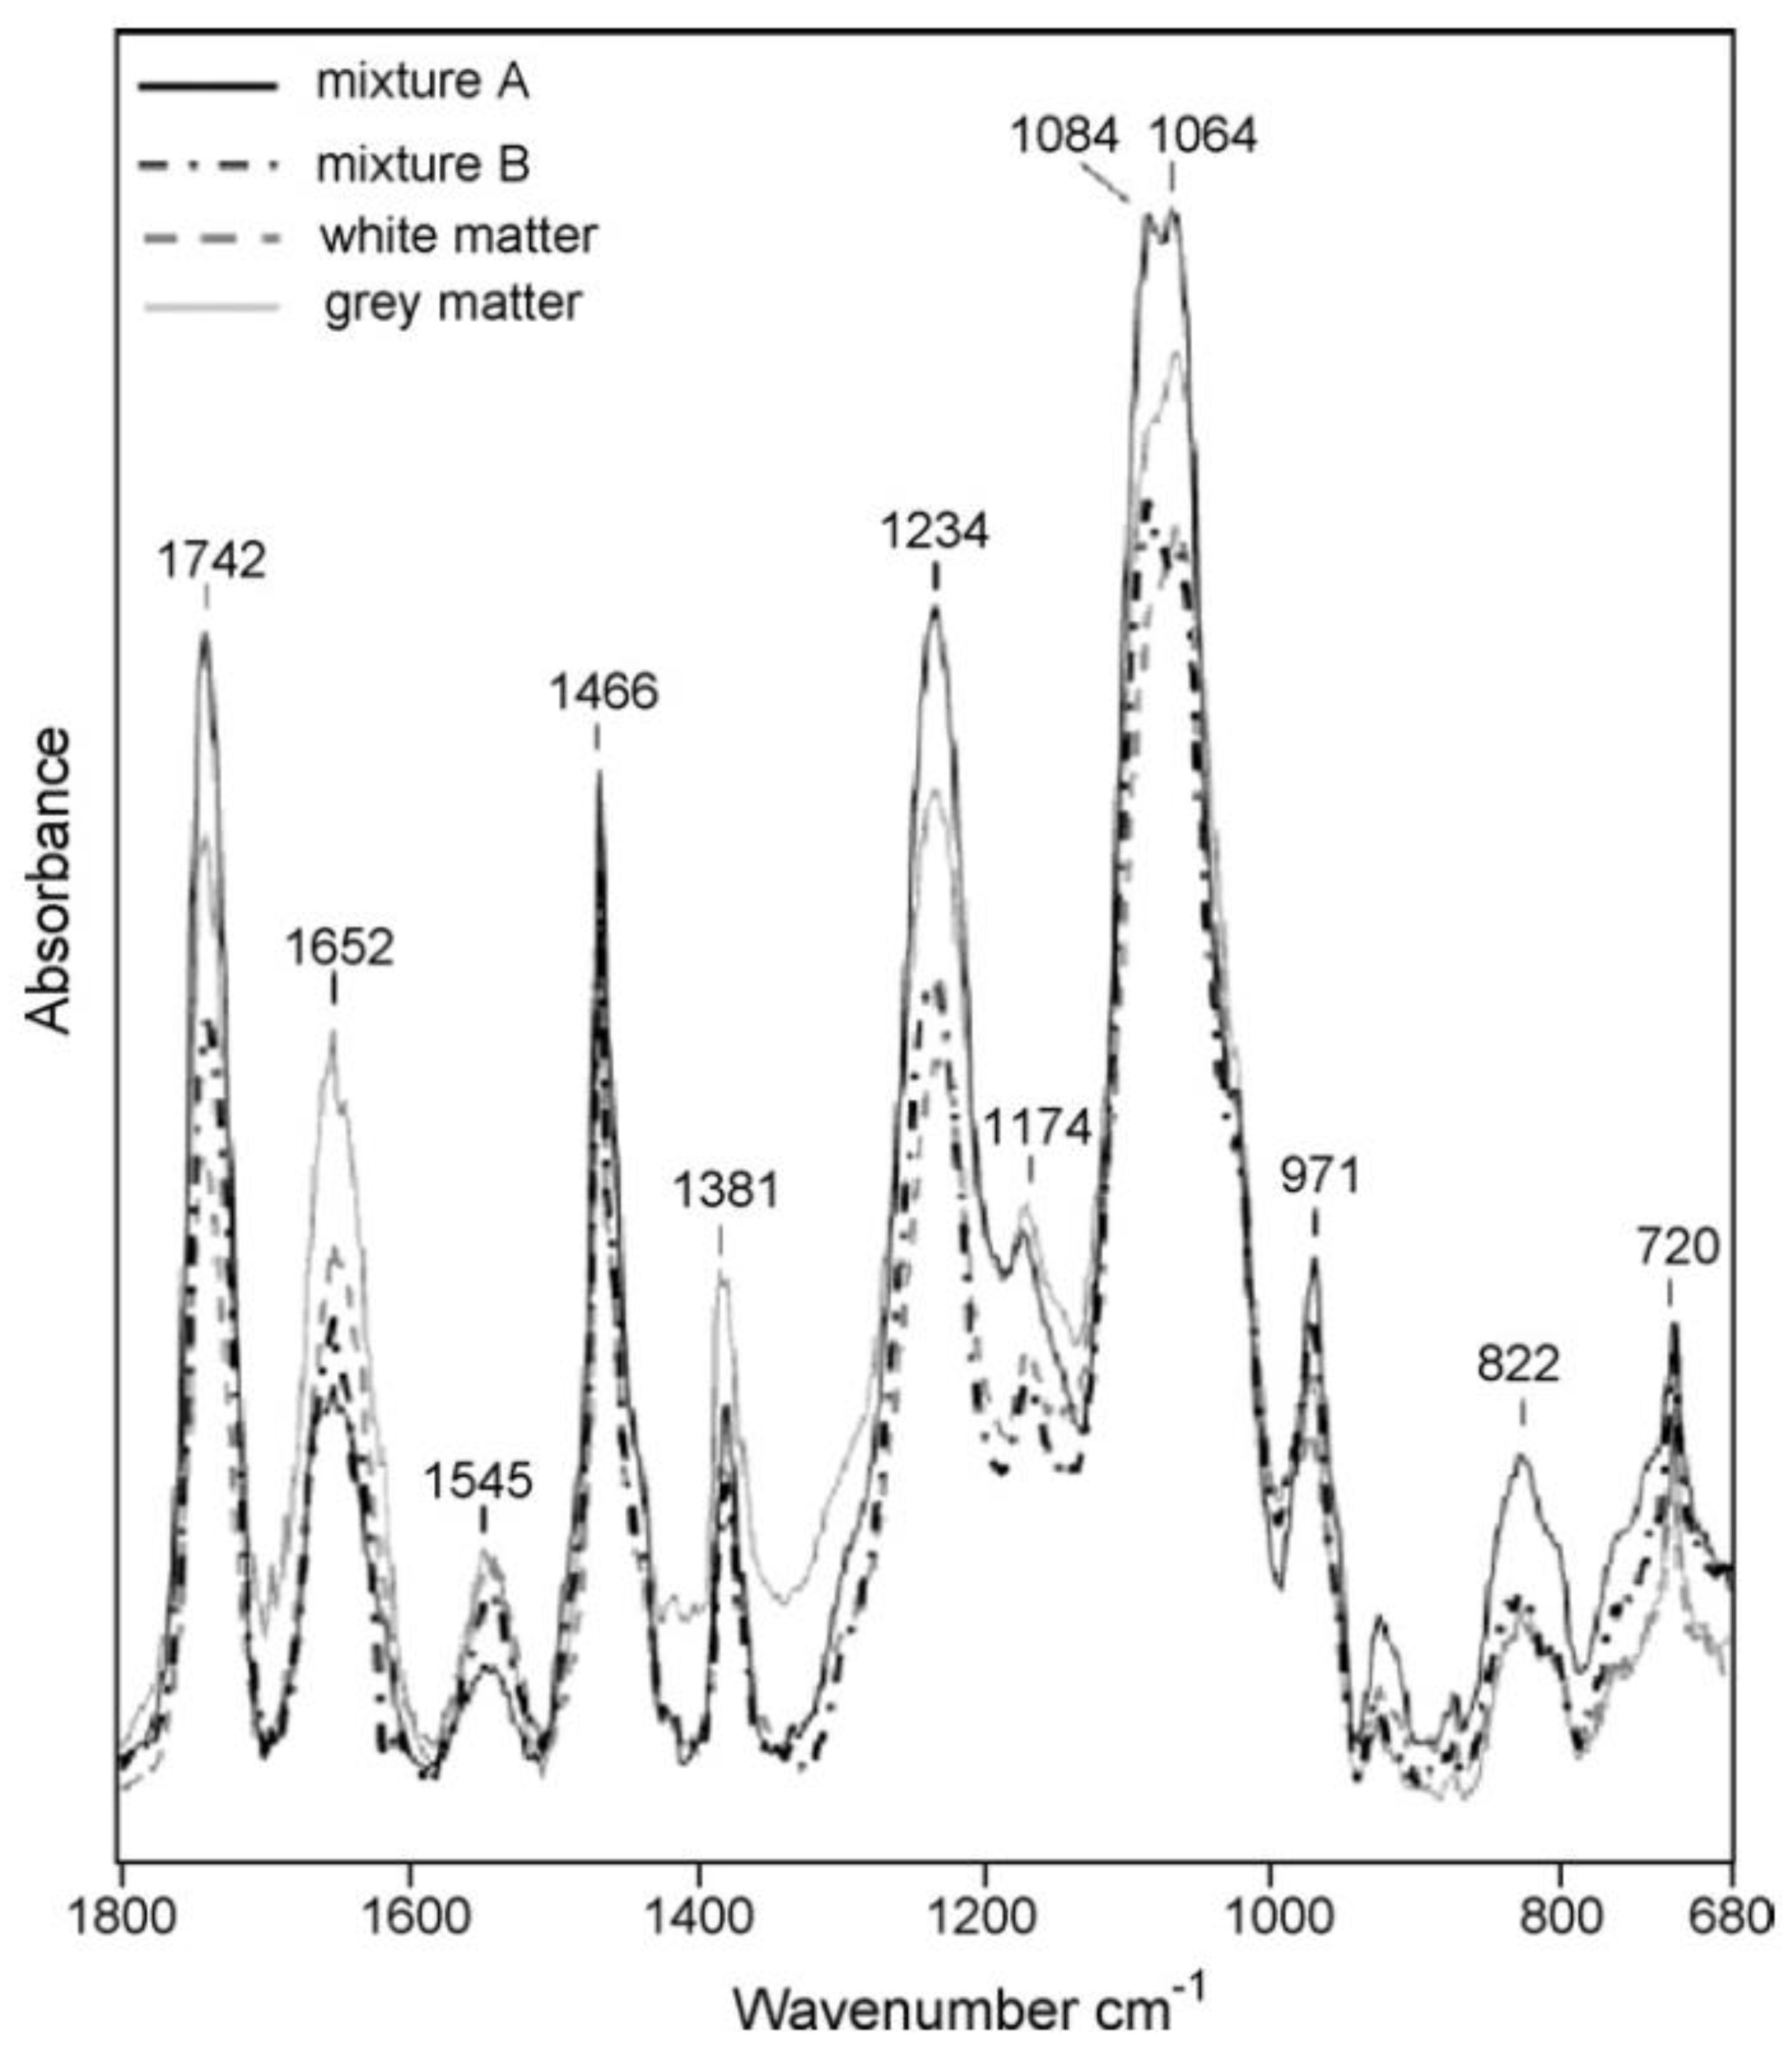
4.3. Analysis of Lipid Mixtures

The spectra of different lipid components have been used for analyzing spectra from complex mixtures of lipids as samples extracted from cells and tissues [6,7]. As stated before, the analysis of lipid extract biochemical characteristics is extremely useful in a large variety of cases, such as disease diagnosis [6,7,8,9,10,11], drug effect monitoring [12,13] and ionizing radiation effect studies [14,15,16]. Implementing a chemometric analysis usually requires the acquisition of a very large number of spectra from many mixtures of the simple lipid components that are present in cell and tissue samples in order to build a model. The different mixtures are prepared using different percentages of single constituents. In order to acquire the above-mentioned spectra, large quantities of expensive materials and a certain amount of experimental work are required.
Alternatively, the spectral data of Figure 1, Figure 2 and Figure 3 (available on request) can be used for reconstructing the FT-IR spectra of complex samples by using appropriate software algorithm and considering the percentages of the different lipids present in the cells or tissues [73,74] from which lipids can be extracted following one of the available methods (see Refs. [75,76] and references therein). The use of valid fitting procedures between computed and experimental spectra can provide precise information about the sample constituents.
As a representative result, in Figure 4, the spectrum reconstructed using the spectra reported in Figure 1, Figure 2 and Figure 3 according to the lipid percentages reported in Table 1 of Ref. [74] is shown. In particular, the spectrum of Figure 4 was obtained by considering contributions equal to 10% for CH, 45% for PC, 20% for PE, 12% for PI, 7% for PS and 6% for SM components [74].
Figure 5 from Ref. [7] shows the FT-IR spectra acquired using lipids extracted from brain white and gray matter and A and B mixtures of commercial lipids. A visual inspection of the fingerprint region (1800–750 cm−1) of Figure 4 and Figure 5 reveals a strong resemblance between the reconstructed spectra of Figure 4 and the brain white and gray matter spectra of Figure 5. As mentioned before, Dreissig et al. [7] made a comparison with spectra experimentally acquired from different solutions prepared with different percentages of commercial lipids for obtaining information about lipid constituents of brain tissues. Also, Derenne et al. [6] worked in a similar way using a large number of prepared solutions for building a model for defining the lipid components of cancer cells. The qualitative comparison between Figure 4 and Figure 5 discussed here can indicate that the use of experimental spectral data for single lipid components together with proper software algorithms can accelerate the study of lipid complex samples.

5. Conclusions

The present study enabled us to obtain the ATR-FTIR spectra of the more relevant lipids that can be found in human cells. Good-quality spectra were obtained, and the related spectral data are available on request. These spectra clearly show the contributions of the different functional groups that are present in the different examined samples. Detailed assignments of the different spectral features are reported in the Supplementary Material, and they result in good agreement with the literature. Representative results of a quantitative analysis of some spectra using a ratiometric approach and a reconstruction procedure of FT-IR spectra of complex lipids useful for chemometrics applications are also reported. The findings from this study pave the way for further investigations and the development of advanced analytical techniques, ultimately contributing to the broader field of lipid research and its implications in human health.

Supplementary Materials

The following supporting information can be downloaded at https://www.mdpi.com/article/10.3390/biophysica3030035/s1, Tables S1–S4: Peak positions and assignments for ATR-FTIR spectra of the investigated samples.

Author Contributions

Conceptualization, M.L., B.F. and M.P.; methodology, M.P. and B.F.; software, M.P. and B.F.; experimental investigation, B.F. and M.P.; resources, M.L.; data curation, M.P.; writing—original draft preparation, B.F. and M.L.; writing—review and editing, M.P., M.L. and B.F. All authors have read and agreed to the published version of the manuscript.

Funding

This research received no external funding.

Data Availability Statement

Data will be available on request.

Conflicts of Interest

The authors declare no conflict of interest.

References

  1. Fringeli, U.P.; Gunthard, H.H. Infrared membrane spectroscopy. Mol. Biol. Biochem. Biophys. 1981, 31, 270–332. [Google Scholar] [CrossRef] [PubMed]
  2. Tamm, L.K.; Tatulian, S.A. Infrared spectroscopy of proteins and peptides in lipid bilayers. Q. Rev. Biophys. 1997, 30, 365–429. [Google Scholar] [CrossRef]
  3. Goormaghtigh, E.; Raussens, V.; Ruysschaert, J.-M. Attenuated total reflection infrared spectroscopy of proteins and lipids in biological membranes. Biochim. Biophys. Acta 1999, 1422, 105–185. [Google Scholar] [CrossRef] [PubMed]
  4. Yoshida, S.; Koike, K. Lipid and membrane dynamics in biological tissues—Infrared spectroscopic studies. In Advances in Planar Lipid Bilayers and Liposomes; Elsevier Science Publisher: Amsterdam, The Netherlands, 2011; Volume 13, pp. 1–32. [Google Scholar]
  5. Derenne, A.; Claessens, T.; Conus, C.; Goormaghtigh, E. Infrared spectroscopy of membrane lipids. In Encyclopedia of Biophysics; Springer: Berlin/Heidelberg, Germany, 2013; pp. 1074–1081. [Google Scholar]
  6. Derenne, A.; Vandersleyen, O.; Goormaghtigh, E. Lipid quantification method using FTIR spectroscopy applied on cancer cell extracts. Biochim. Biophys. Acta 2014, 1841, 1200–1209. [Google Scholar] [CrossRef] [PubMed]
  7. Dreissig, I.; Machill, S.; Salzer, R.; Krafft, C. Quantification of brain lipids by FTIR spectroscopy and partial least squares regression. Spectrochim. Acta A Mol. Biomol. Spectrosc. 2009, 71, 2069–2075. [Google Scholar] [CrossRef] [PubMed]
  8. Beljebbar, A.; Amharref, N.; Lèvèques, A.; Dukic, S.; Venteo, L.; Schneider, L.; Pluot, M.; Manfait, M. Modeling and quantifying biochemical changes in C6 tumor gliomas by Fourier transform infrared imaging. Anal. Chem. 2008, 80, 8406–8415. [Google Scholar] [CrossRef] [PubMed]
  9. Beljebbar, A.; Dukic, S.; Amharref, N.; Bellefqih, S.; Manfait, M. Monitoring of biochemical changes through the C6 gliomas progression and invasion by Fourier transform infrared (FTIR) imaging. Anal. Chem. 2009, 81, 9247–9256. [Google Scholar] [CrossRef]
  10. Severcan, F.; Bozkurt, O.; Gurbanov, R.; Gorgulu, G. FT-IR spectroscopy in diagnosis of diabetes in rat animal model. J Biophotonics 2010, 3, 621–631. [Google Scholar] [CrossRef]
  11. Guleken, Z.; Bulut, H.; Depciuch, J.; Tarhan, N. Diagnosis of endometriosis using endometrioma volume and vibrational spectroscopy with multivariate methods as a noninvasive method. Acta A Mol. Biomol. Spectrosc. 2022, 264, 120246. [Google Scholar] [CrossRef]
  12. Gasper, R.; Dewelle, J.; Kiss, R.; Mijatovic, T.; Goormaghtigh, E. IR spectroscopy as a new tool for evidencing antitumor drug signatures. Biochim. Biophys. Acta 2009, 1788, 1263–1270. [Google Scholar] [CrossRef]
  13. Gasper, R.; Vandenbussche, G.; Goormaghtigh, E. Ouabain-induced modifications of prostate cancer cell lipidome investigated with mass spectrometry and FTIR spectroscopy. Biochim. Biophys. Acta 2011, 1808, 597–605. [Google Scholar] [CrossRef] [PubMed]
  14. Lipiec, E.; Bambery, K.R.; Heraud, P.; Hirschmugl, C.; Lekki, J.; Kwiatek, W.M.; Tobin, M.J.; Vogel, C.; Whelan, D.; Wood, B.R. Synchrotron FTIR shows evidence of DNA damage and lipid accumulation in prostate adenocarcinoma PC-3 cells following proton irradiation. J. Mol. Struct. 2014, 1073, 134–141. [Google Scholar] [CrossRef]
  15. Ricciardi, V.; Portaccio, M.; Manti, L.; Lepore, M. An FTIR microspectroscopy ratiometric approach for monitoring X-ray irradiation effects on SH-SY5Y human neuroblastoma cells. Appl. Sci. 2020, 10, 2974. [Google Scholar] [CrossRef]
  16. Ricciardi, V.; Portaccio, M.; Perna, G.; Lasalvia, M.; Capozzi, V.; Cammarata, F.P.; Pisciotta, P.; Petringa, G.; Delfino, I.; Manti, L. FT-IR transflection micro-spectroscopy study on normal human breast cells after exposure to a proton beam. Appl. Sci. 2021, 11, 540. [Google Scholar] [CrossRef]
  17. Cakmak, G.; Miller, L.M.; Zorlu, F.; Severcan, F. Amifostine, a radioprotectant agent, protects rat brain tissue lipids against ionizing radiation induced damage: An FTIR microspectroscopic imaging study. Arch. Biochem. Biophys. 2012, 520, 67–73. [Google Scholar] [CrossRef] [PubMed]
  18. Cakmak, G.; Togan, I.; Severcan, F. 17β-Estradiol induced compositional, structural and functional changes in rainbow trout liver, revealed by FT-IR spectroscopy: A comparative study with nonylphenol. Aquat. Toxicol. 2006, 77, 53–63. [Google Scholar] [CrossRef] [PubMed]
  19. Prakash, C.; Kamboj, V.K.; Ahlawat, P.; Kumar, V. Structural and molecular alterations in arsenic-induced hepatic oxidative stress in rats: A FTIR study. Toxicol. Environ. Chem. 2015, 97, 1408–1421. [Google Scholar] [CrossRef]
  20. Villalaín, J.; Ortiz, A.; Gómez-Fernández, J.C. Molecular interactions between sphingomyelin and phosphatidylcholine in phospholipid vesicles. Biochim. Biophys. Acta 1988, 941, 55–62. [Google Scholar] [CrossRef]
  21. Moore, D.J.; Rerek, M.E.; Mendelsohn, R. FTIR spectroscopy studies of the conformational order and phase behavior of ceramides. J. Phys. Chem. B 1997, 101, 8933–8940. [Google Scholar] [CrossRef]
  22. Carrasco-Pancorbo, A.; Navas-Iglesias, N.; Cuadros-Rodriguez, L. From lipid analysis towards lipidomics, a new challenge for the analytical chemistry of the 21st century. Part I: Modern lipid analysis. Trends Anal. Chem. 2009, 28, 263–278. [Google Scholar] [CrossRef]
  23. Navas-Iglesias, N.; Carrasco-Pancorbo, A.; Cuadros-Rodríguez, L. From lipids analysis towards lipidomics, a new challenge for the analytical chemistry of the 21st century. Part II: Analytical lipidomics. Trends Anal. Chem. 2009, 28, 393–403. [Google Scholar] [CrossRef]
  24. Baenke, F.; Peck, B.; Miess, H.; Schulze, A. Hooked on fat: The role of lipid synthesis in cancer metabolism and tumour development. Dis. Model. Mech. 2013, 6, 1353–1363. [Google Scholar] [CrossRef] [PubMed]
  25. De la Arada, I.; González-Ramírez, E.J.; Alonso, A.; Goñi, F.M.; Arrondo, J.-L.R. Exploring polar headgroup interactions between sphingomyelin and ceramide with infrared spectroscopy. Sci. Rep. 2020, 10, 17606. [Google Scholar] [CrossRef] [PubMed]
  26. Robinson, H.; Molendijk, J.; Shah, A.K.; Rahman, T.; Anderson, G.J.; Hill, M.M. Rapid Assessment of Lipidomics Sample Purity and Quantity Using Fourier-Transform Infrared Spectroscopy. Biomolecules 2022, 12, 1265. [Google Scholar] [CrossRef] [PubMed]
  27. Jurowski, K.; Kochan, K.; Walczak, J.; Barańska, M.; Piekoszewski, W.; Buszewski, B. Analytical techniques in lipidomics: State of the art. Crit. Rev. Anal. Chem. 2017, 47, 418–437. [Google Scholar] [CrossRef] [PubMed]
  28. Butler, H.J.; Brennan, P.M.; Cameron, J.M.; Finlayson, D.; Hegarty, M.G.; Jenkinson, M.D.; Palmer, D.S.; Smith, B.R.; Baker, M.J. Development of high-throughput ATR-FTIR technology for rapid triage of brain cancer. Nat. Commun. 2019, 10, 4501. [Google Scholar] [CrossRef] [PubMed]
  29. Guo, S.; Wei, G.; Chen, W.; Lei, C.; Xu, C.; Guan, Y.; Ji, T.; Wang, F.; Liu, H. Fast and deep diagnosis using blood-based ATR-FTIR spectroscopy for digestive tract cancers. Biomolecules 2022, 12, 1815. [Google Scholar] [CrossRef]
  30. Kumar, S.; Verma, T.; Mukherjee, R.; Ariese, F.; Somasundaram, K.; Umapathy, S. Raman and infra-red microspectroscopy: Towards quantitative evaluation for clinical research by ratiometric analysis. Chem. Soc. Rev. 2016, 45, 1879–1900. [Google Scholar] [CrossRef]
  31. Severcan, M.; Haris, P.I.; Severcan, F. Using artificially generated spectral data to improve protein secondary structure prediction from Fourier transform infrared spectra of proteins. Anal. Biochem. 2004, 332, 238–244. [Google Scholar] [CrossRef]
  32. Liu, W.; Luo, X.; Wang, J.; Li, Y.; Feng, F.; Zhao, M. Digestive behavior of unemulsified triglycerides with different chain lengths: In vitro dynamic and static simulated digestion models. LWT 2021, 149, 112006. [Google Scholar] [CrossRef]
  33. Christie, W.W. The composition, structure and function of lipids in the tissues of ruminant animals. Prog. Lipid Res. 1981, 95–191. [Google Scholar] [CrossRef]
  34. Cui, Z.; Houweling, M. Phosphatidylcholine and cell death. Biochim. Biophys. Acta 2002, 1585, 87–96. [Google Scholar] [CrossRef] [PubMed]
  35. Deleault, N.R.; Piro, J.R.; Walsh, D.J.; Wang, F.; Ma, J.; Geoghegan, J.C.; Supattapone, S. Isolation of phosphatidylethanolamine as a solitary cofactor for prion formation in the absence of nucleic acids. Proc. Natl. Acad. Sci. USA 2012, 109, 8546–8551. [Google Scholar] [CrossRef] [PubMed]
  36. Emoto, K.; Kobayashi, T.; Yamaji, A.; Aizawa, H.; Yahara, I.; Inoue, K.; Umeda, M. Redistribution of phosphatidylethanolamine at the cleavage furrow of dividing cells during cytokinesis. Proc. Natl. Acad. Sci. USA 1996, 93, 12867–12872. [Google Scholar] [CrossRef] [PubMed]
  37. Vance, J.E.; Tasseva, G. Formation and function of phosphatidylserine and phosphatidylethanolamine in mammalian cells. Biochim. Biophys. Acta 2013, 1831, 543–554. [Google Scholar] [CrossRef] [PubMed]
  38. Wellner, N.; Diep, T.A.; Janfelt, C.; Hansen, H.S. N-acylation of phosphatidylethanolamine and its biological functions in mammals. Biochim. Biophys. Acta 2013, 1831, 652–662. [Google Scholar] [CrossRef]
  39. Kim, H.-Y.; Akbar, M.; Kim, Y.-S. Phosphatidylserine-dependent neuroprotective signaling promoted by docosahexaenoic acid. Prostaglandins Leukot. Essent. Fat. Acids (PLEFA) 2010, 82, 165–172. [Google Scholar] [CrossRef]
  40. Akbar, M.; Calderon, F.; Wen, Z.; Kim, H.-Y. Docosahexaenoic acid: A positive modulator of Akt signaling in neuronal survival. Proc. Natl. Acad. Sci. USA 2005, 102, 10858–10863. [Google Scholar] [CrossRef]
  41. Kim, H.-Y.; Akbar, M.; Lau, A.; Edsall, L. Inhibition of neuronal apoptosis by docosahexaenoic acid (22: 6n-3): Role of phosphatidylserine in antiapoptotic effect. J. Biol. Chem. 2000, 275, 35215–35223. [Google Scholar] [CrossRef]
  42. Svennerholm, L. Distribution and fatty acid composition of phosphoglycerides in normal human brain. J. Lipid Res. 1968, 9, 570–579. [Google Scholar] [CrossRef]
  43. Mueller-Roeber, B.; Pical, C. Inositol phospholipid metabolism in Arabidopsis. Characterized and putative isoforms of inositol phospholipid kinase and phosphoinositide-specific phospholipase C. Plant Physiol. 2002, 130, 22–46. [Google Scholar] [CrossRef] [PubMed]
  44. Perry, D.K.; Obeid, L.M.; Hannun, Y.A. Ceramide and the regulation of apoptosis and the stress response. Trends Cardiovasc. Med. 1996, 6, 158–162. [Google Scholar] [CrossRef] [PubMed]
  45. Parveen, F.; Bender, D.; Law, S.-H.; Mishra, V.K.; Chen, C.-C.; Ke, L.-Y. Role of ceramidases in sphingolipid metabolism and human diseases. Cells 2019, 8, 1573. [Google Scholar] [CrossRef] [PubMed]
  46. Carpinteiro, A.; Dumitru, C.; Schenck, M.; Gulbins, E. Ceramide-induced cell death in malignant cells. Cancer Lett. 2008, 264, 1–10. [Google Scholar] [CrossRef] [PubMed]
  47. Modrak, D.E.; Gold, D.V.; Goldenberg, D.M. Sphingolipid targets in cancer therapy. Mol. Cancer Ther. 2006, 5, 200–208. [Google Scholar] [CrossRef] [PubMed]
  48. Beckham, T.H.; Cheng, J.C.; Marrison, S.T.; Norris, J.S.; Liu, X. Interdiction of sphingolipid metabolism to improve standard cancer therapies. Adv. Cancer Res. 2013, 117, 1–36. [Google Scholar]
  49. Henry, B.; Möller, C.; Dimanche-Boitrel, M.-T.; Gulbins, E.; Becker, K.A. Targeting the ceramide system in cancer. Cancer Lett. 2013, 332, 286–294. [Google Scholar] [CrossRef]
  50. Kitatani, K.; Idkowiak-Baldys, J.; Hannun, Y.A. The sphingolipid salvage pathway in ceramide metabolism and signaling. Cell Signal. 2008, 20, 1010–1018. [Google Scholar] [CrossRef]
  51. Hajj, C.; Haimovitz-Friedman, A. Sphingolipids’ role in radiotherapy for prostate cancer. Handb. Exp. Pharmacol. 2013, 216, 115–130. [Google Scholar]
  52. Vit, J.-P.; Rosselli, F. Role of the ceramide-signaling pathways in ionizing radiation-induced apoptosis. Oncogene 2003, 22, 8645–8652. [Google Scholar] [CrossRef]
  53. Aureli, M.; Murdica, V.; Loberto, N.; Samarani, M.; Prinetti, A.; Bassi, R.; Sonnino, S. Exploring the link between ceramide and ionizing radiation. Glycoconj J. 2014, 31, 449–459. [Google Scholar] [CrossRef] [PubMed]
  54. Corre, I.; Niaudet, C.; Paris, F. Plasma membrane signaling induced by ionizing radiation. Mutat. Res./Rev. Mutat. Res. 2010, 704, 61–67. [Google Scholar] [CrossRef] [PubMed]
  55. Mendelson, K.; Evans, T.; Hla, T. Sphingosine 1-phosphate signalling. Development 2014, 141, 5–9. [Google Scholar] [CrossRef] [PubMed]
  56. Spiegel, S.; Milstien, S. Functions of the multifaceted family of sphingosine kinases and some close relatives. J. Biol. Chem. 2007, 282, 2125–2129. [Google Scholar] [CrossRef] [PubMed]
  57. Maceyka, M.; Sankala, H.; Hait, N.C.; Le Stunff, H.; Liu, H.; Toman, R.; Collier, C.; Zhang, M.; Satin, L.S.; Merrill, A.H. SphK1 and SphK2, sphingosine kinase isoenzymes with opposing functions in sphingolipid metabolism. J. Biol. Chem. 2005, 280, 37118–37129. [Google Scholar] [CrossRef] [PubMed]
  58. Sattler, K.; Levkau, B. Sphingosine-1-phosphate as a mediator of high-density lipoprotein effects in cardiovascular protection. Cardiovasc. Res. 2009, 82, 201–211. [Google Scholar] [CrossRef] [PubMed]
  59. Hait, N.C.; Maiti, A. The role of sphingosine-1-phosphate and ceramide-1-phosphate in inflammation and cancer. Mediat. Inflamm. 2017, 2017, 4806541. [Google Scholar] [CrossRef]
  60. Türker-Kaya, S.; Kına, A. Calorimetric and spectroscopic investigation of the interaction of chemotherapeutic agent carboplatin with sphingomyelin lipids. J. Therm. Anal. Calorim. 2021, 146, 2515–2522. [Google Scholar] [CrossRef]
  61. Ohanian, J.; Ohanian, V. Sphingolipids in mammalian cell signalling. Cell. Mol. Life Sci. 2001, 58, 2053–2068. [Google Scholar] [CrossRef]
  62. Lasch, P. Spectral pre-processing for biomedical vibrational spectroscopy and microspectroscopic imaging. Chem. Intell. Lab. Syst. 2012, 117, 100–114. [Google Scholar] [CrossRef]
  63. Abdelrazzak, A.B.; Hezma, A.; El-Bahy, G.S. ATR-FTIR spectroscopy probing of structural alterations in the cellular membrane of abscopal liver cells. Biochim. Biophys. Acta Biomembr. 2021, 1863, 183726. [Google Scholar] [CrossRef] [PubMed]
  64. Movasaghi, Z.; Rehman, S.; ur Rehman, D.I. Fourier transform infrared (FTIR) spectroscopy of biological tissues. Appl. Spectrosc. Rev. 2008, 43, 134–179. [Google Scholar] [CrossRef]
  65. Faramarzi, B.; Moggio, M.; Diano, N.; Portaccio, M.; Lepore, M. A Brief Review of FT-IR Spectroscopy Studies of Sphingolipids in Human Cells. Biophysica 2023, 3, 158–180. [Google Scholar] [CrossRef]
  66. Albuquerque, M.; Guedes, I.; Alcantara, P., Jr.; Moreira, S. Infrared absorption spectra of Buriti (Mauritia flexuosa L.) oil. Vib. Spectrosc. 2003, 33, 127–131. [Google Scholar] [CrossRef]
  67. Krafft, C.; Neudert, L.; Simat, T.; Salzer, R. Near infrared Raman spectra of human brain lipids. Spectrochim. Acta Part A Mol. Biomol. Spectrosc. 2005, 61, 1529–1535. [Google Scholar] [CrossRef] [PubMed]
  68. Gupta, U.; Singh, V.K.; Kumar, V.; Khajuria, Y. Spectroscopic studies of cholesterol: Fourier transform infra-red and vibrational frequency analysis. Mater. Focus 2014, 3, 211–217. [Google Scholar] [CrossRef]
  69. Gautam, R.; Vanga, S.; Ariese, F.; Umapathy, S. Review of multidimensional data processing approaches for Raman and infrared spectroscopy. EPJ Technol. Instrum. 2015, 2, 1–38. [Google Scholar] [CrossRef]
  70. Rohman, A.; Ghazali, M.A.I.B.; Windarsih, A.; Riyanto, S.; Yusof, F.M.; Mustafa, S. Comprehensive review on application of FTIR spectroscopy coupled with chemometrics for authentication analysis of fats and oils in the food products. Molecules 2020, 25, 5485. [Google Scholar] [CrossRef]
  71. Baker, M.J.; Trevisan, J.; Bassan, P.; Bhargava, R.; Butler, H.J.; Dorling, K.M.; Fielden, P.R.; Fogarty, S.W.; Fullwood, N.J.; Heys, K.A. Using Fourier transform IR spectroscopy to analyze biological materials. Nat. Protoc. 2014, 9, 1771–1791. [Google Scholar] [CrossRef]
  72. Ricciardi, V.; Lasalvia, M.; Perna, G.; Portaccio, M.; Delfino, I.; Lepore, M.; Capozzi, V.; Manti, L. Vibrational spectroscopies for biochemical investigation of X-ray exposure effects on SH-SY5Y human neuroblastoma cells. Radiat. Env. Biophys. 2023, 62, 289–305. [Google Scholar] [CrossRef]
  73. Ray, T.K.; Skipski, V.P.; Barclay, M.; Essner, E.; Archibald, F.M. Lipid composition of rat liver plasma membranes. J Biol Chem. 1969, 244, 5528–5536. [Google Scholar] [CrossRef] [PubMed]
  74. Vance, J.E. Phospholipid synthesis and transport in mammalian cells. Traffic 2015, 16, 1–18. [Google Scholar] [CrossRef] [PubMed]
  75. Moggio, M.; Errico, S.; Diano, N.; Lepore, M. FTIR spectroscopy for evaluation and monitoring of lipid extraction efficiency for murine liver tissues analysis. Eng. Proc. 2021, 10, 9. [Google Scholar]
  76. Faramarzi, B.; Moggio, M.; Cardamuro, V.; Portaccio, M.; Diano, N.; Manti, L.; Lepore, M. An FTIR spectroscopy investigation on different methods of lipid extraction from HepG2 cells. Eng. Proc. 2022, 27, 39. [Google Scholar]
Figure 1. ATR-FTIR spectra of phospholipids (phosphatidylcholine (PC), phosphatidylethanolamine (PE), phosphatidylserine (PS) and phosphatidylinositol (PI)) from 3500 to 2800 cm−1 and 1800 to 600 cm−1.
Biophysica 03 00035 g001
Figure 2. ATR-FTIR spectra of sphingolipids from 3500 to 2800 cm−1 and 1800 to 600 cm−1 (ceramide (Cer), sphingosine 1-phosphate (S1P), ceramide 1-phosphate (C1P) and sphingomyelin (SM)) from 3500 to 2800 cm−1 and 1800 to 600 cm−1.
Biophysica 03 00035 g002
Figure 3. ATR-FTIR spectra of cholesterol (CH) and triolein from 3150 to 2800 cm−1 and 1800 to 600 cm−1.
Biophysica 03 00035 g003
Figure 4. Evaluated FT-IR spectrum obtained from a convolution of spectra of lipid components reported in Figure 2, Figure 3 and Figure 4. Each contribution was weighted according to the percentage indicated in Ref. [74].
Biophysica 03 00035 g004
Figure 5. Experimental FT-IR spectra of lipid extracts from brain white and gray matter and A and B mixtures of commercial lipids. See Ref. [7] for information about mixture components. (Spectra are reproduced with permission from Ref. [7].
Biophysica 03 00035 g005
Table 1. The structures of the main lipids present in human cells and investigated in the present work are reported. In particular, four phospholipids (phosphatidylcholine, phosphatidylethanolamine, phosphatidylserine and phosphatidylinositol) and four sphingolipids (C18 ceramide, sphingosine-1-phosphate, ceramide-1-phosphate and sphingomyelin) are presented together with cholesterol and triolein.
Commercial LipidsStructure
Phosphatidylcholine
(PC)
Biophysica 03 00035 i001
Phosphatidylethanolamine
(PE)
Biophysica 03 00035 i002
Phosphatidylserine
(PS)
Biophysica 03 00035 i003
Phosphatidylinositol
(PI)
Biophysica 03 00035 i004
Ceramide (Cer)Biophysica 03 00035 i005
Sphingosine 1-phosphate
(S1P)
Biophysica 03 00035 i006
Ceramide-1-phosphate
(C1P)
Biophysica 03 00035 i007
Sphingomyelin
(SM)
Biophysica 03 00035 i008
Cholesterol
(CH)
Biophysica 03 00035 i009
TrioleinBiophysica 03 00035 i010
Table 2. Ratios of spectral areas considered for analysis with their relative biological indications [17,30,63]. The numerical data represent the means, and the related standard deviations result is less than 5%.
Area RatioBaseline Points (cm−1)IndicationPISM
(1)CH2as/Lipid(2900–2948)/
(2830–3027)
Chain length of lipids0.490.46
(2)CH3as/Lipid(2943–2968)/
(2830–3027)
Methyl concentration0.110.09
(3)Olefinic=CH/
Lipid
(2992–3030)/
(2830–3027)
Concentration unsaturated fatty acids0.0350.045
(4)Carbonyl C=O/Lipid(1717–1753)/
(2830–3027)
Carbonyl content0.270.007
(5)CH2as/CH3as(2900–2948)/
(2943–2968)
Length of hydrocarbon chain4.435.16
(6)CH2s + CH2as/Olefinic=CH(2855 + 2920)/
(2992–3030)
Saturation level of lipids0.420.45
Disclaimer/Publisher’s Note: The statements, opinions and data contained in all publications are solely those of the individual author(s) and contributor(s) and not of MDPI and/or the editor(s). MDPI and/or the editor(s) disclaim responsibility for any injury to people or property resulting from any ideas, methods, instructions or products referred to in the content.

