Article

Adsorption of Heparin-Binding Fragments of Fibronectin onto Hydrophobic Surfaces

by
Viswanath Vittaladevaram
1,2 and
David L. Cheung
1,*
1
School of Biological and Chemical Sciences, University of Galway, H91 TK33 Galway, Ireland
2
CURAM, SFI Research Centre for Medical Devices, University of Galway, H91 W2TY Galway, Ireland
*
Author to whom correspondence should be addressed.
Biophysica 2023, 3(3), 409-424; https://doi.org/10.3390/biophysica3030027
Submission received: 30 May 2023 / Revised: 15 June 2023 / Accepted: 20 June 2023 / Published: 23 June 2023
(This article belongs to the Special Issue Protein Engineering: The Present and the Future 2.0)

Abstract

:
Fibronectin is a multi-domain, extracellular matrix protein that plays a number of biological roles. As the adsorption of fibronectin onto the surface of implanted devices can lead to an inflammatory response or bacterial colonisation, understanding the interaction of fibronectin with material surfaces is important in the design of materials for biomedical applications. This, however, relies on having knowledge of the molecular-scale behaviour of proteins, which is difficult to investigate experimentally. In this paper, we used molecular dynamics simulations to investigate the adsorption of heparin-binding fibronectin domains onto hydrophobic surfaces. Despite the high similarity between these, their adsorption differs both in terms of the strength and the specificity of this, indicating that relatively small changes in protein structure can lead to significant changes in adsorption behaviour. This suggests that the interplay between protein structure and surface chemistry is vital for understanding the protein adsorption process and the design of novel biomaterials.

1. Introduction

Understanding protein adsorption is critical for the design of biomaterial surfaces that can combine functionality with biocompatibility [1,2,3]. Protein adsorption onto surfaces, which governs the biocompatibility of materials [4], is an incremental and dynamic process. It depends on the properties of the surface and protein and can lead to interactions at interfaces that could either trigger or prevent biological responses or stimuli. The effective design of biomaterials with desired biological responses may be feasible by controlling protein adsorption [5] but this relies on understanding the molecular details of the protein–surface interaction [6].
As the protein adsorption process is multifactorial [4], understanding it requires elucidation of the interplay between protein structure and surface properties. This would allow for the modification or design of materials for specific applications, such as tissue engineering [7], biomaterials [8] and drug delivery. This is required for the design of biomaterials for a wide range of applications, such as tissue engineering scaffolds, anticoagulants and drug delivery vehicles. It would allow for the modification of biomaterial surfaces to improve the process of cell adhesion, proliferation and differentiation towards designing new biomaterials in the field of regenerative medicine and tissue engineering [9,10]. Protein adsorption onto material surfaces has gained much attention as it can determine the biological response to synthetic materials, and so influences the design of biomaterial surfaces for creating medical devices and biomedical implants.
While a wide variety of proteins have been investigated, fibronectin has attracted much attention [11]. This is a ubiquitous, multidomain and adhesive protein present in the extracellular matrix that influences cell behaviour during cellular exchange. Fibronectin illustrates flexibility in terms of conformational adaptability [12], resulting in multiple functions such as cell differentiation [13], growth [14] and proliferation [15]. It has been extensively used as a model protein for the investigation of protein adsorption at interfaces. These studies have aimed to refine the bioactivity of biomaterial surfaces and control the adsorption process at interfaces. As fibronectin is involved in diverse functions in terms of cell regulation, it is preferably suitable for studying protein dynamics and typically undergoes conformational changes that control its activity. Fibronectin exists as a dimer [11], with each monomer being composed of three different types of repeat units, specifically the Type-I, II and III domains [16]. While the number of these domains varies, the structure of the domains is relatively consistent. The Type-III domains have attracted particular attention for their role in binding to cells and other biomolecules [17].
Several experimental methods ranging from microscopy to spectroscopic approaches have been used to investigate the protein adsorption process. These studies include the characterisation of protein dynamics and the molecular architecture of protein–surface interfaces. These aimed to give information that can be used to control the orientation and conformation of proteins on surfaces and understand the bioactivity of surfaces, which still remains ambiguous. Alternatively, molecular dynamics simulation and other computational techniques can be used to study proteins near the surface [18]. These focus on protein structure and motion on microscopic-length scales, which are difficult to probe experimentally. The atomic-level interactions that can be resolved using molecular dynamics simulation complement experimental studies by giving insight into molecular details that affect protein adsorption, such as the role of bound water [19] or surface structure [20,21,22].
Due to the experimental interest in the behaviour of fibronectin, its adsorption onto surfaces has been the subject of a number of simulation studies [23,24,25,26,27,28,29,30,31]. These have investigated the adsorption of different fibronectin domains onto surfaces, investigating how surface chemistry affects protein conformation and adsorption. Commonly, these have targeted fibronectin domains involved in cell recognition and binding (the Type-III 7-10 domains [32]), showing how the mechanism of protein adsorption onto different surfaces is related to conformational changes and bioactivity, which can be exploited in developing novel biomaterials.
In this manuscript, we investigated a number of fibronectin type-III domains, specifically the FnIII-12, FnIII-13 and FnIII-14 domains. These contain heparin-binding regions [33] that are biologically important for different processes, such as cell adhesion, proliferation and migration. This region also binds growth factors [17] and causes a compaction of the fibronectin dimer by binding to the FnIII(2-4) domains [34]. Individual fragments of the heparin-binding domain were investigated using a fully atomistic molecular dynamics simulation on a hydrophobic self-assembled monolayer surface to probe the protein–surface interaction and identify structural features that drive adsorption. As well as being previously unstudied using simulation, an investigation of these three structurally similar proteins will give insight into how small changes in protein structure can control their adsorption onto material surfaces. Additionally the adsorption free energy was estimated using MM-PBSA (molecular mechanics–Poisson–Boltzmann surface area) calculations [35] to quantitively compare the adsorption of the different fragments.

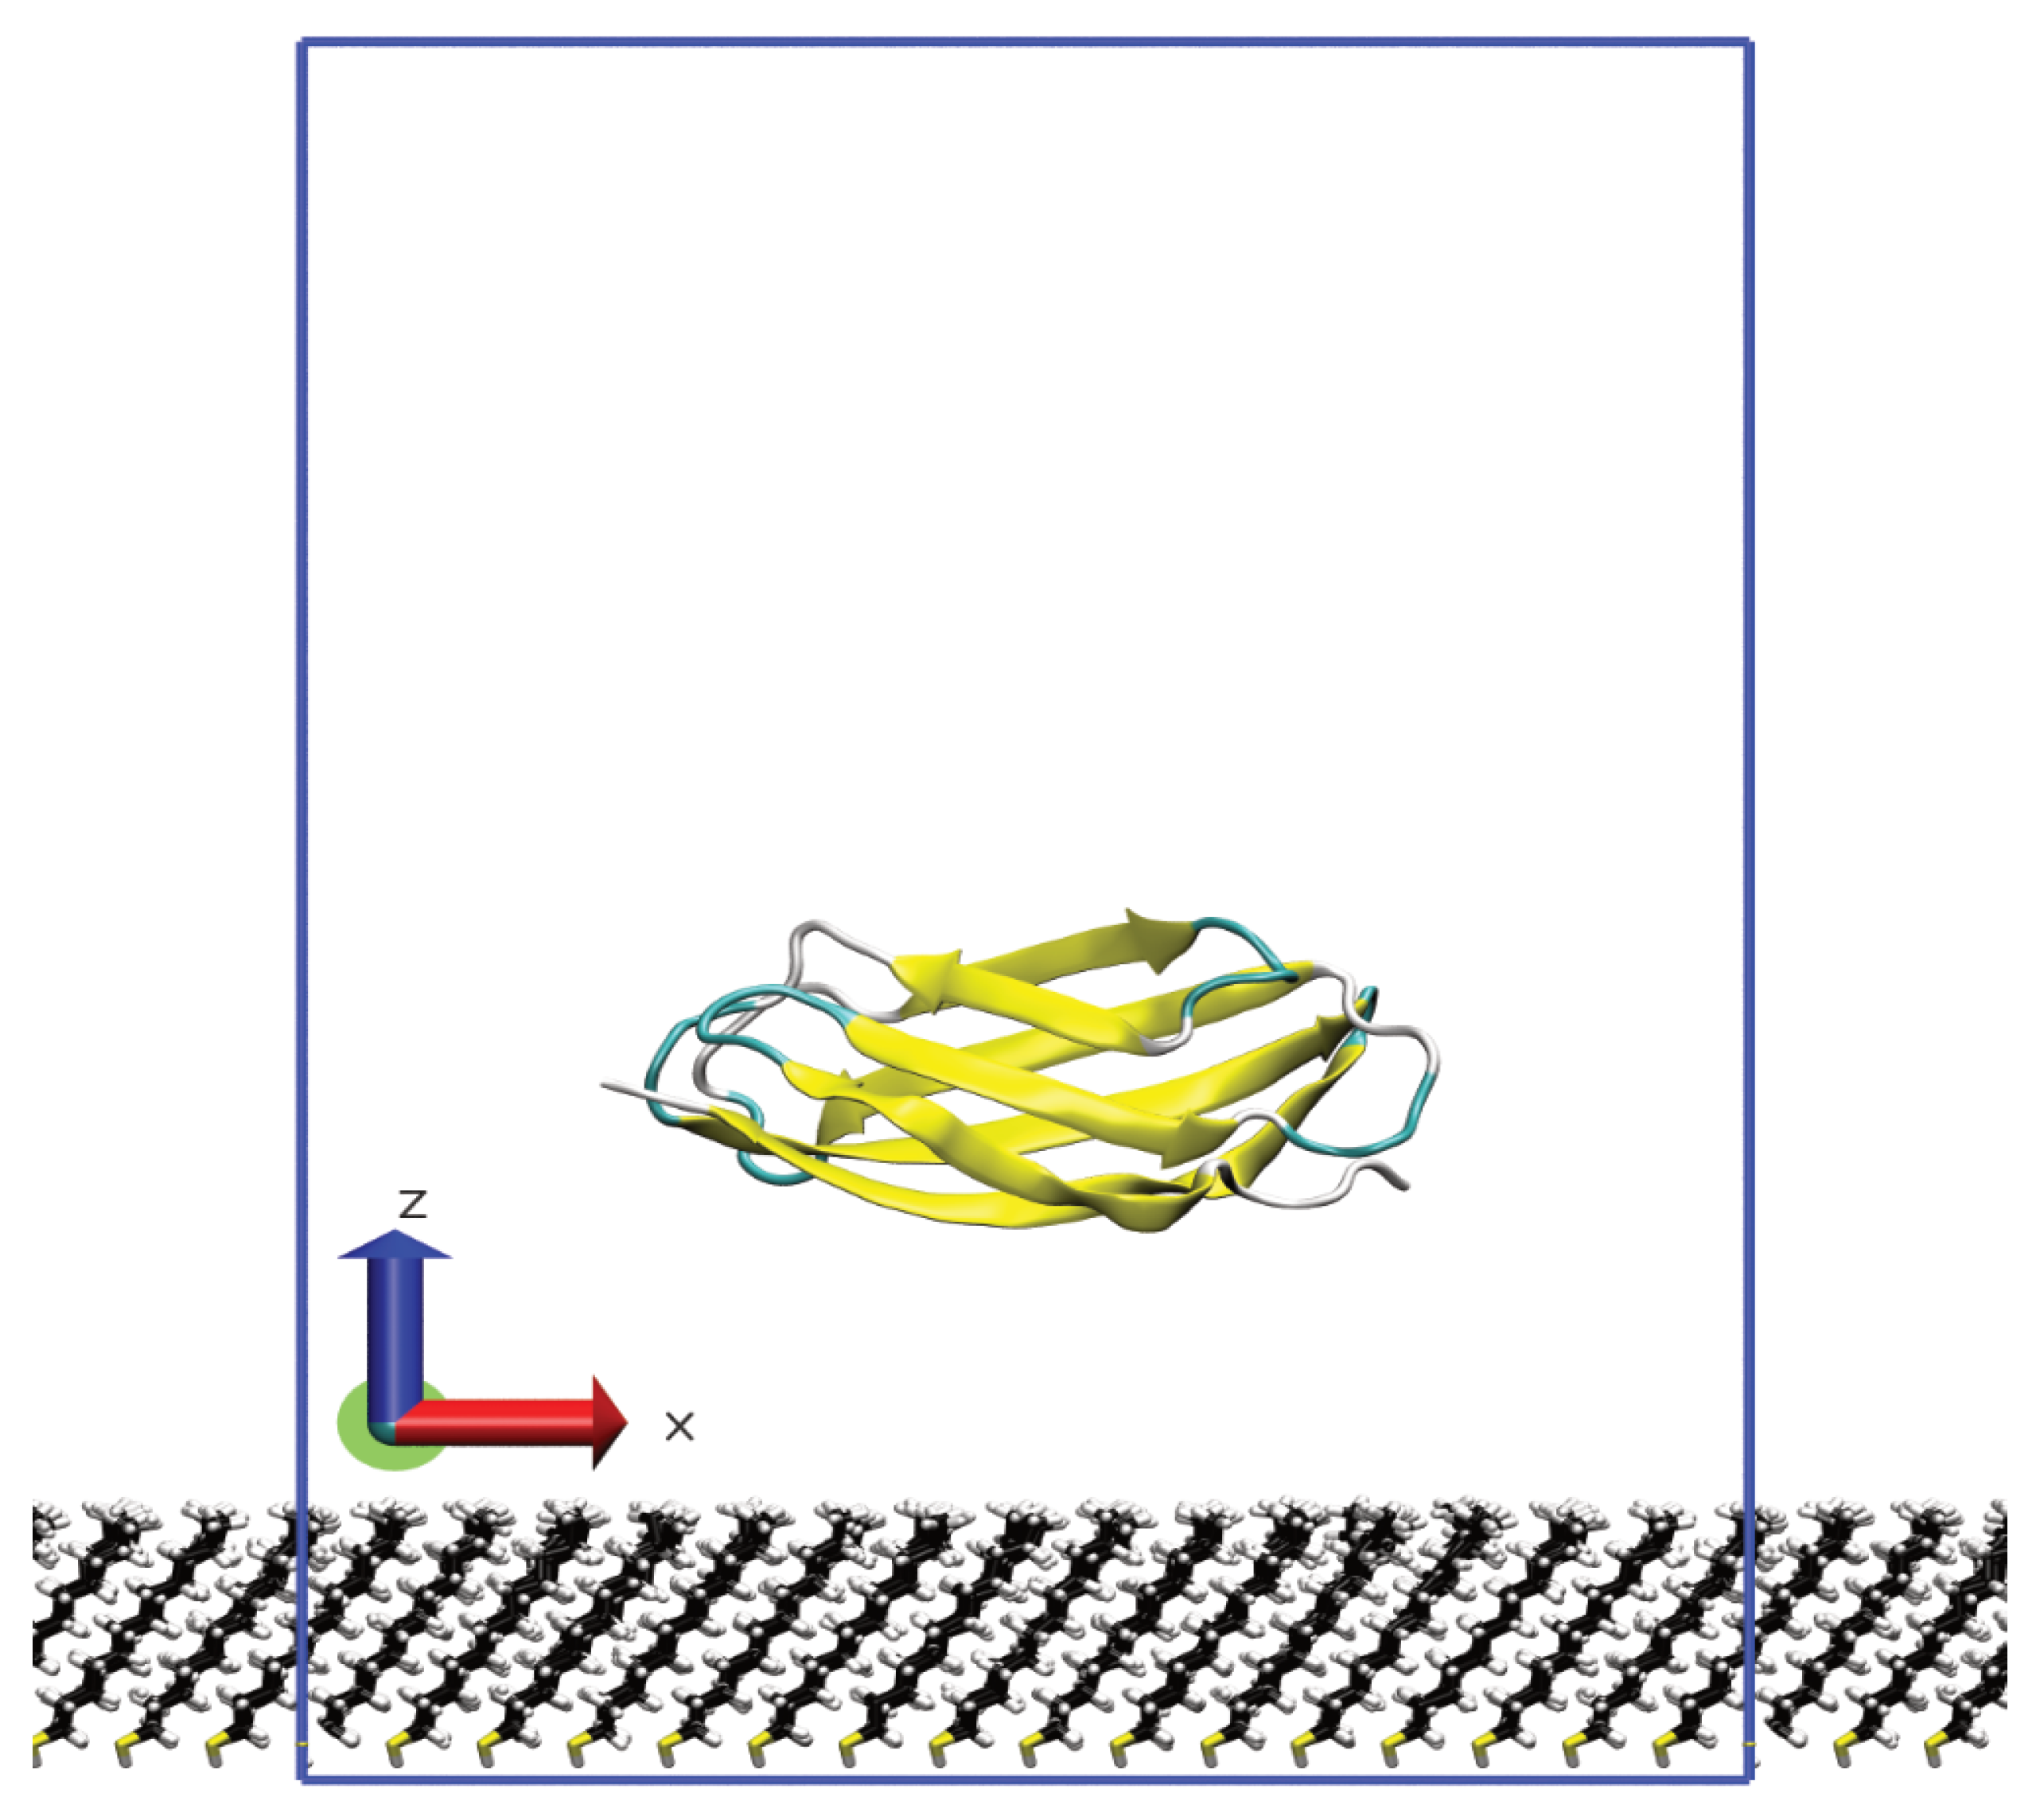
2. Model and Methodology

The simulated systems contain a single protein fragment, consisting of either the 12th, 13th or 14th type-III domains of fibronectin. Initial structures of these were taken from the X-ray structure of the 12–14th type-III domains (RCSB entry 3R8Q), with the individual domains corresponding to residues 1–92 (FnIII-12), 93–184 (FnIII-13) and 182–271 (FnIII-14). To construct a model hydrophobic surface, a regular lattice of C11H22SH alkylthiol molecules was formed. These were arranged in the 3 × 3 R30° geometry [36]. The surface contained 224 molecules, placed in a 16 × 14 lattice in the x y plane. To mimic the strong binding of the ligands to an underlying surface, the sulphur and terminal hydrogen atoms were held fixed. The simulation box size was 69.28 Å × 70 Å × 100 Å.
The protein was initially placed approximately 20 Å from the surface, with its long axis oriented along the x-axis. Four different simulations with different starting orientations were performed for each domain; to generate these, the protein was rotated by 0, 90, 180 and 270 degrees around its long axis (illustrated in Figure 1). Lysine and arginine residues and the N-terminus were protonated and aspartic acid and glutamic acid residues and the C-terminus were deprotonated, as appropriate for pH = 7. Water and any counter-ions needed to neutralise the protein were also added.
The proteins and surface ligands were modelled using the Charmm36m [37,38,39] and Charmm general force fields [40], respectively. Water was modelled using the Charmm-TIP3P model [41]. Van der Waals (VDW) interactions were evaluated with a cut off of 12 Å, with corrections to the energy and pressure applied. Electrostatic interactions were evaluated using a particle mesh Ewald sum [42] with a real space cut off of 12 Å and a reciprocal space grid of 48 × 48 × 280. All simulations were performed using the Gromacs molecular dynamics package (version 2018.4) [43,44,45]. The systems were energy-minimised using the steepest descents algorithm, followed by short (10 ps) NVT simulations. Production simulations were performed at 298 K, with temperature controlled using a velocity-rescaling algorithm [46] with a relaxation time of 0.1 ps. For each system, simulations of 200 ns were performed (with a timestep of 2 fs), with coordinates saved every 10 ps. Bonds involving hydrogen atoms were constrained using the LINCS [47] algorithm and the geometry of water molecules was held rigid using the SETTLE [48] algorithm. The system was periodic in the x and y directions. To contain the system in the z-direction walls, interacting through the integrated 9-3 LJ potential were used. Analysis of the simulations was performed using standard Gromacs utilities and in-house Python scripts using the MDAnalysis library [49]. Simulation snapshots were generated using VMD (visual molecular dynamics) [50].
To estimate the adsorption free energy ( Δ G a d s ), MM-PBSA calculations were used. Δ G a d s was calculated according to
Δ G a d s = G p r o t e i n s u r f G p r o t e i n G s u r f
where G p r o t e i n s u r f is the free energy of the protein–surface system and G p r o t e i n and G s u r f are the free energies of the protein and surface on their own. The calculations were performed using the single trajectory approach, where the free energies were calculated from a single simulation of the system. The free energy for each system was calculated from the sum of the molecular mechanics ( E M M ) and solvation ( G s o l v ) energies
G = E M M + G s o l v = E M M + G P B + G S A .
where the solvation energy consists of polar solvation ( G P B ) and non-polar solvation ( G S A ) contributions. Note that, in common with previous work, the conformation entropy was neglected due to the inaccuracy associated with its calculation and the limited influence that this has on the calculated values [51]. The molecular mechanics energy was given by
E M M = E i n t + E VDW + E e l e c
where the terms are the internal (bonded), VDW and electrostatic energies. Note that, for the single-trajectory method, the internal energy of the protein–surface complex is the same as the internal energies of the protein and surface added together. The non-polar solvation energy was calculated according to [52]
G S A = γ S A S A
where S A S A is the solvent-accessible surface area and γ = 0.005 kcal mol−1 Å−2 is the surface tension. A probe radius of 1.4 Å was used in the calculation of S A S A . The polar solvation energy was calculated using a Poisson–Boltzmann solver, with internal and external dielectric constants of 1 and 80. The MM-PBSA calculations were performed using the MMPBSA.py script [53], part of the Amber package (version 18).

3. Results

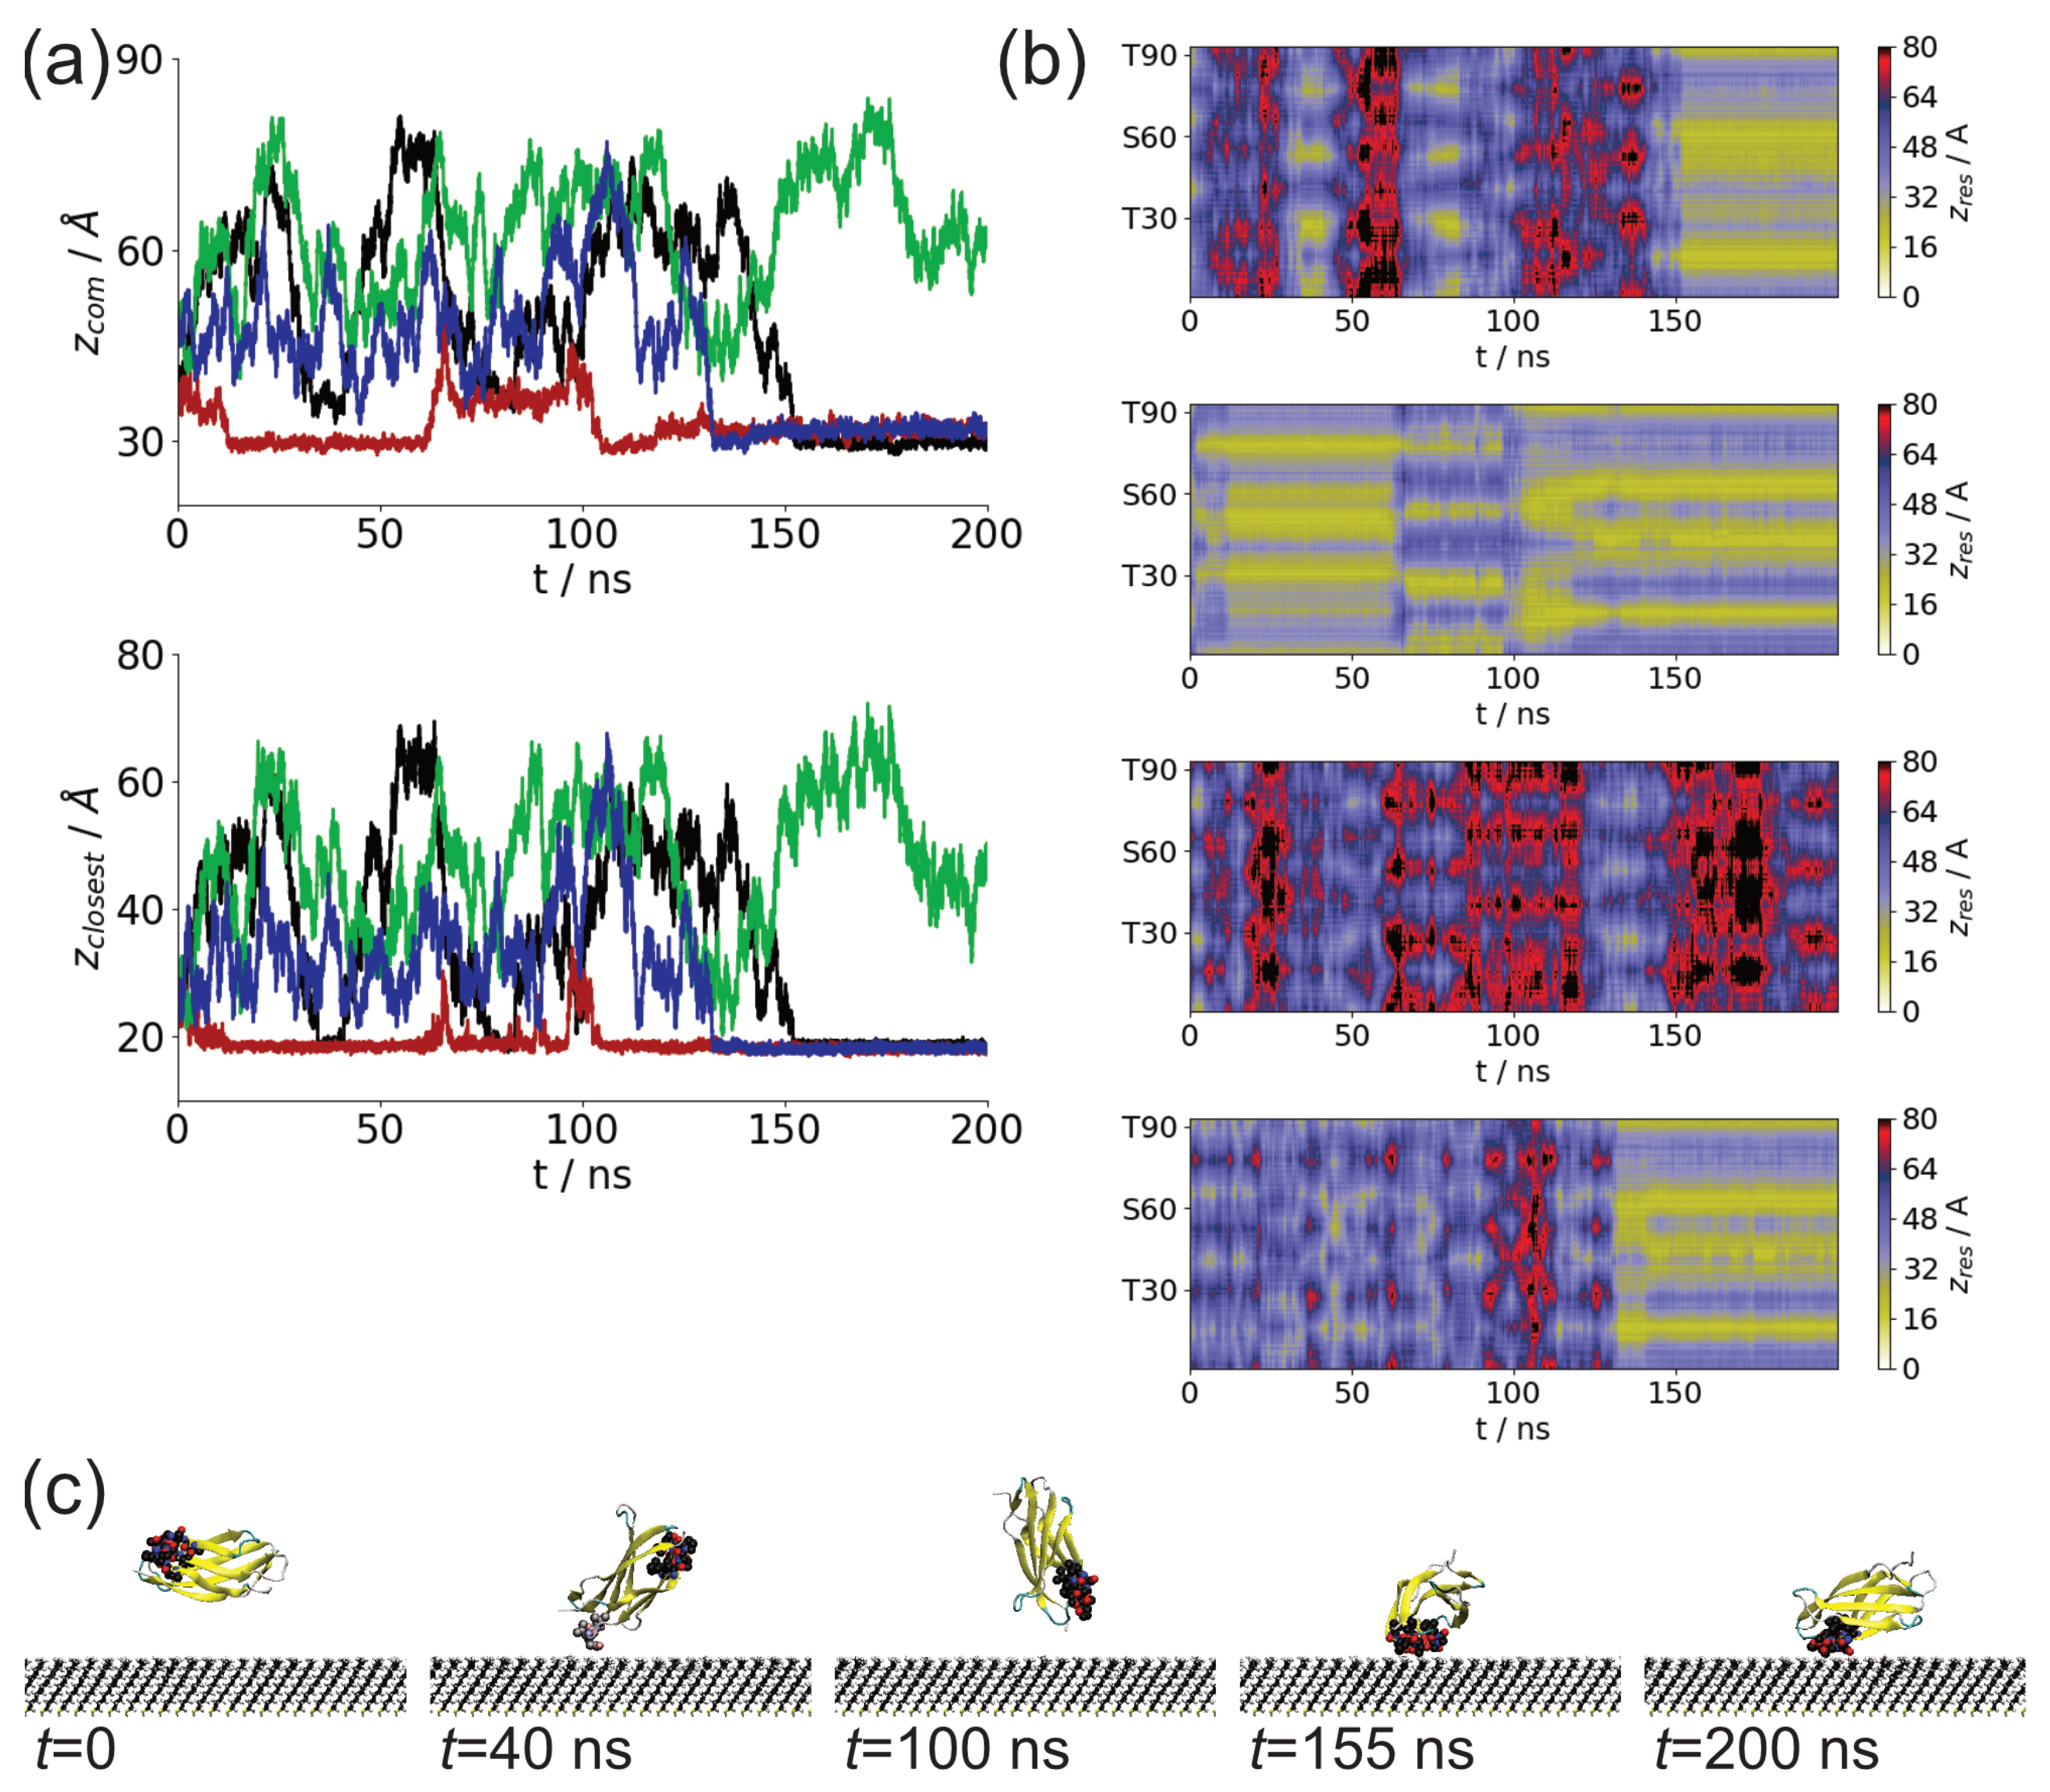
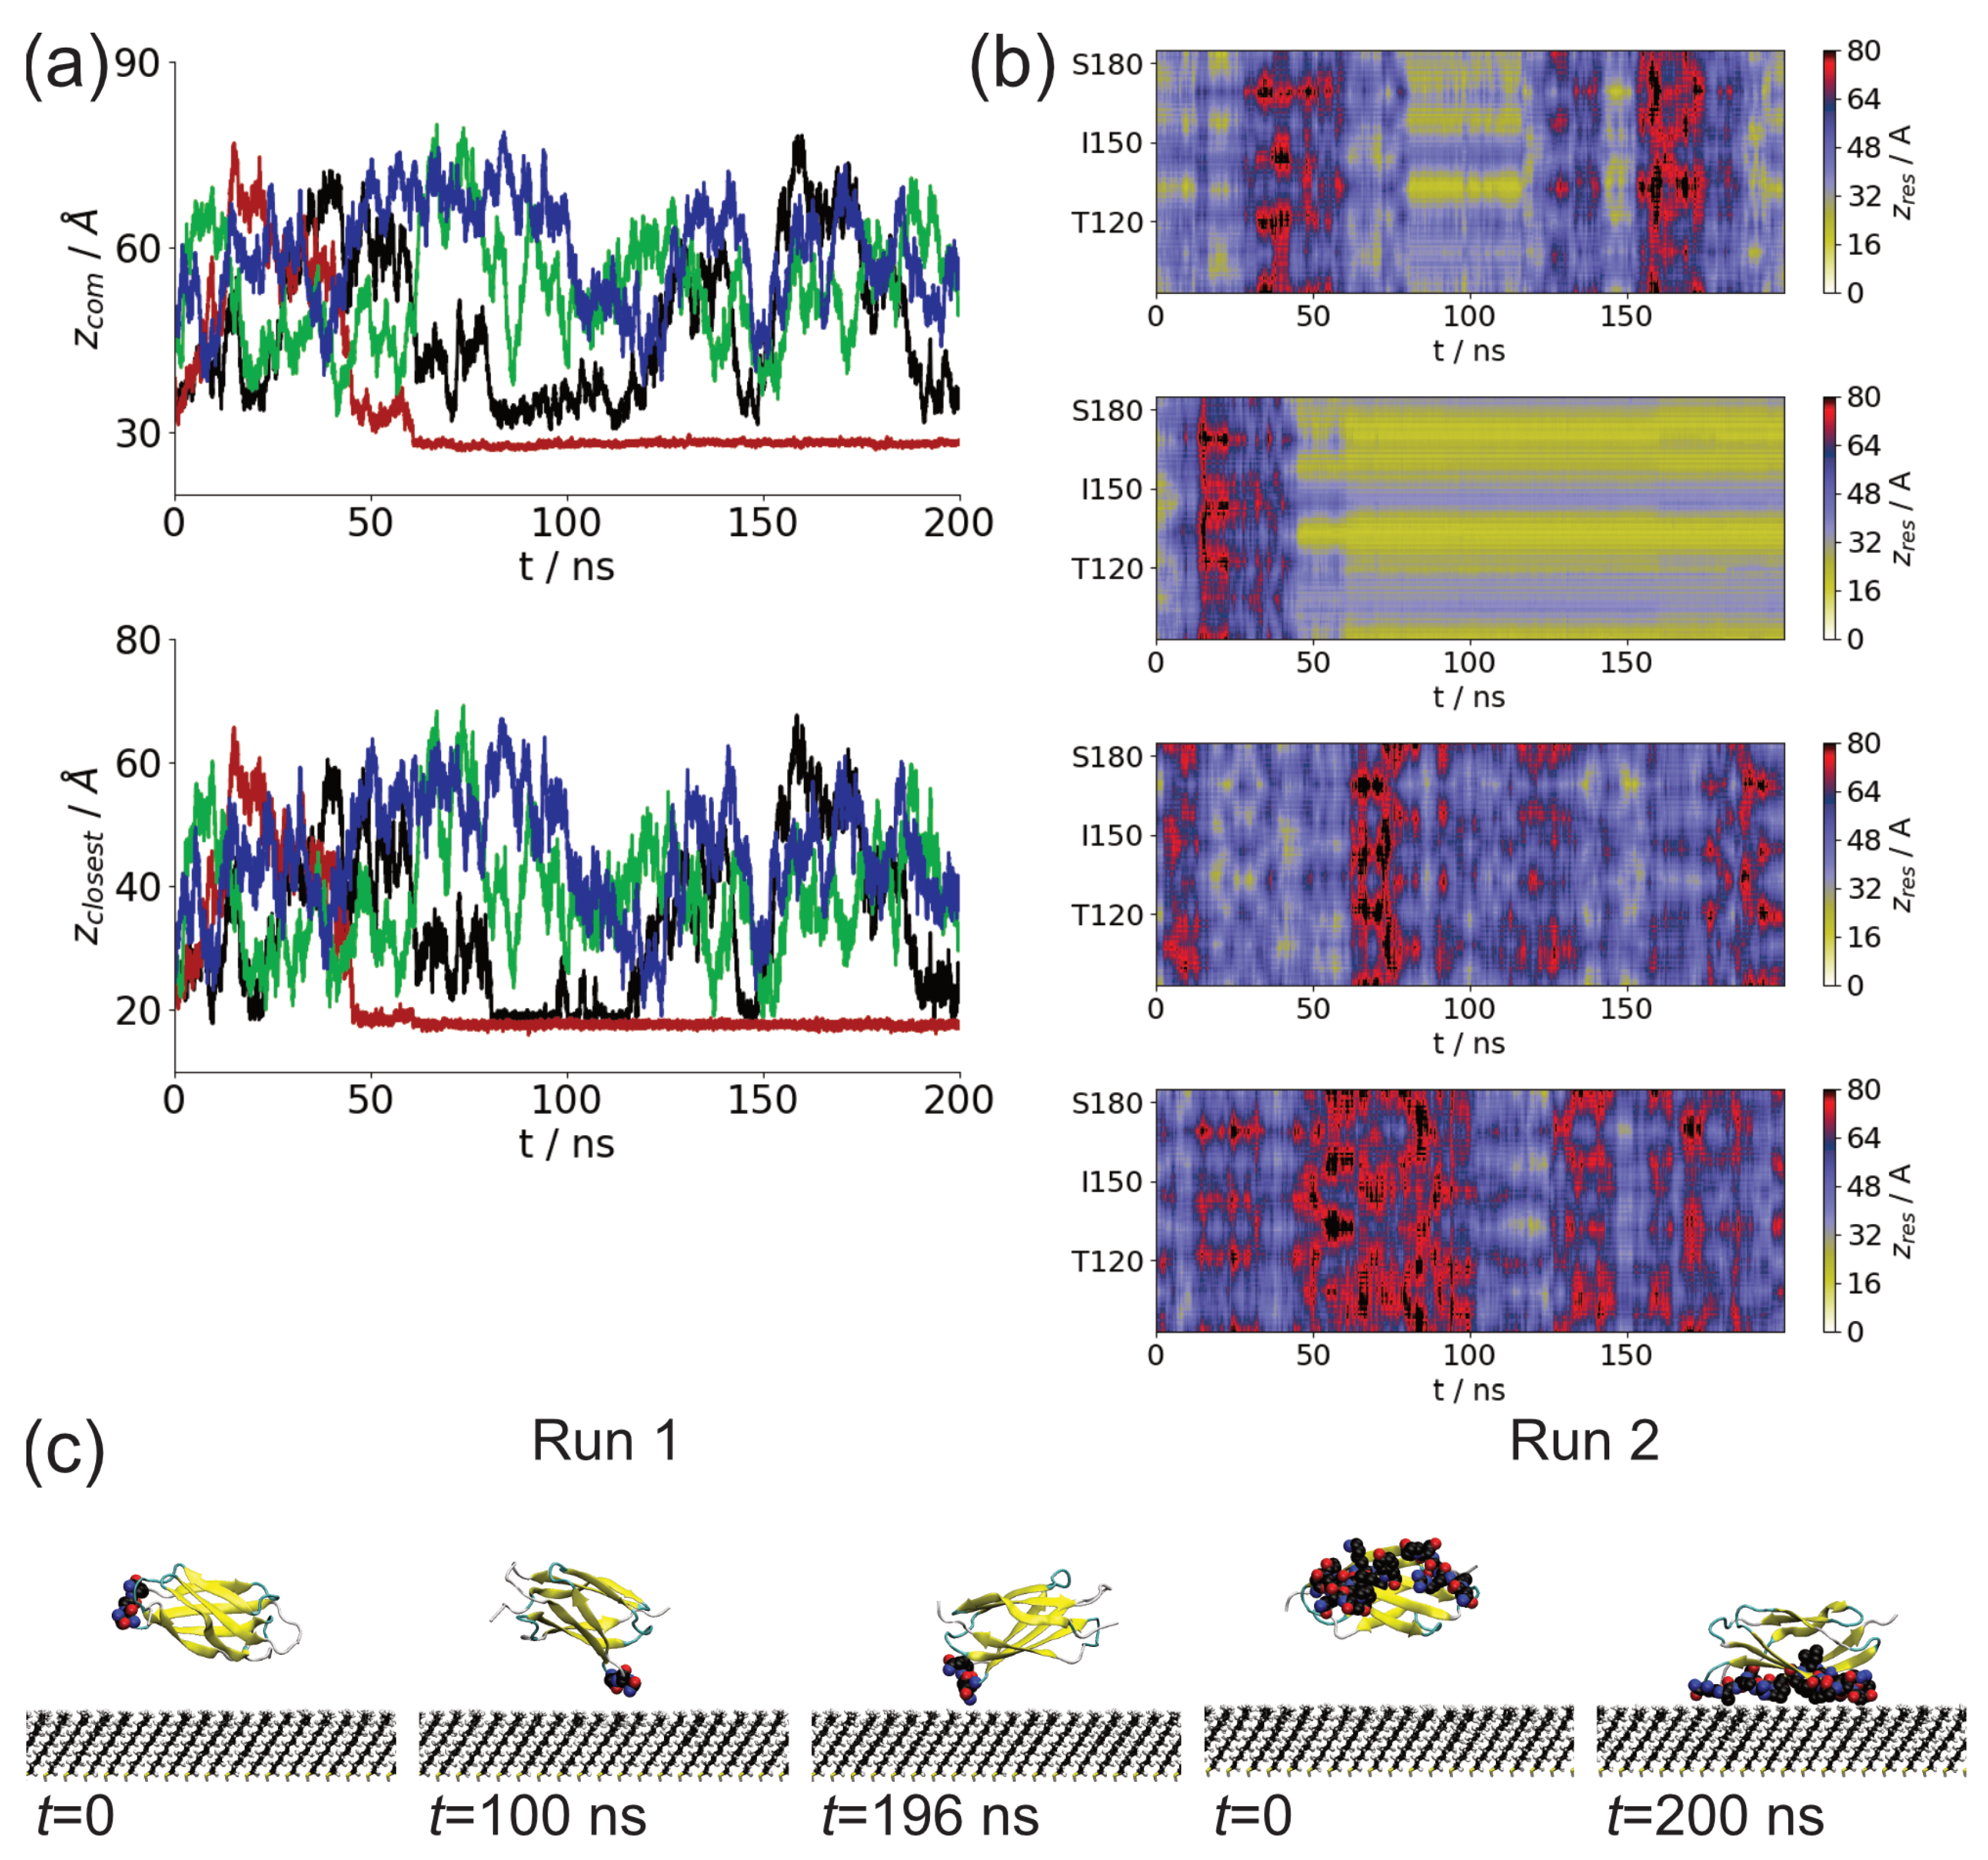
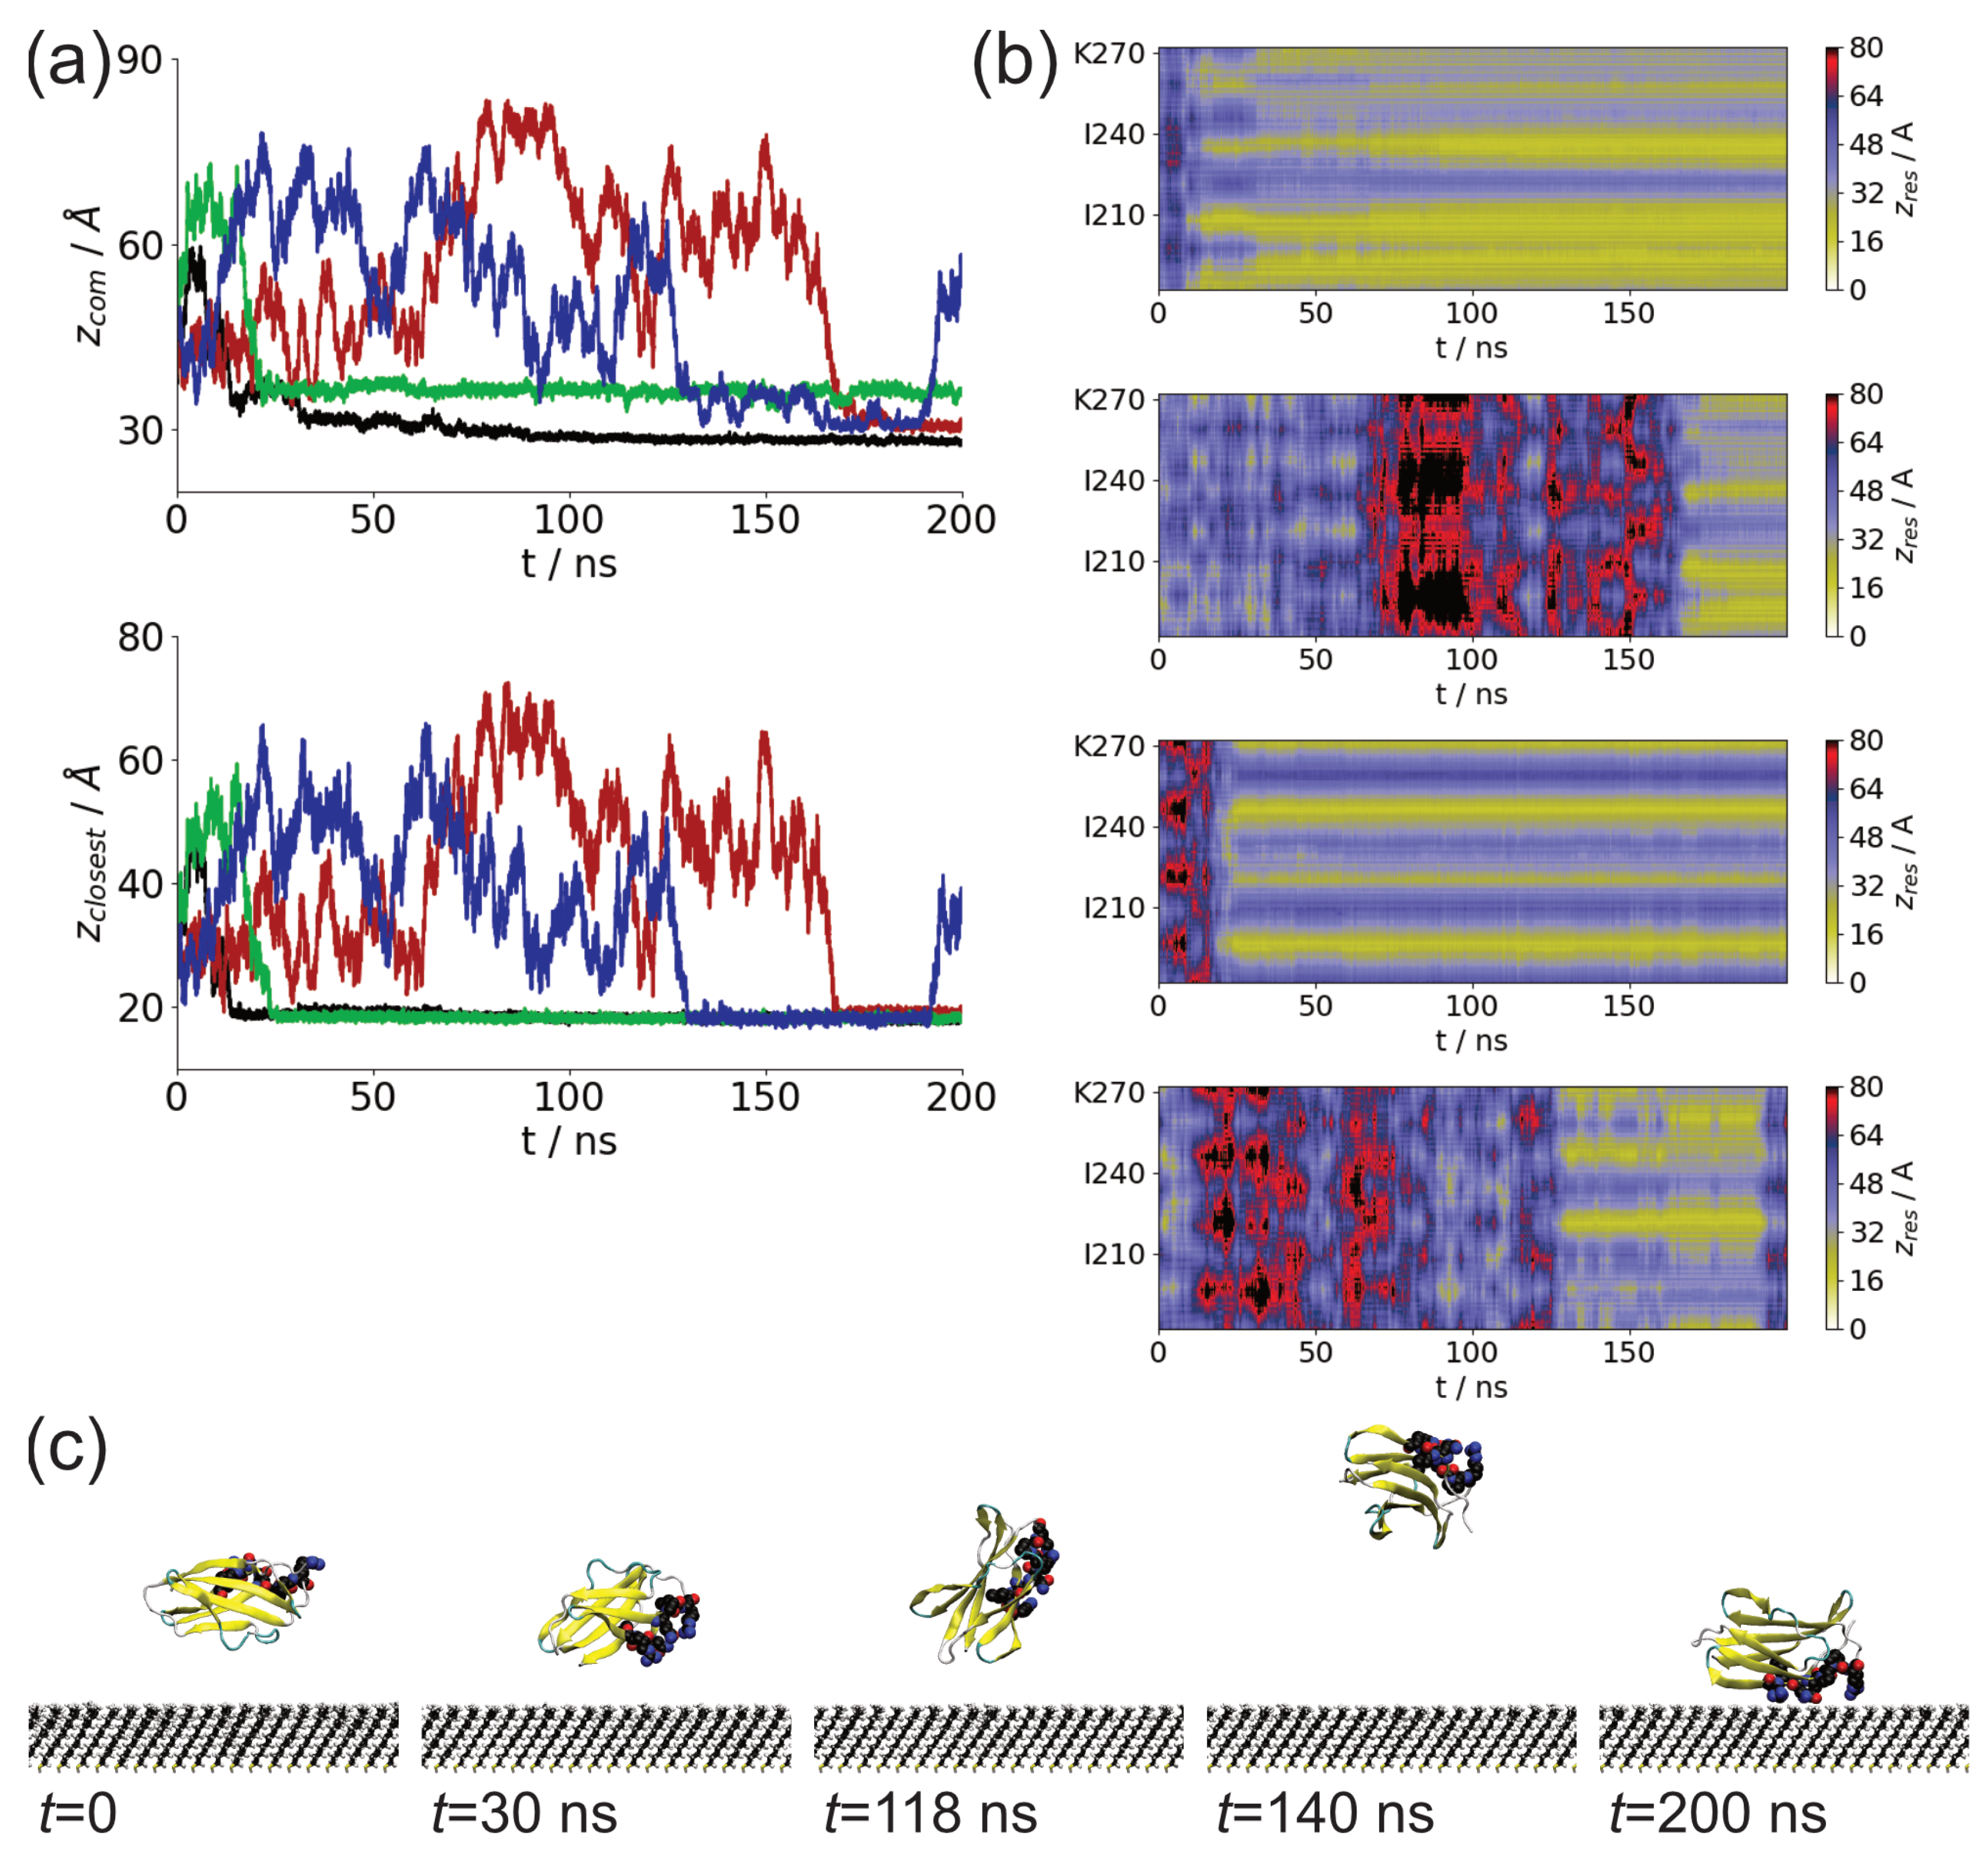
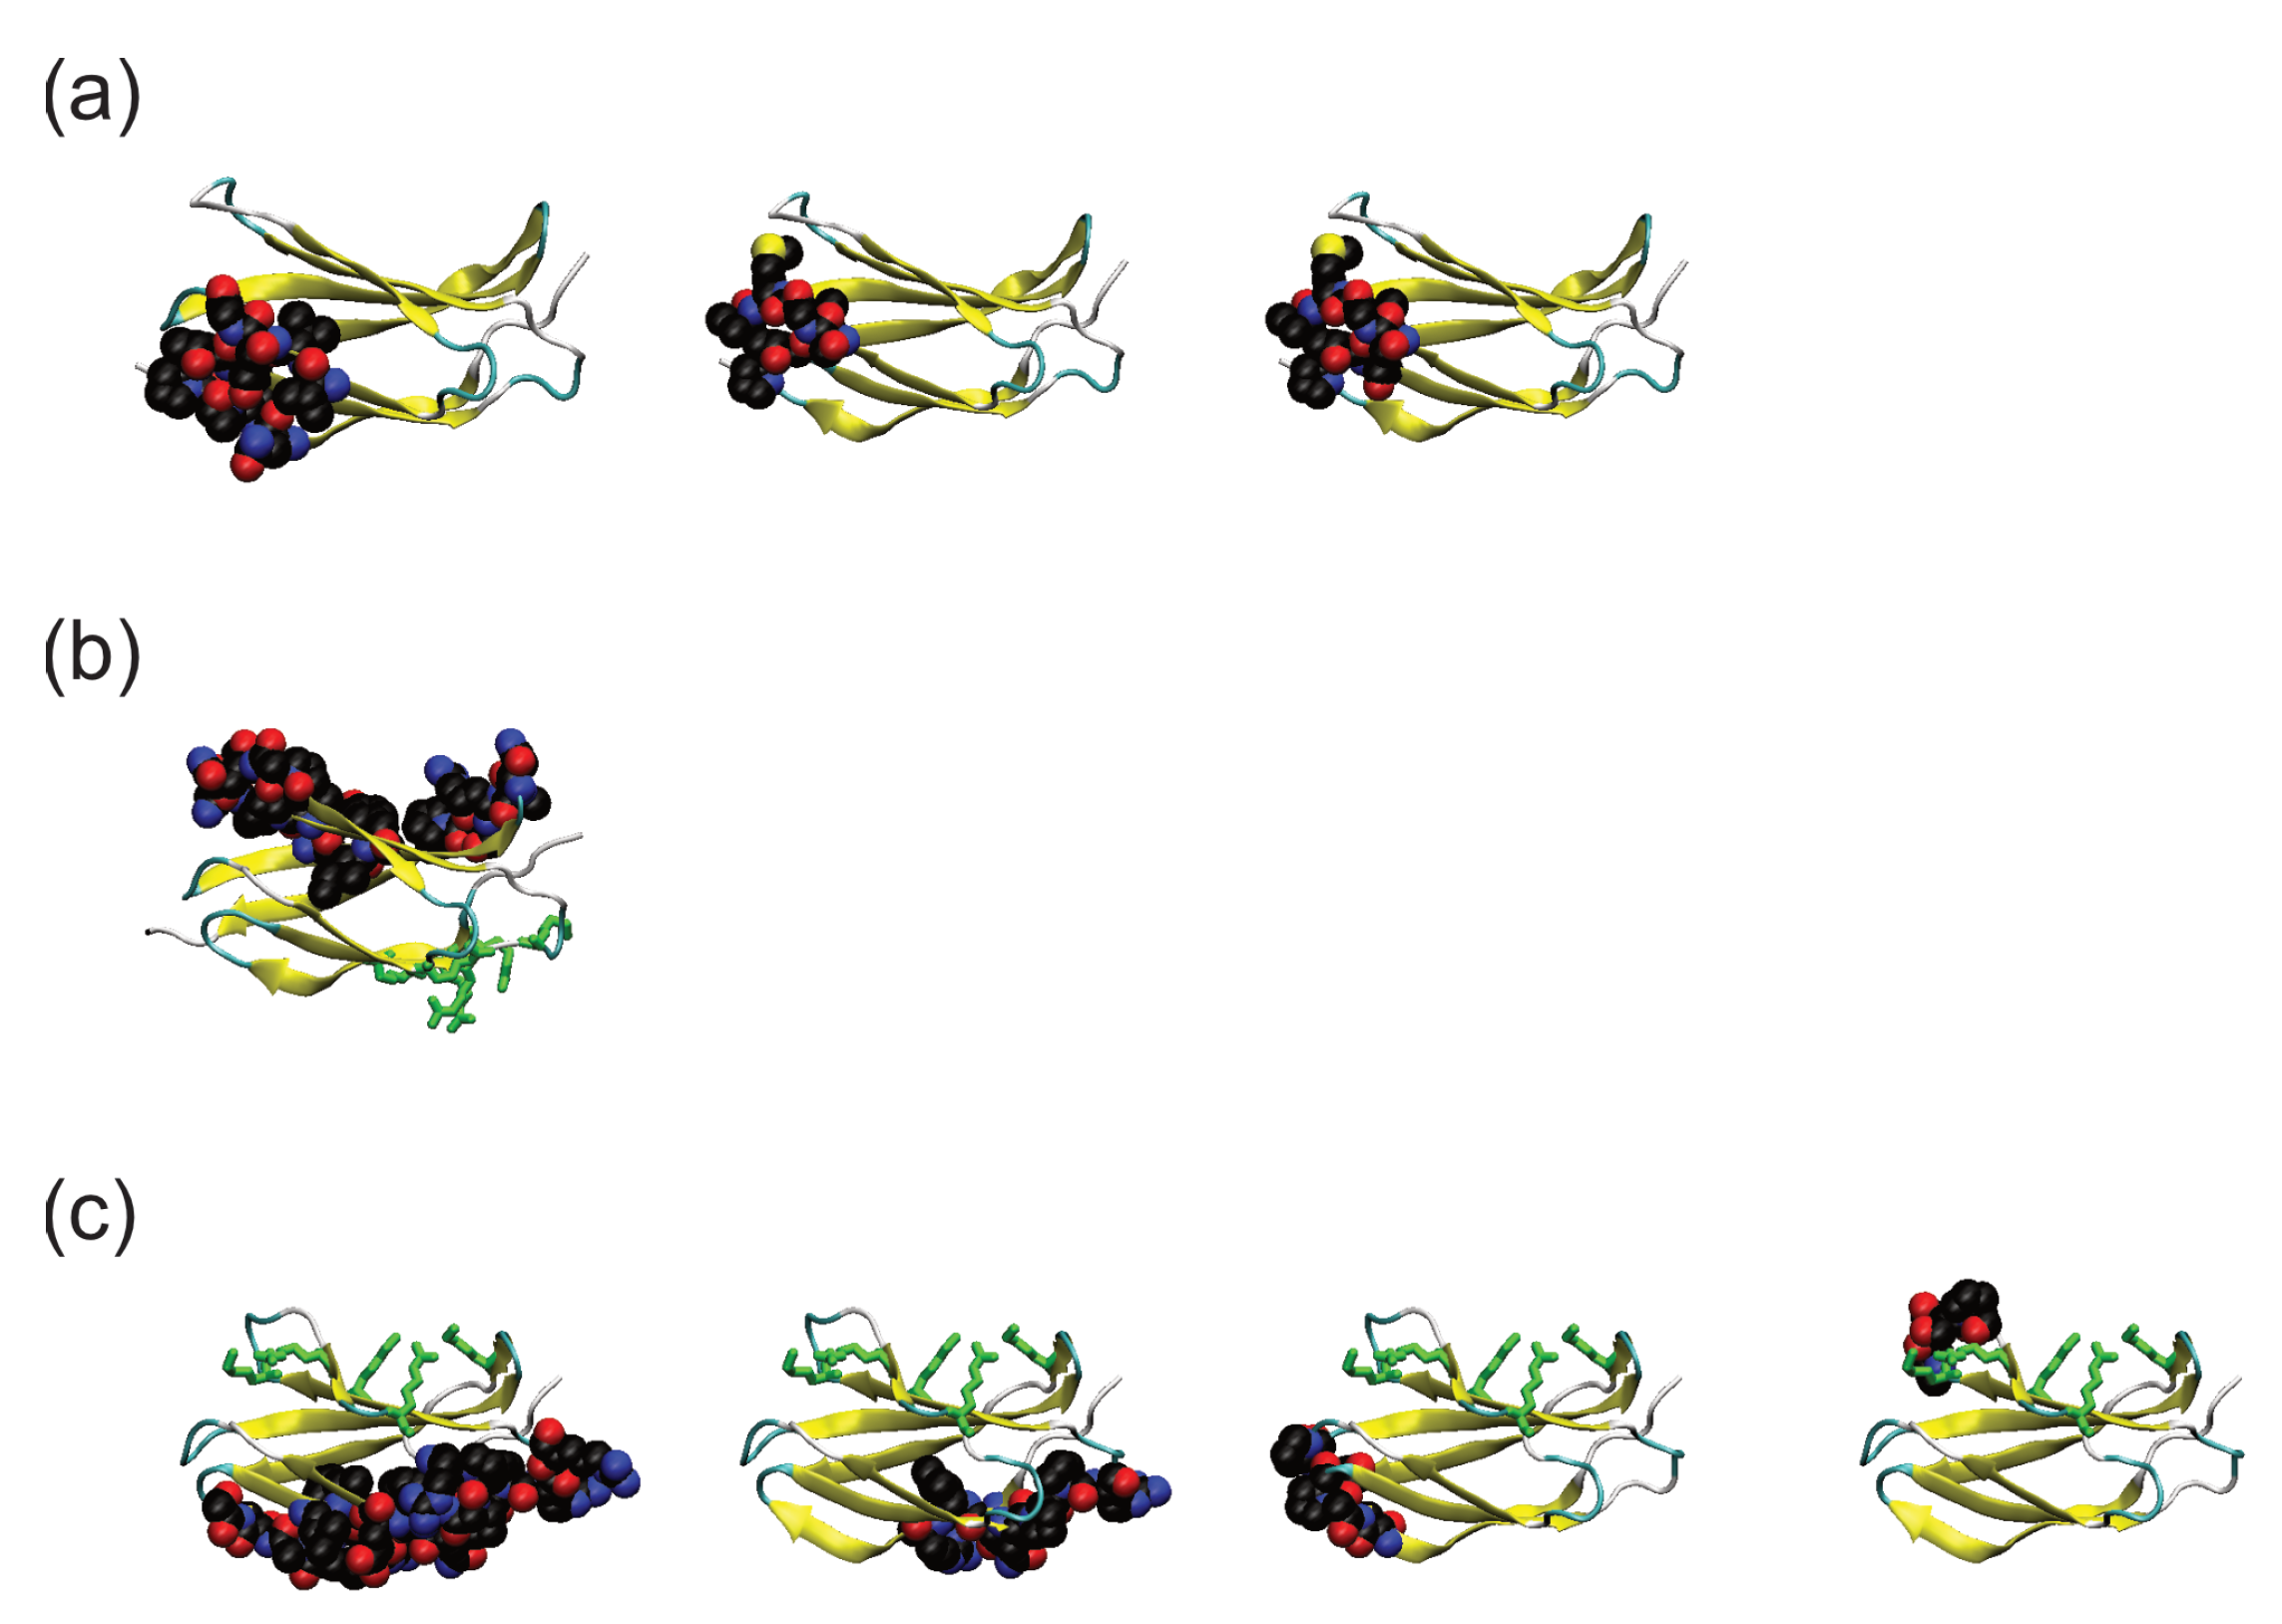
3.1. Adsorption of Fibronectin Domains onto Hydrophobic Surface

With the exception of the third simulation run, FnIII-12 adsorbs onto the surface within the simulation time scale (Figure 2a), suggesting strong adsorption. In some of the simulations (runs one and two), periods of transient adsorption are seen before adsorption at the end of the simulation. By contrast, for run four, only one adsorption event is seen. Differences between the behaviour seen in the centre-of-mass and closest residue separations show that these different adsorption events can involve different protein orientations on the surface. While the closest residue z position is typically ∼21 Å when the protein is on the surface, consistent with the position of the terminal methyl-groups of the surface ligands, the centre-of-mass z separation shows more variation. In particular, for run two, while the position of the closest residue is largely constant after approximately 3 ns, there is a change in the centre-of-mass positions between approximately 67 and 90 ns, suggesting a change in the adsorbed orientation.
The differences in adsorption for the different simulations can be seen by considering the positions of each residue across the simulations (Figure 2b). While the residues involved in the transient adsorption vary between the different runs, at the end of the simulations, similar sets of residues are in contact with the surface. This suggests that FnIII-12 shows a degree of specificity in its adsorption onto hydrophobic surfaces.
Due to the transient desorptions seen, it is useful to characterise different adsorption events throughout the simulations. These are found from intervals in which the z-coordinate of the closest residue to the surface is less than 21 Å (approximately the VDW diameter of a carbon atom from the edge of the surface); transient adsorption events (less than 1 ns) are ignored, whereas adsorption events separated by less than 1 ns are considered as single events. The residues in contact with the surface during each adsorption event are given in Table 1. For permanent adsorption, residues in two regions of the FnIII-12 fragment (approximately residues 15–16 and 60–61) are involved. These contain a number of hydrophobic residues. They also contain a number of polar threonine residues, which may have favourable interactions with the hydrophobic surface due to the methyl group in its side chain. A largely polar three-residue motif (NVQ) is found in the transient adsorptions.
The behaviour of the protein can be seen in the simulation snapshots (Figure 2c). For run one, the protein initially adsorbs through the NVQ (residues 26–28) region. Notably, this region is on the other end of the protein to the residues involved in permanent adsorption (residues 12–17 and 58–61). It then desorbs and reorients in solution, before adsorbing through the other end of the protein.
Compared to FnIII-12, FnIII-13 is less likely to adsorb onto the surface (Figure 3a), suggesting that the interaction with the surface is weaker for this domain. Two of the simulations (runs three and four) only interact with the surface transiently (for periods of less than 1 ns). Of the other two simulations, one of these (run two) adsorbs within approximately 45 ns and then remains in contact with the surface. The centre-of-mass position suggests a change in protein orientation on the surface at approximately 55 ns. The other run (run one) shows multiple adsorption and desorption events. Aside from some transient desorptions, the protein is adsorbed between 80 and 116 ns, with shorter periods of adsorption between 144 and 148 ns and 195 and 199 ns.
Differences in the adsorption behaviour between the simulations can be seen in the residue z-positions (Figure 3b). For run one, residues in contact with the surface are similar for the adsorption events between 80 and 116 ns, suggesting that the short desorptions are insufficient for the protein to significantly reorient. Adsorption to the surface involves a three-residue NGQ sequence (Table 1); this is similar to the NVQ region that is involved in the adsorption of the FnIII-12 fragment, suggesting the involvement of polar asparagine and glutamine residues in adsorption. For run two, the change in adsorbed orientation can be seen, with the residues adsorbed changing at approximately 55 ns. Compared to run one, more residues are involved in adsorption (Table 1), which, as may be expected, includes a number of hydrophobic residues.
The differences in the numbers of residues involved in adsorption lead to large changes in the orientation of the protein on the surface. As only a few residues are involved in adsorption for run 1 (Figure 3c), the protein lies at an angle to the surface when adsorbed. The small number of residues in contact with the surface leads to the weak, transient adsorption seen in this simulation. In run 2, the protein reorients prior to adsorption, with the adsorbed residues initially orientated away from the surface. After adsorption, it lies flat against the surface, allowing for a larger number of residues to be in contact with the surface.
For all the simulations, the FnIII-14 fragment adsorbs onto the surface (Figure 4a), suggesting it has the most favourable interaction with the surface. Unlike the other fragments, multiple adsorption events are not seen for the simulations; rather, they show relatively long periods of adsorption. Apart from run four, the protein remains adsorbed on the surface at the end of the simulation; for run four, it desorbs near the end of the simulation run. Notably large differences are seen in the centre-of-mass positions of the protein between the simulation runs, suggesting that the FnIII-14 fragment can show a number of different orientations when adsorbed. This is particularly noticeable for run three, where the centre-of-mass position when adsorbed is ∼35 Å, compared to ∼30 Å for the other simulations.
In common with the other domains, the residue z positions illustrate the different adsorbed orientations (Figure 4b). Generally, after adsorption, only small changes in the residue-z positions are seen for all the simulations, suggesting that, once adsorbed, the protein orientation is essentially fixed. Compared to the FnIII-12 domain, the number and identity of residues mediating adsorption differ significantly between the simulation runs (Table 1). There is some similarity between the residues involved in adsorption between runs one and two, with the residue 204 to 207 (QPPR) segment involved in both. This contains two relatively hydrophobic proline residues. They both involve two closely placed regions (residues 190 to 195 in run one and 188 to 190 in run two), which both contain hydrophobic residues. However, the first run involves many more residues in contact with the surface than the second. The third run has some overlap with the first run, with residues 194 and 195 in contact with the surface, but other regions of the protein are involved. Again, a number of threonine residues are found in close contact with the surface. For the fourth simulation, a completely different set of residues are found in contact with the surface.
As for FnIII-12, the time taken to adsorb differs between the simulations, with runs one and three adsorbing early in the simulation. For run two, there are a number of initial approaches to the surface before it permanently adsorbs, undergoing a number of reorientations (Figure 4c). Unlike FnIII-12, no contacts with the surface are made during this time.
The differences in between the simulations suggest that whereas FnIII-12 adsorbs in a relatively specific manner, FnIII-14 adsorbs less specifically. This can be seen by considering the average residue-z positions for the adsorbed states (Figure 5). For FnIII-12, these are similar for the three simulations, with runs two and four being almost identical. More variation is seen for FnIII-14. Runs one and two are similar to each other but run three and four are significantly different. Most noticeably, the relatively small number of residues involved in adsorption for run four is seen.

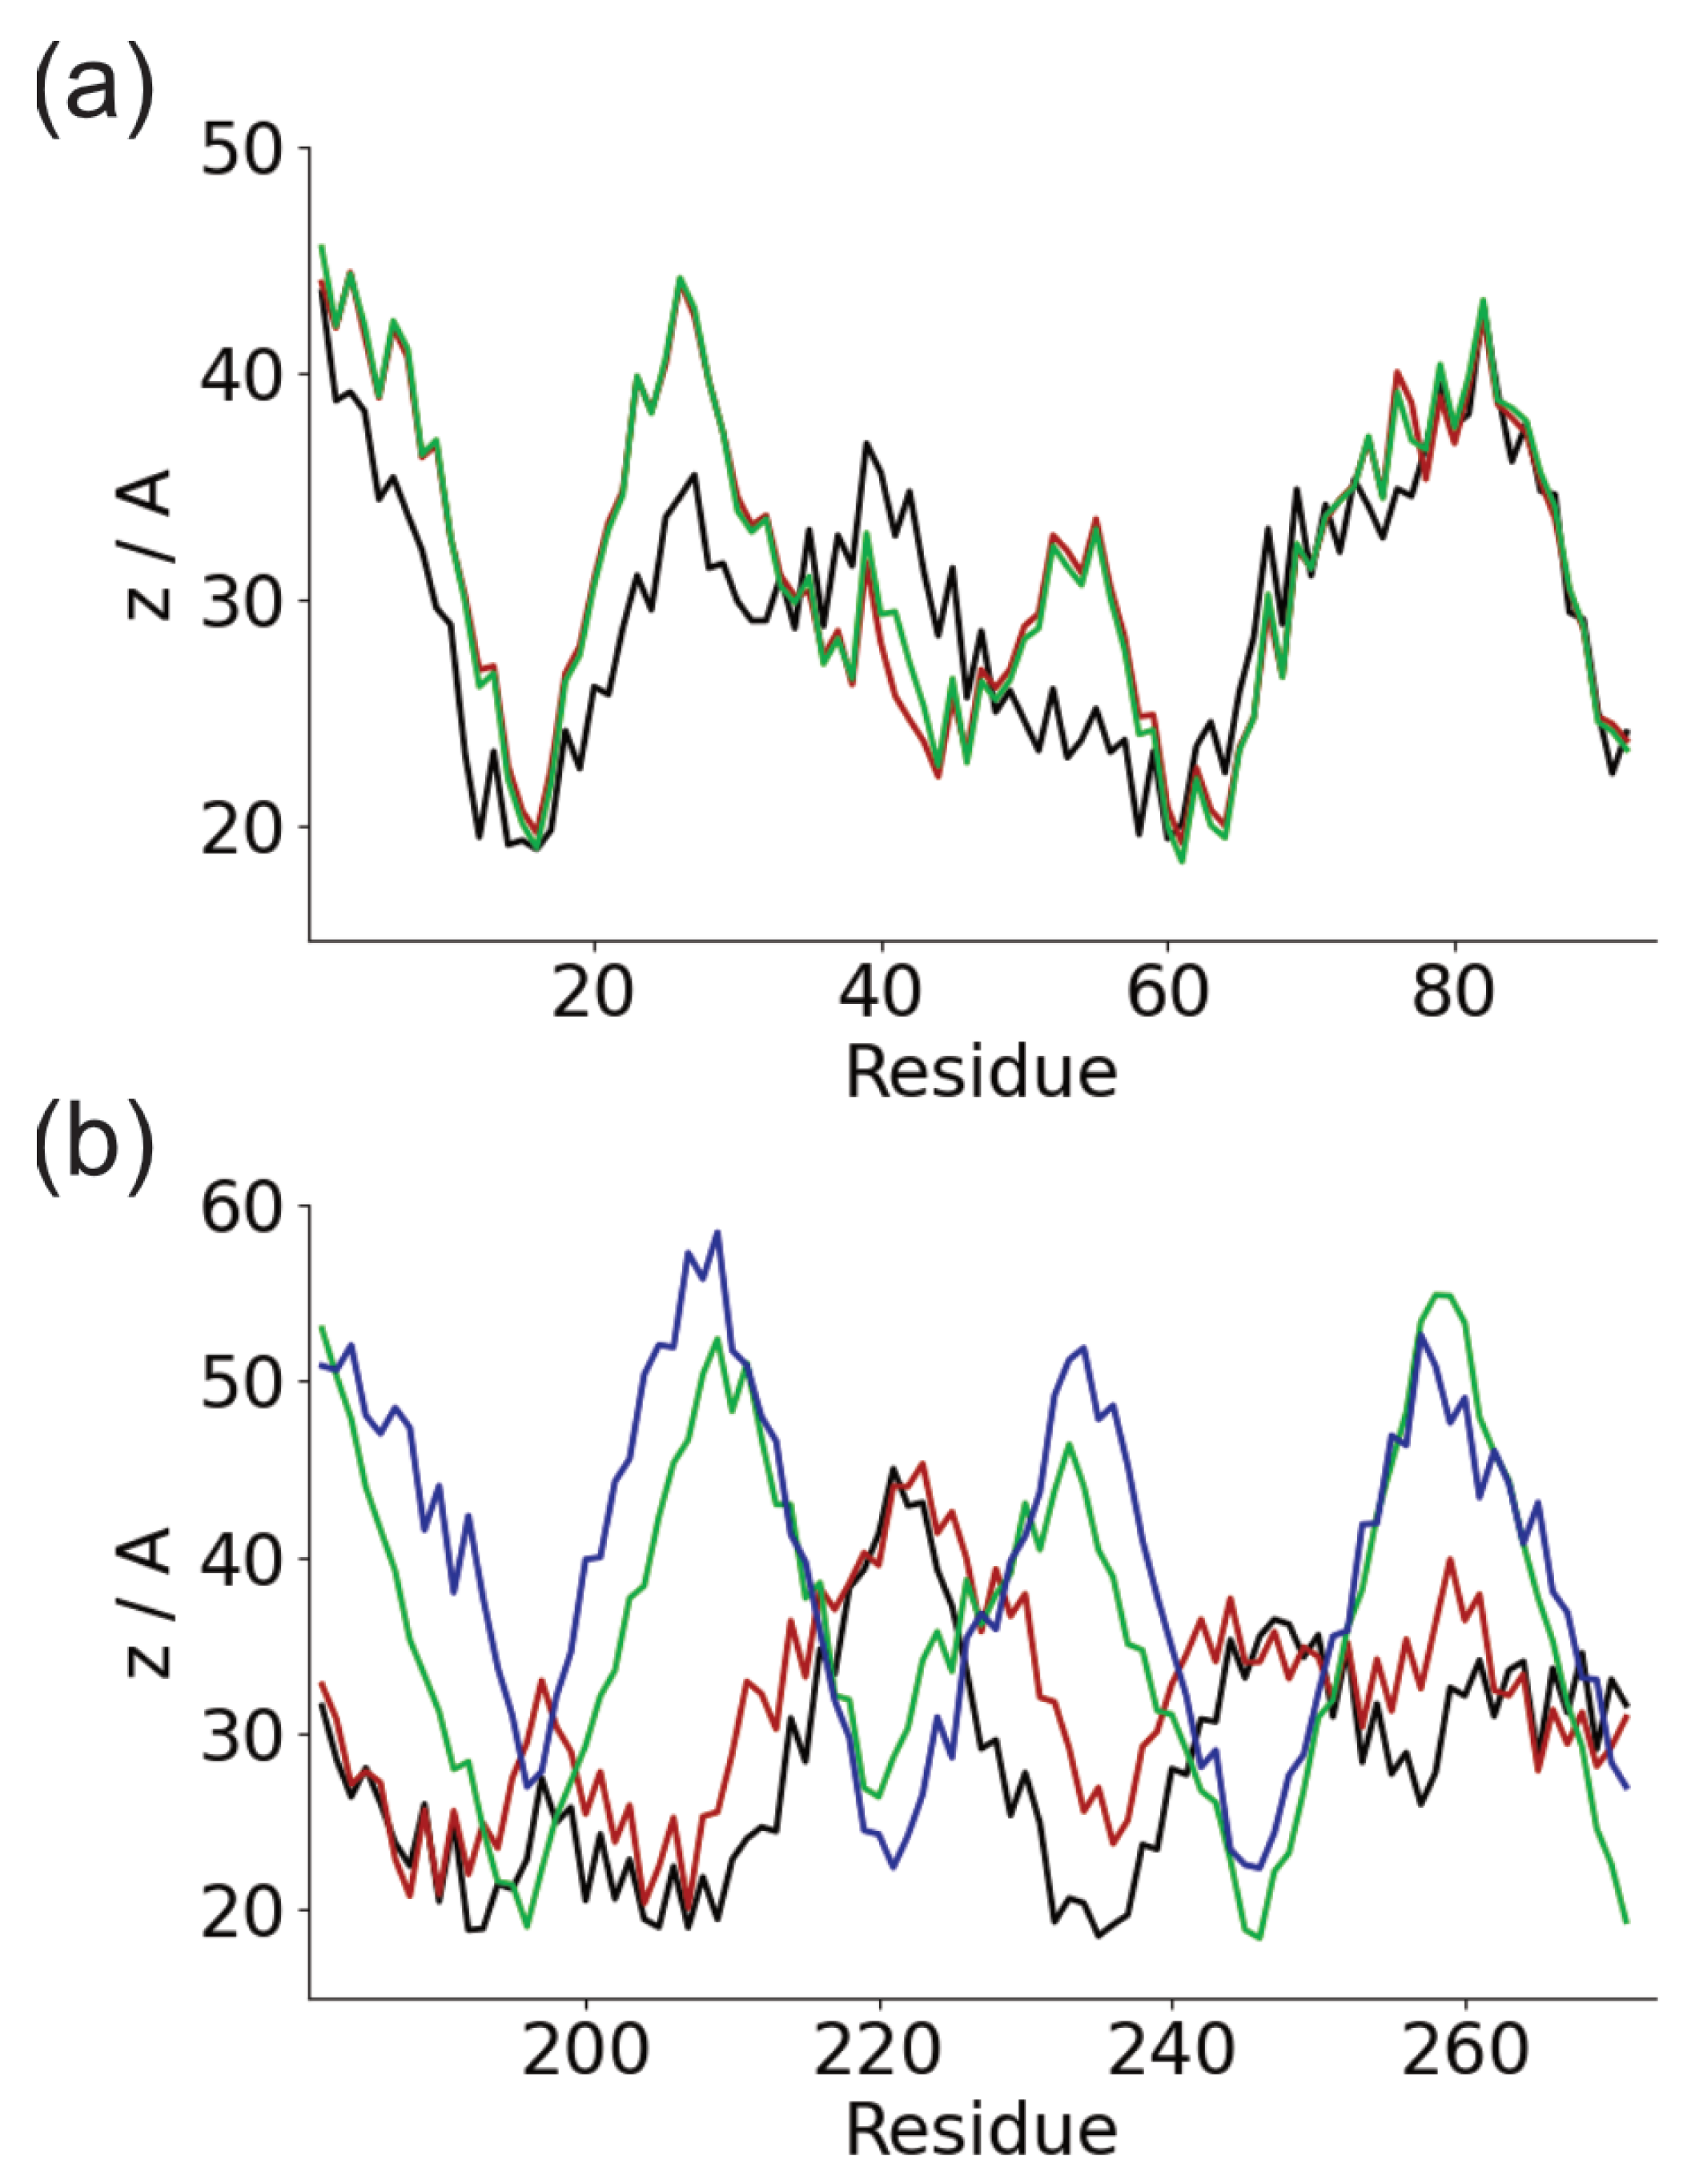
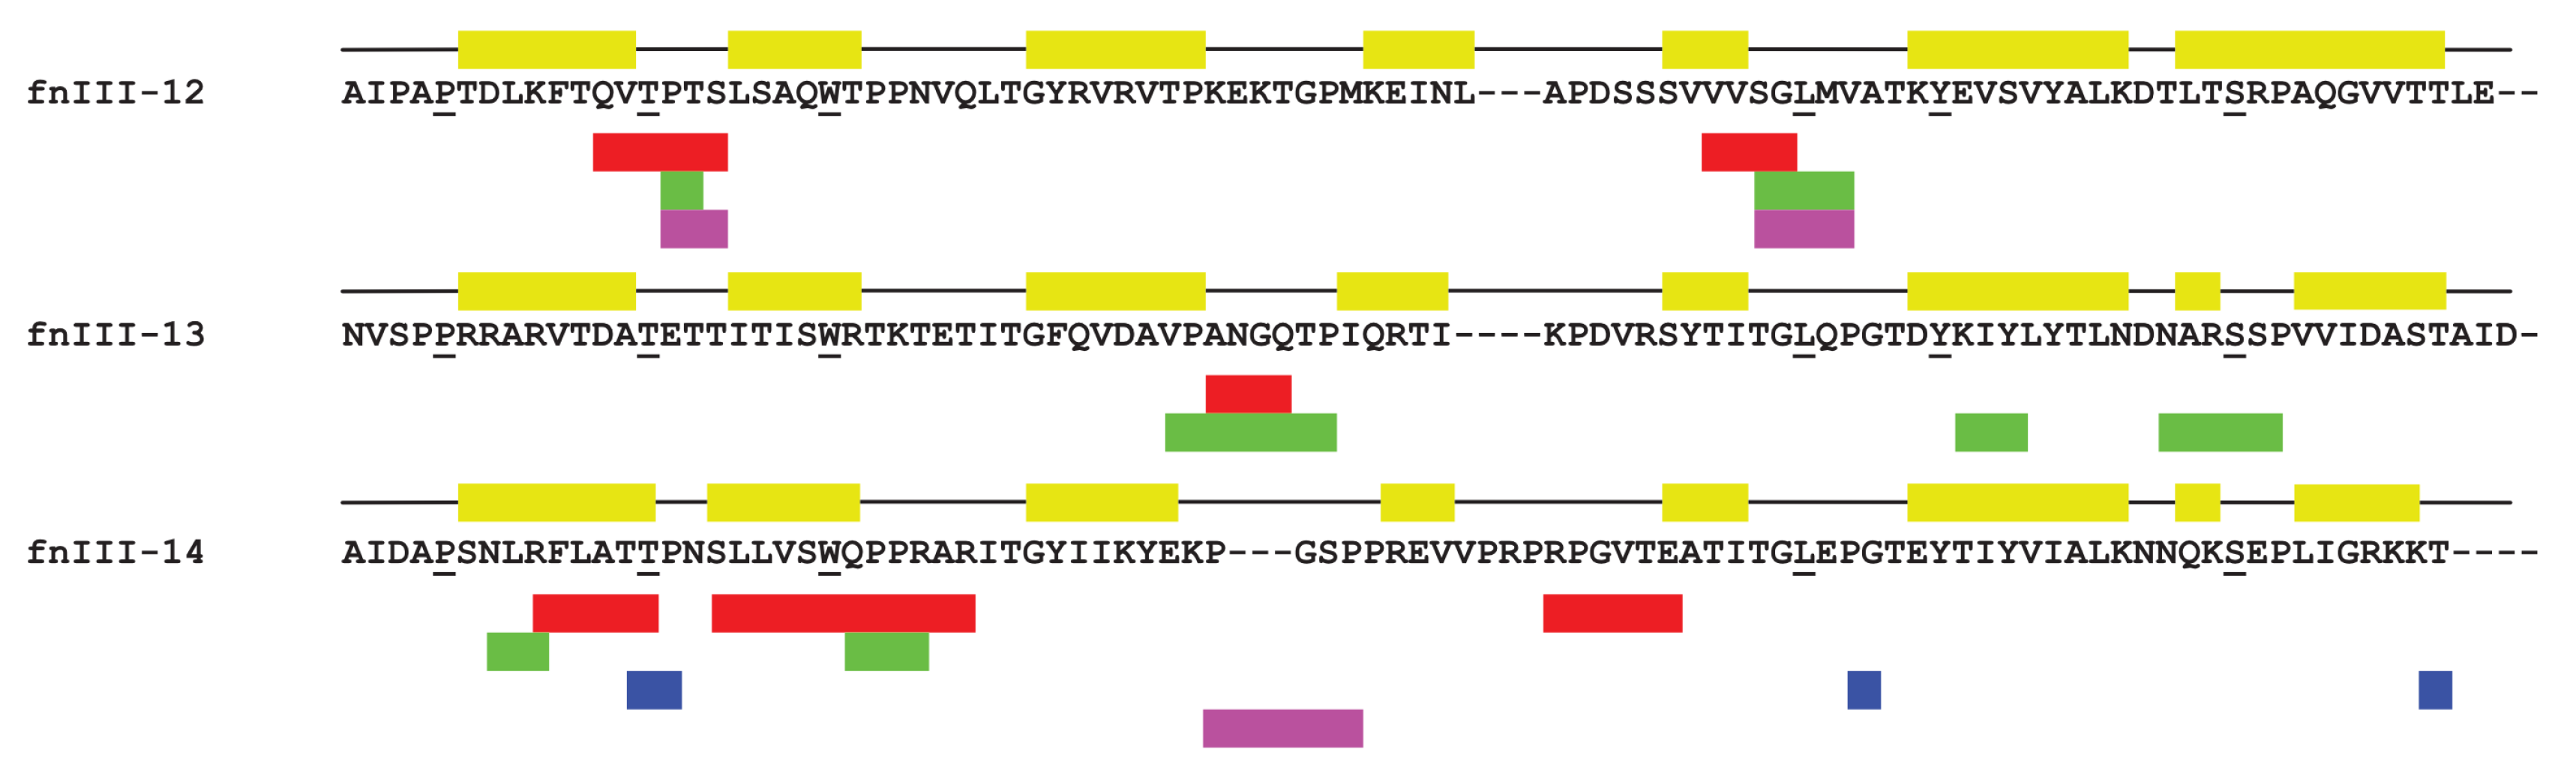
3.2. Comparison of Adsorbed Residues

As the overall structure of the different protein domains is similar, it is instructive to compare the regions of the protein that contact the surface (Figure 6). For the FnIII-12 domain, these are similar in all the simulations in which the protein adsorbs, with there being a slight difference between run one and the others. These are all on the same side of the protein and close to its C-terminus, where this would be joined to the subsequent domain in the full protein. This may lead to changes in the structure of the overall protein, such as the relative orientation of these two domains upon adsorption. It may also limit the accessibility of the residues involved in binding to the surface.
For the FnIII-13 domain, the residues involved in surface adsorption are all on one face of the protein (Figure 6). This face is opposite its heparin-binding region, suggesting that this would remain accessible after surface adsorption. The heparin-binding region is charged and would not be expected to interact favourably with the hydrophobic surface. Previous simulations, however, have shown that, due to the relatively long hydrophobic groups in their side chains, these can be considered slightly amphiphilic [54].
Compared to the other domains, the FnIII-14 domain shows a wider variation in the location of binding residues. For runs one and two, these are on the same face of the protein, on the opposite side to the heparin-binding region. Again, this is highly charged and so would not be expected to bind to the surface; this would also allow the protein to maintain its function on the surface. For run three, the residues involved in adsorption are on the C-terminal end of the protein, similar to the FnIII-12 fragment. For run four, the adsorbed residues are in a flexible loop, the flexibility of which may enhance the ability of this region to interact with the surface. Unlike the other cases, this loop is located on the same side face as the heparin-binding region and so adsorption in this orientation may inhibit the function of this domain.
To compare the adsorbed residues for each domain, a sequence alignment of them was performed (using Clustal Omega [55]). While there is significant variation between the location of the binding residues within the sequence, some commonality is found between the different proteins (Figure 7). Specifically, the loop joining the first and second beta-strands are commonly involved in adsorption for both FnIII-12 and FnIII-14 and the loop between the third and fourth beta-strands for FnIII-13 and FnIII-14. For the latter case, adsorption through only this region, as in FnIII-13 run 1 and FnIII-14 run 4, may be weaker than in other cases. Most generally, residues involved in surface adsorption are typically in flexible regions, which may increase their freedom to interact with the surface.

3.3. Adsorption Free Energies

To quantify the strength of adsorption, MM-PBSA calculations were used to estimate the adsorption free energy (Table 2). This is negative for cases where the protein is adsorbed onto the surface. A comparison between the different adsorption events shows that Δ G is more negative for longer periods of adsorption, as would be expected. This is particularly apparent for cases where multiple adsorption events are seen for a particular simulation (FnIII-12 runs one and two, FnIII-13 run one), where shorter adsorption events typically have higher values of Δ G a d s .
Consideration of the different contributions to Δ G a d s show that, typically, Δ E M M < 0 , suggesting that the direct interaction between protein and surface is attractive. The only exceptions to this are for the transient adsorption events at the end of FnIII-13 run one, where only a small number of residues were in contact with the surface (Table 1). The solvation term is generally positive. While adsorption of the protein onto the hydrophobic surface would generally lead to a favourable hydrophobic interaction, due to the release of water molecules from the vicinity of the surface, this is countered by the removal of water from the generally polar surface of the protein. A similar unfavourable polar solvation contribution was also seen for the adsorption of lysozyme onto a graphite surface [56].

4. Conclusions

The adsorption of proteins onto surfaces is a common phenomenon, occurring whenever a man-made material comes into contact with a biological system. This dictates the response of the biological system to the material, so it is of great importance in areas including implantable medical devices, drug delivery systems and marine surfaces. As the protein adsorption process depends on the microscopic details of the protein–surface interactions, fully understanding this requires a molecular-level description. While this is challenging to determine experimentally, molecular dynamics simulations have proved to be a powerful tool for studying this.
In this paper, molecular dynamics simulations were used to study the adsorption of three proteins, the 12th, 13th and 14th type-III domains of fibronectin, onto a hydrophobic surface. Fibronectin plays a key role in cell adhesion and spreading, and so is important in the body’s inflammatory response. The structural and sequence similarity of these three domains also allow us to investigate the variation in surface behaviour with protein structure. Notably, we find that two of these domains (FnIII-12 and FnIII-14) readily adsorb onto the surface, whereas the FnIII-13 appears to be less likely to adsorb. The specificity differs between the domains, with FnIII-12 adsorbing through a consistent set of residues clustered near its C-terminus. As this is where this would be joined to other domains in the full fibronectin protein, this may lead to changes in fibronectin conformation upon adsorption. By contrast, the FnIII-14 domain adsorbs through a number of different regions of the protein, suggesting less specific adsorption. While a number of hydrophobic residues are involved in surface adsorption, hydrophilic residues such as threonine and arginine are also found to participate [54]. These have hydrophobic groups in their side chains, which may interact favourably with the hydrophobic surface. In most cases, the heparin-binding regions in the FnIII-13 and FnIII-14 domains are orientated away from the surface, suggesting that these will maintain their functionality when adsorbed.
While, to the best of our knowledge, the adsorption of these domains onto surfaces has not been previously investigated using molecular simulation, other type-III domains have been investigated using simulation. In common with this work, simulations of a fragment consisting of the FnIII-8-10 domains on hydrophobic self-assembled monolayers also found adsorption through polar threonine residues [27]. Similarly, simulations of the FnIII-10 domain on its own found adsorption onto hydrophobic self-assembled monolayers through threonine residues, although, in this case, hydrophobic residues such as proline were also involved [28]. This emphasises that the role of different residues at surfaces is more complex than a simple hydrophobic/hydrophilic classification may suggest. Residues involved in adsorption are also more commonly found in flexible regions of the protein, often in loops joining the beta-strands. This was observed in previous simulations of the adsorption of anastellin [26] and the C-terminal domain of the FnIII-1 domain, and is similar to the fly-casting behaviour found in protein recognition processes [57].
Quantitative information on the adsorption can be obtained through estimating the adsorption free energy (Table 2) using MM-PBSA calculations. As may be expected, this was negative for each adsorption event, with longer residence times typically corresponding to more negative values of Δ G a d s . Typically, the molecular mechanics contribution to this is negative and the solvation contribution is positive. While adsorption onto hydrophobic surfaces may lead to the release of water from the hydrophobic surface, which would generally be favourable, adsorption of the protein would lead to desolvation of the largely polar protein surface.
While the adsorption free energy has not been estimated in previous simulations of fibronection adsorption onto hydrophobic surfaces, the results in this manuscript are qualitatively similar to those seen in prior work. For the FnIII-8-10 trimer, strong adsorption onto hydrophobic surfaces through the two terminal domains was found [27]. Interestingly, the central domain (fnIII-9) in this trimer was not found to adsorb onto hydrophobic surfaces. Similarly, simulations of the FnIII-9-10 dimer on ethyl acrylate and methyl-acrylate-terminated self-assembled monolayers found that the FnIII-10 domain stably adsorbs onto both of these, whereas the FnIII-9 domain only shows stable adsorption onto the more hydrophobic ethyl acrylate surface [29]. Typically, more stable adsorption is associated with more hydrophobic domains; the GRAVY (grand average of hydropathy) values [58] for the FnIII-10 and FnIII-12 domains are higher than those of the other fragments (Table 3), indicating that these are more hydrophobic than the others. However, the GRAVY value for the FnIII-14 domain is lower than that of the FnIII-13, which shows limited adsorption onto the hydrophobic surface.
Previous work has shown that minor changes to surface chemistry can lead to significant changes in protein adsorption [29]. In this paper, we have also shown that small changes to the protein also qualitatively change the adsorption process, with the strength and specificity of adsorption varying between three similar proteins. This illustrates the importance of considering protein properties in their adsorption and understanding the interplay between this and surface chemistry in the design of biomaterials.

Author Contributions

Conceptualization, D.L.C.; methodology, D.L.C.; investigation, V.V.; writing—original draft preparation, V.V. and D.L.C.; writing—review and editing, V.V. and D.L.C.; visualization, V.V.; supervision, D.L.C.; project administration, D.L.C. All authors have read and agreed to the published version of the manuscript.

Funding

This research was funded by SFI grant number 13/RC/2073_P2 and EPSRC 18/EPSRC-CDT/3583, and EP/SO2347X/1.

Data Availability Statement

The data presented in this study are available in this article.

Acknowledgments

Computational facilities for this work were provided by the SFI/HEA funded Irish Centre for High End Computing. We are grateful to the Latour Research Group at Clemson University for providing downloadable SAMs.

Conflicts of Interest

The authors declare no conflict of interest. The funders had no role in the design of the study; in the collection, analyses, or interpretation of data; in the writing of the manuscript; or in the decision to publish the results.

References

  1. Banerjee, I.; Pangule, R.C.; Kane, R.S. Antifouling coatings: Recent developments in the design of surfaces that prevent fouling by proteins, bacteria, and marine organisms. Adv. Mater. (Deerfield Beach Fla.) 2011, 23, 690–718. [Google Scholar] [CrossRef] [PubMed]
  2. Blaszykowski, C.; Sheikh, S.; Thompson, M. Surface chemistry to minimize fouling from blood-based fluids. Chem. Soc. Rev. 2012, 41, 5599. [Google Scholar] [CrossRef]
  3. Rabe, M.; Verdes, D.; Seeger, S. Understanding protein adsorption phenomena at solid surfaces. Adv. Colloid Interface Sci. 2011, 162, 87–106. [Google Scholar] [CrossRef] [PubMed] [Green Version]
  4. Ouberai, M.M.; Xu, K.; Welland, M.E. Effect of the interplay between protein and surface on the properties of adsorbed protein layers. Biomaterials 2014, 35, 6157–6163. [Google Scholar] [CrossRef] [Green Version]
  5. Abaricia, J.O.; Farzad, N.; Heath, T.J.; Simmons, J.; Morandini, L.; Olivares-Navarrete, R. Control of innate immune response by biomaterial surface topography, energy, and stiffness. Acta Biomater. 2021, 133, 58–73. [Google Scholar] [CrossRef]
  6. Brancolini, G.; Bellucci, L.; Maschio, M.C.; Di Felice, R.; Corni, S. The interaction of peptides and proteins with nanostructures surfaces: A challenge for nanoscience. Curr. Opin. Colloid Interface Sci. 2019, 41, 86–94. [Google Scholar] [CrossRef]
  7. Amani, H.; Arzaghi, H.; Bayandori, M.; Dezfuli, A.S.; Pazoki-Toroudi, H.; Shafiee, A.; Moradi, L. Controlling Cell Behavior through the Design of Biomaterial Surfaces: A Focus on Surface Modification Techniques. Adv. Mater. Interfaces 2019, 6, 1900572. [Google Scholar] [CrossRef] [Green Version]
  8. Sun, W.; Liu, W.; Wu, Z.; Chen, H. Chemical Surface Modification of Polymeric Biomaterials for Biomedical Applications. Macromol. Rapid Commun. 2020, 41, 1900430. [Google Scholar] [CrossRef] [PubMed]
  9. Mantha, S.; Pillai, S.; Khayambashi, P.; Upadhyay, A.; Zhang, Y.; Tao, O.; Pham, H.M.; Tran, S.D. Smart Hydrogels in Tissue Engineering and Regenerative Medicine. Materials 2019, 12, 3323. [Google Scholar] [CrossRef] [Green Version]
  10. Williams, D.F. Challenges with the Development of Biomaterials for Sustainable Tissue Engineering. Front. Bioeng. Biotechnol. 2019, 7, 127. [Google Scholar] [CrossRef] [Green Version]
  11. Dalton, C.J.; Lemmon, C.A. Fibronectin: Molecular Structure, Fibrillar Structure and Mechanochemical Signaling. Cells 2021, 10, 2443. [Google Scholar] [CrossRef]
  12. Mezzenga, R.; Mitsi, M. The Molecular Dance of Fibronectin: Conformational Flexibility Leads to Functional Versatility. Biomacromolecules 2019, 20, 55–72. [Google Scholar] [CrossRef] [PubMed]
  13. Salmerón-Sánchez, M.; Rico, P.; Moratal, D.; Lee, T.T.; Schwarzbauer, J.E.; García, A.J. Role of material-driven fibronectin fibrillogenesis in cell differentiation. Biomaterials 2011, 32, 2099–2105. [Google Scholar] [CrossRef]
  14. Sottile, J.; Hocking, D.; Langenbach, K. Fibronectin polymerization stimulates cell growth by RGD-dependent and -independent mechanisms. J. Cell Sci. 2000, 113, 4287–4299. [Google Scholar] [CrossRef] [PubMed]
  15. Williams, C.M.; Engler, A.J.; Slone, R.D.; Galante, L.L.; Schwarzbauer, J.E. Fibronectin Expression Modulates Mammary Epithelial Cell Proliferation during Acinar Differentiation. Cancer Res. 2008, 68, 3185–3192. [Google Scholar] [CrossRef] [PubMed] [Green Version]
  16. Petersen, T.E.; Thøgersen, H.C.; Skorstengaard, K.; Vibe-Pedersen, K.; Sahl, P.; Sottrup-Jensen, L.; Magnusson, S. Partial primary structure of bovine plasma fibronectin: Three types of internal homology. Proc. Natl. Acad. Sci. USA 1983, 80, 137–141. [Google Scholar] [CrossRef] [PubMed] [Green Version]
  17. Martino, M.M.; Hubbell, J.A. The 12th-14th type III repeats of fibronectin function as a highly promiscuous growth factor-binding domain. FASEB J. 2010, 24, 4711–4721. [Google Scholar] [CrossRef] [Green Version]
  18. Ozboyaci, M.; Kokh, D.B.; Corni, S.; Wade, R.C. Modeling and simulation of protein-surface interactions: Achievements and challenges. Q. Rev. Biophys. 2016, 49, e4. [Google Scholar] [CrossRef] [Green Version]
  19. Ley, K.; Christofferson, A.; Penna, M.; Winkler, D.; Maclaughlin, S.; Yarovsky, I. Surface-water Interface Induces Conformational Changes Critical for Protein Adsorption: Implications for Monolayer Formation of EAS Hydrophobin. Front. Mol. Biosci. 2015, 2, 64. [Google Scholar] [CrossRef] [Green Version]
  20. Guo, C.; Wu, C.; Chen, M.; Zheng, T.; Chen, N.; Cummings, P.T. Molecular modeling of fibronectin adsorption on topographically nanostructured rutile (110) surfaces. Appl. Surf. Sci. 2016, 384, 36–44. [Google Scholar] [CrossRef] [Green Version]
  21. Penna, M.; Ley, K.; Maclaughlin, S.; Yarovsky, I. Surface heterogeneity: A friend or foe of protein adsorption – insights from theoretical simulations. Faraday Discuss. 2016, 191, 435–464. [Google Scholar] [CrossRef] [PubMed]
  22. Cheung, D. Effect of surface structure on peptide adsorption on soft surfaces. Chem. Phys. Lett. 2020, 758, 137929. [Google Scholar] [CrossRef]
  23. Raffaini, G.; Ganazzoli, F. Molecular Dynamics Simulation of the Adsorption of a Fibronectin Module on a Graphite Surface. Langmuir 2004, 20, 3371–3378. [Google Scholar] [CrossRef]
  24. Panos, M.; Sen, T.Z.; Ahunbay, M.G. Molecular Simulation of Fibronectin Adsorption onto Polyurethane Surfaces. Langmuir 2012, 28, 12619–12628. [Google Scholar] [CrossRef] [PubMed]
  25. Kubiak-Ossowska, K.; Mulheran, P.A.; Nowak, W. Fibronectin Module FNIII9 Adsorption at Contrasting Solid Model Surfaces Studied by Atomistic Molecular Dynamics. J. Phys. Chem. B 2014, 118, 9900–9908. [Google Scholar] [CrossRef] [PubMed] [Green Version]
  26. Mallinson, D.; Cheung, D.L.; Simionesie, D.; Mullen, A.B.; Zhang, Z.J.; Lamprou, D.A. Experimental and computational examination of anastellin (FnIII1c)-polymer interactions. J. Biomed. Mater. Res. Part A 2017, 105, 737–745. [Google Scholar] [CrossRef] [PubMed] [Green Version]
  27. Liamas, E.; Kubiak-Ossowska, K.; Black, R.; Thomas, O.; Zhang, Z.; Mulheran, P. Adsorption of Fibronectin Fragment on Surfaces Using Fully Atomistic Molecular Dynamics Simulations. Int. J. Mol. Sci. 2018, 19, 3321. [Google Scholar] [CrossRef] [Green Version]
  28. Li, T.; Hao, L.; Li, J.; Du, C.; Wang, Y. Role of Ninth Type-III Domain of Fibronectin in the Mediation of Cell-Binding Domain Adsorption on Surfaces with Different Chemistries. Langmuir 2018, 34, 9847–9855. [Google Scholar] [CrossRef]
  29. Bieniek, M.K.; Llopis-Hernandez, V.; Douglas, K.; Salmeron-Sanchez, M.; Lorenz, C.D. Minor Chemistry Changes Alter Surface Hydration to Control Fibronectin Adsorption and Assembly into Nanofibrils. Adv. Theory Simul. 2019, 2, 1900169. [Google Scholar] [CrossRef] [Green Version]
  30. Hao, L.; Li, T.; Wang, L.; Shi, X.; Fan, Y.; Du, C.; Wang, Y. Mechanistic insights into the adsorption and bioactivity of fibronectin on surfaces with varying chemistries by a combination of experimental strategies and molecular simulations. Bioact. Mater. 2021, 6, 3125–3135. [Google Scholar] [CrossRef]
  31. Basu, S.; Basu, B.; Maiti, P.K. A computational study on strontium ion modified hydroxyapatite–fibronectin interactions. Phys. Chem. Chem. Phys. 2022, 24, 27989–28002. [Google Scholar] [CrossRef] [PubMed]
  32. Leahy, D.J.; Aukhil, I.; Erickson, H.P. 2.0 Å Crystal Structure of a Four-Domain Segment of Human Fibronectin Encompassing the RGD Loop and Synergy Region. Cell 1996, 84, 155–164. [Google Scholar] [CrossRef] [Green Version]
  33. Sharma, A. Crystal structure of a heparin-and integrin-binding segment of human fibronectin. EMBO J. 1999, 18, 1468–1479. [Google Scholar] [CrossRef] [PubMed]
  34. Lemmon, C.A.; Ohashi, T.; Erickson, H.P. Probing the Folded State of Fibronectin Type III Domains in Stretched Fibrils by Measuring Buried Cysteine Accessibility. J. Biol. Chem. 2011, 286, 26375–26382. [Google Scholar] [CrossRef] [PubMed] [Green Version]
  35. Rastelli, G.; Rio, A.D.; Degliesposti, G.; Sgobba, M. Fast and accurate predictions of binding free energies using MM-PBSA and MM-GBSA. J. Comput. Chem. 2009, 31, 797–810. [Google Scholar] [CrossRef] [PubMed]
  36. Ulman, A.; Eilers, J.E.; Tillman, N. Packing and molecular orientation of alkanethiol monolayers on gold surfaces. Langmuir 1989, 5, 1147–1152. [Google Scholar] [CrossRef]
  37. MacKerell, A.D.; Bashford, D.; Dunbrack, R.L.; Evanseck, J.D.; Field, M.J.; Fischer, S.; Gao, J.; Guo, H.; Ha, S.; Joseph-McCarthy, D.; et al. All-Atom Empirical Potential for Molecular Modeling and Dynamics Studies of Proteins. J. Phys. Chem. B 1998, 102, 3586–3616. [Google Scholar] [CrossRef]
  38. Bjelkmar, P.; Larsson, P.; Cuendet, M.A.; Hess, B.; Lindahl, E. Implementation of the {CHARMM} Force Field in {GROMACS}: Analysis of Protein Stability Effects from Correction Maps, Virtual Interaction Sites, and Water Models. J. Chem. Theory Comput. 2010, 6, 459–466. [Google Scholar] [CrossRef]
  39. Huang, J.; Rauscher, S.; Nawrocki, G.; Ran, T.; Feig, M.; De Groot, B.L.; Grubmüller, H.; Mackerell, A.D. Charmm36M: An Improved Force Field for Folded and Intrinsically Disordered Proteins. Nat. Methods 2016, 14, 71–73. [Google Scholar] [CrossRef] [Green Version]
  40. Vanommeslaeghe, K.; Hatcher, E.; Acharya, C.; Kundu, S.; Zhong, S.; Shim, J.; Darian, E.; Guvench, O.; Lopes, P.; Vorobyov, I.; et al. CHARMM general force field: A force field for drug-like molecules compatible with the CHARMM all-atom additive biological force fields. J. Comput. Chem. 2009, 31, 671–690. [Google Scholar] [CrossRef] [Green Version]
  41. Mark, P.; Nilsson, L. Structure and dynamics of the TIP3P, SPC, and SPC/E water models at 298 K. J. Phys. Chem. A 2001, 105, 9954–9960. [Google Scholar] [CrossRef]
  42. Essmann, U.; Perera, L.; Berkowitz, M.L.; Darden, T.; Lee, H.; Pedersen, L.G. A smooth particle mesh Ewald method. J. Chem. Phys. 1995, 103, 8577. [Google Scholar] [CrossRef] [Green Version]
  43. Van Der Spoel, D.; Lindahl, E.; Hess, B.; Groenhof, G.; Mark, A.E.; Berendsen, H.J.C. GROMACS: Fast, flexible, and free. J. Comput. Chem. 2005, 26, 1701–1718. [Google Scholar] [CrossRef] [PubMed]
  44. Hess, B.; Kutzner, C.; van der Spoel, D.; Lindahl, E. GROMACS 4: Algorithms for Highly Efficient, Load-Balanced, and Scalable Molecular Simulation. J. Chem. Theory Comput. 2008, 4, 435–447. [Google Scholar] [CrossRef] [Green Version]
  45. Abraham, M.J.; Murtola, T.; Schulz, R.; Páll, S.; Smith, J.C.; Hess, B.; Lindahl, E. GROMACS: High performance molecular simulations through multi-level parallelism from laptops to supercomputers. SoftwareX 2015, 1–2, 19–25. [Google Scholar] [CrossRef] [Green Version]
  46. Bussi, G.; Donadio, D.; Parrinello, M. Canonical sampling through velocity rescaling. J. Chem. Phys. 2007, 126, 014101. [Google Scholar] [CrossRef] [Green Version]
  47. Hess, B.; Bekker, H.; Berendsen, H.J.C.; Fraaije, J.G.E.M. LINCS: A linear constraint solver for molecular simulations. J. Comput. Chem. 1997, 18, 1463–1472. [Google Scholar] [CrossRef]
  48. Miyamoto, S.; Kollman, P.A. Settle: An analytical version of the SHAKE and RATTLE algorithm for rigid water models. J. Comput. Chem. 1992, 13, 952–962. [Google Scholar] [CrossRef]
  49. Michaud-Agrawal, N.; Denning, E.J.; Woolf, T.B.; Beckstein, O. MDAnalysis: A Toolkit for the Analysis of MolecularDynamics Simulations. J. Comput. Chem. 2011, 32, 2319–2327. [Google Scholar] [CrossRef] [Green Version]
  50. Humphrey, W.; Dalke, A.; Schulten, K. VMD: Visual molecular dynamics. J. Mol. Graph. 1996, 14, 33–38. [Google Scholar] [CrossRef]
  51. Hou, T.; Wang, J.; Li, Y.; Wang, W. Assessing the Performance of the MM/PBSA and MM/GBSA Methods. 1. The Accuracy of Binding Free Energy Calculations Based on Molecular Dynamics Simulations. J. Chem. Inf. Model. 2011, 51, 69–82. [Google Scholar] [CrossRef]
  52. Sitkoff, D.; Sharp, K.A.; Honig, B. Accurate Calculation of Hydration Free Energies Using Macroscopic Solvent Models. J. Phys. Chem. 1994, 98, 1978–1988. [Google Scholar] [CrossRef]
  53. Miller, B.R.; McGee, T.D.; Swails, J.M.; Homeyer, N.; Gohlke, H.; Roitberg, A.E. MMPBSA.py: An Efficient Program End-State Free Energy Calculations. J. Chem. Theory Comput. 2012, 8, 3314–3321. [Google Scholar] [CrossRef] [PubMed]
  54. Hung, A.; Mager, M.; Hembury, M.; Stellacci, F.; Stevens, M.M.; Yarovsky, I. Amphiphilic amino acids: A key to adsorbing proteins to nanopatterned surfaces? Chem. Sci. 2013, 4, 928–937. [Google Scholar] [CrossRef]
  55. Li, W.; Cowley, A.; Uludag, M.; Gur, T.; McWilliam, H.; Squizzato, S.; Park, Y.M.; Buso, N.; Lopez, R. The EMBL-EBI bioinformatics web and programmatic tools framework. Nucleic Acids Res. 2015, 43, W580–W584. [Google Scholar] [CrossRef] [PubMed] [Green Version]
  56. Nakano, C.M.; Ma, H.; Wei, T. Study of lysozyme mobility and binding free energy during adsorption on a graphene surface. Appl. Phys. Lett. 2015, 106, 153701. [Google Scholar] [CrossRef]
  57. Levy, Y.; Onuchic, J.N.; Wolynes, P.G. Fly-casting in protein-DNA binding: Frustration between protein folding and electrostatics facilitates target recognition. J. Am. Chem. Soc. 2007, 129, 738–739. [Google Scholar] [CrossRef]
  58. Kyte, J.; Doolittle, R.F. A simple method for displaying the hydropathic character of a protein. J. Mol. Biol. 1982, 157, 105–132. [Google Scholar] [CrossRef] [Green Version]
Figure 1. Illustration of initial simulation configuration for FnIII-12. Protein shown in New Cartoon representation and surface ligands in liquorice (water omitted for clarity). The same orientation used in all subsequent snapshots.
Biophysica 03 00027 g001
Figure 2. (a) Protein centre-of-mass (top) and closest residue (bottom) z-coordinates for FnIII-12. Black, red, green and blue denote first, second, third and fourth simulation runs, respectively. (b) Residue z positions against time for FnIII-12 run one, two, three and four (top to bottom). (c) Simulation snapshots taken from FnIII-12 run one at times t = 0, 40 ns, 100 ns, 155 ns and 200 ns (left to right). Residues in contact with surface at end of simulation (12–17 and 58–61) highlighted as opaque spheres. For the t = 40 ns snapshot, residues in contact with surface (26–28) highlighted as pastel spheres.
Biophysica 03 00027 g002
Figure 3. (a) Protein centre-of-mass (top) and closest residue (bottom) z-coordinates for FnIII-13. Black, red, green and blue denote first, second, third and fourth simulation runs, respectively. (b) Residue z positions against time for FnIII-13 run one, two, three and four (top to bottom). (c) Simulation snapshots taken from FnIII-13 run one at times t = 0, 40 ns, 100 ns, 196 ns, and FnIII-13 run 2 at times t = 0 and 200 ns (left to right). Residues in contact with surface at end of simulation highlighted as opaque spheres.
Biophysica 03 00027 g003
Figure 4. (a) Protein centre-of-mass (top) and closest residue (bottom) z-coordinates for FnIII-14. Black, red, green and blue denote first, second, third and fourth simulation runs, respectively. (b) Residue z positions against time for FnIII-14 run one, two, three and four (top to bottom). (c) Simulation snapshots taken from FnIII-14 run two at times t = 0, 30 ns, 118 ns, 140 ns and 200 ns (left to right). Residues in contact with surface at end of simulation (188–190 and 204–207) highlighted as opaque spheres.
Biophysica 03 00027 g004
Figure 5. (a) Average residue z positions for permanent adsorption for FnIII-12. Black, red and green denote runs 1, 2 and 4, respectively. (b) Average residue z positions for permanent adsorption for FnIII-14. Black, red, green and blue denote runs 1, 2, 3 and 4, respectively.
Biophysica 03 00027 g005
Figure 6. (a) Structure of FnIII-12 with adsorbed residues highlighted for (left to right) runs 1, 2 and 4. (b) Structure of FnIII-13 with adsorbed residues highlighted for run 2. Heparin-binding site 1 highlighted in green. (c) Structure of FnIII-14 with adsorbed residues highlighted for (left to right) runs 1 to 4. Heparin-binding site 2 highlighted in green.
Biophysica 03 00027 g006
Figure 7. Sequence alignment of FnIII-12, FnIII-13 and FnIII-14. Yellow boxes show location of beta-strands. Red, green, blue and purple boxes denote residues adsorbed in runs one to four, respectively. Conserved residues underlined.
Biophysica 03 00027 g007
Table 1. Adsorbed residues ( z < 21 Å) for each simulation run.
FragmentRunInterval (ns)Residues
FnIII-12134.71–41.226–28: NVQ
76.13–83.4126–28: NVQ
151.29–20012–17: NVTPTS, 58–61: VVSG
22.84–65.3830: T, 49–52: NLAP, 77–78: DT
66.84–88.4726–28: NVQ
89.6–96.5526–28: NVQ
102.6–20015–16: PT, 60–64: SGLMV
4131.12–20015-17: PTS, 60-64: SGLMV
FnIII-13119.22–22.7183: I
80.76–98.51131–134: ANGQ
99.88–103.46132–134: NGQ
104.75–116.43131–134: ANGQ
143.84–148.73169: N
195.37–196.41132–133: NG
197.99–199.43132: N
245.42–200129–136: VPANGQTP, 160–162: KIY, 169–174: NARSSP
FnIII-14113.59–200190–195: RFLATT, 200–209: LVSWQPPRAR, 232–237: RPGVTE
2167.29–200188–190: NLR, 204–207: QPPR
323.62–200194–196: TTP, 245–246: PG, 271: T
4130.04–192.84220–223: PGSP
Table 2. Estimated adsorption free energies (in kcal mol−1) from MM-PBSA calculations.
FragmentRunInterval (ns) Δ G ads Δ E MM Δ G solv
FnIII-12134.71–41.2−6.9 ± 0.3−15.1 ± 1.08.3 ± 0.9
76.13–83.41−5.0 ± 0.3−16.2 ± 0.411.2 ± 0.3
151.29–200−12.2 ± 0.3−19.1 ± 0.56.9 ± 0.3
22.84–65.38−16.0 ± 0.3−18.9 ± 0.42.9 ± 0.3
66.84–88.47−6.4 ± 0.2−10.2 ± 0.53.8 ± 0.4
89.6–96.55−4.7 ± 0.3−5.9 ± 1.31.3 ± 1.1
102.6–200−20.0 ± 0.2−32.6 ± 0.412.6 ± 0.2
4131.12–200−10.1 ± 0.2−18.9 ± 0.38.8 ± 0.2
FnIII-13119.22–22.70−5.4 ± 0.4−4 ± 1.4−1.4 ± 1.3
80.76–98.51−8.6 ± 0.2−17.5 ± 0.78.9 ± 0.6
99.88–103.46−7.4 ± 0.4−26.9 ± 0.819.5 ± 0.5
104.75–116.43−5.7 ± 0.2−12.2 ± 0.96.5 ± 0.9
143.84–148.73−2.9 ± 0.2−5.2 ± 0.72.3 ± 0.6
195.37–196.41−1.8 ± 0.37.3 ± 0.9−9.2 ± 0.9
197.99–199.43−3.7 ± 0.414.8 ± 0.7−18.5 ± 0.6
245.42–200−27.6 ± 0.2−51.7 ± 0.524.1 ± 0.4
FnIII-14113.59–200−20.9 ± 0.2−54.1 ± 0.733.2 ± 0.5
2167.29–200−10.8 ± 0.2−6.5 ± 0.7−4.4 ± 0.7
323.62–200−14.4 ± 0.1−19.6 ± 0.35.3 ± 0.2
4130.04–192.84−11.9 ± 0.2−22.8 ± 0.610.9 ± 0.5
Table 3. GRAVY values for selected fibronectin Type-III domains.
DomainGRAVY Value
FnIII-12−0.106
FnIII-13−0.444
FnIII-14−0.457
FnIII-8−0.391
FnIII-9−0.454
FnIII-10−0.114
Disclaimer/Publisher’s Note: The statements, opinions and data contained in all publications are solely those of the individual author(s) and contributor(s) and not of MDPI and/or the editor(s). MDPI and/or the editor(s) disclaim responsibility for any injury to people or property resulting from any ideas, methods, instructions or products referred to in the content.

