Technical Note

Triglyceride Saturation in Patients at Risk of NASH and NAFLD: A Cross-Sectional Study

1
Department of Radiological Sciences, David Geffen School of Medicine, University of California, Los Angeles, CA 90069, USA
2
Department of Radiology, University of California San Diego, San Diego, CA 92093, USA
*
Author to whom correspondence should be addressed.
Biophysica 2022, 2(1), 8-15; https://doi.org/10.3390/biophysica2010002
Submission received: 24 September 2021 / Revised: 9 December 2021 / Accepted: 14 December 2021 / Published: 30 December 2021

Abstract

:
Chemical shift magnetic resonance imaging (MRI) is commonly used to estimate the amount of fat in tissues, namely the proton density fat fraction (PDFF). In addition to PDFF, the type of fat can be inferred and characterized in terms of the number of double bonds (NDB), number of methylene-interrupted double bonds (NMIDB) and the chain length (CL) of the fatty acid chains. The saturation index is potentially a marker for metabolic disorders. This study assesses the feasibility of estimating these parameters independently or in a constrained manner. Correlations with spectroscopy were measured in 109 subjects’ subcutaneous and visceral fat depots (p = 2 × 10⁻²⁸), and with the NAFLD Activity Score (NAS) from histological evaluation of biopsies. The findings indicate that imaging estimates are comparable to spectroscopy (p = 0.0002), but there is no significant association of NDB with NAS (p = 0.1).

1. Introduction

Chemical shift encoded magnetic resonance imaging (CSE-MRI) techniques for separating water and fat exploit differences in the precession frequencies of water and fat protons [1,2]. An important clinical application is estimating the liver proton density fat fraction (PDFF) for assessing non-alcoholic fatty liver disease (NAFLD) and non-alcoholic steatohepatitis (NASH) [3,4,5,6]. Accurate estimation of PDFF requires the estimation of R2* decay, the minimization of T1 effects and modeling of the complete triglyceride spectrum [7].
The triglyceride composition (TC), and hence the triglyceride spectrum, changes depending on the relative fraction of saturated, monounsaturated and polyunsaturated fat [8,9]. Standard CSE-MRI techniques estimating PDFF are not able to assess TC because they assume a predetermined triglyceride spectrum [1,2]. Several magnetic resonance spectroscopy (MRS) studies have used the dependance of the fat spectrum on triglyceride type to estimate TC in terms of one of two interchangeable characterizations; either saturated, monounsaturated and diunsaturated fat fractions [8,10], or the number of -CH =CH- double bonds per molecule (NDB), the number of double bonds separated by a single -CH2- (NMIDB; number of methylene-interrupted double bonds), and fatty-acid chain length (CL) [9,11,12]. If the fat spectrum used for PDFF estimation is not fixed but is allowed to vary in a fashion dependent on the type of fat, CSE-MRI can also estimate TC [13,14].
It has been hypothesized that adipose tissue has an active role as part of the immune system [15], as well as reflecting the diet [16,17]. Regional differences in TC reflect depot-specific requirements of adipocyte function [18,19] based on the physical properties (particularly melting point) of saturated versus unsaturated fatty acid chains [20]. TC is also associated with clinical disorders, including cancer [21,22], type 2 diabetes [23,24] and NASH [25,26]. CSE-MRI allows the estimation of TC across large volumes, allowing regional variation both across different organs and within organs to be assessed. MRS estimates TC only in a single voxel, though the large size of typically 1–2 cm compared to imaging voxels (typically 2–5 mm) allows more accurate estimation of TC. To estimate TC, CSE-MRI only estimates NDB, also known as the saturation level, assuming relationships between NDB, CL and NMIDB.
The purpose of this study is to compare spectroscopy and imaging techniques to estimate the saturation level of triglyceride in adipose depots in human subjects [13]. The correlation between the measured NDB and the NAFLD Activity Score (NAS) from histology was investigated.

2. Methods

2.1. Patient Group

This was a prospective, cross-sectional study approved by our Institutional Review Board (IRB) and compliant with the Health Insurance Portability and Accountability Act, under IRB Name UCSD Human Research Protections Program (approved 6 April 2006 and 18 March 2010 with code/number 060370 and 100377). Adult and pediatric human subjects were recruited from clinical NAFLD studies conducted at our institution. Adults aged 18 years and older provided written informed consent. For pediatric subjects aged 8–17 years, written consent was obtained from a parent and written assent from the child. One hundred and seventy-six clinical patients at risk of NASH or NAFLD were recruited consecutively between 7/2011 and 3/2013. Of those, 109 completed the protocol successfully (imaging and spectroscopy) and 60 had a recent liver biopsy.

2.2. MR Methodology

Single-voxel spectroscopy was performed in subcutaneous (SCAT) and visceral adipose tissue (VAT) depots using the STEAM sequence with TR 3500 and TE 10 ms [12]. A 15 mm × 15 mm × 15 mm voxel on the right-hand side of the body was selected in SCAT and retro-peritoneal VAT. All spectra were shimmed during free breathing. In SCAT, spectra were acquired with 16 signal averages and two pre-acquisition excitations, while VAT spectra were acquired in a 25 s breath-hold acquisition with six signal averages and a single pre-acquisition excitation. All suppression pulses (fat, water, spatial) were disabled to ensure a uniform spectral response. Spectroscopy raw data were taken offline for analysis; spectra from the individual channels were combined using a singular value decomposition-based approach [27] and analyzed using the AMARES algorithm [28] included in the MRUI software package [29], as described in Ref. [12]. T2 correction of fat signals was completed using literature values, and the NDB and NMIDB were calculated for a fixed CL (17.5) using the fat spectral model given by Ref. [9].
Imaging was performed in two breath-hold scans (coronal and oblique) to give coverage of the liver and visceral and subcutaneous adipose tissue depots, as indicated in Figure 1. A 3D spoiled gradient echo sequence was used with 16 echos (echo-train length 8, interleaves 2), flip angle 2, matrix 64 × 64, slice thickness 8 mm. For the coronal plane: TR 10.5 ms, TE = 0.74, 1.29, …, 9.0 ms. For the oblique plane: TR 11.4 ms, TE = 0.92, 1.52, …, 9.8 ms. Scan times were approximately 26 s (a single breath-hold). The complex images were taken offline and nonlinear fitting was performed on every voxel independently, as described in Ref. [13], with prior knowledge used to fix the chain length (CL) and number of methylene interrupted double bonds (NMIDB). The free parameters were B0, R2*, PDFF and NDB, and typical results are shown in Figure 2.
A second method of estimating NDB as a “global” parameter was employed, in which a single NDB value was used over the whole dataset. This approach was similar to the self-calibration procedure described in Ref. [2], but using the fat spectrum model of Ref. [9] and optimization over NDB. The resulting value of NDB is the average from all depots.
An alternative to constraining CL and NMIDB is to estimate their values; efficient numerical algorithms for this optimization have been described [14,30]. Only a small fraction of the signal is represented by these triglyceride properties, and it is of interest to assess their sensitivity to measurement noise. Numerical simulations were performed to compare the noise sensitivity of each parameter both independently and using an a priori constraint to fix CL and NMIDB in relation to NDB [13]. This reduces the number of parameters and may be expected to sacrifice accuracy for a reduction in noise-related scatter (i.e., a bias-variance trade off).

2.3. Statistical Tests

(1)
The following data were recorded:
(a)
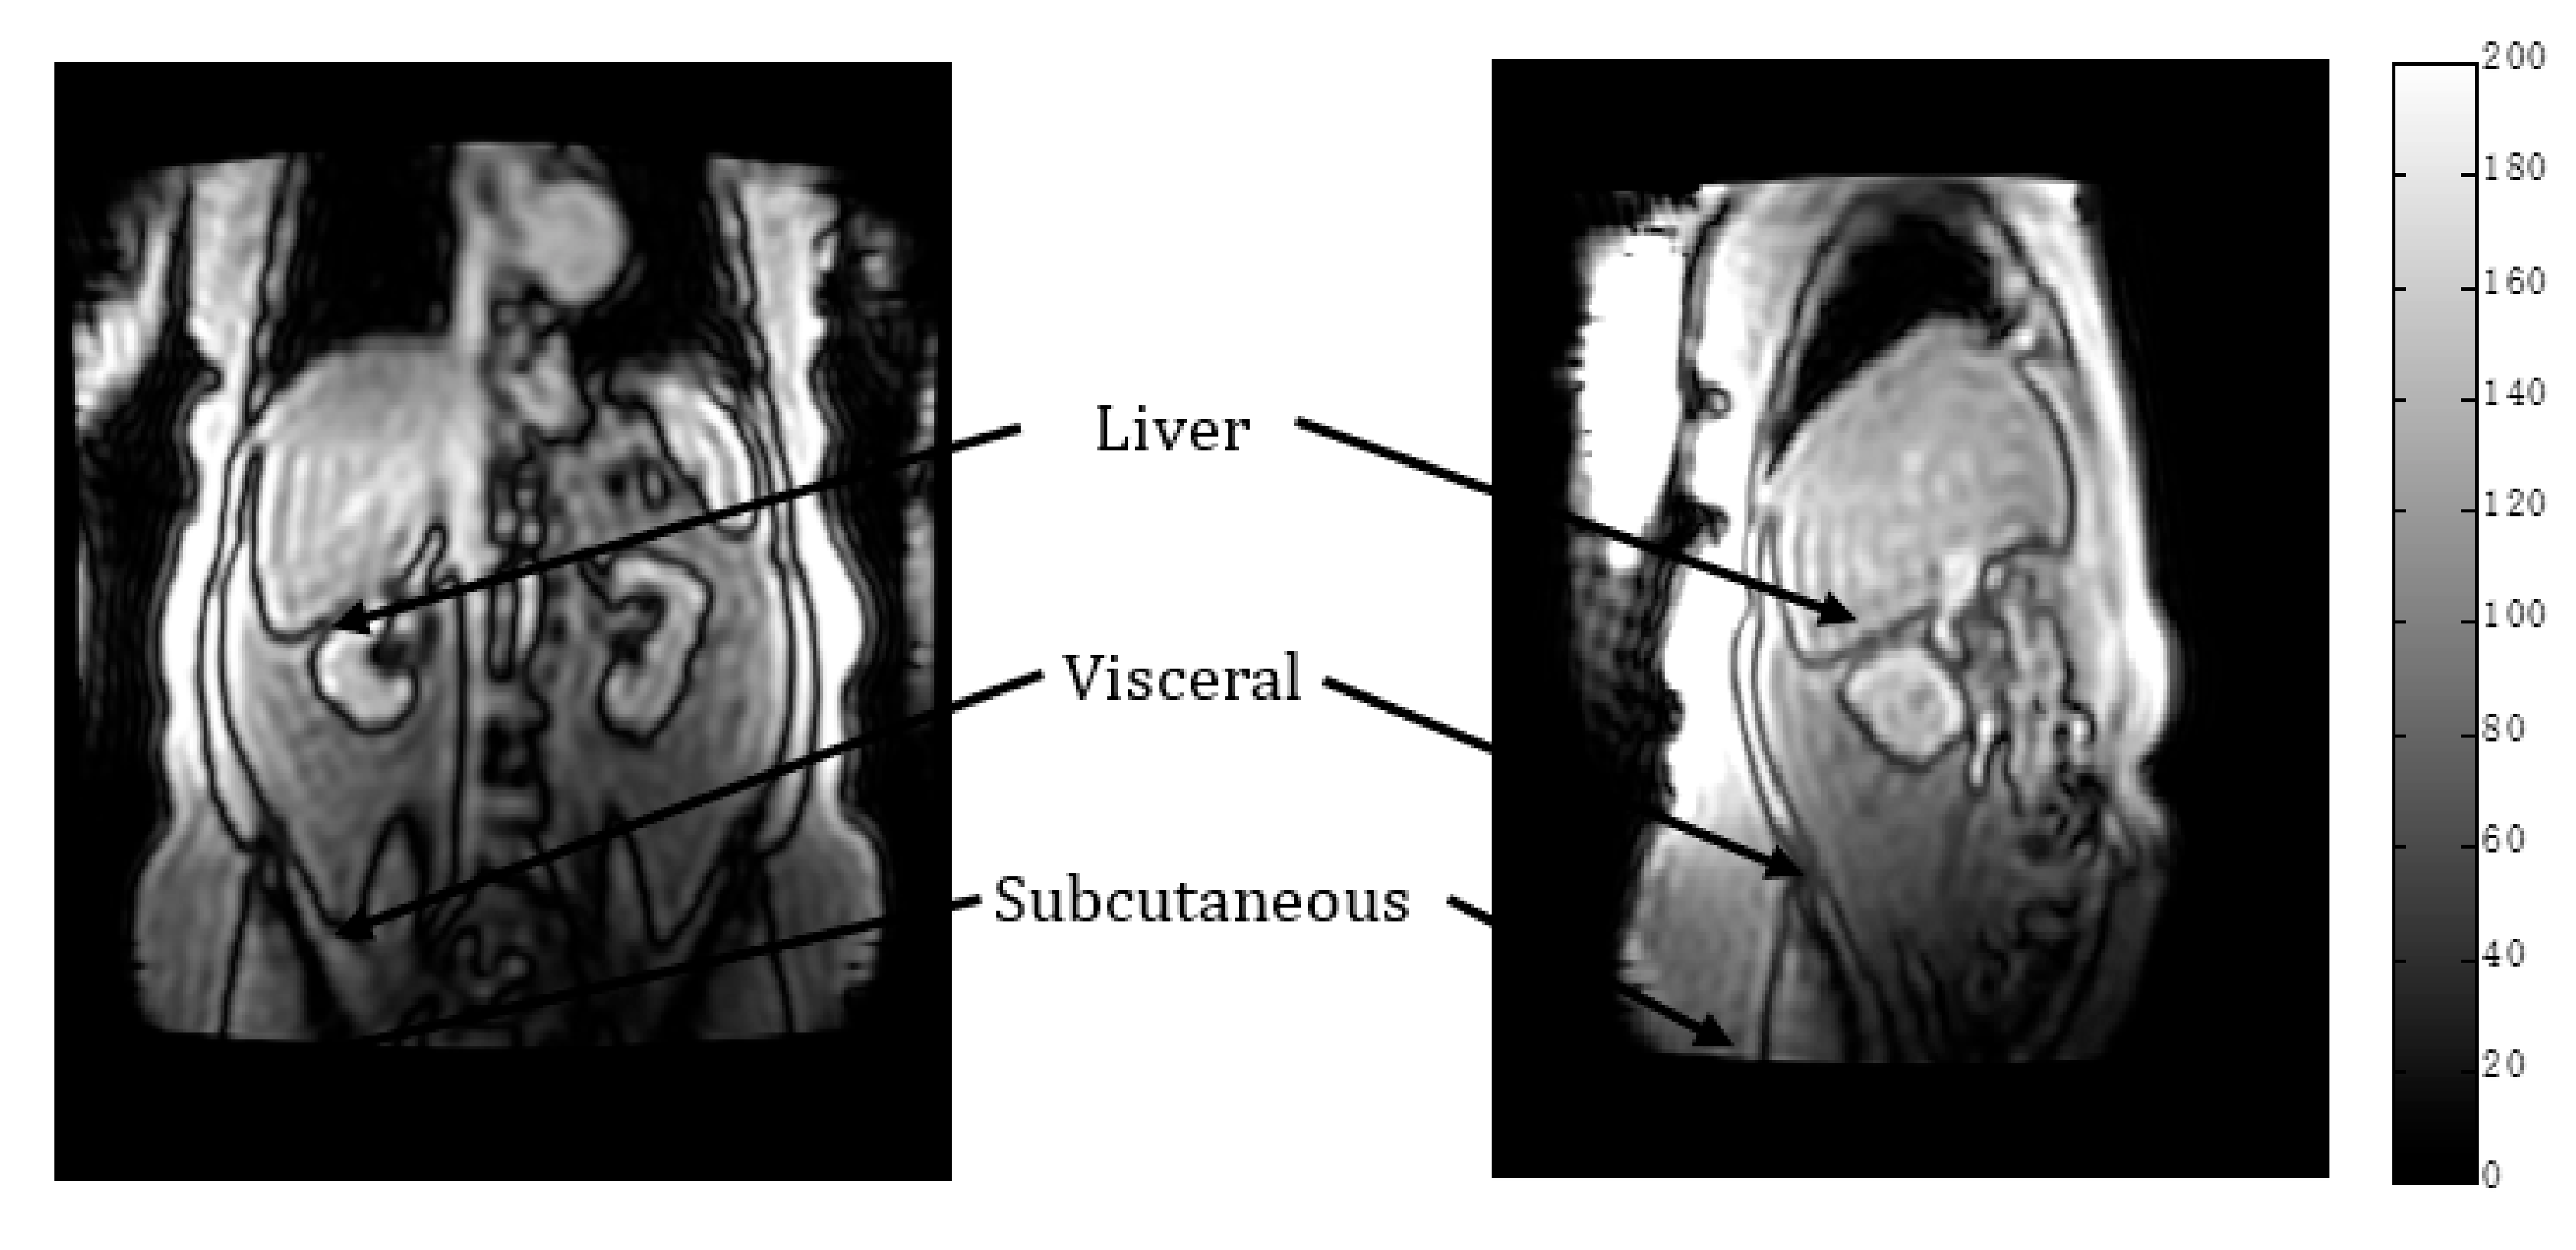
Spectroscopy NDB: in subcutaneous tissue and visceral tissue.
(b)
Imaging NDB (pixel by pixel): regions of interest were drawn in subcutaneous tissue and visceral tissue; mean values were recorded.
(c)
Imaging (global): NDB.
(d)
Histology: NAS (NAFLD Activity Score) based on Ref [31].
(2)
The following correlations were performed:
(a)
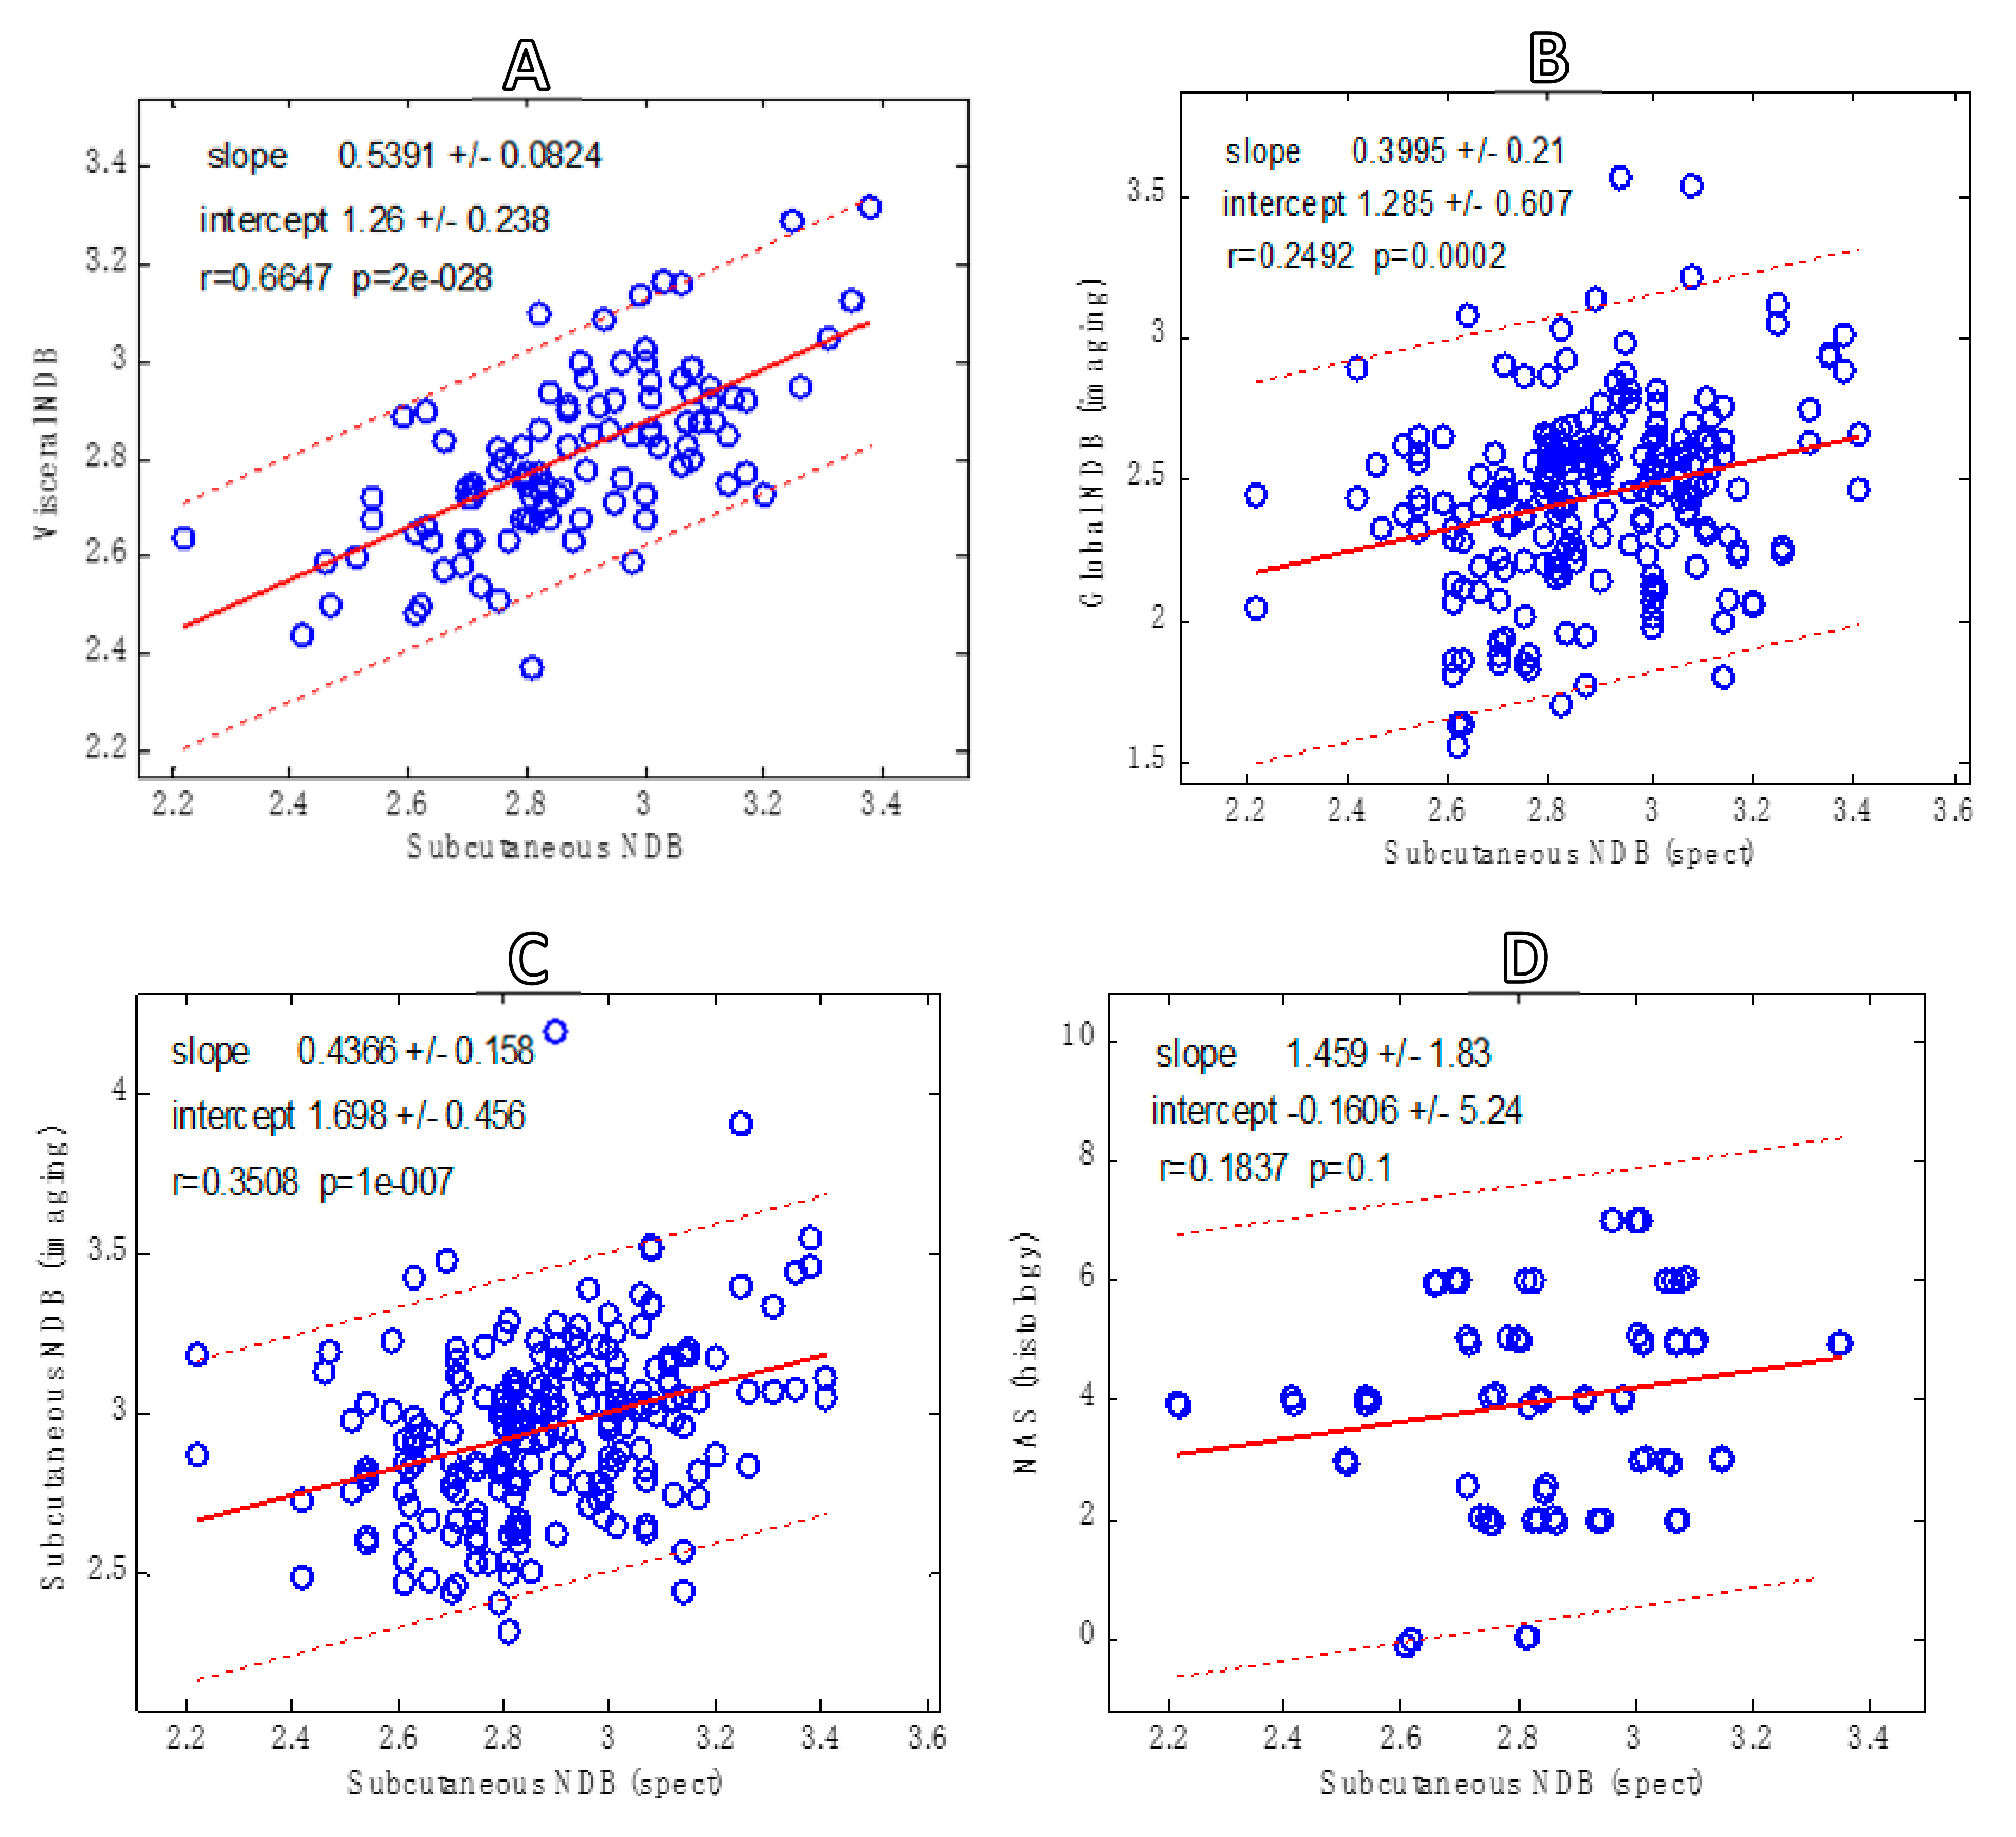
Spectroscopy: NDB in subcutaneous versus visceral tissue.
(b)
Imaging: global NDB versus subcutaneous.
(c)
Spectroscopy NDB versus imaging NDB (subcutaneous).
(d)
Spectroscopy NDB versus NAS.

3. Results

Numerical simulations were performed to investigate the feasibility of estimating the fat properties from 16 gradient echos. Artificial signals were created using the TEs given in Methods (TE = 0.74, 1.29, etc.) for a range of PDFF from 1% to 99%, scaled such that water signal + fat signal = 1. Complex random Gaussian noise with standard deviation 10−6 was added; this low noise level was chosen to avoid large changes to the least-squares error surface that can cause water–fat swapping. Additional signal properties were: B0 = 0 Hz, initial phase 0°, R2* = 0.05, CL = 17.55, NDB = 3 and NMIDB = 0.837, which are clinically representative values for these parameters.
Fitting was performed 104 times for each PDFF, and the standard deviation of the fitted parameters was calculated. Dividing by the added noise standard deviation gave a noise propagation factor for that parameter. This evaluates the sensitivity of the parameters to measurement noise and can help decide the feasibility of estimating the parameter. By way of an example, PDFF estimation (propagation factor ~10) is generally known to be feasible, whereas NDB estimation (propagation factor ~100) would require substantially higher signal to noise ratio or more measurements.
Figure 3 shows the noise propagation when fitting all the fat properties independently (NDB, NMIDB and CL). Figure 4 shows the effect of employing prior knowledge constraints on NMIDB and CL. It is interesting to note that NMIDB in Figure 3 has a lower noise propagation factor than NDB. Coupling NDB and NMIDB causes the noise amplification of NDB to resemble that of NMIDB, which improves (decreases) the NDB amplification factor by a factor of 2.
Figure 4 shows in vivo results from patients. Spectroscopy in panel A shows the correlation between visceral and subcutaneous measurements of NDB. There is a strong correlation of NDB between the depots, although the regression parameters do not support 1:1 agreement, which indicates systematic differences in NDB between the depots. The imaging results in panel B compare estimates of the subcutaneous NDB versus the globally estimated NDB over all pixels. The global NDB is an (abundance weighted) average of the NDB in all depots and, as such, it should be comparable to an average of the subcutaneous and visceral NDB. A similar correlation to panel A is observed, reflecting systematic differences in the subcutaneous and global (subcutaneous + visceral) depots.
Panel C shows the correlation between NBB estimated by spectroscopy and imaging in the subcutaneous depot. While the estimates are similar, the regression parameters do not show 1:1 agreement which suggests a bias in the imaging estimate (since spectroscopy is assumed to be the reference standard). Panel D shows the correlation between NDB and the NAFLD Activity Score (NAS) assessed by histology. A significant correlation was not observed.

4. Discussion

The present study is, to date, the largest cross-sectional study of triglyceride saturation using MR techniques and the first to look for correlation with the NAFLD Activity Score (NAS). Previous studies have demonstrated proof of concept and developed optimizations using phantoms and volunteers [32].
The limitations of NDB measurement with 16 echos was investigated by numerical simulations. These simulations are comparable to those described in Ref. [14], which defined a “signal to noise ratio” for each parameter as the mean value divided by the standard deviation over a large number of simulations. The same ratios can be estimated from the results in Figure 3 to be 1.00:0.09:0.05:0.17 for PDFF, NDB, NMIDB and CL, respectively, at PDFF = 50%, which are broadly similar to those shown in Figure 2B of Ref. [14]. It is simple to exhaustively find echo times that minimize the noise propagation; however, in practice, the demands of scan time and spatial coverage dictate these choices. Limited testing indicated that modest improvements are possible by increasing the number of echos and/or the echo spacing, but overcoming one to two orders of magnitude of noise amplification would appear to be out of reach by such modifications.
Measurements of NDB from spectroscopy indicate that the subcutaneous and visceral depots appear to be uniform. MRS studies show only minor differences in TC in adipose tissue [12] and a dependance of TC on PDFF in the liver [33]. The similarity supports the use of a single “global” NDB value on a per patient basis, as proposed in Ref. [2] for calibrating the fat spectrum from automatically segmented adipose tissues. The results in the present study also show that differences between subjects are larger than those between depots, similar to that seen in MRS [12].
Given the role of adipose tissue in metabolism, it seems plausible that the saturation of the fatty acids should be reflected in clinical disorders. MRS studies have suggested that the liver TC becomes more saturated as PDFF increases [33], and NAFLD subjects preferentially store excess hepatic lipids as saturated fat, at the expense of unsaturated fat, compared to controls [26]. Development of MRI techniques capable of determining saturation may be an important goal for predicting the 20% of NAFLD patients that go on to serious liver disease; however, the methods and evaluation require much improvement. Modeling approaches to improve the estimation problem are on-going [8,13,14,33,34,35].
In summary, the present study explored the feasibility of assessing TC by MRI and tested the approach in a large cohort of subjects. Results are similar to those obtained by MRS, which show only minor differences between depots.

Author Contributions

Conceptualization, M.B., G.H. and C.S.; methodology, T.C. and C.S.; software, M.B.; validation, J.L., W.H. and R.L.; formal analysis, M.B. and C.S.; investigation, R.C. and N.P.; resources, J.S.; data curation, R.L. and A.D.P.; writing—original draft preparation, M.B. and G.H.; writing—review and editing, C.S.; visualization, G.H.; supervision, G.H.; project administration, C.S.; funding acquisition, M.B., C.S., R.L. and J.S. All authors have read and agreed to the published version of the manuscript.

Funding

This research was funded by GE Healthcare and NIH grants R56 DK090350, R01 DK075128, R01 DK088925, U01 DK061734.

Institutional Review Board Statement

This was a prospective, cross-sectional study approved by our Institutional Review Board (IRB) and compliant with the Health Insurance Portability and Accountability Act, under IRB Name UCSD Human Research Protections Program (approved 4/6/2006 and 3/18/2010 with code/number 060370 and 100377).

Informed Consent Statement

Adult and pediatric human subjects were recruited from clinical NAFLD studies conducted at our institution. Adults aged 18 years and older provided written informed consent. For pediatric subjects aged 8–17 years, written consent was obtained from a parent and written assent from the child.

Conflicts of Interest

The authors declare no conflict of interest.

References

  1. Bydder, M.; Yokoo, T.; Hamilton, G.; Middleton, M.S.; Chavez, A.D.; Schwimmer, J.; Lavine, J.E.; Sirlin, C. Relaxation effects in the quantification of fat using gradient echo imaging. Magn. Reson. Imaging 2008, 26, 347–359. [Google Scholar] [CrossRef] [Green Version]
  2. Yu, H.; Shimakawa, A.; McKenzie, C.; Brodsky, E.; Brittain, J.H.; Reeder, S. Multiecho water-fat separation and simultaneous R2 estimation with multifrequency fat spectrum modeling. Magn. Reson. Med. 2008, 60, 1122–1134. [Google Scholar] [CrossRef] [Green Version]
  3. Reeder, S.B.; Hu, H.H.; Sirlin, C. Proton density fat-fraction: A standardized mr-based biomarker of tissue fat concentration. J. Magn. Reson. Imaging 2012, 36, 1011–1014. [Google Scholar] [CrossRef]
  4. Bashir, M.R.; Zhong, X.; Nickel, M.D.; Fananapazir, G.; Kannengiesser, S.A.R.; Kiefer, B.; Dale, B.M. Quantification of Hepatic Steatosis With a Multistep Adaptive Fitting MRI Approach: Prospective Validation Against MR Spectroscopy. Am. J. Roentgenol. 2015, 204, 297–306. [Google Scholar] [CrossRef] [PubMed]
  5. Caussy, C.; Reeder, S.B.; Sirlin, C.B.; Loomba, R. Noninvasive, Quantitative Assessment of Liver Fat by MRI-PDFF as an Endpoint in NASH Trials. Hepatology 2018, 68, 763–772. [Google Scholar] [CrossRef] [PubMed] [Green Version]
  6. Yokoo, T.; Serai, S.D.; Pirasteh, A.; Bashir, M.R.; Hamilton, G.; Hernando, D.; Hu, H.H.; Hetterich, H.; Kühn, J.-P.; Kukuk, G.M.; et al. Linearity, Bias, and Precision of Hepatic Proton Density Fat Fraction Measurements by Using MR Imaging: A Meta-Analysis. Radiology 2018, 286, 486–498. [Google Scholar] [CrossRef] [PubMed]
  7. Reeder, S.B.; Cruite, I.; Hamilton, G.; Sirlin, C.B. Quantitative Assessment of Liver Fat with Magnetic Resonance Imaging and Spectroscopy. J. Magn. Reson Imaging 2011, 34, 729–749. [Google Scholar] [CrossRef]
  8. Ren, J.; Dimitrov, I.; Sherry, D.; Malloy, C.R. Composition of adipose tissue and marrow fat in humans by 1H NMR at 7 Tesla. J. Lipid Res. 2008, 49, 2055–2062. Available online: http://www.jlr.org/lookup/doi/10.1194/jlr.D800010-JLR200 (accessed on 23 September 2021). [CrossRef] [Green Version]
  9. Hamilton, G.; Yokoo, T.; Bydder, M.; Cruite, I.; Schroeder, M.E.; Sirlin, C.B.; Middleton, M.S. In vivo characterization of the liver fat 1H MR spectrum. NMR Biomed. 2011, 24, 784–790. [Google Scholar] [CrossRef] [Green Version]
  10. Dimitrov, I.; Douglas, D.; Ren, J.; Smith, N.B.; Webb, A.G.; Sherry, D.; Malloy, C.R. In vivo determination of human breast fat composition by 1H magnetic resonance spectroscopy at 7 T. Magn. Reson. Med. 2012, 67, 20–26. [Google Scholar] [CrossRef] [Green Version]
  11. Hamilton, G.; Smith, D.L., Jr.; Bydder, M.; Nayak, K.; Hu, H.H. MR properties of brown and white adipose tissues. J. Magn. Reson. Imaging 2011, 34, 468–473. [Google Scholar] [CrossRef] [Green Version]
  12. Hamilton, G.; Bs, A.N.S.; Middleton, M.S.; Bs, C.A.H.; Wolfson, T.; Gamst, A.C.; Loomba, R.; Sirlin, C.B. In vivo triglyceride composition of abdominal adipose tissue measured by 1 H MRS at 3T. J. Magn. Reson. Imaging 2017, 45, 1455–1463. [Google Scholar] [CrossRef] [Green Version]
  13. Bydder, M.; Girard, O.; Hamilton, G. Mapping the double bonds in triglycerides. Magn. Reson. Imaging 2011, 29, 1041–1046. [Google Scholar] [CrossRef]
  14. Peterson, P.; Månsson, S. Simultaneous quantification of fat content and fatty acid composition using MR imaging. Magn. Reson. Med. 2013, 69, 688–697. [Google Scholar] [CrossRef]
  15. Wensveen, F.M.; Valentić, S.; Šestan, M.; Turk Wensveen, T.; Polić, B. Interactions between adipose tissue and the immune system in health and malnutrition. Semin. Immunol. 2015, 27, 322–333. [Google Scholar] [CrossRef]
  16. Hodson, L.; Skeaff, C.M.; Fielding, B.A. Fatty acid composition of adipose tissue and blood in humans and its use as a biomarker of dietary intake. Prog. Lipid Res. 2008, 47, 348–380. [Google Scholar] [CrossRef] [PubMed]
  17. Victor, T.A.; Bergman, A.; Knop, R.H. Detecting fatty acids of dietary origin in normal and cancerous human breast tissue by 13C nuclear magnetic resonance spectroscopy. Br. J. Cancer 1993, 68, 336–341. [Google Scholar] [CrossRef] [PubMed] [Green Version]
  18. Darabi, M.; Pezeshkian, M.; Noori, M.; Najjarpour-Jabbari, H.; Abolfathi, A.; Darabi, M.; Darabi, M.; Shaaker, M.; Shahmohammadi, G. Fatty acid composition of epicardial and subcutaneous human adipose tissue. Metab. Syndr. Relat. Disord. 2009, 7, 125–132. [Google Scholar]
  19. Lundbom, J.; Hakkarainen, A.; Söderlund, S.; Westerbacka, J.; Lundbom, N.; Taskinen, M.-R. Long-TE 1H MRS suggests that liver fat is more saturated than subcutaneous and visceral fat. NMR Biomed. 2010, 24, 238–245. [Google Scholar] [CrossRef] [PubMed]
  20. Pond, C.M. The Fats of Life; Cambridge University Press: Cambridge, UK, 1998; Available online: https://www.cambridge.org/core/product/identifier/9780511584633/type/book (accessed on 23 September 2021).
  21. Simonsen, N.; Van’t Veer, P.; Strain, J.J.; Martin-Moreno, J.M.; Huttunen, J.K.; Navajas, J.F.C.; Martin, B.C.; Thamm, M.; Kardinaal, A.F.M.; Kok, F.J.; et al. Adipose tissue omega-3 and omega-6 fatty acid content and breast cancer in the euramic study. Am. J. Epidemiol. 1998, 147, 342–352. [Google Scholar] [CrossRef] [PubMed] [Green Version]
  22. Thakur, S.B.; Horvat, J.V.; Hancu, I.; Bs, O.M.S.; Bernard-Davila, B.; Weber, M.; Oh, J.H.; Marino, M.A.; Avendano, D.; Leithner, D.; et al. Quantitative in vivo proton MR spectroscopic assessment of lipid metabolism: Value for breast cancer diagnosis and prognosis. J. Magn. Reson. Imaging 2019, 50, 239–249. [Google Scholar] [CrossRef] [PubMed]
  23. Manco, M.; Greco, A.; Capristo, E.; Gniuli, D.; De Gaetano, A.; Gasbarrini, G. Insulin resistance directly correlates with increased saturated fatty acids in skeletal muscle triglycerides. Metabolism 2000, 49, 220–224. [Google Scholar] [CrossRef]
  24. Iggman, D.; Ärnlöv, J.; Vessby, B.; Cederholm, T.; Sjögren, P.; Risérus, U. Adipose tissue fatty acids and insulin sensitivity in elderly men. Diabetology 2010, 53, 850–857. [Google Scholar] [CrossRef] [Green Version]
  25. Leporq, B.; Lambert, S.; Ronot, M.; Vilgrain, V.; Van Beers, B. Simultaneous MR quantification of hepatic fat content, fatty acid composition, transverse relaxation time and magnetic susceptibility for the diagnosis of non-alcoholic steatohepatitis. NMR Biomed. 2017, 30, e3766. [Google Scholar] [CrossRef] [PubMed]
  26. Erickson, M.L.; Haus, J.M.; Malin, S.K.; Flask, C.A.; McCullough, A.J.; Kirwan, J.P. Non-invasive assessment of hepatic lipid subspecies matched with non-alcoholic fatty liver disease phenotype. Nutr. Metab. Cardiovasc. Dis. 2019, 29, 1197–1204. [Google Scholar] [CrossRef] [PubMed]
  27. Bydder, M.; Hamilton, G.; Yokoo, T.; Sirlin, C.B. Optimal phased-array combination for spectroscopy. Magn. Reson. Imaging 2008, 26, 847–850. [Google Scholar] [CrossRef] [Green Version]
  28. Vanhamme, L.; van den Boogaart, A.; Van Huffel, S. Improved Method for Accurate and Efficient Quantification of MRS Data with Use of Prior Knowledge Leentje. J Magn. Reson. 1997, 129, 35–43. [Google Scholar] [CrossRef] [Green Version]
  29. Naressi, A.; Couturier, C.; Devos, J.M.; Janssen, M.; Mangeat, C.; De Beer, R.; Graveron-Demilly, D. Java-based graphical user interface for the MRUI quantitation package. Magn. Reson. Mater. Phys. Biol. Med. 2001, 12, 141–152. [Google Scholar] [CrossRef] [PubMed]
  30. Berglund, J.; Ahlström, H.; Kullberg, J. Model-based mapping of fat unsaturation and chain length by chemical shift imaging-phantom validation and in vivo feasibility. Magn. Reson. Med. 2012, 68, 1815–1827. [Google Scholar] [CrossRef] [PubMed]
  31. Kleiner, D.E.; Brunt, E.M.; Van Natta, M.; Behling, C.; Contos, M.J.; Cummings, O.W.; Ferrell, L.D.; Liu, Y.-C.; Torbenson, M.S.; Unalp-Arida, A.; et al. Design and validation of a histological scoring system for nonalcoholic fatty liver disease. Hepatology 2005, 41, 1313–1321. [Google Scholar] [CrossRef]
  32. Peterson, P.; Trinh, L.; Månsson, S. Quantitative 1 H MRI and MRS of fatty acid composition. Magn. Reson. Med. 2021, 85, 49–67. [Google Scholar] [CrossRef] [PubMed]
  33. Hamilton, G.; Schlein, A.N.; Wolfson, T.; Cunha, G.M.; Fowler, K.J.; Middleton, M.S.; Loomba, R.; Sirlin, C.B. The relationship between liver triglyceride composition and proton density fat fraction as assessed by 1 H MRS. NMR Biomed. 2020, 33, e4286. [Google Scholar] [CrossRef] [PubMed]
  34. Bydder, M.; Hamilton, G.; De Rochefort, L.; Desai, A.; Heba, E.R.; Loomba, R.; Schwimmer, J.B.; Szeverenyi, N.M.; Sirlin, C.B. Sources of systematic error in proton density fat fraction (PDFF) quantification in the liver evaluated from magnitude images with different numbers of echoes. NMR Biomed. 2018, 31, e3843. [Google Scholar] [CrossRef] [PubMed] [Green Version]
  35. Bydder, M.; Ghodrati, V.; Gao, Y.; Robson, M.D.; Yang, Y.; Hu, P. Constraints in estimating the proton density fat fraction. Magn. Reson. Imaging 2020, 66, 1–8. [Google Scholar] [CrossRef] [PubMed]
Figure 1. Coronal and oblique opposed-phase images (TE 1.3 and 1.5 ms, respectively) of a female subject with areas indicated where ROIs were drawn in the liver and two adipose tissue depots.
Biophysica 02 00002 g001
Figure 2. Typical fitted results for the coronal slice in Figure 1: (A) B0 in kHz, (B) R2* in s−1, (C) fat fraction, (D) NDB and (E) initial phase in radians.
Biophysica 02 00002 g002
Figure 3. Noise propagation (defined as the standard deviation of the fitted parameter divided by the standard deviation of the noise added to the data points) for key fitted parameters. In panel (A), all the fat properties were free parameters, whereas, in panel (B), two constraints were used to fix NMIDB and CL in relation to NDB. The NDB is around two orders of magnitude more sensitive to noise than PDFF and noise propagation increases dramatically as PDFF decreases to zero. Using constraints on NMIDB and CL decreases the noise propagation of NDB by a factor of approximately 2.
Biophysica 02 00002 g003
Figure 4. (A) Spectroscopy: panel A shows the correlation between visceral and subcutaneous measurements of triglyceride saturation (no. double bonds) by STEAM spectroscopy. (B) Imaging: panel B compares estimates of the subcutaneous NDB versus the globally estimated NDB over all pixels. Since the global NDB is an (abundance weighted) average of the NDB in all depots, it should be comparable to an average of thepectroscopy values. (C) Spectroscopy versus imaging: panel C shows the correlation between NBB estimated in the subcutaneous depot using spectroscopy and imaging. While estimates are similar, the regression parameters do not show 1:1 agreement. (D) Spectroscopy NDB versus NAS: Panel D shows the correlation in NDB versus the NAFLD Activity Score (NAS) assessed by histology. A significant correlation was not observed.
Biophysica 02 00002 g004
Publisher’s Note: MDPI stays neutral with regard to jurisdictional claims in published maps and institutional affiliations.

