Abstract
The detection and enrichment of circulating melanoma cells is a challenge, as the cells are very heterogeneous in terms of their biomechanical properties and surface markers. In addition, there is a lack of valid and reliable biomarkers predicting progress and therapeutic response. In this study, we analyze the elasticity of A375 melanoma cells by applying force spectroscopy and a microfluidic method. To identify and eventually separate freely circulating tumor cells, it is crucial to know their physical properties precisely. First, we use standard AFM force spectroscopy, where the elasticity of the cells is calculated from indentation with a pyramidal tip. To extend the limits of the measurements with a tip, we then use cantilevers without a tip to apply force over a larger area of the cells. The resulting Young’s moduli are slightly lower and vary less without the tip, presumably because of the spatial inhomogeneity of the cells. Finally, we implement our microfluidic method: we measure single cell elasticity by analyzing their deformation in high-speed micrographs while passing a stenosis. Combining the force field and the change in shape provides the basis for a stress–strain diagram. The results from the microfluidic deformation analysis were well in accordance with the results from force spectroscopy. The microfluidic method, however, provides advantages over conventional methods, as it is less invasive and less likely to harm the cell during the measurement. The whole cell is measured as one entity without having contact to a stiff substrate, while force spectroscopy is limited to the contact area of the tip, and in some cases dependent of the cell substrate interaction. Consequently, microfluidic deformation analysis allows us to predict the overall elastic behavior of the whole, inhomogeneous cell in three-dimensional force fields. This method may contribute to improve the detection of circulating melanoma cells in the clinical practice.
1. Introduction
During the last decade, circulating tumor cells (CTCs) gained increasing attention as prognostic biomarkers [1]. They may be detected at any time of the disease and have been associated with disease prognosis, prediction of response to treatment and early detection of treatment resistance, or are simply used to gain access to tumor cells for analysis when a biopsy cannot be performed [2,3]. Challenges are the low concentration of CTCs, and their physical similarity to leucocytes. In malignant melanoma in particular, there is great heterogeneity in the circulating melanoma cells with regard to their surface markers and the physical cell properties, such as size and plasticity [4], which renders enrichment and sorting challenging. Pathological changes, such as tumor formation and metastasis, often become apparent through altered mechanical properties of the cells [5]. The deformability plays a crucial role in extravasation of both leukocytes and melanoma cells [6]. To make use of these properties to optimize, e.g., a mechanical filter system, it is of vital importance to determine small differences in elasticity and size between different cell types. The A375 (ATCC® CRL-1619™) cell line is a human melanoma cell line initiated through explant culture of a solid tumor from a 54-year-old female and has been used to, for example, obtain paracrine factors for the prolonged culture of mesenchymal stromal cells [7]. On that basis, we study the elasticity of A375 melanoma cells using force spectroscopy (FS) and microfluidic deformation analysis.
Common methods of determining elasticity are particle-tracking microrheology, optical stretching, micropipette aspiration and microindentation [5,8,9]. In particle-tracking microrheology, fluorescent particles are injected into cells to visualize thermal vibrations [10]. How the particles themselves are affecting the measured mechanical properties, however, is not clear [5]. Optical stretching combines a dual laser beam and a microfluidic system. The cells are caught in an optical trap and stretched in a well-defined manner. Here, the elasticity is then calculated from changes in the refractive index [8]. The concept of micropipette aspiration is based on applying a negative pressure to a pipette tip in contact with the cell surface [11]. The elasticity calculated from the deformation of the aspired piece of membrane predominantly describes the properties of the membrane, and not of the entire cell body [5]. Force spectroscopy with an atomic force microscope (AFM) or, more generally, microindentation, is a method to punch an indenter with well-defined geometry into a cell. The resulting force-indentation curves allow for the determination of the Young’s moduli of cells by fitting them, e.g., to the Hertz model [5]. Depending on the method, the level of applied mechanical stress, the rate of deformation, the geometry of the probe, the location probed in the cell and the extracellular micro environment, the obtained results can vary by up to a factor of 1000 [8].
Hochmuth et al. use micropipette aspiration to distinguish cell types that behave like a fluid droplet from those behaving like a solid. Applying the negative pressure to the cell surface, the length of the aspirated membrane section increases linearly with increasing absolute pressure. Once aspirated, a fluid-like cell overcomes a critical pressure, above which it slides into the pipette without resistance. For a solid-like cell, the linear relation of pressure and aspirated length is sustained. They find neutrophils to behave fluid-drop-like, with a surface tension of about 30 pN/µm and a viscosity to the order of 100 Pa s, while chondrocytes and endothelial cells are 100 times stiffer and behave solid-like with an elastic modulus to the order of 0.5 kPa [12].
Hu et al. developed a microcytometer to calculate the cell’s elasticity from its deformation when squeezing into a microfluidic constriction. They distinguish between small and large deformations and find cancerous cells with significantly softer under small deformation than a normal breast epithelial cell line with . Under large deformation, however, when the cell nucleus also becomes deformed, the Young’s modulus rises to and the difference between the cell lines vanishes [13].
Loizeau et al. measure metastatic WM239 melanoma cells by force spectroscopy employing a spherical tip and find low values of . Moreover, Kuznetsova et al. present elastic moduli of various cell lines while reviewing the AFM force spectroscopy results of several groups. They report leukocytes to be significantly softer ( than any other cell type. Endothelial cells, osteoblasts, astrocytes and fibroblasts all range in between , while erythrocytes and muscle cells are stiffer, at . The highest reported Young’s Modulus exhibit cardiocytes with [14].
There is a lack of a comprehensive overview of melanoma cell elasticity, particularly one describing the elasticity at the whole cell level. Here, we apply two methods to the melanoma model cell line A375 to fill this gap. The first approach is AFM force spectroscopy, where we step away from the usual cantilever with a tip. A pointy tip carries the risk of puncturing and damaging the cell [15], while a large, spherical tip may catch more of the substrate [16]. Abandoning the tip and pressing on the cell with the flat side of the 20 μm wide cantilever, we measure not only local elastic properties, but rather the elasticity of the whole cell as a homogeneous object.
However, even for small indentations, an indirect influence of the substrate to the elasticity of the cell is possible. Thus, especially for cells, which either grow in vivo in a soft environment or circulate in the blood flow, it might be more appropriate and advantageous to use a method that studies the cell as one whole object in a fluid instead of punctuating it. There exist several microfluidic approaches that are either based on the pressure drop or on the quantification of the cell deformation during the passage of cells through a stenosis. Also, hybrid approaches combining FS with pressure drop measurements have been recently reported [17]. Chen et al., for example, reported a microfluidic system for the accurate measurement of cell elasticity in real-time by the detection of the pressure drop during deformation of each cell passing a stenosis [18]. Other studies employ a microfluidic cross-slot device to elongate single cells and to measure cellular mechanical properties based on the cell deformation [19,20,21]. Moreover, there are reports on rapid cell deformability measurements with a device that squeezes cells into a bullet shape as the cells pass through constrictions [22,23]. We, in addition to FS, employ a microfluidic method of that kind. We combine the theoretical approach to calculate the Young’s modulus from Dudani et al. [20] and Armistead et al. [21] with a channel geometry comparable to the work of Guck and coworkers [22,23].
The structure of the paper is as follows: first, we use FS with conventional pyramidal tips to elucidate the local elasticity of A375 cells. Secondly, we use FS with tipless cantilevers to determine global elastic parameters of these cells. Finally, we use deformation measurements employing our microfluidic device to probe the cell elasticity under flow without potential influence of a substrate.
2. Methods
2.1. Cell Culture
The A375 cells (ATCC® CRL-1619™) being studied are human malignant melanoma cells. They were cultivated under standard conditions of 37 °C and 5% CO2 in DMEM (30-2002, ATCC, Manassas, VA, USA) containing 10% FBS (Bio&SELL GmbH, Feucht bei Nürnberg, Germany) and 1% Penicillin-Streptomycin (Sigma–Aldrich Chemie GmbH, Steinheim, Germany).
2.2. Force Spectroscopy
Force spectroscopy on adherent A375 melanoma cells was performed with a NanoWizard BioAFM (JPK instruments AG, Berlin, Germany) on PLL-coated glass (coating with Poly-L-Lysine, 0.1% w/v, in water, Thimerosal, 0.01%, added as preservative, Sigma-Aldrich Chemie GmbH, Steinheim, Germany), diluted in phosphate buffered saline (4:996 PLL:PBS) and incubated for 1 h at room temperature) in DMEM suspension. The cell was approached at 1 µm/s until reaching a set point of 2 nN, followed by retraction after a pause of 1 s. The first micrometer of indentation represents the input to extract the Young’s modulus from typically ten force distance curves.
For the “AFM with tip” measurements, a pyramid-shaped tip of the type MLCT-BIO (Bruker company, MA, USA) [24] with an edge length of about 3 μm, tip radius 20 nm, an angle of α = 35° and a cantilever stiffness of 30 mN/m is used. “AFM without tip” implies that 20 μm wide cantilevers without a tip are being used (MLCT-010-D, Bruker Company, Billerica, MA, USA). To adjust the model underlying the fit function, we approximate the geometry by a spherical shape with the radius R = 10 μm. Statistics on the cantilever spring constants are summarized in Table S1.
2.3. Microfluidic Method Microchannel Design and Measurement Setup
The microchannel consists of a polydimethylsiloxane (PDMS) single layer fabricated by standard soft lithography [25], which was bonded onto a glass slide by plasma activation. Generally, all channels were 7 mm long, 27 μm deep and 50 μm wide. The central part of interest is comprised of a single stenosis, in which the channel width was reduced from 50 μm to 5 μm or 7 μm. The elongation length, i.e., the length over which the channel width is reduced from 50 µm to the stenosis, is either 55 µm or 165 µm. The setup consisted of the microchannel, a pipette tip serving as the cell suspension reservoir and a syringe pump (Harvard PHD2000, Harvard Apparatus, Holliston, MA, USA). A Hamilton Gastight Syringe (Hamilton Bonaduz AG, Bonaduz, Switzerland) containing phosphate buffered saline (PBS, pH = 7.4) was connected to the microchannel via a polyfluoroethylene (PTFE) tube. The pump was operated in reverse mode to provide a controlled flow by drawing the suspension from the reservoir through the microfluidic channel at a flow rate of Q = 75 µL/h. We observed the cells using the 20× objective of an inverted microscope (Zeiss Axiovert200) equipped with a high-speed video camera (FASTCAM Mini UX50 type 160K-M-16G, Photron GmbH, Reutlingen, Germany). The videos were recorded with the software Photron Fastcam Viewer PFV from Photron at 2000 frames per second, 1280 × 120 pixel resolution, 1/40,000 s exposure resulting in a maximum total of 74 531 frames or 37 s in real time, covering an area of 704 × 66 μm². For analysis, we adapted our customized software SURF, introduced earlier [26,27].
2.4. Statistics
For the determination of a mean Young´s modulus E using AFM with pyramidal tips and with 6 tipless cantilevers (3 each), independent preparations with a total of N = 42 to 50 cells were analyzed, resulting in a mean cell Young´s modulus for each cell from the first ten indentation curves:
Averaging over all N cells is supported by the calculation of intraclass correlation coefficients. The value compares the results of the different days. The value examines the variations between the individual cells. Details for the calculation are shown in the Supplementary Materials.
In the microfluidic experiments, three independent experiments from separate preparations were carried out. Here, in contrast to FS, no value for E of a single cell is determined, as velocity and strain along the channel are calculated from mean trajectories of M ~ 2500 cells.
3. Results
3.1. Elasticity of Melanoma Cells—Force Spectroscopy
Firstly, we apply force spectroscopy (FS) to determine the distribution of Young´s moduli of A375 cells. As mentioned in the introduction, to consider global elasticities on the level of the whole cell in particular, in addition to FS with a pyramidal tip, we also use tipless cantilevers. Figure 1A shows an adherent A375 cell on a slide coated with PLL and the cantilever with and without a tip. As illustrated in Figure 1B, the Young´s modulus of these cells was determined using conventional cantilevers with a pyramidal tip and also with a tipless cantilever. Typical indentation curves, including the approach and retraction curves, are shown in Figure 1C. By fitting the indentation curves in the indentation range of 0 µm < δ < 1 µm and applying a Hertz-model, the Young’s modulus E was extracted from each curve. In force spectroscopy, usually several hundred of such scans are performed for one measurement. To avoid damages by the frequent indentation for both AFM measurements with and without tip, typically the first ten indentation curves of each cell were analyzed (for more descriptive statistics see Table S2 and Figure S2). More extensive tests with a tip show that for n = 100 repetitions the cell appears slightly stiffer, and from n = 200 on they are significantly stiffer than at the beginning (see Supplementary Materials Figure S1).
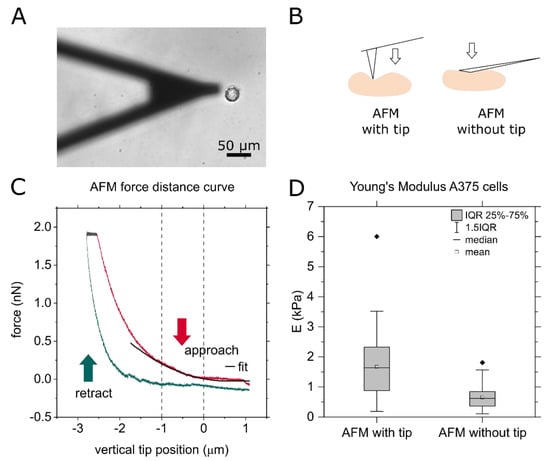
Figure 1.
(A) Micrograph of a cantilever without tip approaching an adherent A375 cell. (B) Principle AFM with and without tip. (C) Force–distance curve of an exemplary measurement with cantilever stiffness k = 0.03 N/m, force set point f = 2 nN, approaching speed v = 1 µm/s and approaching distance d = 5 µm. The pause between approach and retract is 1 s at constant force. (D) Comparison of AFM force spectroscopy results of the Young’s modulus of A375 cells using a cantilever with tip and one without tip. The boxplot summarizes the results on about 50 cells with approximately ten force curves per cell of AFM measurements with and without tip. The cantilever without tip is 20 μm wide at the front, and the tip radius of the approximately 3 μm long tips used here is 20 nm.
For the two different measuring methods “AFM with tip” and “AFM without tip”, the values for the elasticity of the A375 cells differ, as shown in Figure 1D. Without the tip, representing a more global Young´s modulus, we found the elastic modulus to be E = 660 Pa ± 371 Pa. With tip, representing a local Young´s modulus, the elastic modulus is higher with E = 1671 Pa ± 1111 Pa, and the width of the distribution is larger. For each method, with and without tip, about 50 cells were measured over three measurement days, involving ten force curves for each cell. To answer the question whether the variation of E is dominated by the variation between different samples, i.e., cell preparations at different days, by the variation from cell to cell, or between different approaches on each cell, we determine the respective sample ICC values [28]. We compare the range of the results obtained on a single day to the variation between the measurement days. This ICC is close to zero in the without tip case (ICCday, no tip = −0.08), and with the tip we find a low ICC of ICCday, tip = 0.2. Comparing the scattering of the values within one cell to the differences between cells, however, results in high ICC values (ICCcell, no tip = 0.84, ICCcell, tip = 0.66). In conclusion, the values correlate strongly within a cell, and therefore only mean values over each cell are summarized in the box plot. The low ICCday values justify treating each cell as an independent measurement. This means that the biological variation is the main origin of the broad range of obtained results for the Young´s modulus E. The lower correlation and wider distribution for the results with the tip might arise for two reasons: If the cell is penetrated, higher values may occur because the underlying harder substrate contributes to the effective elasticity [29]. In addition, the inhomogeneity of the cell has a greater influence on the result with a smaller contact area.
In the following, we will focus on the latter argument. To quantify and describe the alluded inhomogeneity of the cells, we move on to scan single cells systematically with an AFM tip by choosing equidistant measurement positions with x- and y- spacing of 1.5 µm. Figure 2A shows an exemplary map of an A375 cell. The central part, where the nucleus is located (compare Figure 2C) is roughly 10 times harder than the outer areas (compare Figure 2B). As only one force curve is recorded per measuring point, the entire curve is fitted so that minor artifacts do not distort the result.
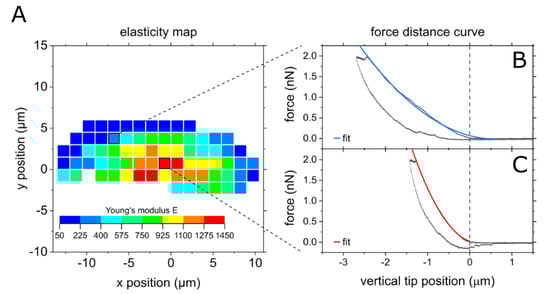
Figure 2.
AFM force spectroscopy mapping of a cell using a cantilever with tip. (A) Map of half a cell, measurement started at the center of the cell. (B) Typical force distance curve from the softer outer area, (C) typical force distance curve from the central, stiffer part.
We now compare these local elasticity differences to reported results in the literature, where we find a broad range of results. In summary, the morphology and elasticity landscape appear to depend strongly on the cell type. Hayashi et al., for example, compare human cervical cancer cells and normal cervical cells and find the cancerous cells to be softer, but when comparing central and peripheral elasticity, cancerous cells appear homogenous while the normal cells, comparable to our A375 cells, had a stiffer central body [30]. Galajda et al. image confluent human brain endothelial cells and find, contrary to our results, the cell body to be softer than the outer areas [31].
For such comparisons, it is important to know how sensitively the results depend on the measurement method. We thus continue by varying the loading rate. As we are more interested in the overall elastic behavior of A375 cells, we use cantilevers without a tip in the following. As the results differ strongly from cell to cell, and to be able to compare different cells, we normalize the Young’s modulus at different loading rates to a reference Young’s modulus, determined at a loading rate of a = 1.0 µm/s. In Figure 3 we show E as function of the cantilever´s approaching velocity, as this was the modified parameter. The actual loading rate in the unit N/s slightly differs from cell to cell, due to the variation in elasticity between the cells. The Young’s modulus E as a function of the logarithmic loading rate a exhibits a linear relation. Lowering the loading rate by a factor of five entails a decrease in Young’s modulus of 25%. Doubling the loading rate, however, raises the Young’s modulus by 10%. Thus, in the typical range of used trace velocities for FS of no drastic elasticity difference appears.
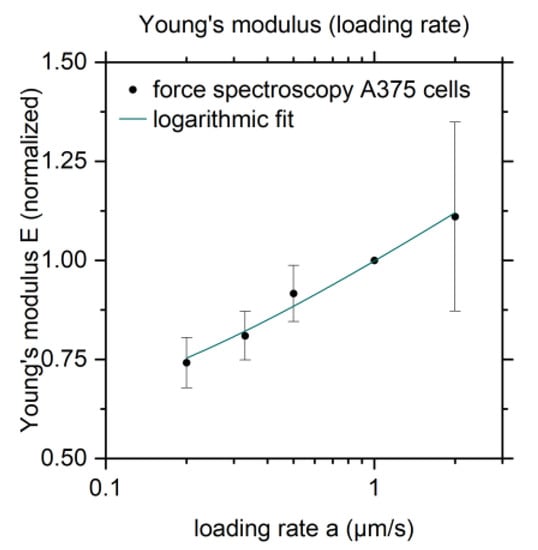
Figure 3.
Young’ modulus E as a function of the loading rate normalized to the Young’s modulus from reference measurements with a loading rate a = 1.0 µm/s. The logarithmic fit function is E = 0.98 + 0.19 ln (a + 0.1).
Li et al. study the elastic modulus of cancerous and benign human breast epithelial cells by AFM indenting with spherical tips. They find a stiffening with an increased loading rate as well, but the effect is stronger than in our experiments. The authors of that study report that benign cells had 1.4–1.8 times higher Young’s moduli than malignant cells, and the hardening effect is more pronounced [32]. Ren et al. vary the loading rate even over three orders of magnitude (loading frequency f = 0.2–100 Hz) to measure the elasticity of prostate cancer cells. The resulting Young’s moduli range from 2 kPa at f = 0.2 Hz to 10 kPa at f = 100 Hz for untreated cells. They state that the power law relation between Young’s modulus and frequency they find is characteristic for live human cells [33]. Moreover, Pogoda et al. study fibroblasts and A375 cells using an AFM with pyramidal tip for force spectroscopy. They average the measurements on a 12 × 12 point grid on each cell and find lower Young’s moduli upon deeper indentation. For indentation depths > 800 nm the value is stable at E = 760 Pa ± 370 Pa [34], which agrees well with our results.
However, even for small indentations an indirect influence of the substrate on the elasticity of the cell is possible. Thus, especially for cells, which either grow in an in vivo soft environment or freely circulate in the blood flow, it might be more appropriate and advantageous to use a method, which studies the cell as one whole object in a fluid, instead of punctuating it. Thus, we additionally employ a microfluidic method of that kind.
3.2. Elasticity of Melanoma Cells—Microfluidic Method
Finally, the deformation of A375 cells is analyzed during passage of a microfluidic channel with a diameter of 27 × 50 µm² containing a stenosis of 27 × 5 µm², as shown in Figure 4A. We chose these dimensions based on a size analysis of the cells and prior studies with erythrocyte aggregates [27]. At a flow rate of ~75 µL/h, high speed micrographs are recorded at 2000 fps and 1/40,000 s exposure. As they are exemplary, such micrographs are shown in Figure 4B. The cells are traced from frame to frame using the customized MATLAB script “SURF” [27]. Employing this method to determine the Young´s modulus E, we calculate E from the stress–strain diagram. Here, the strain ε is directly extracted from the images, while the stress is calculated analytically.
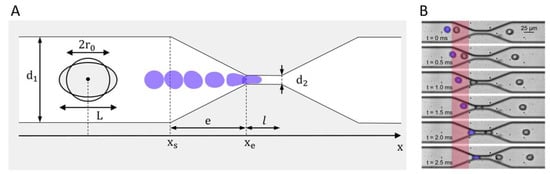
Figure 4.
(A) Design of the microfluidic stenosis narrowing from diameter d1 to diameter d2 over the elongational length e. The cell deforms from a round shape with its original diameter d = 2r0 to an ellipse with major axis L. (B) Exemplary micrographs of A375 cells passing a standard elongation d = 7 µm stenosis. The area for the deformation analysis is highlighted in red.
To extract the strain from our measurements, an elliptical shape is used to approximate the cell outlines. The values for the major and the minor axis are plotted as a function of x-position in the channel for all traced cells (typically ~2500 cells), and then fitted by an exponential function to describe the deformation by one representative, continuous function combining the data of these ~2500 cells, see Figure 5A. The strain ε is the relative change from the initial diameter of a round cell to the elongated length L, which is the major axis of the ellipse, as shown in Figure 4A.
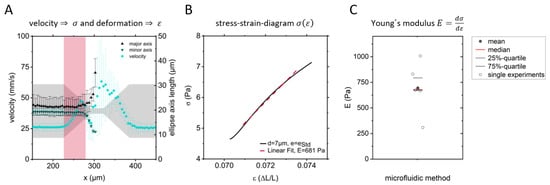
Figure 5.
(A) Velocity, major and minor ellipse axes from one measurement as function of the position x. Mean and standard deviation from 2300 cell trajectories. (B) Stress–strain diagram and linear fit to determine the Young’s modulus of one set of A375 cells. (C) Resulting Young’s moduli from six independent measurements as shown in B, representing about 2500 cells each.
To calculate the strain, which is the force per area, we follow Dudani et al. and Armistead et al. and transfer their approach to calculate the forces in a “hydropipette”, represented by a cross channel where the cells are compressed by confluent streams. Assuming that the narrowing walls of a stenosis behave comparably to Dudani’s “hydropipetting”, we find the following expression for the total force on the flowing object in a microfluidic channel. Here we assume a compressive component and a shear force component , including the parameters fluid density ρ, fluid viscosity μ, velocity v, drag coefficient , cell cross section and cell radius r [20,21].
As the force varies significantly over the extent of a cell, at each position in the channel, the strain is calculated as weighted average of the force per area in steps of one pixel from cell rear to cell front.
In summary, the stress acting on the cells in a stenosis is calculated from the velocity (Figure 5A), the cell size, and the resulting drag and shear force, which finally allows to plot the stress as a function of the strain. For a linear elastic material, the Young’s modulus is given by the slope of a stress–strain diagram. Analyzing the strain from our data, as being shown in Figure 5A, and calculating the stress from the data shown, together with some additional information, such as geometry, we obtain a stress–strain diagram, as shown in Figure 5B. It summarizes all ~2500 cell trajectories of one measurement. Figure 5C, finally, displays the resulting Young’s moduli for six independent measurements ranging from E = 300 Pa to E= 1000 Pa.
For comparison, we examine the work of Otto et al. on the mechanical characterization of cells using flow cytometry [22,35]. Adapting their model and using the deformation and size of the cells studied here as inputs, we can predict the Young’s modulus to be in the range of E = 500–800 Pa, which is in line with our results.
3.3. Limitations of the Method
When using the microfluidic method, and while cells are not being harmed punctually, as it is possible in force spectroscopy, there are still indications that the cells do not run completely unaffected through the measurement. Figure 6 shows the deformation of the cells as a function of the x-position along the main axis of the channel. The deformation is measured by approximating the cell’s outline by an ellipse and evaluating its eccentricity ε.
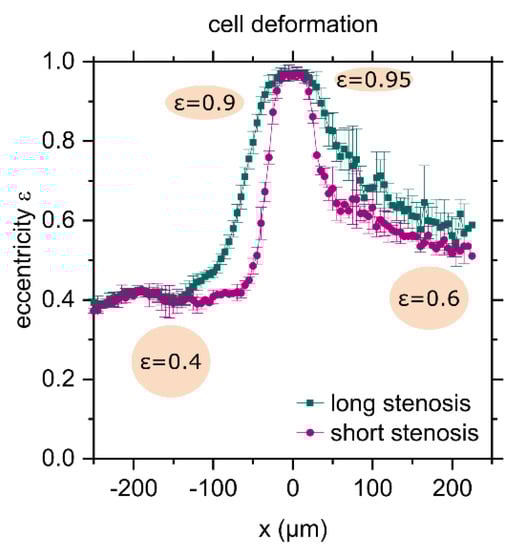
Figure 6.
Cell deformation as a function of the x-position; the center of the stenosis is at x = 0. The shape of the cell is approximated by an ellipse. The eccentricity ε of an ellipse is the distance between the foci divided by the major axis length. The labelled ellipses illustrate the values. “Long” and “short” stenosis refers to stenoses with length e = 165 µm and e = 55 µm, respectively.
The plotted eccentricity is the ratio of the distance between the foci of the ellipse and its major axis length. The value ranges between 0 and 1, where the degenerate cases are 0, a circle and 1, a line. Prior to passing the stenosis, the cells are already slightly elongated with . When passing the stenosis, the cell is deformed and lengthened, and the eccentricity rises to almost one, because the stenosis is much narrower than the cell’s diameter. After passing the stenosis, the cells partially relax and remain elongated with when leaving the camera’s field of view. Comparing the ellipses as depicted in Figure 6 for and , it should be noted that the difference is measurably large, but not particularly significant. Following the flow field, the cells deform and recover faster in a shorter stenosis with length e = 55 µm than passing a longer stenosis with length e = 165 µm. A more abrupt deformation hence seems to allow for better recovery. Whether the cells will return to their original shape after a longer period of time cannot be concluded from our data. However, as we occasionally witnessed cell rupture or budding, when a large cell reached the widening part of the stenosis, a limitation of this method as a non-destructive one becomes obvious. However, as our aim is to implement a method to measure E for moderate deformations, we did not further evaluate extreme flow rates or extremely thin constrictions. Moreover, more extreme flow rates would require another setup, where we suggest using glass channels. If the cells are particularly sensitive or if the focus lies on the cell’s viability after the measurement, those permanent damages have to be taken into account and the design of the stenosis may need to be adapted, for instance by widening the narrowest part. In general, however, the advantages outweigh the limitations, as a large number of cells can be analyzed in one measurement, the analysis is automatic and the measured quantity does not describe selective points, but actually the bulk elasticity of an entire cell.
4. Discussion
Comparison of Measurement Techniques
Figure 7 shows that different measurement methods in fact result in different values and different measuring uncertainties of the Young’s modulus. Under the label of stenosis, the results from the microfluidic measurements in Figure 5C are summarized. These result in a value of E = 695 Pa ± 229 Pa. Comparing AFM with tip (E = 1671 Pa ± 1111 Pa), AFM without tip (E = 660 Pa ± 371 Pa) and stenosis or microfluidic deformation analysis (E = 695 Pa ± 229 Pa), the results from AFM without tip and stenosis agree. Overall, the results of the three measurement methods are in the same range, but not particularly precise. In the following, we consult other studies to evaluate the broad range of our results.
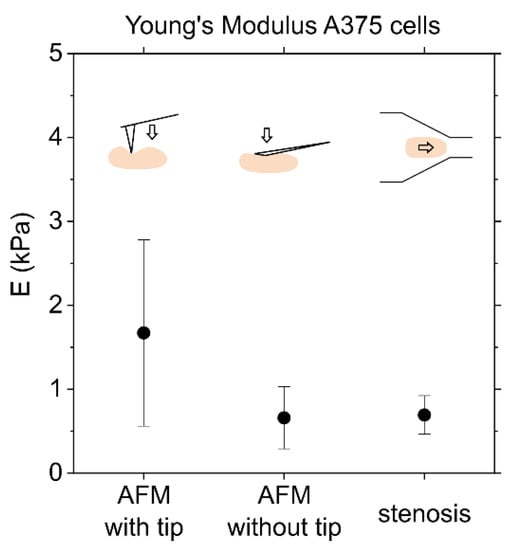
Figure 7.
Comparison of AFM and microfluidic deformation analysis of the Young’s modulus of A375 cells. AFM: The result of AFM measurements with and without tip is the mean and standard deviation from measurements on 5–15 cells with 10 force curves per cell. Stenosis: Elasticity was also determined based on deformation under flow during the passage of a stenosis. The value here summarizes the six values from Figure 5, each of which relies on trajectories from approximately 2500 cells.
Guillou et al., who study the deformation of cells during passage of a channel crossing, publish shear moduli of 3T3 fibroblasts between G0(200 ms) = 101 ± 8 Pa and G0(5 ms) = 590 ± 5 Pa for different time constants. For validation, they refer to optical stretcher experiments, which lead to values in the range of 70–100 Pa. Applying their microfluidic method to GBM tumor initiating cells, they find G0 = 440 ± 0.03 Pa, and report AFM results of G0 = 800–900 Pa [19]. Chen et al., who also developed a microfluidic method, which is based on measuring the changes in pressure while a cell passes a stenosis, provide another set of different cell lines and methods. The results for K562 leukemia cells are 64 Pa from the microfluidic method, 90 Pa from micropipette aspiration and 400 Pa measured by AFM. The same three measurement methods do not show the same systematics for endothelial cells: 383 Pa from the microfluidic method, 100–400 Pa from micropipette aspiration and 700–3000 Pa using AFM [18].
To summarize, the value of the elastic modulus depends strongly on the measurement method. Comparing different cells’ elasticity must therefore always rely on one method. Even within one method, the outcome depends on the details. During force spectroscopy, for example, low indentation depths result in higher and more volatile results, because the actin network close to the cell’s surface is rigid and heterogeneous [34]. Having access to a microfluidic method that is non-invasive is of great value, because it yields rapid results, captures information about many cells, and allows us to reuse the cells. Therefore, this application may be a very useful tool in clinical practices in the future.
5. Conclusions
In this study, the elasticity of A375 melanoma cells was determined by applying different methods. By means of force spectroscopy, using cantilevers with and without a tip and employing force mapping, we emphasize the impact of the inhomogeneity of the cells. This results in higher and more widely distributed values using a cantilever with a tip. Moreover, even without the potential influence of local variations in elasticity, the overall elasticity of the cells are measured using tipless cantilevers, and thus a larger probing area of the distribution of E is found. Histograms and intra-class correlation calculations indicate that this might indeed be caused by two populations of A375 cells. Further studies could elucidate the biomolecular reasons for this effect. Finally, the presented microfluidic method allows for high-throughput and minimal invasion. The resulting Young’s moduli coincide with those from force spectroscopy without tip in the range of . The method is therefore a powerful addition to the common ones needed to detect pathological changes in cell elasticity, as seen in various diseases, such as cancer, COVID-19, or malaria.
Supplementary Materials
The following are available online at https://www.mdpi.com/article/10.3390/biophysica1040032/s1. Figure S1: Young´s modulus for repeated force spectroscopy on single cells, Figure S2: Distribution and Flex Plots of the Young´s modulus determined by AFM, Table S1: Cantilever spring constants, Table S2: Descriptive Statistics.
Author Contributions
Conceptualization, A.M.J., J.W. and C.W.; methodology, A.M.J., S.V.N., J.K.T. and C.W.; software, A.M.J.; validation, A.M.J., S.V.N. and C.W.; formal analysis, A.M.J. and S.V.N.; investigation, A.M.J. and S.V.N.; resources, J.K.T., J.W. and C.W.; data curation, A.M.J. and S.V.N.; writing—original draft preparation, A.M.J. and C.W.; writing—review and editing, A.M.J.; S.V.N.; J.K.T.; J.W. and C.W.; visualization, A.M.J. and S.V.N.; supervision, C.W.; project administration, C.W.; funding acquisition, A.M.J. and C.W.; All authors have read and agreed to the published version of the manuscript.
Funding
This research was funded by the German Academic Scholarship Foundation and the Augsburg Center for Innovative Technologies (no grant number available).
Institutional Review Board Statement
Not applicable.
Informed Consent Statement
Not applicable.
Data Availability Statement
Data available on request.
Acknowledgments
The authors thank Achim Wixforth for fruitful discussions and proofreading. Moreover, we thank the Augsburg Centre for Innovative Technologies (ACIT) for funding. A.M.J. would like to thank the German Academic Scholarship Foundation. C.W. would like to acknowledge funding for the project “Physical and functional interaction mechanisms at cell membranes and vessel walls” by the University of Augsburg.
Conflicts of Interest
The authors declare no conflict of interest.
References
- Dive, C.; Brady, G. SnapShot: Circulating Tumor Cells. Cell 2017, 168, 742–742.e1. [Google Scholar] [CrossRef]
- Marsavela, G.; Aya-Bonilla, C.A.; Warkiani, M.E.; Gray, E.S.; Ziman, M. Melanoma circulating tumor cells: Benefits and challenges required for clinical application. Cancer Lett. 2018, 424, 1–8. [Google Scholar] [CrossRef] [PubMed]
- Kilgour, E.; Rothwell, D.G.; Brady, G.; Dive, C. Liquid Biopsy-Based Biomarkers of Treatment Response and Resistance. Cancer Cell 2020, 37, 485–495. [Google Scholar] [CrossRef]
- Gorges, K.; Wiltfang, L.; Gorges, T.M.; Sartori, A.; Hildebrandt, L.; Keller, L.; Volkmer, B.; Peine, S.; Babayan, A.; Moll, I.; et al. Intra-Patient Heterogeneity of Circulating Tumor Cells and Circulating Tumor DNA in Blood of Melanoma Patients. Cancers 2019, 11, 1685. [Google Scholar] [CrossRef] [Green Version]
- Thomas, G.; Burnham, N.A.; Camesano, T.A.; Wen, Q. Measuring the mechanical properties of living cells using atomic force microscopy. J. Vis. Exp. 2013, e50497. [Google Scholar] [CrossRef] [PubMed] [Green Version]
- Mondadori, C.; Crippa, M.; Moretti, M.; Candrian, C.; Lopa, S.; Arrigoni, C. Advanced Microfluidic Models of Cancer and Immune Cell Extravasation: A Systematic Review of the Literature. Front. Bioeng. Biotechnol. 2020, 8, 1–19. [Google Scholar] [CrossRef] [PubMed]
- Kucerova, L.; Matuskova, M.; Hlubinova, K.; Altanerova, V.; Altaner, C. Tumor cell behaviour modulation by mesenchymal stromal cells. Mol. Cancer 2010, 9, 129. [Google Scholar] [CrossRef] [Green Version]
- Wu, P.-H.; Aroush, D.R.-B.; Asnacios, A.; Chen, W.-C.; Dokukin, M.E.; Doss, B.L.; Durand-Smet, P.; Ekpenyong, A.; Guck, J.; Guz, N.V.; et al. A comparison of methods to assess cell mechanical properties. Nat. Methods 2018, 15, 491–498. [Google Scholar] [CrossRef] [PubMed]
- Hao, Y.; Cheng, S.; Tanaka, Y.; Hosokawa, Y.; Yalikun, Y.; Li, M. Mechanical properties of single cells: Measurement methods and applications. Biotechnol. Adv. 2020, 45, 107648. [Google Scholar] [CrossRef]
- Wu, P.-H.; Hale, C.M.; Chen, W.-C.; Lee, J.S.H.; Tseng, Y.; Wirtz, D. High-throughput ballistic injection nanorheology to measure cell mechanics. Nat. Protoc. 2012, 7, 155–170. [Google Scholar] [CrossRef] [Green Version]
- Oh, M.-J.; Kuhr, F.; Byfield, F.; Levitan, I. Micropipette aspiration of substrate-attached cells to estimate cell stiffness. J. Vis. Exp. 2012, e3886. [Google Scholar] [CrossRef] [PubMed] [Green Version]
- Hochmuth, R.M. Micropipette aspiration of living cells. J. Biomech. 2000, 33, 15–22. [Google Scholar] [CrossRef]
- Hu, S.; Wang, R.; Tsang, C.M.; Tsao, S.W.; Sun, D.; Lam, R.H.W. Revealing elasticity of largely deformed cells flowing along confining microchannels. RSC Adv. 2018, 8, 1030–1038. [Google Scholar] [CrossRef] [Green Version]
- Kuznetsova, T.G.; Starodubtseva, M.; Yegorenkov, N.; Chizhik, S.A.; Zhdanov, R.I. Atomic force microscopy probing of cell elasticity. Micron 2007, 38, 824–833. [Google Scholar] [CrossRef] [PubMed]
- Streppa, L.; Ratti, F.; Goillot, E.; Devin, A.; Schaeffer, L.; Arneodo, A.; Argoul, F. Prestressed cells are prone to cytoskeleton failures under localized shear strain: An experimental demonstration on muscle precursor cells. Sci. Rep. 2018, 8, 8602. [Google Scholar] [CrossRef] [Green Version]
- Amiri, A.; Hastert, F.D.; Heim, L.-O.; Dietz, C. Reliability of cancer cell elasticity in force microscopy. Appl. Phys. Lett. 2020, 116, 083701. [Google Scholar] [CrossRef]
- Virumbrales-Muñoz, M.; Paz-Artigas, L.; Ciriza, J.; Alcaine, C.; Espona-Noguera, A.; Doblaré, M.; Del Burgo, L.S.; Ziani, K.; Pedraz, J.L.; Fernández, L.; et al. Force Spectroscopy Imaging and Constriction Assays Reveal the Effects of Graphene Oxide on the Mechanical Properties of Alginate Microcapsules. ACS Biomater. Sci. Eng. 2021, 7, 242–253. [Google Scholar] [CrossRef]
- Chen, Z.; Zhu, Y.; Xu, D.; Alam, M.; Shui, L.; Chen, H. Cell elasticity measurement using a microfluidic device with real-time pressure feedback. Lab a Chip 2020, 20, 2343–2353. [Google Scholar] [CrossRef]
- Guillou, L.; Dahl, J.; Lin, J.-M.G.; Barakat, A.I.; Husson, J.; Muller, S.J.; Kumar, S. Measuring Cell Viscoelastic Properties Using a Microfluidic Extensional Flow Device. Biophys. J. 2016, 111, 2039–2050. [Google Scholar] [CrossRef] [Green Version]
- Dudani, J.S.; Gossett, D.R.; Tse, H.T.K.; Di Carlo, D. Pinched-flow hydrodynamic stretching of single-cells. Lab Chip 2013, 13, 3728–3734. [Google Scholar] [CrossRef]
- Armistead, F.J.; De Pablo, J.G.; Gadêlha, H.; Peyman, S.A.; Evans, S.D. Cells Under Stress: An Inertial-Shear Microfluidic Determination of Cell Behavior. Biophys. J. 2019, 116, 1127–1135. [Google Scholar] [CrossRef] [PubMed] [Green Version]
- Mietke, A.; Otto, O.; Girardo, S.; Rosendahl, P.; Taubenberger, A.; Golfier, S.; Ulbricht, E.; Aland, S.; Guck, J.; Fischer-Friedrich, E. Extracting Cell Stiffness from Real-Time Deformability Cytometry: Theory and Experiment. Biophys. J. 2015, 109, 2023–2036. [Google Scholar] [CrossRef] [PubMed] [Green Version]
- Otto, O.; Rosendahl, P.; Mietke, A.; Golfier, S.; Herold, C.; Klaue, D.; Girardo, S.; Pagliara, S.; Ekpenyong, A.; Jacobi, A.; et al. Real-time deformability cytometry: On-the-fly cell mechanical phenotyping. Nat. Methods 2015, 12, 199–202. [Google Scholar] [CrossRef] [PubMed]
- Bruker AFM Probes, “MLCT-BIO.” [Online]. Available online: https://www.brukerafmprobes.com/p-3945-mlct-bio.aspx (accessed on 2 February 2021).
- Xia, Y.; Whitesides, G.M. Soft Lithography. Annu. Rev. Mater. Sci. 1998, 28, 153–184. [Google Scholar] [CrossRef]
- Jötten, A.M. SURF Survival of Rosettes in Flow. 2021. Available online: https://github.com/anna-joe-0305/SURF (accessed on 14 November 2021).
- Jötten, A.M.; Moll, K.; Wahlgren, M.; Wixforth, A.; Westerhausen, C. Blood group and size dependent stability of P. falciparum infected red blood cell aggregates in capillaries. Biomicrofluidics 2020, 14, 024104. [Google Scholar] [CrossRef]
- Liljequist, D.; Elfving, B.; Roaldsen, K.S. Intraclass correlation—A discussion and demonstration of basic features. PLoS ONE 2019, 14, e0219854. [Google Scholar] [CrossRef] [Green Version]
- Mahaffy, R.E.; Shih, C.K.; MacKintosh, F.C.; Käs, J. Scanning Probe-Based Frequency-Dependent Microrheology of Polymer Gels and Biological Cells. Phys. Rev. Lett. 2000, 85, 880–883. [Google Scholar] [CrossRef] [Green Version]
- Hayashi, K.; Iwata, M. Stiffness of cancer cells measured with an AFM indentation method. J. Mech. Behav. Biomed. Mater. 2015, 49, 105–111. [Google Scholar] [CrossRef]
- Galajda, P.; Kelemen, L.; Végh, G.A. Micro- and nanotechnology for cell biophysics. Acta Biol. Szeged. 2015, 59, 303–321. [Google Scholar]
- Li, Q.S.; Lee, G.Y.H.; Ong, C.N.; Lim, C.T. AFM indentation study of breast cancer cells. Biochem. Biophys. Res. Commun. 2008, 374, 609–613. [Google Scholar] [CrossRef] [PubMed]
- Ren, J.; Huang, H.; Liu, Y.; Zheng, X.; Zou, Q. An atomic force microscope study revealed two mechanisms in the effect of anticancer drugs on rate-dependent Young’s modulus of human prostate cancer cells. PLoS ONE 2015, 10, e0126107. [Google Scholar] [CrossRef] [PubMed]
- Pogoda, K.; Jaczewska, J.; Wiltowska-Zuber, J.; Klymenko, O.; Zuber, K.; Fornal, M.; Lekka, M. Depth-sensing analysis of cytoskeleton organization based on AFM data. Eur. Biophys. J. 2012, 41, 79–87. [Google Scholar] [CrossRef] [PubMed]
- Mokbel, M.; Mokbel, D.; Mietke, A.; Träber, N.; Girardo, S.; Otto, O.; Guck, J.; Aland, S. Numerical Simulation of Real-Time Deformability Cytometry to Extract Cell Mechanical Properties. ACS Biomater. Sci. Eng. 2017, 3, 2962–2973. [Google Scholar] [CrossRef] [PubMed]
Publisher’s Note: MDPI stays neutral with regard to jurisdictional claims in published maps and institutional affiliations. |
© 2021 by the authors. Licensee MDPI, Basel, Switzerland. This article is an open access article distributed under the terms and conditions of the Creative Commons Attribution (CC BY) license (https://creativecommons.org/licenses/by/4.0/).