Article

A Python-Based Thermodynamic Equilibrium Library for Gibbs Energy Minimization: A Case Study on Supercritical Water Gasification of Ethanol and Methanol

by
Julles Mitoura dos Santos Junior
1,
Antonio Carlos Daltro de Freitas
2 and
Adriano Pinto Mariano
1,*
1
Faculdade de Engenharia Química (FEQ), Universidade Estadual de Campinas (UNICAMP), Av. Albert Einstein 500, Campinas 13083-852, SP, Brazil
2
Departamento de Engenharia Química, Centro de Ciências Exatas e Tecnologia, Universidade Federal do Maranhão (UFMA), Av. dos Portugueses, 1966, Bacanga, São Luís 65080-805, MA, Brazil
*
Author to whom correspondence should be addressed.
Eng 2025, 6(9), 208; https://doi.org/10.3390/eng6090208 (registering DOI)
Submission received: 24 July 2025 / Revised: 11 August 2025 / Accepted: 28 August 2025 / Published: 30 August 2025
(This article belongs to the Section Chemical, Civil and Environmental Engineering)

Abstract

This work aims to present tes-thermo, a Python library developed to solve thermodynamic equilibrium problems using the Gibbs energy minimization approach. The library is a variant of TeS v.3, a standalone executable developed for the same purpose. The tool formulates the chemical equilibrium problem of combined phases as a nonlinear programming problem, implemented using Pyomo (Python Optimization Modeling Objects) and solved with IPOPT (Interior Point OPTimizer). To validate the tool and demonstrate its robustness, the supercritical water gasification (SCWG) of methanol and ethanol was investigated. The PengRobinson equation of state was employed to account for non-idealities in the gas phase. Experimental and simulated data from the literature were used for validation, and, in both cases, the results were satisfactory, with root mean square errors consistently below 0.23. The SCWG processes studied revealed that hydrogen production is favored by increasing temperature and decreasing pressure. For both methanol and ethanol, increasing the carbonaceous substrate fraction in the feed promotes hydrogen formation; however, it also leads to reduced hydrogen relative yield due to the enhanced formation of methane and carbon monoxide under these conditions. Consequently, although hydrogen production increases, the hydrogen molar fraction in the dry gas stream tends to decrease with the higher substrate content. As expected, the SCWG of methanol produces more hydrogen and less carbon monoxide compared to ethanol under similar conditions. This behavior is consistent with the higher carbon content in ethanol, which favors reactions leading to carbon oxides. In summary, tes-thermo proves to be a robust and reliable tool for conducting research and studies on topics related to thermodynamic equilibrium.

1. Introduction

Chemical process engineering has continuously evolved in the pursuit of efficiency, safety, and sustainability, with process modeling and simulation emerging as fundamental pillars of modern chemical engineering practice [1]. Robust mathematical models, grounded in the laws of physics and chemistry, serve as computational surrogates for representing chemical processes, enabling virtual experiments that provide critical and valuable insights into process behavior [2]. This ability to predict process performance prior to physical construction or operational changes drastically reduces costs, accelerates innovation, and mitigates associated risks [3,4].
In this context, modeling thermodynamic equilibrium is crucial, and the development of accessible and accurate computational tools is a field in constant development. The effectiveness of this approach depends directly on the availability and capability of the software used, which has become a diverse ecosystem of commercial and open-source solutions.

1.1. Current Status of Thermodynamic Equilibrium Software

The landscape of thermodynamic equilibrium software has evolved significantly over the past decades, with various commercial and open-source solutions becoming available to researchers and industry professionals. Traditional commercial software packages such as Aspen Plus, Aspen Hysys, ChemCAD, and ProSim have dominated the market due to their comprehensive thermodynamic property databases, robust calculation engines, and user-friendly interfaces [5,6].
However, the rise of open-source alternatives has created new opportunities for research and development. Alongside established tools, simulators such as COCO (CAPE-OPEN to CAPE-OPEN) offer a powerful, free-of-charge alternative. It is a CAPE-OPEN compliant steady-state modeling environment that leverages modularity, allowing users to assemble a process flowsheet from individual unit operations [7,8,9]. Similarly, DWSIM stands out as a free and open-source chemical process simulator whose results are comparable to commercial simulators [10,11,12,13]. Built on the Microsoft .NET and Mono platforms, DWSIM offers advanced thermodynamic calculations and reaction support, capable of simulating multi-phase equilibrium processes. Other tools, such as Cantera [14], focus on problems involving chemical kinetics and thermodynamics, while specialized software such as NASA’s CEAs (Chemical Equilibrium Applications) is widely adopted for specific applications, such as rocket performance analysis [15].
The increasing availability of these tools has democratized access to sophisticated thermodynamic modeling capabilities, enabling researchers to combine thermodynamic calculations with advanced data processing, machine learning, and optimization frameworks. Python-based implementations have gained prominence due to their extensive scientific computing libraries, ease of integration, and flexibility for custom applications [16,17]. This flexibility is especially valuable for addressing complex and emerging challenges in sustainable energy production, where accurate modeling of reactive systems under extreme conditions is essential.
A prominent example of this type of challenge is supercritical water gasification (SCWG). This technology, which operates under extreme temperature and pressure conditions, represents an ideal field for the application and validation of advanced thermodynamic models, especially in the context of the valorization of wet biomass for clean energy production.

1.2. Current Status of Thermodynamics of SCWG of Methanol and Ethanol

In parallel, the growing demand for energy and environmental concerns are driving the search for clean and renewable energy sources, such as hydrogen [18]. Hydrogen production from renewable sources is a promising alternative, but the high moisture content of these materials commonly represents a significant challenge for conventional thermochemical processes, such as steam reforming. Supercritical water gasification (SCWG) emerges as an innovative technology to overcome this barrier, enabling the efficient conversion of various materials, including biomass with its natural moisture content, without the need for costly and energy-intensive drying steps. In the supercritical state, water acts as both a solvent and a reactant, promoting the decomposition of organic matter and the production of a hydrogen-rich gas, with high gasification efficiency and feedstock versatility [19,20,21].
In supercritical water gasification (SCWG) research, methanol and ethanol have become benchmark feedstocks due to their well-documented thermodynamic properties and abundant experimental data availability [22]. Recent thermodynamic modeling studies have investigated the supercritical water gasification of various bio-renewable sources using Gibbs energy minimization approaches, with methanol and ethanol serving as fundamental building blocks for understanding more complex biomass conversion mechanisms. Research has shown distinct gasification behaviors between these alcohols, with ethanol achieving higher gasification efficiency (76.3% at 550 °C, 25 MPa) compared to methanol (25% at 550 °C) under similar conditions [23,24,25,26,27].
The thermodynamic analysis of methanol and ethanol SCWG processes reveals complex reaction networks involving steam reforming, watergas shift reaction, and methanation reactions [22,28]. Tang and Kitagawa [22] proposed the following reaction mechanism for the SCWG of methanol:
I
Methanol decomposition:
C H 3 O H C O + 2 H 2
II
Watergas shift reaction:
C O + H 2 O C O 2 + H 2
III
CO methanation:
C O + 3 H 2 C H 4 + H 2 O
Studies have established that reaction pathways and product distributions are strongly influenced by operating conditions such as temperature, pressure, and feed concentration [28]. The availability of extensive experimental datasets for both compounds makes them ideal candidates for validating new thermodynamic models and computational tools.

1.3. Research Gap and Objectives

Despite the extensive research on thermodynamic equilibrium modeling and the significance of methanol and ethanol as model compounds, there remains a need for accessible, flexible, and integrable tools that can seamlessly combine sophisticated thermodynamic calculations with modern data analysis and machine learning frameworks. Traditional commercial software packages, while robust, often present limitations in terms of accessibility, customization, and integration with contemporary computational environments.
In response to this need, this work presents tes-thermo, a Python library developed to solve thermodynamic equilibrium problems using the Gibbs energy minimization approach. The library represents an evolution from TeS v.3 [29], transforming a standalone executable into a flexible and integrable package that leverages the Python ecosystem’s extensive scientific computing capabilities. The tool formulates the chemical equilibrium problem as a nonlinear programming model using Pyomo and solves it with the IPOPT solver, offering substantial advantages in terms of accessibility, customization, and integration potential.
The main objective of this work is to rigorously validate the robustness and reliability of tes-thermo through a systematic investigation of supercritical water gasification of methanol and ethanol. The PengRobinson equation of state is employed to account for non-idealities in the gas phase, and the modeling approach is validated using both experimental and simulated data from various literature sources. Through this comprehensive assessment, we aim to establish tes-thermo as a highly predictive tool for reactive systems under combined chemical and phase equilibrium conditions, providing a solid foundation for its application in modeling, analysis, and optimization of such processes.

2. Methodology

This section aims to describe the methodology used for the development of the tes-thermo library, which is the main objective of this work. The following sections provide details on the adopted thermodynamic considerations, the optimization methodology employed, and the mathematical framework used to solve equilibrium problems. Finally, the packaging of tes-thermo as a Python library is presented.

2.1. Thermodynamic Approach for Process Evaluation

2.1.1. Calculation of Equilibrium Compositions in an Isothermal Reactor: Problem Represented as Gibbs Energy Minimization

The combined chemical and phase equilibrium problem, formulated as the minimization of the system’s total Gibbs free energy at constant pressure and temperature, can be represented, as shown in Equation (4) [30], considering a system composed of multiple phases and multiple components.
m i n G = i = 1 N C k = 1 N F n i k μ i k
Additionally, at the condition of minimum Gibbs free energy, the system must satisfy the constraints of non-negativity of the number of moles (Equation (5)) and conservation of the number of atoms (Equation (6)) to represent a stable and feasible solution within the thermodynamic criteria of the process.
n i k 0 ; i = 1 ,   ,   N C ; k = 1 , ,   N F
i = 1 N C a m i i = 1 N F n i k = i = 1 N C a m i n i 0 ; m = 1 , ,   N E
The only solid component considered initially in the model is solid carbon, this phase being specifically assumed as an ideal solid. With this consideration, Equation (4) can be rewritten, as shown in Equation (7).
m i n G = i = 1 N C n i g μ i g + R T l n P + l n y i + l n ϕ ^ i + n C ( s ) μ C ( s )
Another important assumption is that, for all systems analyzed in this work, non-ideal behavior is predicted using the phiphi approach, with the fugacity coefficient determined through the PengRobinson equation of state.
The values of μ i k ( T , P ) can be calculated from the standard formation values under reference conditions, following the relationships presented in Equations (8) and (9).
T μ i k R T = H i k ¯ R T 2 ,   i = 1 ,   ,   N C
H i k ¯ T = C p i k ,   i = 1 ,   ,   N C
For this study, heat capacity calculations were obtained using the polynomial presented in Smith et al. [31], as shown in Equation (10).
C P i k = C P A , i + C P B , i T + C P C , i T 2 + C P D , i T 2

2.1.2. Considerations on the Non-Idealities of the Reactive System

The TeS simulator provides the use of the Peng–Robinson and Soave–Redlich–Kwong equations of state, as well as the Virial equation truncated at the second term, to account for non-idealities of the system. The Peng–Robinson equation is widely recognized for offering a good balance between simplicity and accuracy, having been developed with the goal of matching or surpassing the performance of the SRK equation by modifying the attraction term of the semi-empirical Van der Waals equation [32,33,34]. The Virial equation, in turn, is a useful alternative under low-to-moderate pressure conditions, allowing the description of deviations from ideality based on coefficients obtained experimentally or through correlations. It is particularly useful when a lower capacity to describe the system’s non-ideal behavior is acceptable in exchange for reduced computational time, especially when compared to the use of the Peng–Robinson equation of state (PR EoS), for example [35]. However, in this study, only the Peng–Robinson equation of state was used to model the non-ideal behavior of the systems, considering a wide application of this for biomass SCWG process prediction [29,36,37].
For a given thermodynamic state (T, P, and composition), the parameters A and B are calculated, and the corresponding cubic equation is solved to determine the compressibility factor Z. If there is only one real root, the system is considered to be in a single phase. When three distinct real roots are obtained, the largest corresponds to the compressibility factor of the vapor phase (Zg), while the smallest corresponds to the liquid phase (Zl). The intermediate root has no physical meaning, as it represents a thermodynamically unstable state. Equation (11) shows the calculation of the fugacity coefficient using the Peng–Robinson equation of state for both the liquid and vapor phases.
ln ^ i = B i B Z 1 ln Z B + A 2 2 B B i B 2 j y j a i a j a m ln Z + 1 + 2 B Z + 1 2 B
The polynomial form of the compressibility factor Z for the Peng–Robinson equation of state is presented in Equation (12).
Z 3 1 B Z 2 + A 2 B 3 B 2 Z A B B 2 B 3 = 0
The dimensionless coefficients A and B represent the dependence on pressure, temperature, and mixture composition and are defined as presented in Equations (13) and (14), respectively.
A = a m P R T 2
B = b m P R T
The mixture energy parameter (am) is calculated using a quadratic mixing rule that accounts for interactions between all pairs of components i and j in the mixture, as shown in Equation (15). The mixture co-volume parameter (bm) is obtained by a linear average of the contributions of each component, weighted by their mole fractions yi, as indicated in Equation (16).
a m = i = 1 N C j = 1 N C y i y j a i a j ( 1 k i j )
b m = i = 1 N C y i b i

2.2. Strategies for Solving Nonlinear Problems

A total of 14 potential components were considered in the supercritical water gasification process of ethanol and methanol. These components, along with their thermodynamic properties, are detailed in Table 1. The selection was based on the main compounds expected to arise during the gasification of carbonaceous materials under supercritical conditions, as indicated by an extensive literature review [38,39,40,41,42].
The tes-thermo library was used to solve the nonlinear programming (NLP) problems. This tool uses Pyomo, a high-level modeling framework, to structure the problems. The optimization itself is performed by IPOPT, a robust solver for finding optimal solutions in Gibbs energy minimization problems.
The choice of this computational architecture is justified by the combination of advantages offered by Python as a scientific programming language and Pyomo as an open-source algebraic modeling language [44]. The IPOPT solver was selected due to its robustness and efficiency in handling large-scale nonlinear programming problems with both equality and inequality constraints. In the context of combined chemical and phase equilibrium modeling, such problems are typically highly nonlinear and involve complex constraints arising from mass balances, equilibrium conditions, and thermodynamic models [45]. IPOPT is particularly well-suited for these applications, as it supports sparse matrix operations and provides reliable convergence even for stiff systems, outperforming simpler solvers such as SLSQP or COBYLA in both accuracy and computational performance.

2.3. Simulator Development in the Form of a Python Library

The tes-thermo is a program developed entirely in Python, which makes its packaging a relatively simple task. To distribute the application as a Python library, tes-thermo was packaged using the PEP 517 format. The setuptools library was used, which is a common recommendation for building Python libraries. The basic repository structure of tes-thermo is presented in Figure 1.
The Eng 06 00208 i001 eos Python module contains functions for calculating fugacity coefficients in the vapor phase. The Eng 06 00208 i001 utils module includes all resources used for solving the Gibbs free energy minimization problem, as well as additional utilities to enhance the user experience. Finally, the Eng 06 00208 i001 gibbs module contains the core optimization problem, the Gibbs energy minimization formulated using Pyomo and solved with IPOPT, which is stored in the Eng 06 00208 i001 solver module.
The current version of the library requires the user to provide the thermodynamic properties of the components involved, as well as the initial compositions. These inputs are essential for the methodology employed, since the Gibbs energy minimization approach requires that the components and phases involved in the reactive process be explicitly defined.
In summary, the Gibbs class, located within the Eng 06 00208 i001 gibbs module, must be initialized with the component data relevant to the reactive system. The solve_gibbs method of the Gibbs class requires as parameters the feed stream composition and the operating temperature and pressure conditions. The output of this method is the equilibrium composition of the components considered in the reactive process under the specified temperature and pressure conditions.
As a result of this development, the tes-thermo library has been published on PyPI, the official Python package repository, and is available in version 0.1.0. This version allows users to consider the gas phase as either ideal or non-ideal using the Virial equation truncated at the second term to calculate the fugacity coefficients. Additionally, it enables the use of any equation of state, as well as different polynomials for heat capacity calculations. The documentation includes examples and further details about the library.
The following section presents results obtained using the tes-thermo library for the SCWG processes of methanol and ethanol.

3. Results

This section presents the results obtained using tes-thermo for the SCWG processes of ethanol and methanol. The objective is to evaluate these processes under isothermal reactor conditions using the Gibbs energy minimization approach combined with the Peng–Robinson equation of state for non-ideality calculations.
The minG and PR pair is commonly employed and reported in the literature, demonstrating good agreement with experimental data used as reference, as in the studies presented by Mitoura et al. [37,46], where SCWG processes of various biomass sources were evaluated and validated against previously published experimental data.
The results section of this work does not include a dedicated topic for the validation of the employed methodology. However, in all subsequent sections, validations are performed using both experimental and simulated data reported in the literature for the SCWG processes of methanol and ethanol.

3.1. Evaluation of the Ethanol SCWG Process

Ethanol gasification in supercritical water (SCWG) was investigated through simulations, the results of which are presented in this section. Using the tes-thermo library, the study covered temperatures from 773 to 1273 K, pressures from 200 to 280 bar, and feed ethanol concentrations ranging from 4.86% to 33.83% by weight in aqueous solution. A total of 3375 simulations were performed, covering a wide range of operating conditions to evaluate the thermodynamic behavior of the system. Using a computer with an M3-Pro processor and 18 GB of RAM, the tes-thermo library completed all simulations in only 1 min and 42.3 s. This result highlights the robustness and high computational efficiency of the implemented thermodynamic model.
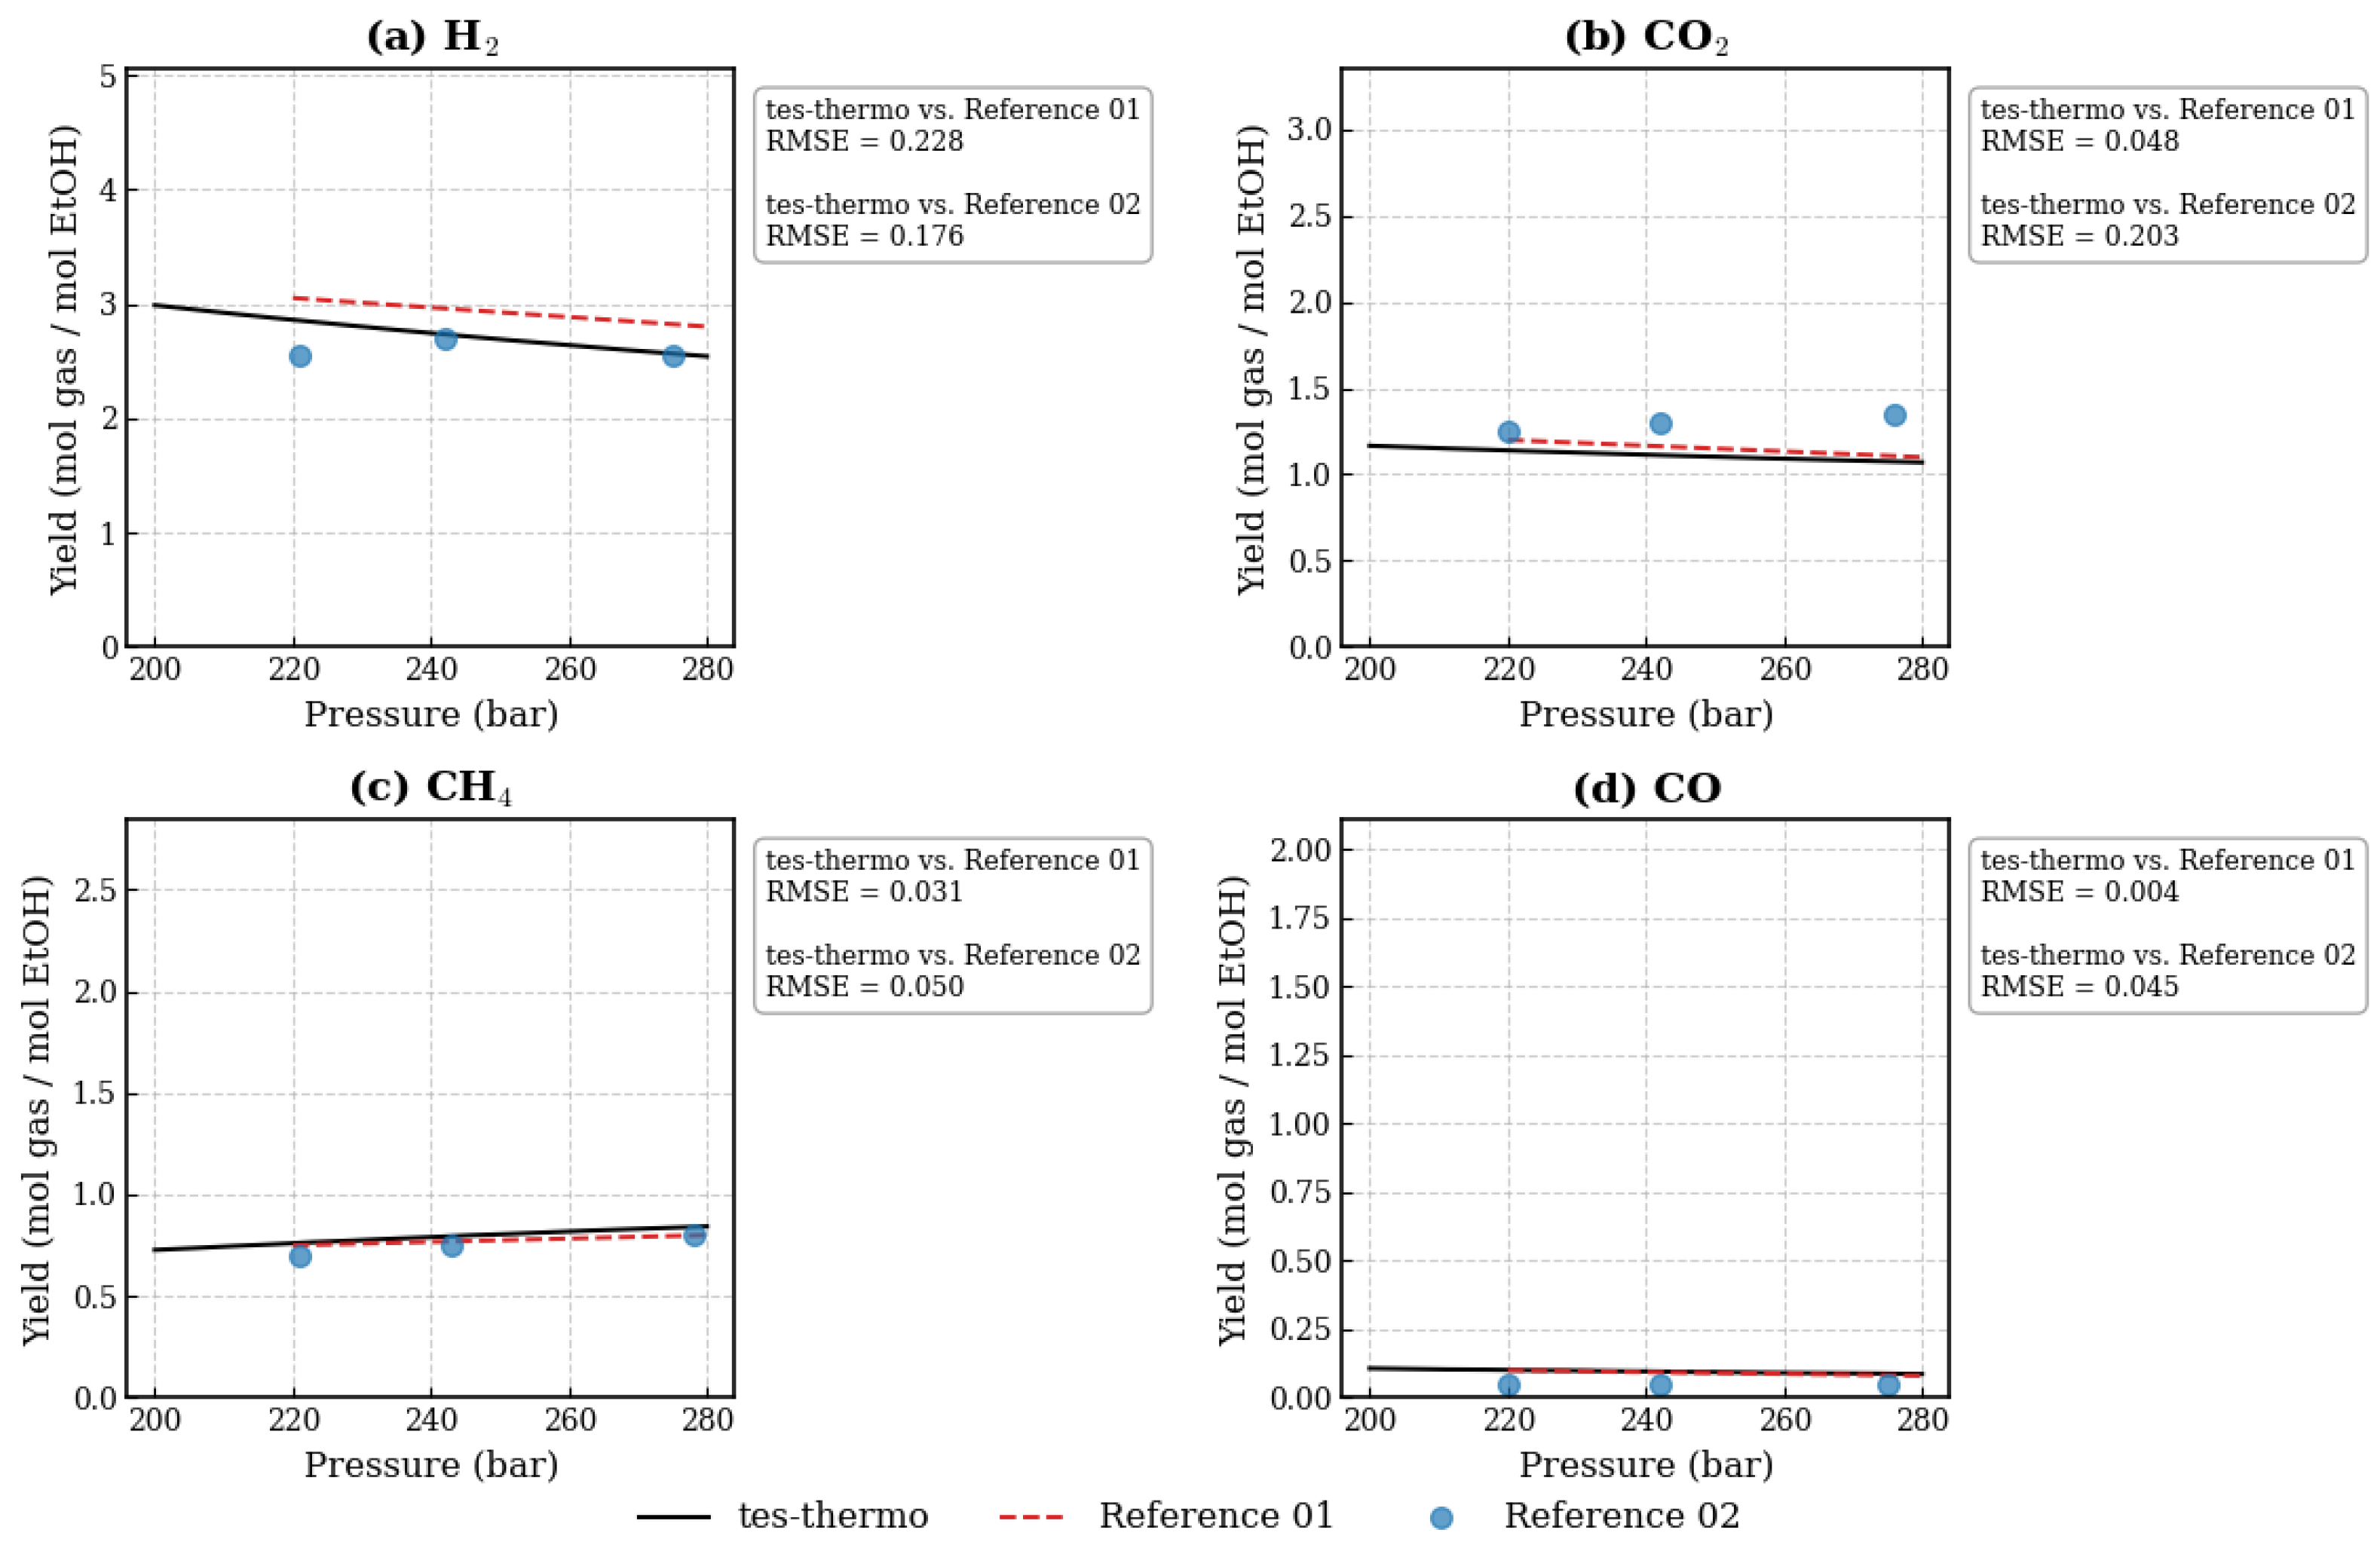
Figure 2 presents a comparison between the simulated results obtained using tes-thermo and experimental data by Byrd et al. [47], as well as simulated results reported by Voll et al. [28] for the SCWG of ethanol.
Byrd et al. [47] investigated the SCWG process of ethanol using a Ru/Al2O3 (ruthenium on alumina) catalyst at temperatures between 973.15 and 1073.15 K, pressures ranging from 22.1 to 27.5 MPa, and ethanol concentrations between 5 and 20 wt%.
Voll et al. [28] simulated the SCWG of ethanol using an approach very similar to the one employed in this work. The authors also used Gibbs energy minimization to calculate equilibrium compositions; however, their calculations were simplified by assuming that the gas phase fugacity coefficient does not vary with pressure. They argue that, although the gas is not ideal, this approximation is valid because the fugacity term remains nearly constant during the Gibbs energy minimization, and pressure effects on the SCWG process are minimal.
In addition to the reactants, Voll et al. [28] considered the formation of hydrogen, carbon monoxide, carbon dioxide, methane, ethane, propane, ethylene, propylene, and solid carbon. However, they found that only hydrogen, carbon monoxide, carbon dioxide, and methane are formed in significant amounts under the investigated conditions. Therefore, the assumptions made in this work are entirely acceptable. The simulations by Voll et al. [28] were conducted using the same temperature, pressure, and ethanol concentration ranges as the experiments by Byrd et al. [47], enabling direct comparison.
The results presented in Figure 2 show good agreement with both the experimental data of Byrd et al. [47] and the simulation results of Voll et al. [28] for the SCWG process of ethanol. The close fit between tes-thermo and the data from Voll et al. [15] is expected, given the similarity in the methodologies employed. A slight deviation is observed in the simulated hydrogen formation, which is justified by the fact that the tes-thermo simulations consider a non-ideal system by applying the PengRobinson equation of state to calculate the fugacity coefficients. When simulated under the ideal gas assumption, tes-thermo yields results even closer to those reported by Voll et al. [28], with R2 values exceeding 0.99 in both cases.
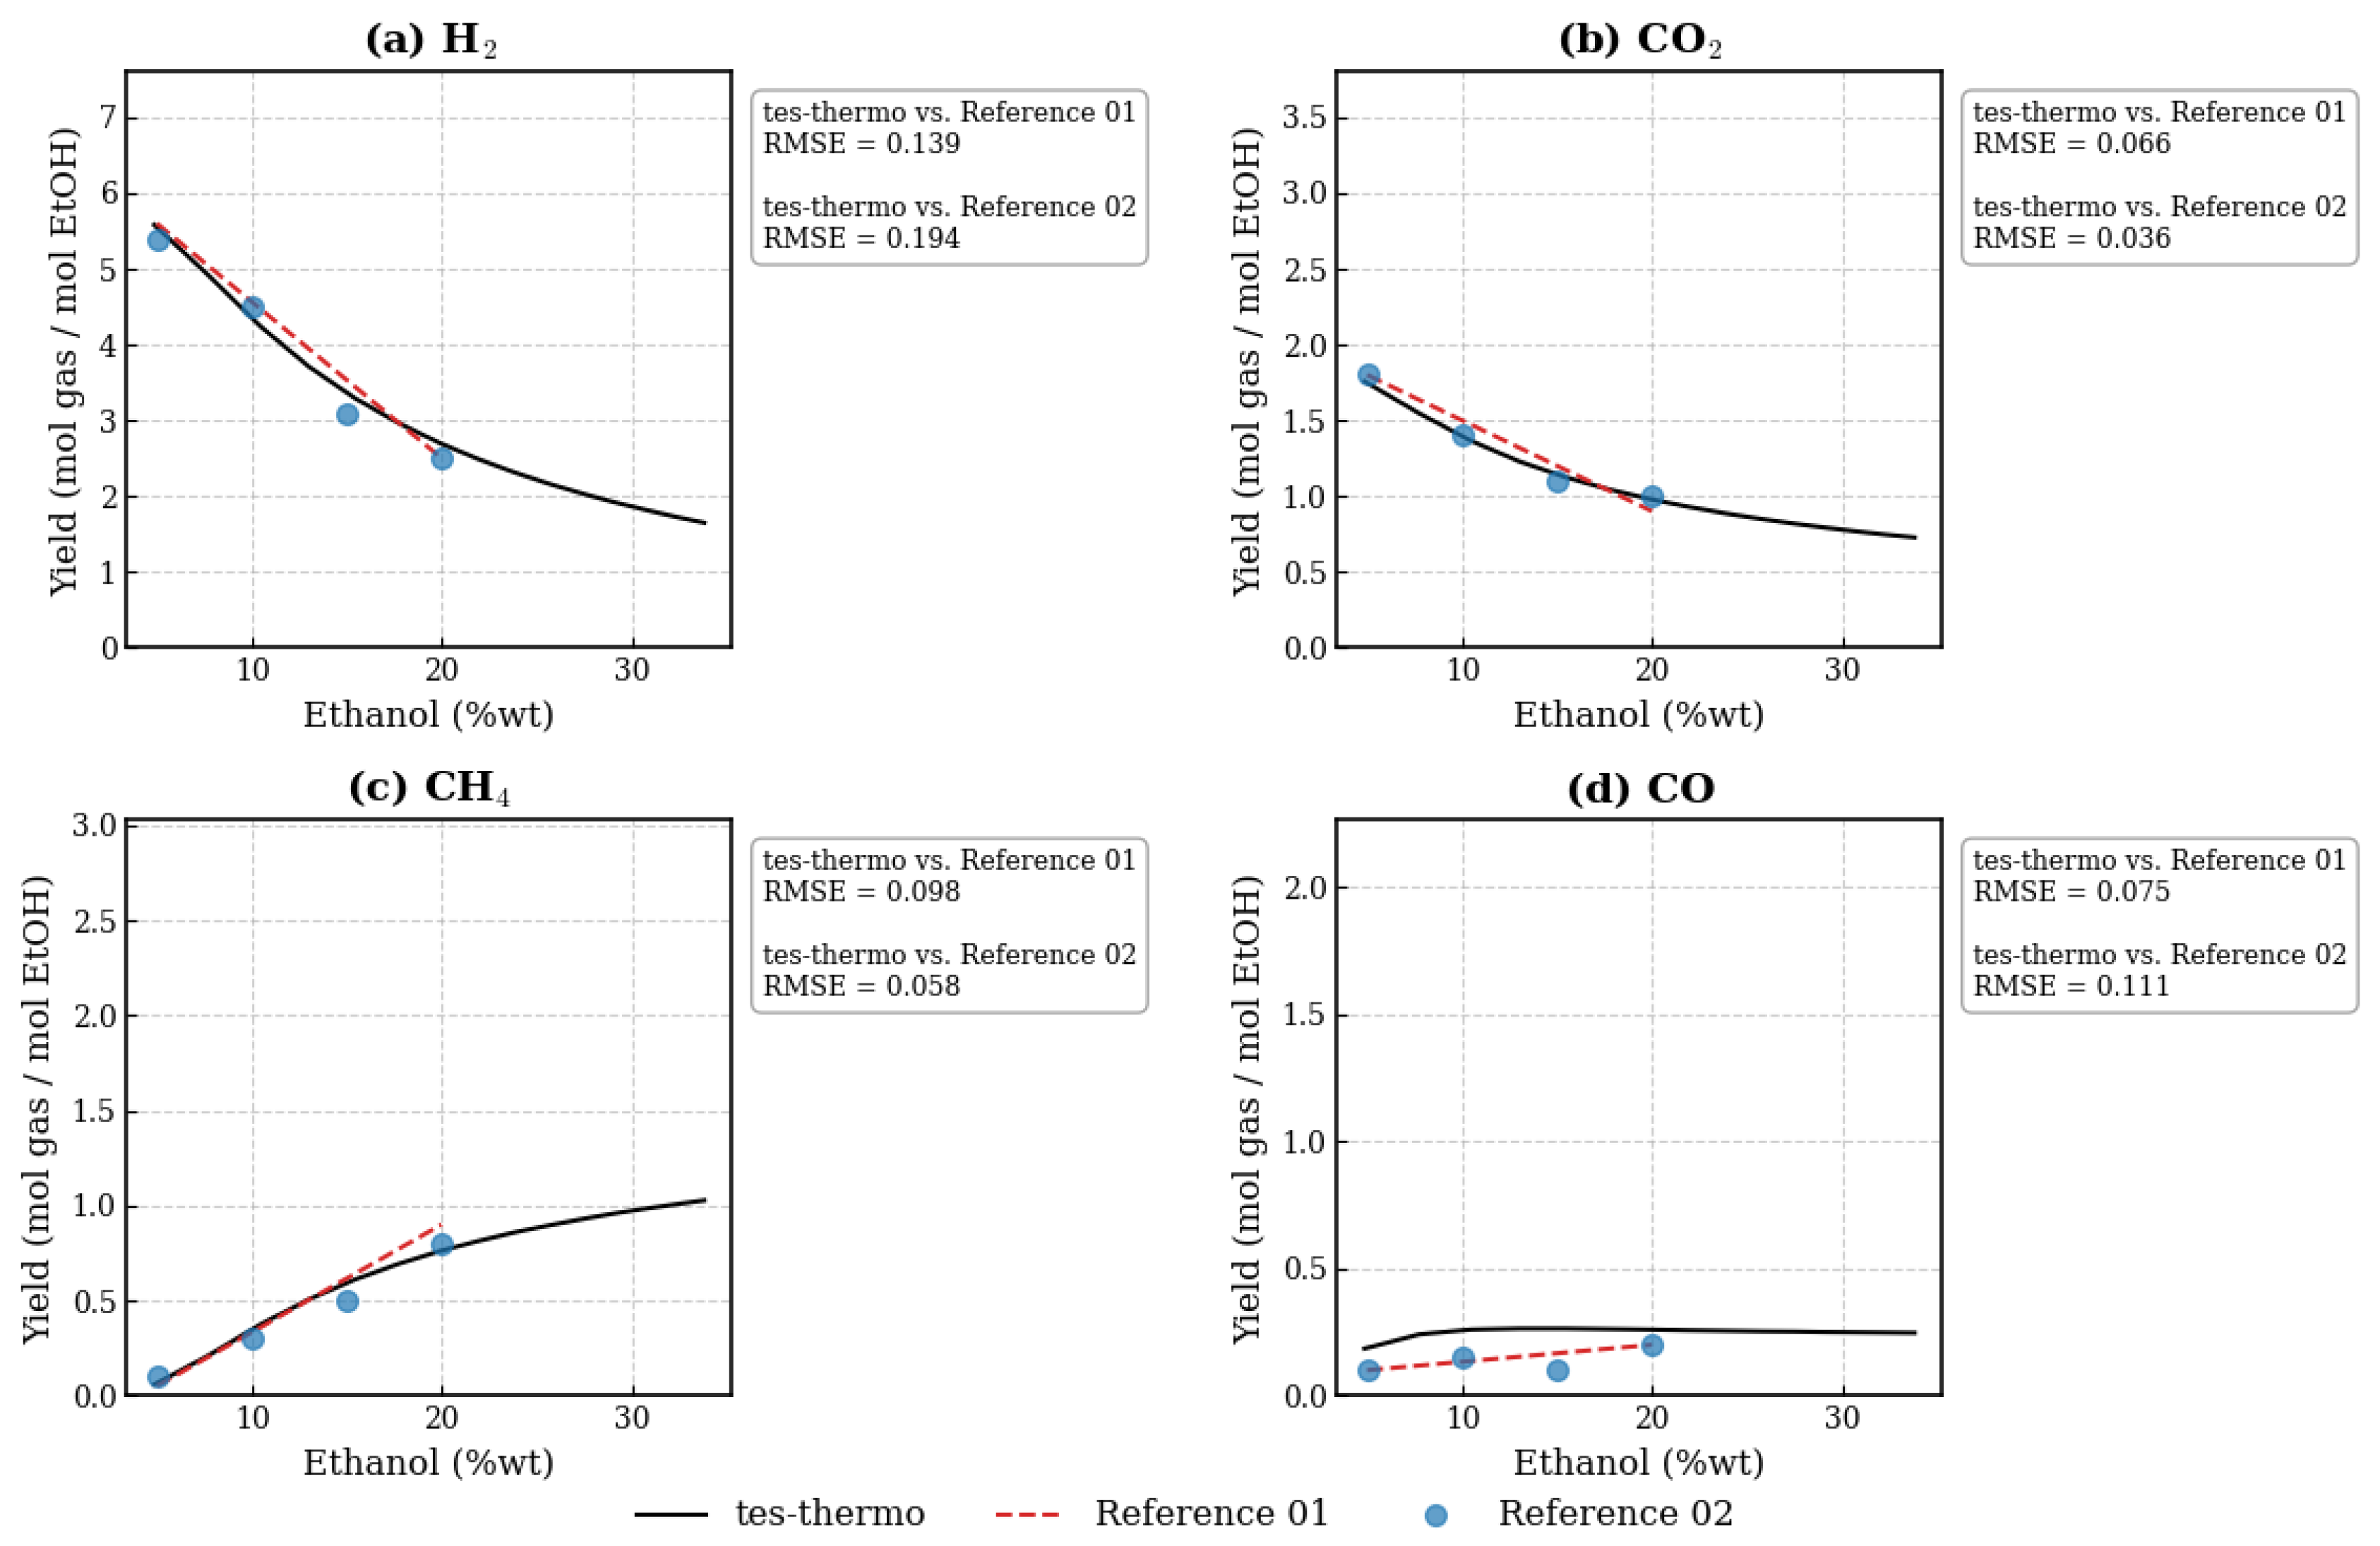
Although pressure does exert some influence on the system’s behavior, its effect appears to be minimal. These results are consistent with previous findings for SCWG systems [24,27,,48]. To assess the effects of feed composition on product formation, Figure 3 presents a comparison between data from tes-thermo library and results reported by Byrd et al. [47] and simulated by Voll et al. [28] for the SCWG process of ethanol at 22.1 MPa and 1073.15 K.
The results presented in Figure 3 show good agreement with both the experimental data by Byrd et al. [47] and the simulated data by Voll et al. [28]. However, it is worth noting the superior representation of the results shown in Figure 2, where some deviations were observed between simulated and experimental data, particularly in the analysis of pressure effects on the SCWG process.
The explanation for this discrepancy lies in the experimental conditions used by Byrd et al. [47]. The experiments that evaluated the effect of ethanol concentration (Figure 3) were conducted with a residence time of 4 s. In contrast, the experiments that analyzed the effect of pressure (Figure 2) were carried out with a residence time of only 2 s. This difference is critical because the 4 s residence time likely allowed the experimental system to approach thermodynamic equilibrium more closely, which is the fundamental assumption underlying Gibbs free energy minimization models such as those used by tes-thermo and Voll et al. [28]. On the other hand, the 2 s residence time may have been insufficient, causing the real system to remain under kinetic control, which explains the observed deviations in Figure 2 when compared to the simulated data. In SCWG of ethanol, kinetic limitations affect how closely the system approaches equilibrium, as the complex reaction pathways require sufficient residence time for completion. At short residence times or lower temperatures, slower reactions remain incomplete, leading to deviations from thermodynamic predictions. Thus, understanding these kinetic effects is key to explaining differences between experimental and equilibrium results. Therefore, the excellent fit observed in Figure 3 not only validates the model under the tested conditions but also reinforces the hypothesis that, given sufficient reaction time, thermodynamic equilibrium is an excellent predictor of product distribution in ethanol SCWG.
Furthermore, the analysis of Figure 3 reveals physically consistent trends: as the ethanol concentration in the feed increases, the yields of hydrogen and carbon dioxide decrease, while the methane yield increases. This behavior can be explained by the reduced water availability under high ethanol concentration conditions. The limited water content restricts the extent of the steam reforming reaction, which is responsible for H2 and CO2 production, and favors the methanation reaction, which consumes H2 to form CH4. Meanwhile, carbon monoxide yield remains low and relatively insensitive to ethanol concentration, indicating that this compound does not significantly accumulate under the studied conditions. This result can be attributed to the excess water in the feed, which promotes higher H2 production by shifting the equilibrium of the watergas shift reaction (Equation (2)).
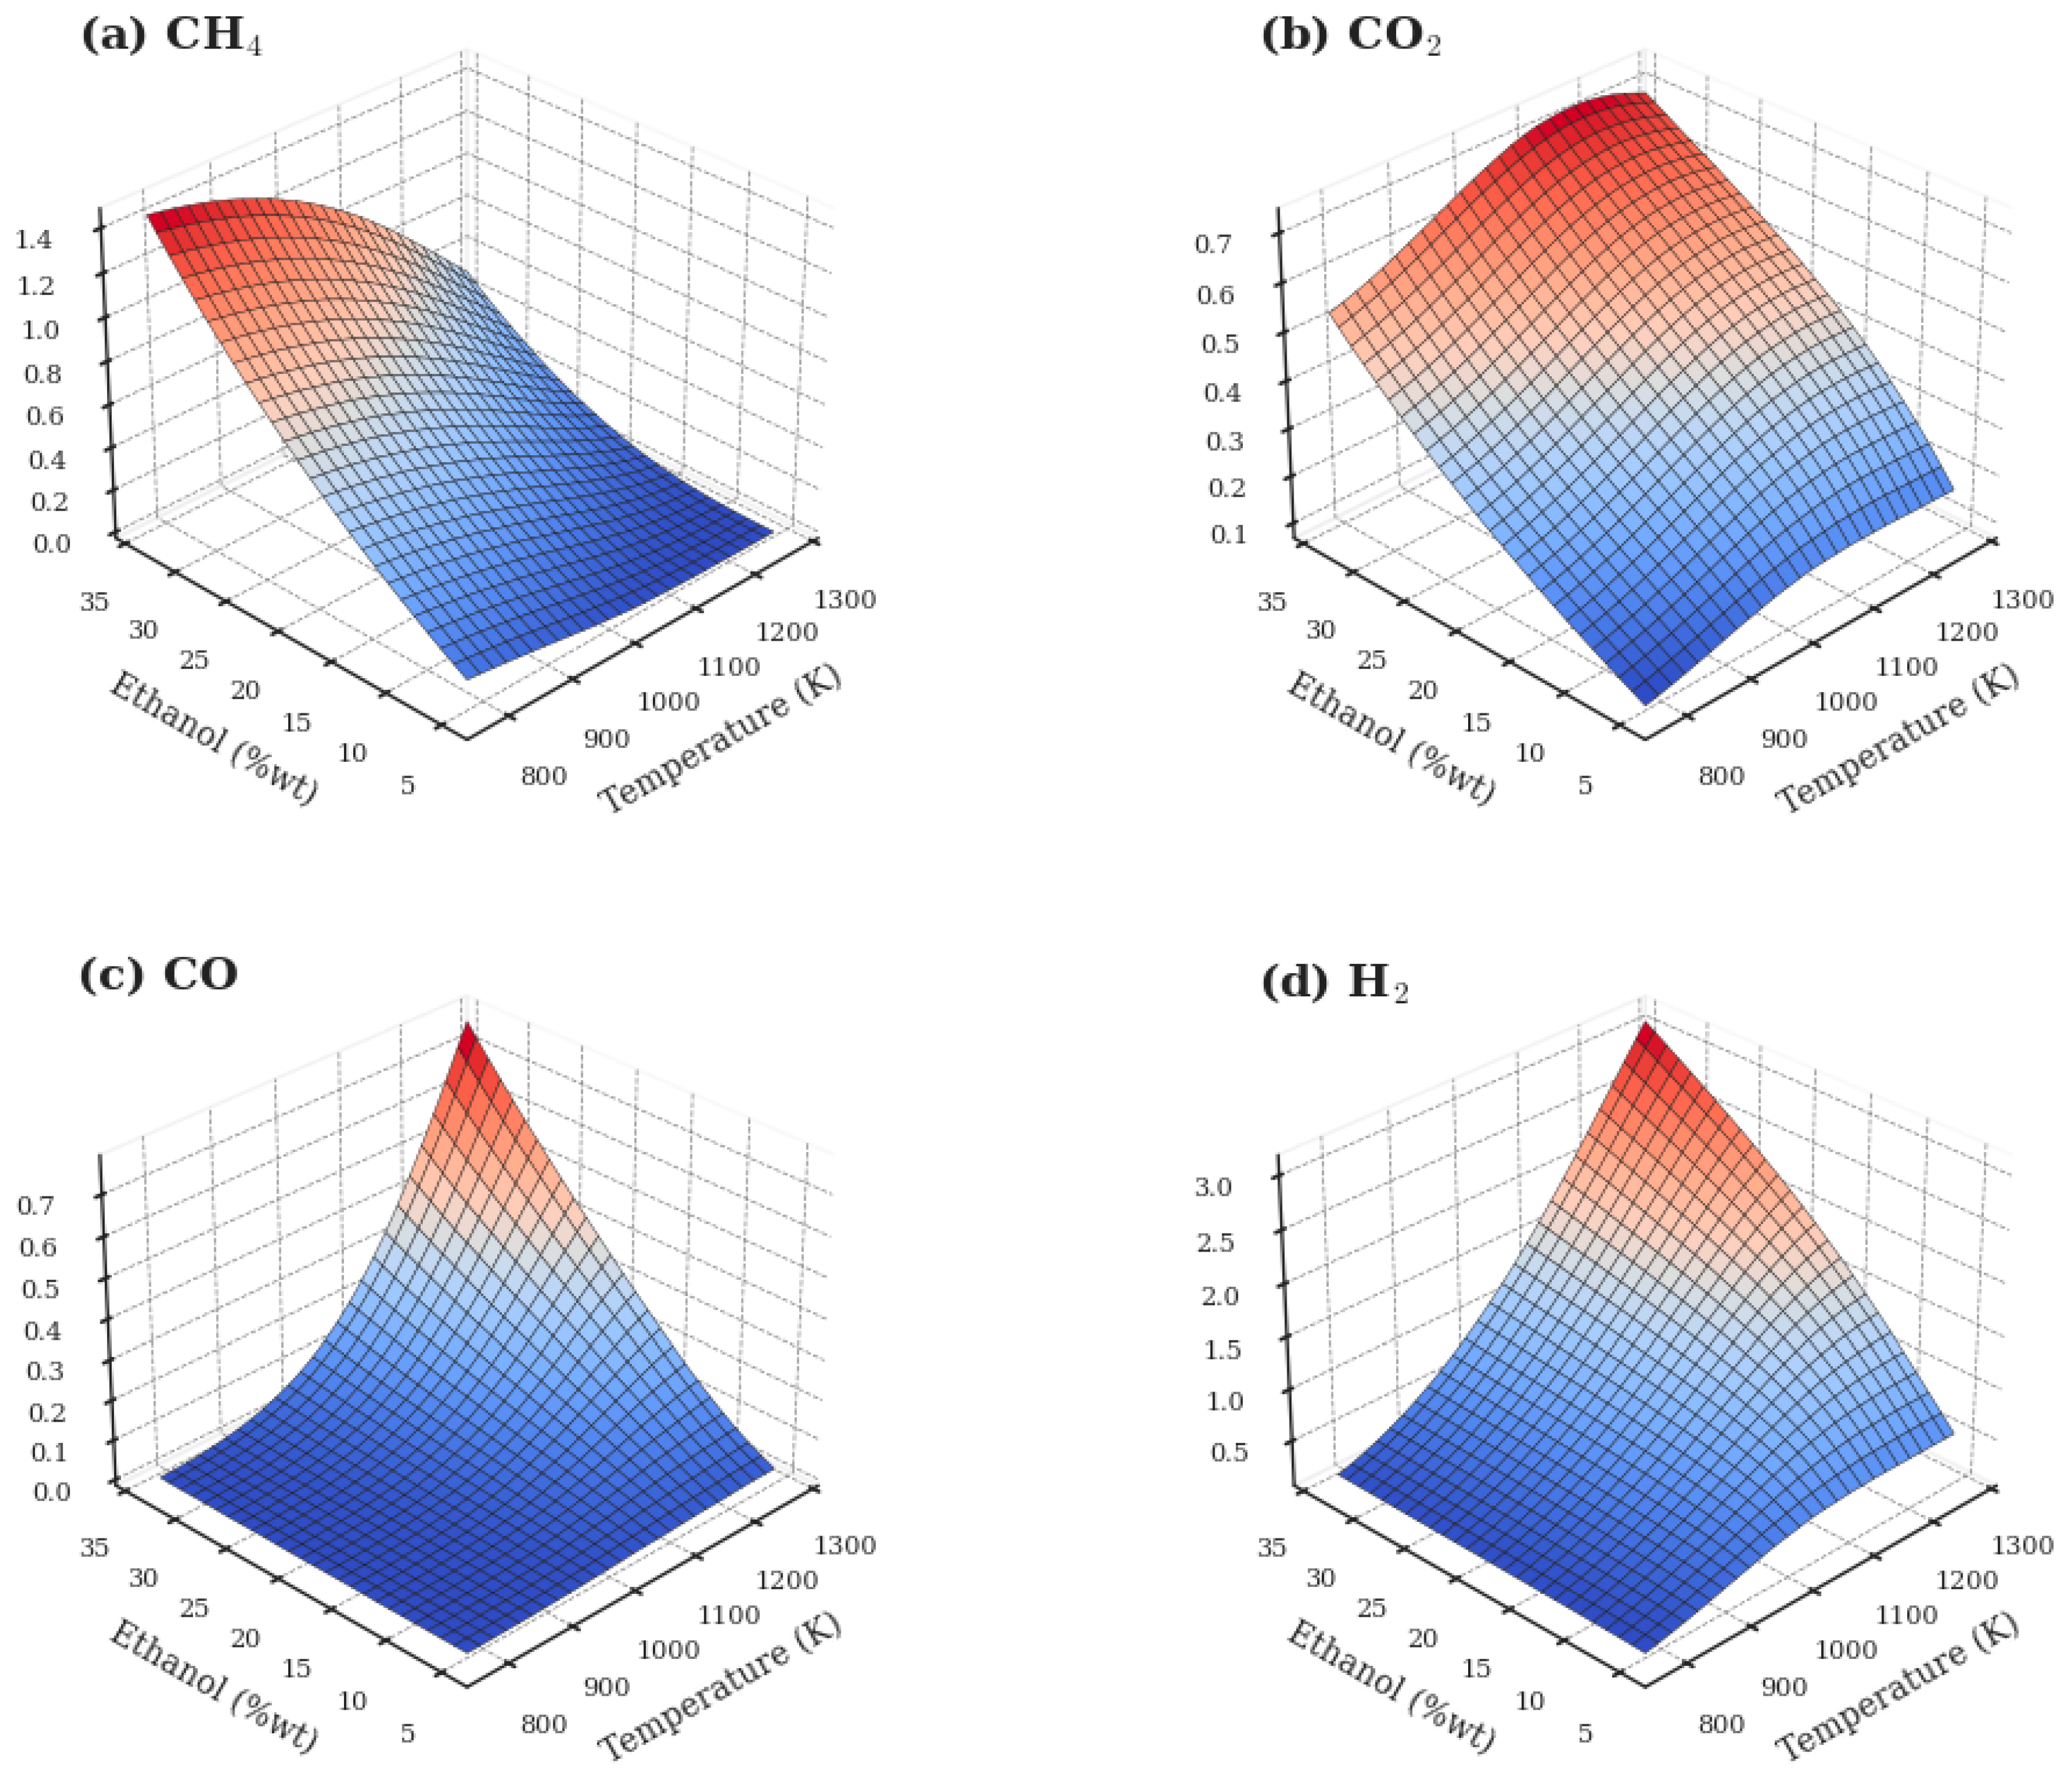
Figure 4 shows the combined effects of temperature and ethanol feed composition on the reactor, based on simulations performed with tes-thermo for temperatures ranging from 800 to 1300 K and ethanol feed concentrations from 5 to 35 wt%. The analysis reveals distinct formation patterns for each gasification product, highlighting the competitive nature of the key reactions driving the SCWG process. The results indicate the presence of a complex and dynamic equilibrium network among the involved compounds, with multiple reaction pathways influencing the final product distribution.
Methane formation is strongly inhibited by increasing the operating temperature, with system heating resulting in a sharp decrease in yield regardless of ethanol concentration. Conversely, increasing the ethanol feed concentration significantly promotes methane production, leading to maximum CH4 formation under conditions of low temperature and high ethanol concentration. This behavior is characteristic of the methanation reaction, which is favored under these operational conditions, indicating that methane acts as an intermediate species in the SCWG process, following a pathway that eventually leads to hydrogen formation.
Carbon dioxide exhibits a behavior like methane with respect to temperature, with yields increasing as the system temperature rises. Higher ethanol concentrations also result in greater CO2 formation. These results indicate that high CO2 production is achieved at elevated temperatures and high ethanol feed concentrations, consistent with observations commonly reported in SCWG processes of other carbonaceous feedstocks [17,22]. This behavior is directly related to the higher carbon availability in the feed stream, which leads to increased CO2 formation. Moreover, the excess water typically used in SCWG processes promotes the water–gas-shift reaction (Reaction 2), driving the conversion of CO into H2 and CO2.
It is observed that CO (Figure 4c) formation is favored by elevated temperatures, with maximum yields occurring at the upper limits of the analyzed temperature range. The effect of ethanol concentration is less pronounced for this compound, although lower concentrations tend to slightly increase the CO yield. However, CO yields are considerably lower compared to other products, suggesting its conversion or limited accumulation under the evaluated conditions. This behavior is common in gasification reactions conducted in media with excess water since this excess promotes CO consumption to produce CO2 and H2 by favoring the water–gas shift reaction.
Hydrogen, the primary product of interest in the process, has its production strongly favored by the increase in temperature. A significant growth in yield is observed as the temperature varies from 800 to 1300 K. For a fixed ethanol concentration of 30%, for instance, an increase of approximately 212.5% is observed. However, increasing the ethanol concentration in the feed has a negative impact, reducing hydrogen generation due to the limitation of water as an essential reactant for the steam reforming reaction and due to the equilibrium shift of the water–gas shift reaction. Therefore, H2 production is maximized under conditions of high temperature and low ethanol concentration. This result is important as it highlights the behavior of water not just as a reaction medium but as a crucial reactant for H2 production within the supercritical water gasification (SCWG) process.
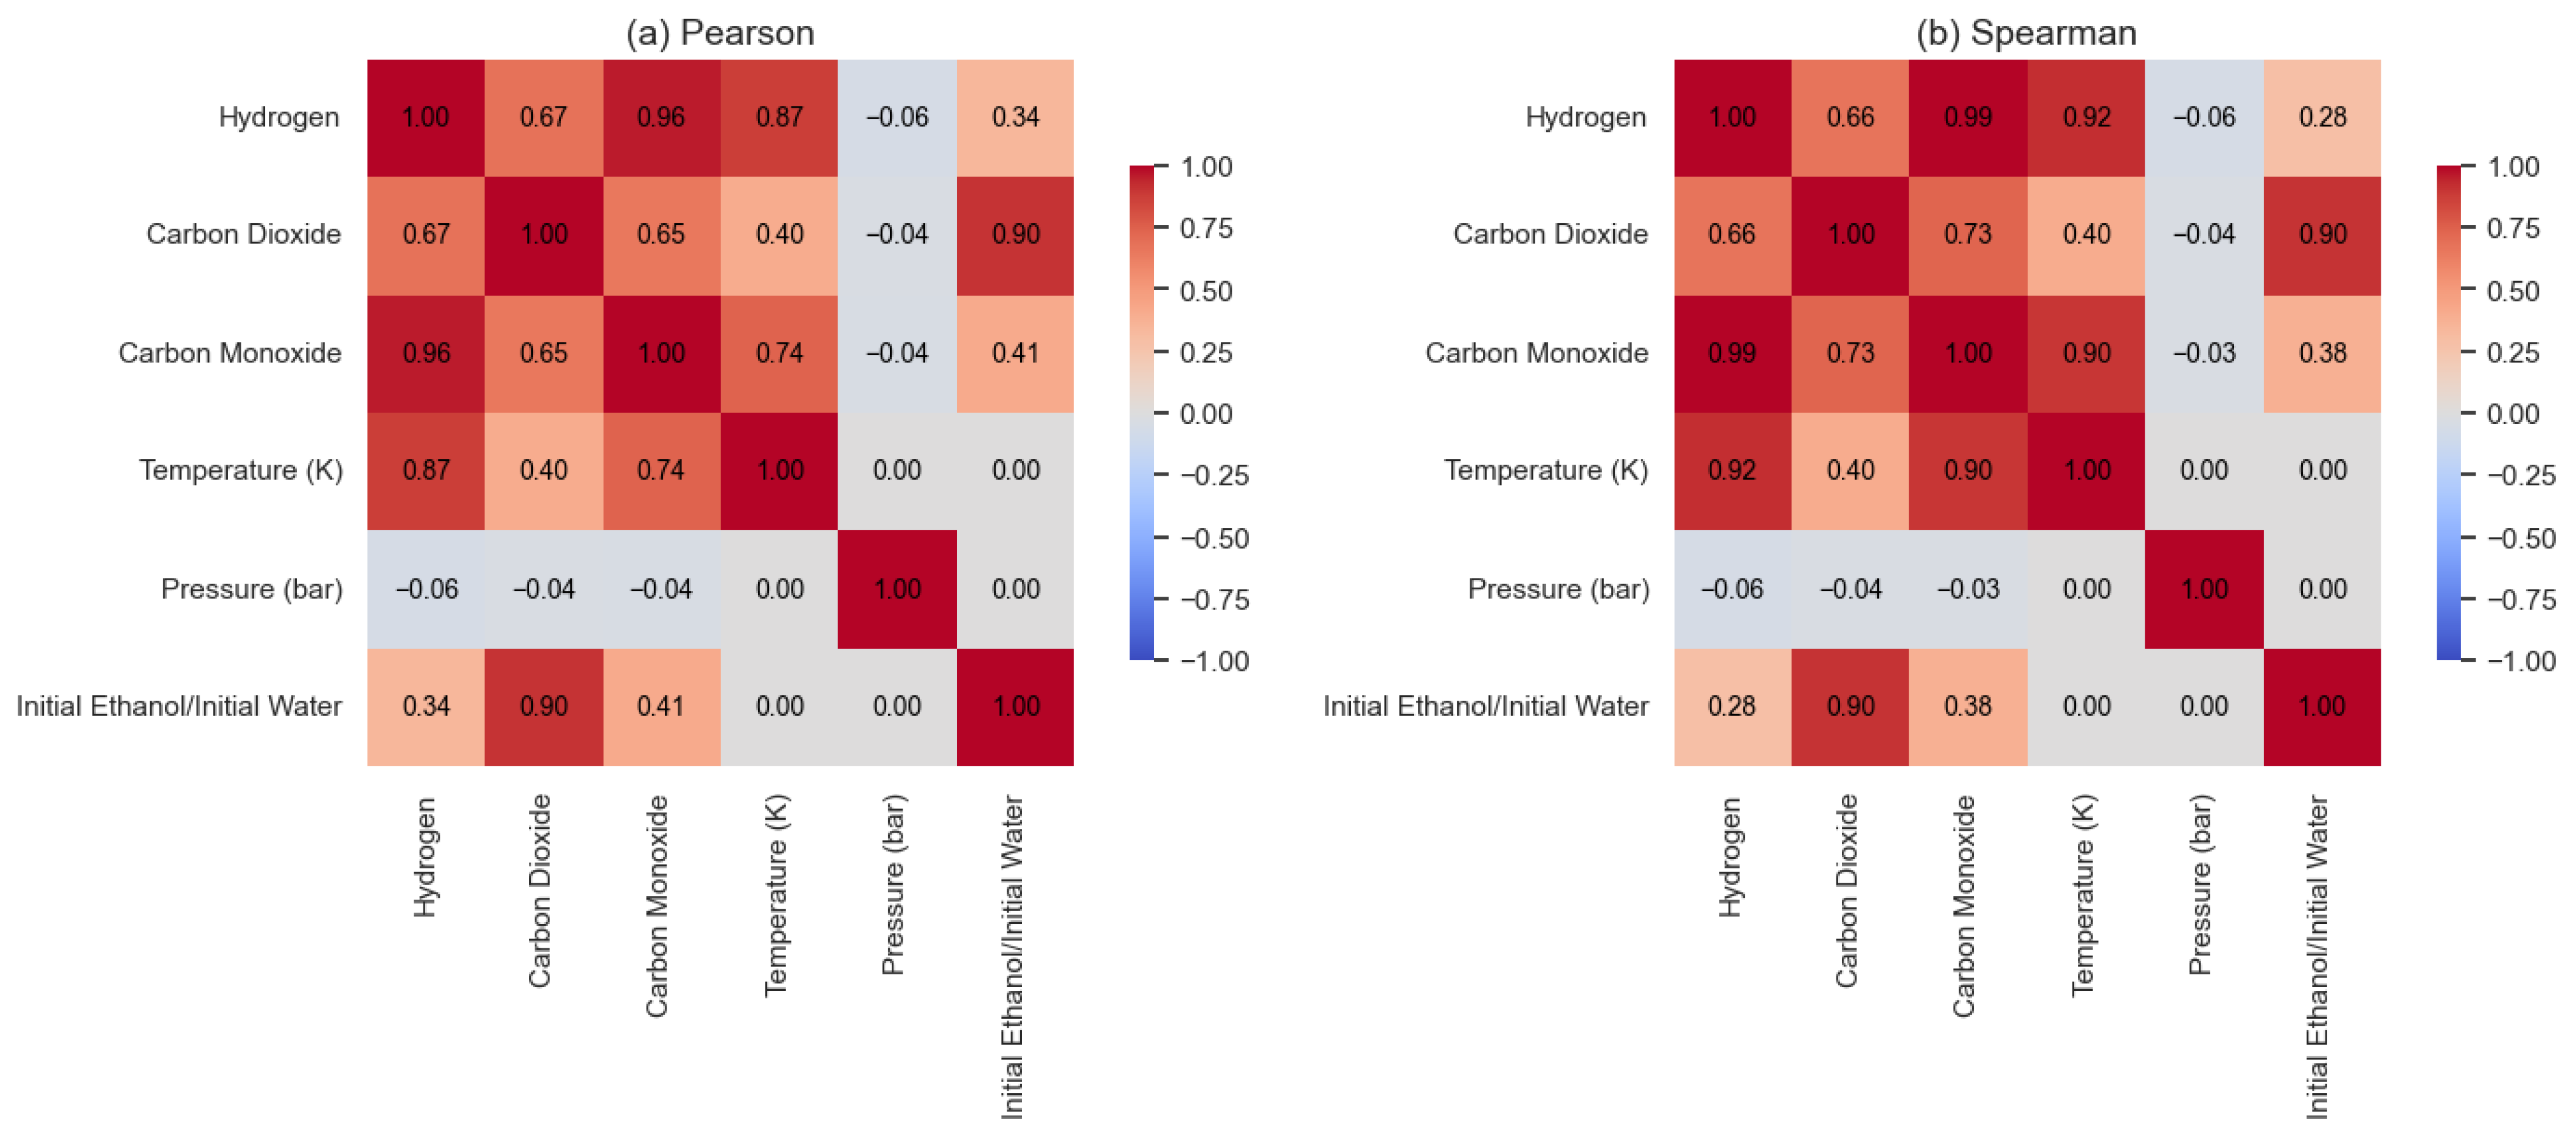
Complementarily, Figure 5 presents the correlation matrices for the variables involved in the SCWG process of ethanol. The matrices were computed in Python 3.11 using the pandas library to calculate the Pearson (linear relationships) and Spearman (monotonic relationships) correlation coefficients. The combined use of the Pearson and Spearman methods ensures a more comprehensive assessment of the relationships between process variables, as the former captures linear dependencies while the latter detects potential nonlinear trends. The analysis highlights that temperature is the dominant factor promoting hydrogen production, showing a strong positive correlation. This result reinforces the expected behavior based on thermodynamic principles, as the steam reforming reaction is endothermic and, therefore, favored at high temperatures [25,49,50,51].
On the other hand, pressure has a negligible influence on H2 yield under the studied conditions, which aligns with the well-known insensitivity of reforming reactions to pressure increases in supercritical aqueous systems, as emphasized in the results reported by Dos Santos et al. [52] and Freitas et al. [53]. The ethanol/water ratio shows a weak positive correlation with hydrogen production. This behavior can be better understood by analyzing the response surface, which reveals that the impact of this factor varies depending on the reaction temperature. At lower temperatures, the ethanol/water ratio has little effect on H2 production. However, at higher temperatures, its influence becomes significantly more pronounced. This result can be explained by the fact that the decomposition reactions of carbonaceous compounds in aqueous media are mostly endothermic and, thus, favored at higher temperatures. As a result, under elevated temperature conditions, the system tends to decompose more ethanol, leading to increased H2 production.
The correlations between the products also provide important insights. Hydrogen shows a strong association with carbon monoxide and, to a lesser extent, with carbon dioxide. This indicates that these compounds are generated through common reaction pathways, primarily via the steam reforming of ethanol and water–gas shift reactions, both of which are favored at high temperatures.
The similarity between the Pearson and Spearman coefficients across the correlation matrix suggests that the relationships between variables are predominantly linear or monotonic, with little influence from outliers. This adds robustness to the statistical analysis and supports the use of simple predictive models to represent the system’s behavior.
As previously discussed, the results reinforce the fundamental competition between steam reforming and methanation throughout the SCWG process. Steam reforming, an endothermic reaction, requires high temperatures and excess water to maximize the production of hydrogen and oxidized gases (CO and CO2). In contrast, methanation, an exothermic reaction, is favored under opposite conditions, with low temperature and high ethanol concentration, leading to predominant methane formation.
Therefore, the most favorable conditions for hydrogen production in the supercritical ethanol gasification process are those that combine high temperature and low relative pressure, due to the limited influence of this variable, along with a low ethanol-to-water ratio, meaning a feed rich in water and diluted in ethanol. This configuration maximizes the extent of steam reforming, promotes efficient ethanol conversion into H2, and minimizes the formation of undesirable byproducts, such as methane.

3.2. Evaluation of the Methanol SCWG Process

This section presents the results for the SCWG of methanol. A total of 3375 simulations were conducted using the tes-thermo library, covering a wide range of operating conditions: temperatures from 773 to 1273 K, pressures from 200 to 280 bar, and methanol compositions from 3.43 to 51.61 wt% in an aqueous feed. Executed on a computer with an M3-Pro processor and 18 GB of RAM, the entire simulation set was completed in 1 min and 44.2 s. This result highlights the robustness of the thermodynamic model and its solver in handling the associated nonlinear programming problem.
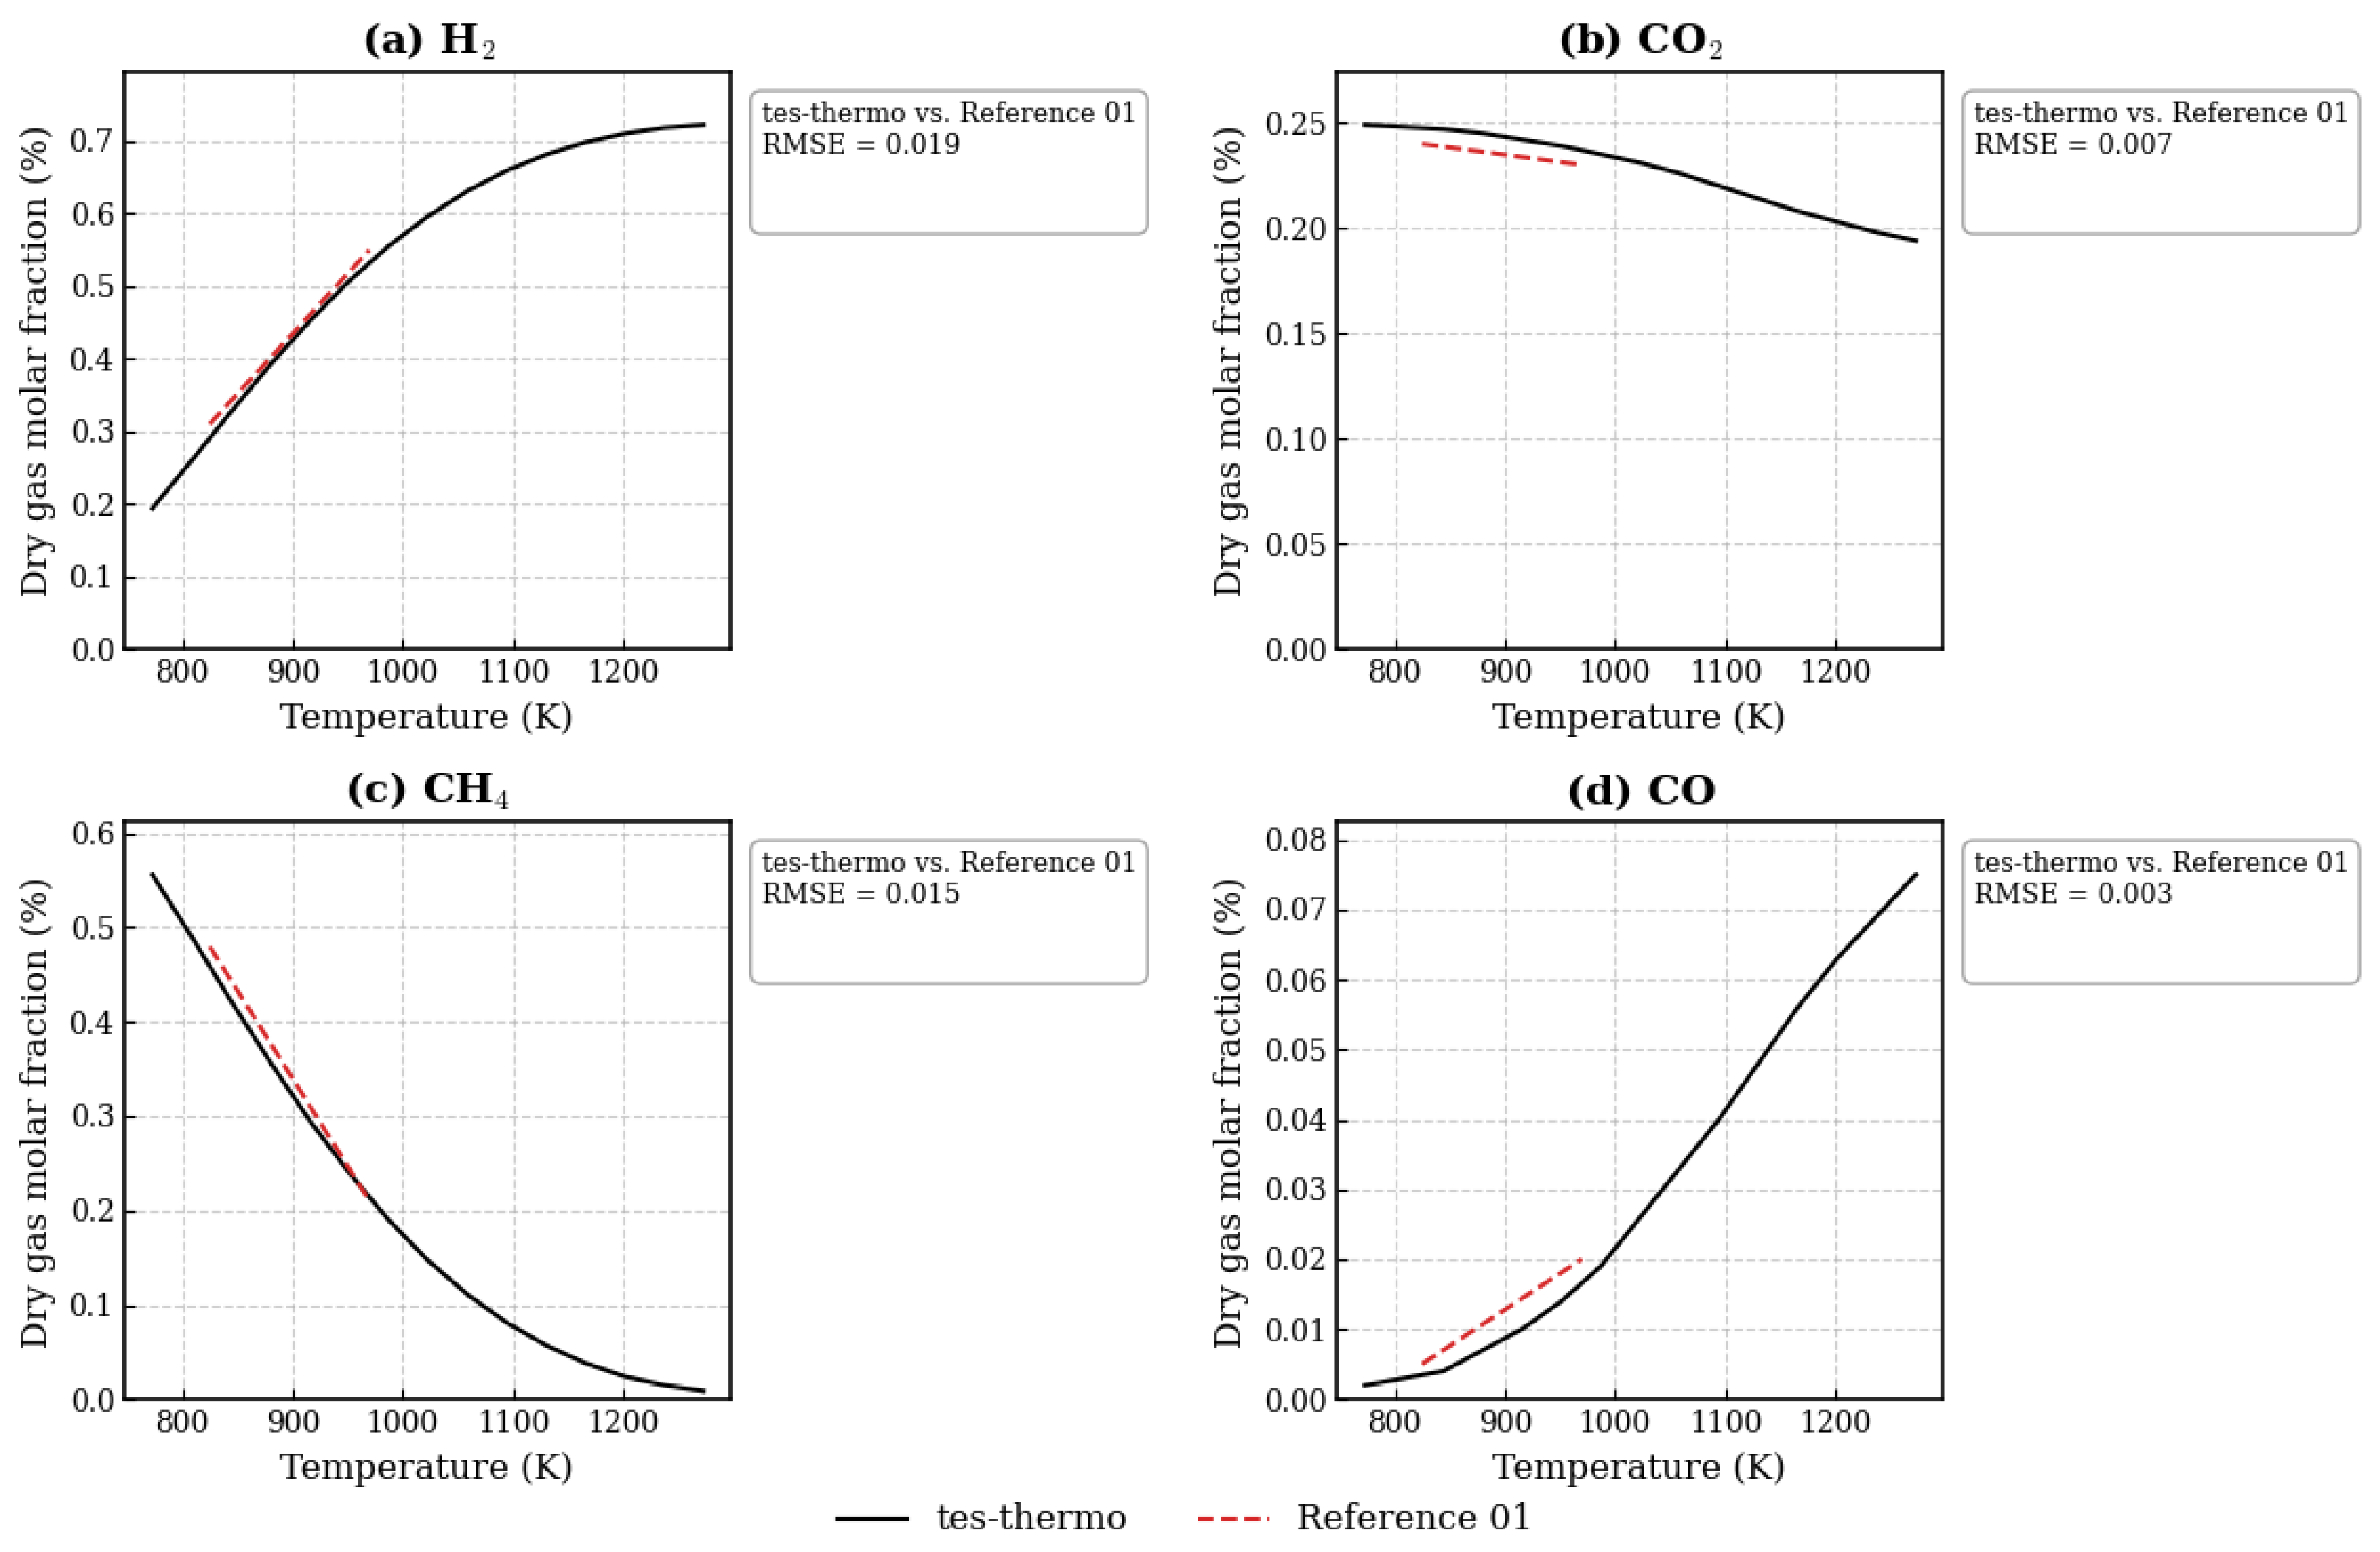
Figure 6 shows simulation results generated by tes-thermo in comparison with simulation data reported by Tang and Kitagawa [22]. This comparison is particularly relevant as the authors also adopted the Gibbs energy minimization approach and the Peng–Robinson equation of state to predict non-idealities in the system.
As an initial observation, the results in Figure 6 indicate excellent agreement between the data simulated by tes-thermo and the results reported by Tang and Kitagawa [22], which is expected considering that both follow similar methodologies. The molar fraction of hydrogen increases significantly with the rising temperature, while the molar fraction of methane decreases sharply. This opposing behavior is consistent with the equilibrium of the methanation reaction (CO + 3H2 ⇌ CH4 + H2O), as indicated by Tang and Kitagawa [22]. Since the methanation reaction is exothermic, increasing the temperature shifts the equilibrium to the left, disfavoring methane formation and consequently resulting in higher concentrations of hydrogen and carbon monoxide in the system.
It is also observed that the molar fraction of carbon dioxide remains relatively constant throughout the analyzed temperature range, with a slight decreasing trend at higher temperatures. This behavior may indicate that CO2 formation during the SCWG of methanol is primarily associated with equilibrium reactions within the system, rather than being a direct result of methanol’s thermal decomposition throughout the process. Carbon monoxide, in turn, exhibits near-zero concentrations at lower temperatures, with a slight increase beginning around 1000 K.
The slight rise in CO concentration at higher temperatures can be attributed to the reverse shift of the water–gas shift reaction (CO + H2O ⇌ CO2 + H2), which reduces the conversion of CO into CO2. Additionally, the thermal decomposition of methanol (CH3OH ⇌ CO + 2H2), which is thermally favored and becomes more prominent with increasing temperature, also contributes.
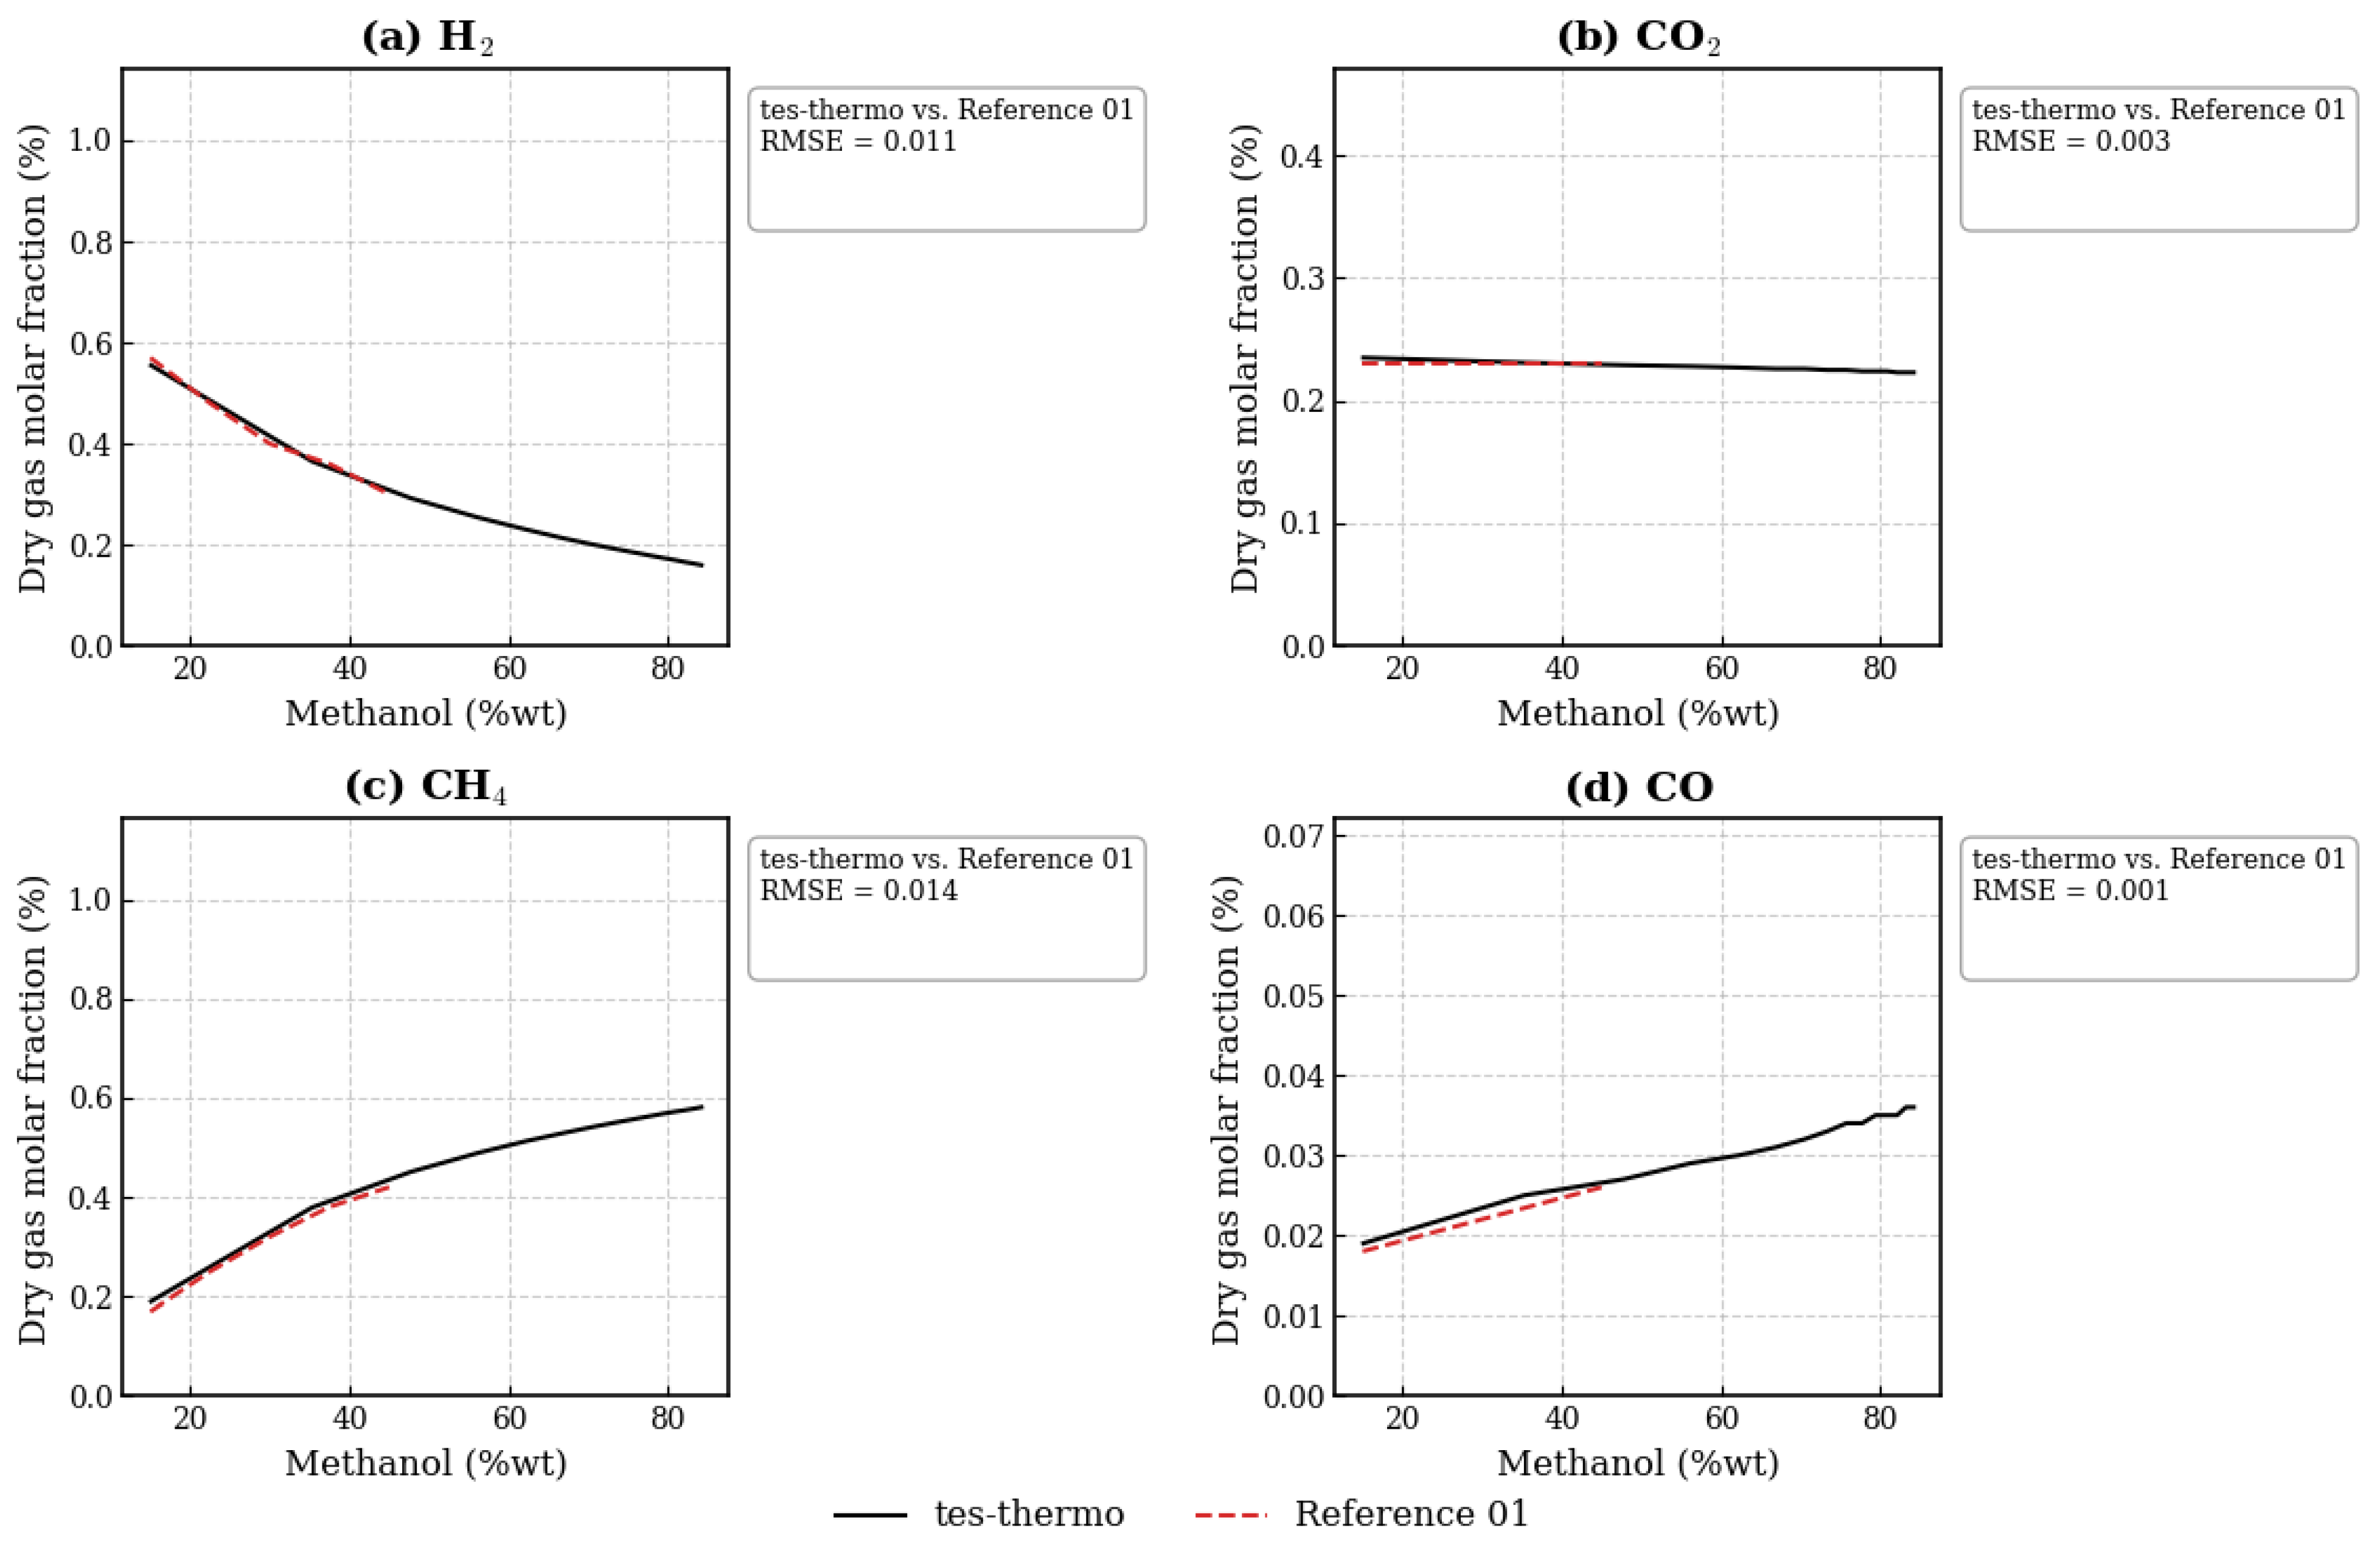
Figure 7 presents the isolated effect of methanol concentration on product formation throughout the process. For this analysis, the temperature was fixed at 973 K and the pressure at 27.6 MPa, following the simulation conditions reported by Tang and Kitagawa [22].
The results shown in Figure 7 confirm the excellent agreement between the simulated data from tes-thermo and the results reported by Tang and Kitagawa [22]. The data indicate that the molar fraction of hydrogen decreases continuously with increasing methanol concentration in the feed, while, in contrast, the molar fraction of methane increases. This behavior is explained by the effect of the reactant ratio on chemical equilibrium. A higher methanol concentration implies a lower water-to-methanol molar ratio in the system. Since water is a key reactant in the steam reforming of methane, its reduced availability shifts the equilibrium of this reaction to the left, inhibiting methane consumption and, consequently, decreasing hydrogen production.
It is also observed that the molar fractions of both carbon dioxide and carbon monoxide remain notably constant across the entire range of methanol concentrations analyzed. The CO yield remains nearly zero. This behavior suggests that at the operating temperature of 973 K, the equilibrium of the water–gas shift reaction, which governs the relative concentrations of CO and CO2, is largely insensitive to changes in feed concentration, maintaining a stable balance between these components even as the equilibrium between hydrogen and methane is altered. This result reinforces the previously described behavior regarding the maintenance of CO2 concentration in the system, emphasizing that these compounds do not appear as direct products of methanol thermal decomposition but rather because of the tight thermodynamic correlations occurring at the chemical equilibrium of this complex reactive system.
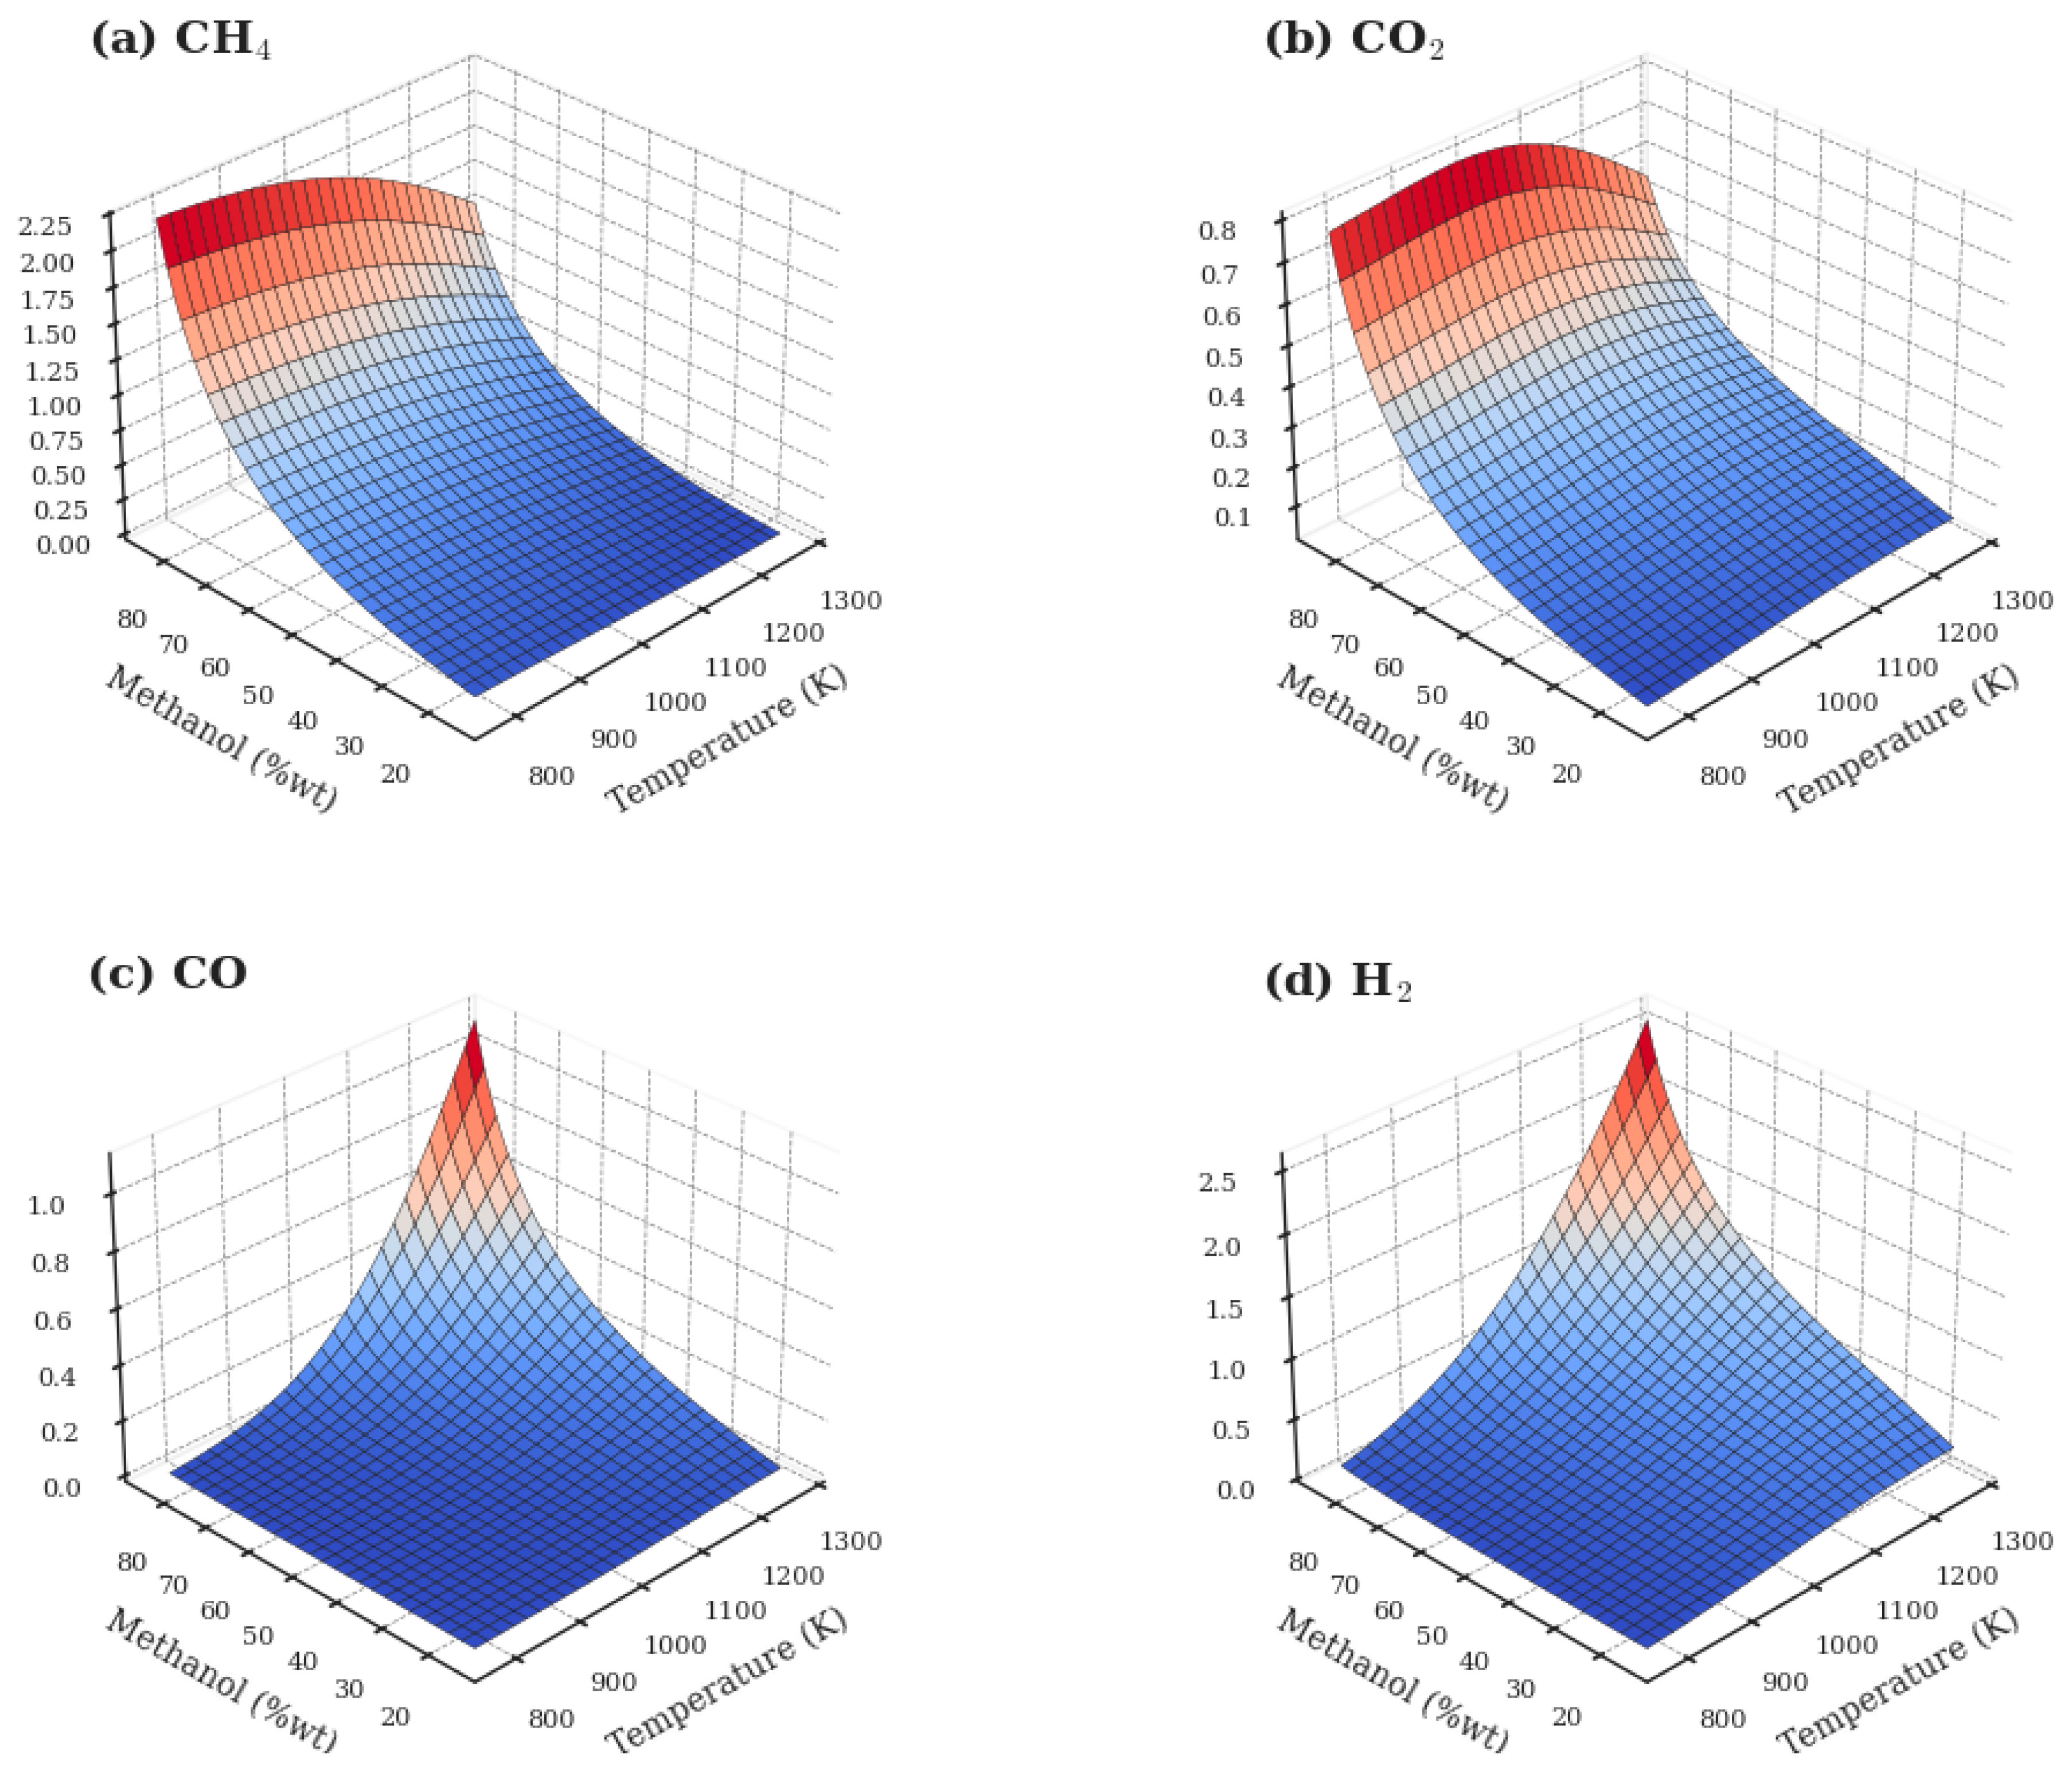
Figure 8 presents the combined effects of temperature and methanol composition on product formation. For these results, the pressure was fixed at 22.8 MPa. The analysis of Figure 8a, related to methane, and Figure 8d, related to hydrogen, reveals the central competition of the process. Methane formation is maximized at low temperatures and high methanol concentrations. In direct contrast, hydrogen yield is maximized under opposite conditions: high temperatures and low methanol concentrations. This opposing behavior visually confirms the competition between the methanation reaction, which is exothermic and favored at low temperatures, and the steam reforming reactions, which are endothermic and favored at high temperatures. Additionally, a low methanol concentration, corresponding to a high water/methanol ratio, promotes reforming reactions that consume water as a reactant, thereby enhancing hydrogen production.
Figure 8b indicates that carbon dioxide formation is favored at higher temperatures and higher methanol concentrations, conditions that promote the water–gas shift reaction toward the products. In turn, Figure 8c shows that carbon monoxide formation is favored at high temperatures. This occurs because increasing the temperature can reverse the water–gas shift reaction and intensify the primary decomposition of methanol into CO and hydrogen.
To complete the understanding of how the process variables correlate with product formation throughout the SCWG of methanol, Figure 9 presents the Pearson and Spearman correlation matrices for the process variables.
As expected, temperature stands out as the most influential variable in promoting hydrogen production, reinforcing its central role in reforming reactions in supercritical water. The production of hydrogen and carbon monoxide shows a very strong correlation, indicating that both are generated by the same reaction pathways favored at high temperatures.
On the other hand, pressure shows an insignificant impact on the formed products, maintaining an almost zero correlation with the other variables. The methanol-to-water ratio presents a weaker positive correlation trend with hydrogen, a result very similar to what was previously reported for ethanol, indicating that similar reactive pathways are followed by both compounds throughout their thermal decomposition during the SCWG process. In none of the simulated cases was solid carbon formation observed, which was expected since the excess water used in SCWG processes normally inhibits the formation of this compound. Similar results were reported by Freitas and Guirardello [48] when studying the SCWG of glycerol.

4. Conclusions

A thermodynamic analysis of the supercritical water gasification of ethanol and methanol was carried out using the tes-thermo Python library based on Gibbs energy minimization, the IPOPT solver, and the Peng–Robinson equation of state. The methodology proved to be robust and reliable, with the results showing excellent agreement with both experimental data and simulation results reported in the literature.
The study confirmed that temperature is the most influential process variable on the equilibrium composition for both feedstocks, exerting a strong positive effect on hydrogen production. High temperatures (above 1000 K) favor reforming reactions, leading to high H2 yields and suppressing methanation, which prevails at lower temperatures. Feed composition was also shown to be critical, with low alcohol concentrations (high water-to-feedstock ratios) enhancing hydrogen production. In both cases, pressure demonstrated a negligible impact on the equilibrium products, reinforcing its secondary role in SCWG processes.
A relevant contribution of this study was the elucidation of the role of residence time in interpreting discrepancies between experimental data and equilibrium simulations. In the case of ethanol, larger deviations were attributed to kinetic limitations when the reaction time is insufficient for the system to reach equilibrium. This supports the validity of the thermodynamic approach under appropriate operating conditions for investigating the reactive behavior of such systems.
In summary, for the purpose of maximizing H2 production, the most favorable conditions for both processes are those that combine high temperatures with low concentrations of carbonaceous feedstock. The model implemented in tes-thermo proved to be an efficient and robust predictive tool for the analysis and planning of renewable hydrogen production systems. Computational times under 2 min were observed for over 6000 simulations. Although this study focuses on the application of the methodology to the SCWG of methanol and ethanol, it is fully adaptable to the assessment of a wide range of reactive systems, demonstrating its versatility and potential for broader thermodynamic investigations.

5. Patents

The results presented in this article were developed using the tes-thermo library. This software was developed by the authors of this text, and this article marks the first publication using the python library version of this tool. The TeS was registered by the National Institute of Industrial Property with registration number BR512025000478-8.

Author Contributions

J.M.d.S.J., project proposal, methodology, and software development. J.M.d.S.J., research and validation. J.M.d.S.J., development of the results. J.M.d.S.J., A.P.M., and A.C.D.d.F., constant evaluation of the results. A.P.M. and A.C.D.d.F., supervision and guidance throughout the development of the article. All authors have read and agreed to the published version of the manuscript.

Funding

This research received no external funding.

Data Availability Statement

The data presented in this study were generated through simulations based on the previously described thermodynamic approach. As discussed throughout the text, the simulation tool used (TeS) was developed to support academic studies and research in general. The simulator is publicly available here: ttps://drive.google.com/drive/folders/1LcWpOegJ5ZtYXLJ4KtCQ49mqevA0mckz (accessed on 27 August 2025); the python library version is available here: https://pypi.org/project/tes-thermo/ (accessed on 27 August 2025).

Acknowledgments

The authors extend their gratitude to the dedicated faculty at the University of Campinas and the Federal University of Maranhão for their invaluable contributions to the personal and professional growth of countless people, as well as to all educators who actively promote the advancement of society.

Conflicts of Interest

The authors declare no conflicts of interest.

Nomenclatures

GTotal Gibbs energy.
lLiquid phase.
sSolid phase.
vVapor phase.
NCNumber of components.
NFNumber of phases.
n i k Number of moles of component i in phase k; i = [1, 2, 3, …, NC]; k = [v, l, s].
RUniversal gas constant.
TTemperature.
PPressure.
µikChemical potential of component i in phase k; i = [1, 2, 3, …, NC]; k = [v, l, s].
f ^ i k Fugacity of component i in phase k.
f i o Fugacity of pure species i in a standard reference state.
a m i Number of atoms of element i in component m.
n i o Number of moles in standard state.
H i k Enthalpy of component i in phase k.
H i 0 Enthalpy of component i in the standard state.
H0Total enthalpy.
μ i 0 Chemical potential of component i in a standard reference state.
^ i k Coefficient of fugacity of component i in phase k; i = [1, 2, 3, …, NC]; k = [v, l].
y i Mole fraction of component i in the vapor phase.
x i Molar fraction of component i in the liquid phase.
P i s a t Component saturation pressure i.
ZiCompressibility factor.
A, B, u, wParameters of the cubic equation of state.
amAttraction parameter for mixtures.
bmRepulsion parameter for mixtures.
kijBinary interaction parameter.
Tc,iCritical component temperature i.
Pc,iCritical component pressure i.
wiAcentric factor.
nNumber of moles.

References

  1. Seider, W.D.; Lewin, D.R.; Seader, J.D.; Widagdo, S.; Gani, R.; Ng, K.M. Product and Process Design Principles: Synthesis, Analysis and Evaluation; John Wiley & Sons: Hoboken, NJ, USA, 2016. [Google Scholar]
  2. Seborg, D.E.; Edgar, T.F.; Mellichamp, D.A.; Doyle, F.J., III. Process Dynamics and Control; John Wiley & Sons: Hoboken, NJ, USA, 2016. [Google Scholar]
  3. Biegler, L.T. Nonlinear Programming: Concepts, Algorithms, and Applications to Chemical Processes; SIAM: Philadelphia, PA, USA, 2010. [Google Scholar]
  4. Turton, R.; Bailie, R.C.; Whiting, W.B.; Shaeiwitz, J.A. Analysis, Synthesis and Design of Chemical Processes; Pearson Education: Upper Saddle River, NJ, USA, 2008. [Google Scholar]
  5. Al-Malah, K.I.M. Aspen Plus: Chemical Engineering Applications; John Wiley & Sons: Hoboken, NJ, USA, 2022. [Google Scholar]
  6. Hantoko, D.; Yan, M.; Prabowo, B.; Susanto, H.; Li, X.; Chen, C. Aspen Plus Modeling Approach in Solid Waste Gasification. In Current Developments in Biotechnology and Bioengineering; Elsevier: Amsterdam, The Netherlands, 2019; pp. 259–281. [Google Scholar] [CrossRef]
  7. Alqaheem, Y.; Alobaid, M. Development of a membrane process in CAPE-OPEN to CAPE-OPEN (COCO) simulator for carbon dioxide separation. Results Eng. 2024, 22, 102239. [Google Scholar] [CrossRef]
  8. Sandrock, C.; de Vaal, P.L. Dynamic simulation of Chemical Engineering systems using OpenModelica and CAPE-OPEN. Comput. Aided Chem. Eng. 2009, 26, 859–864. [Google Scholar] [CrossRef]
  9. Andreadou, C.; Martinopoulos, G. CAPE-OPEN simulation of waste-to-energy technologies for urban cities. Int. J. Sustain. Energy 2018, 37, 96–104. [Google Scholar] [CrossRef]
  10. Sreemahadevan, S.; Sivakumar, K.V.; Palanisamy, M. Evaluation of the Open Source Process Simulator DWSIM for Bioprocess Simulation. Period. Polytech. Chem. Eng. 2024, 68, 195–202. [Google Scholar] [CrossRef]
  11. Ullah, K.; Asaad, S.M.; Inayat, A. Process modelling and optimization of hydrogen production from biogas by integrating DWSIM with response surface methodology. Digit. Chem. Eng. 2025, 14, 100205. [Google Scholar] [CrossRef]
  12. Hassan, T.N.; Manji, S.T. Simulating Combined Cycle and Gas Turbine Power Plant under Design Condition using Open-Source Software DWSIM. ARO-Sci. J. KOYA Univ. 2023, 11, 60–71. [Google Scholar] [CrossRef]
  13. Tangsriwong, K.; Lapchit, P.; Kittijungjit, T.; Klamrassamee, T.; Sukjai, Y.; Laoonual, Y. Modeling of chemical processes using commercial and open-source software: A comparison between Aspen Plus and DWSIM. IOP Conf. Ser. Earth Environ. Sci. 2020, 463, 012057. [Google Scholar] [CrossRef]
  14. Goodwin, D.G.; Moffat, H.; Speth, R.L. Cantera: An Object-Oriented Software Toolkit for Chemical Kinetics, Thermodynamics, and Transport Processes. Version 2.2.1. 2016. Available online: https://api.semanticscholar.org/CorpusID:86382900 (accessed on 25 August 2025).
  15. Leader, M.; McTague, M.; Lavelle, T.; Wang, X.; Dickens, K.; Hill, J. NASA Chemical Equilibrium with Applications (CEA) Tutorial. In Proceedings of the AIAA SciTech Forum, Orlando, FL, USA, 6–10 January 2025. [Google Scholar]
  16. Rossum, V. Python 3 Reference Manual; CreateSpace: Scotts Valley, CA, USA, 2009. [Google Scholar]
  17. McKinney, W. Data structures for statistical computing in Python. SciPy 2010, 445, 51–56. [Google Scholar]
  18. Dechamps, P. The IEA World Energy Outlook 2022—A brief analysis and implications. Eur. Energy Clim. J. 2023, 11, 100–103. [Google Scholar] [CrossRef]
  19. Peterson, A.A.; Vogel, F.; Lachance, R.P.; Fröling, M., Jr.; Antal, M.J.; Tester, J.W. Thermochemical biofuel production in hydrothermal media: A review of sub- and supercritical water technologies. Energy Environ. Sci. 2008, 1, 32. [Google Scholar] [CrossRef]
  20. Matsumura, Y.; Minowa, T.; Potic, B.; Kersten, S.; Prins, W.; Vanswaaij, W.; Vandebeld, B.; Elliott, D.; Neuenschwander, G.; Kruse, A. Biomass gasification in near- and super-critical water: Status and prospects. Biomass Bioenergy 2005, 29, 269–292. [Google Scholar] [CrossRef]
  21. Dincer, I.; Acar, C. Review and evaluation of hydrogen production methods for better sustainability. Int. J. Hydrogen Energy 2015, 40, 11094–11111. [Google Scholar] [CrossRef]
  22. Tang, H.; Kitagawa, K. Supercritical water gasification of biomass: Thermodynamic analysis with direct Gibbs free energy minimization. Chem. Eng. J. 2005, 106, 261–267. [Google Scholar] [CrossRef]
  23. Ciuffi, B.; Chiaramonti, D.; Rizzo, A.M.; Frediani, M.; Rosi, L. A critical review of SCWG in the context of available gasification technologies for plastic waste. Appl. Sci. 2020, 10, 6307. [Google Scholar] [CrossRef]
  24. De Blasio, C.; Järvinen, M. Supercritical Water Gasification of Biomass. In Encyclopedia of Sustainable Technologies; Elsevier: Amsterdam, The Netherlands, 2017; pp. 171–195. [Google Scholar] [CrossRef]
  25. Castello, D.; Fiori, L. Supercritical water gasification of biomass: Thermodynamic constraints. Bioresour. Technol. 2011, 102, 7574–7582. [Google Scholar] [CrossRef]
  26. Basu, P.; Mettanant, V. Biomass Gasification in Supercritical Water—A Review. Int. J. Chem. React. Eng. 2009, 7. [Google Scholar] [CrossRef]
  27. Reddy, S.N.; Nanda, S.; Dalai, A.K.; Kozinski, J.A. Supercritical water gasification of biomass for hydrogen production. Int. J. Hydrogen Energy 2014, 39, 6912–6926. [Google Scholar] [CrossRef]
  28. Voll, F.A.P.; Rossi, C.C.R.S.; Silva, C.; Guirardello, R.; Souza, R.O.M.A.; Cabral, V.F.; Cardozo-Filho, L. Thermodynamic analysis of supercritical water gasification of methanol, ethanol, glycerol, glucose and cellulose. Int. J. Hydrogen Energy 2009, 34, 9737–9744. [Google Scholar] [CrossRef]
  29. Junior, J.M.D.S.; de Freitas, A.C.D.; Mariano, A.P. An AI-Assisted Thermodynamic Equilibrium Simulator: A Case Study on Steam Methane Reforming in Isothermal and Adiabatic Reactors. Processes 2025, 13, 2508. [Google Scholar] [CrossRef]
  30. Castillo, J.; Grossmann, I.E. Computation of phase and chemical equilibria. Comput. Chem. Eng. 1981, 5, 99–108. [Google Scholar] [CrossRef]
  31. Smith, J.M.; Van Ness, H.C.; Abbott, M.M.; Swihart, M.T. Introduction to Chemical Engineering Thermodynamics; McGraw-Hill: Singapore, 2018. [Google Scholar]
  32. Robinson, D.B.; Peng, D.-Y.; Ng, H.-J. Applications of the Peng-Robinson Equation of State; American Chemical Society: Washington, DC, USA, 1977; pp. 200–220. [Google Scholar] [CrossRef]
  33. Ghanbari, M.; Ahmadi, M.; Lashanizadegan, A. A comparison between Peng-Robinson and Soave-Redlich-Kwong cubic equations of state from modification perspective. Cryogenics 2017, 84, 13–19. [Google Scholar] [CrossRef]
  34. Soave, G. Equilibrium constants from a modified Redlich-Kwong equation of state. Chem. Eng. Sci. 1972, 27, 1197–1203. [Google Scholar] [CrossRef]
  35. Tsonopoulos, C. An empirical correlation of second virial coefficients. AIChE J. 1974, 20, 263–272. [Google Scholar] [CrossRef]
  36. Gomes, J.G.; Mitoura, J.; Guirardello, R. Thermodynamic analysis for hydrogen production from the reaction of subcritical and supercritical gasification of the C. Vulgaris microalgae. Energy 2022, 260, 125030. [Google Scholar] [CrossRef]
  37. Junior, J.M.D.S.; Mariano, A.P. Gasification of Lignocellulosic Waste in Supercritical Water: Study of Thermodynamic Equilibrium as a Nonlinear Programming Problem. Eng 2024, 5, 1096–1111. [Google Scholar] [CrossRef]
  38. Freitas, A.C.D.; Guirardello, R. Use of CO2 as a co-reactant to promote syngas production in supercritical water gasification of sugarcane bagasse. J. CO2 Util. 2015, 9, 66–73. [Google Scholar] [CrossRef]
  39. Barros, T.V.; Carregosa, J.D.C.; Jr, A.W.; Freitas, A.C.D.; Guirardello, R.; Ferreira-Pinto, L.; Bonfim-Rocha, L.; Jegatheesan, V.; Cardozo-Filho, L. Assessment of black liquor hydrothermal treatment under sub- and supercritical conditions: Products distribution and economic perspectives. Chemosphere 2022, 286, 131774. [Google Scholar] [CrossRef]
  40. Freitas, A.C.D.; Guirardello, R. Oxidative reforming of methane for hydrogen and synthesis gas production: Thermodynamic equilibrium analysis. J. Nat. Gas Chem. 2012, 21, 571–580. [Google Scholar] [CrossRef]
  41. Yan, Q.; Guo, L.; Lu, Y. Thermodynamic analysis of hydrogen production from biomass gasification in supercritical water. Energy Convers. Manag. 2006, 47, 1515–1528. [Google Scholar] [CrossRef]
  42. Feng, W.; van der Kooi, H.J.; de Swaan Arons, J. Biomass conversions in subcritical and supercritical water: Driving force, phase equilibria, and thermodynamic analysis. Chem. Eng. Process. Process Intensif. 2004, 43, 1459–1467. [Google Scholar] [CrossRef]
  43. Poling, B.E.; Prausnitz, J.M.; O’connell, J.P. Properties of Gases and Liquids; McGraw-Hill Education: New York, NY, USA, 2001. [Google Scholar]
  44. Hart, W.E.; Laird, C.D.; Watson, J.-P.; Woodruff, D.L.; Hackebeil, G.A.; Nicholson, B.L.; Siirola, J.D. Pyomo-Optimization Modeling in Python; Springer: Berlin/Heidelberg, Germany, 2017. [Google Scholar]
  45. Wächter, A.; Biegler, L.T. On the implementation of an interior-point filter line-search algorithm for large-scale nonlinear programming. Math Program 2006, 106, 25–57. [Google Scholar] [CrossRef]
  46. Santos, J.J.M.; Zelioli, Í.A.M.; Guimarães, F.E.É.X.; Freitas, A.C.D.; Mariano, A.P. Supercritical water gasification thermodynamic study and hybrid modeling of machine learning with the ideal gas model: Application to gasification of microalgae biomass. Energy 2024, 291, 130287. [Google Scholar] [CrossRef]
  47. Byrd, A.J.; Pant, K.K.; Gupta, R.B. Hydrogen Production from Ethanol by Reforming in Supercritical Water Using Ru/Al2O3 Catalyst. Energy Fuels 2007, 21, 3541–3547. [Google Scholar] [CrossRef]
  48. Freitas, A.C.D.; Guirardello, R. Comparison of several glycerol reforming methods for hydrogen and syngas production using Gibbs energy minimization. Int. J. Hydrogen Energy 2014, 39, 17969–17984. [Google Scholar] [CrossRef]
  49. Savage, P.E. Organic Chemical Reactions in Supercritical Water. Chem. Rev. 1999, 99, 603–622. [Google Scholar] [CrossRef]
  50. Guan, Q.; Wei, C.; Savage, P.E. Kinetic model for supercritical water gasification of algae. Phys. Chem. Chem. Phys. 2012, 14, 3140. [Google Scholar] [CrossRef]
  51. Correa, C.R.; Kruse, A. Supercritical water gasification of biomass for hydrogen production—Review. J. Supercrit. Fluids 2018, 133, 573–590. [Google Scholar] [CrossRef]
  52. Santos, J.M.D.; De Sousa, G.F.B.; Vidotti, A.D.S.; De Freitas, A.C.D.; Guirardello, R. Optimization of glycerol gasification process in supercritical water using thermodynamic approach. Chem. Eng. Trans. 2021, 86, 847–852. [Google Scholar] [CrossRef]
  53. Freitas, A.C.D.; Guirardello, R. Supercritical Water Gasification of Glucose and Cellulose for Hydrogen and Syngas Production. Chem. Eng. Trans. 2012, 27, 361–366. [Google Scholar] [CrossRef]
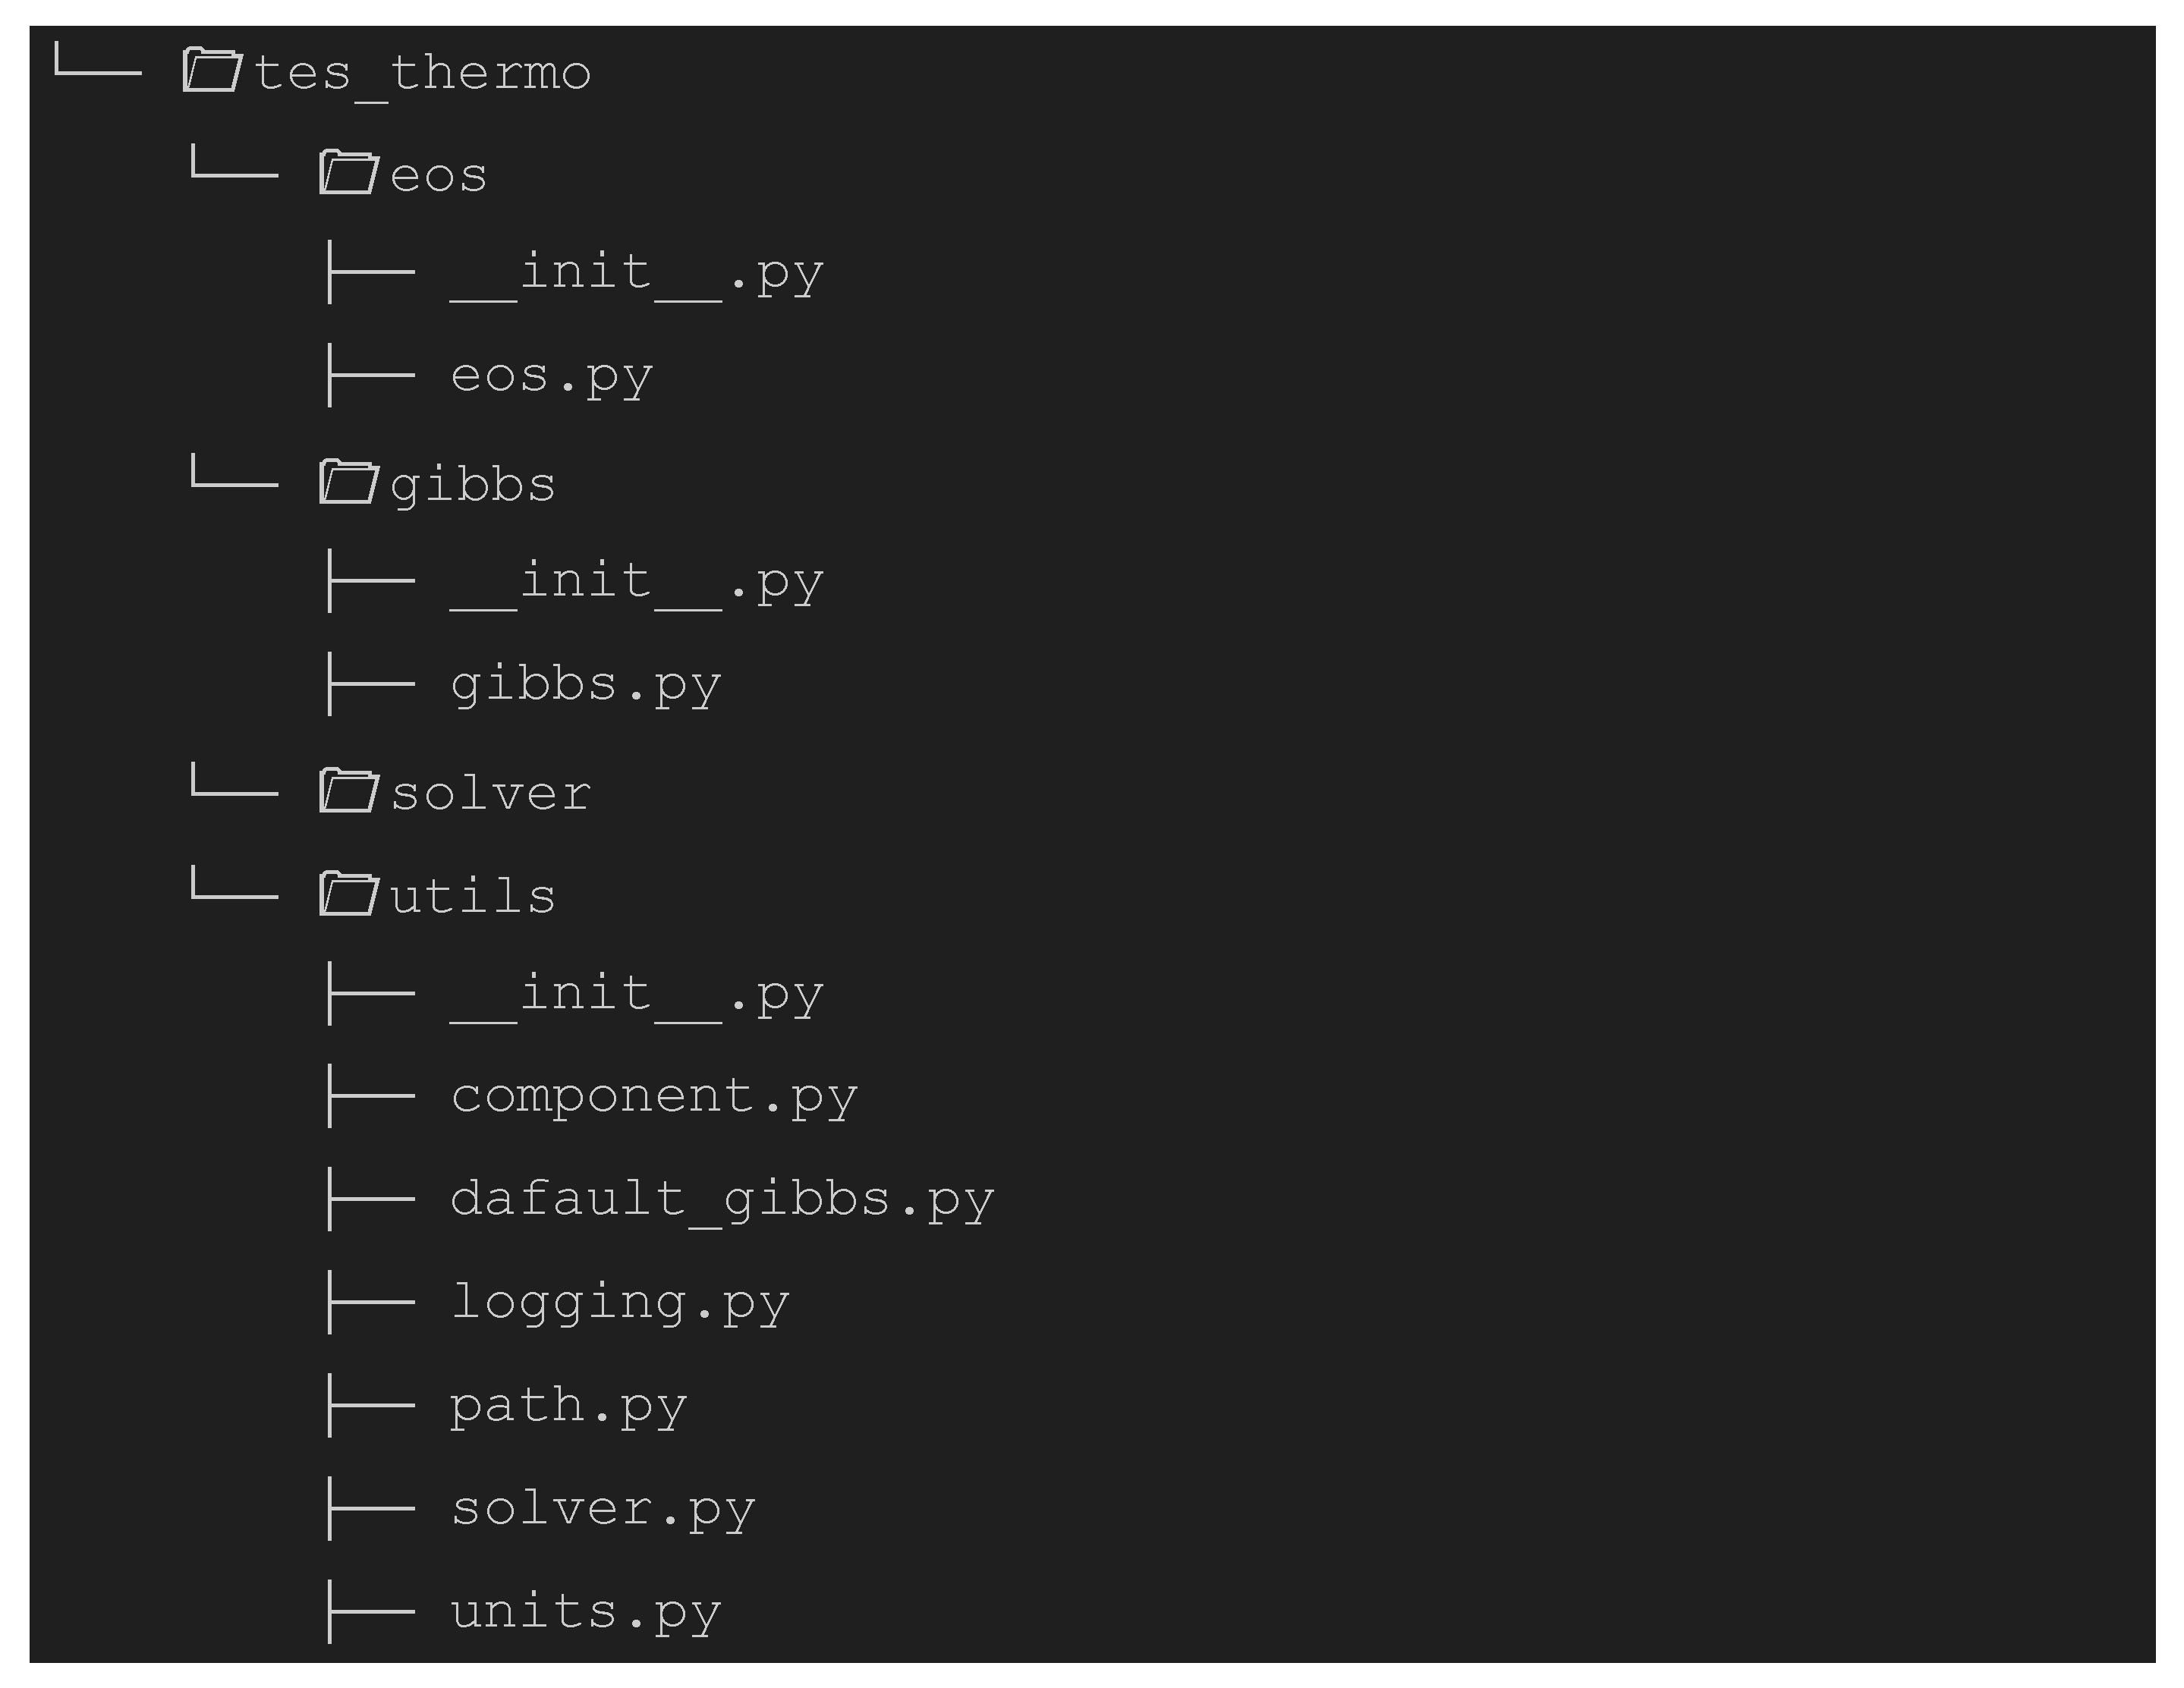
Figure 1. Structure of the tes-thermo library repository.
Eng 06 00208 g001
Figure 2. Validation of tes-thermo results against simulation results from Voll et al. [28] (Reference 01) and experimental data reported by Byrd et al. [47] (Reference 02) for the SCWG process of ethanol with feed composition fixed at 10 wt% and temperature of 973.15 K ((a): hydrogen; (b): carbon dioxide; (c): methane; (d): carbon monoxide).
Eng 06 00208 g002
Figure 3. Validation of tes-thermo results with simulated results by Voll et al. [28] (Reference 01) and experimental data reported by Byrd et al. [47] (Reference 02) for the SCWG process of ethanol at 22.1 MPa and 1073.15 K ((a): hydrogen; (b): carbon dioxide; (c): methane; (d): carbon monoxide).
Eng 06 00208 g003
Figure 4. Combined effects of reactor system temperature and ethanol feed concentration (wt%) on product formation: (a) methane, (b) carbon dioxide, (c) carbon monoxide, and (d) hydrogen.
Eng 06 00208 g004
Figure 5. Pearson (a) and Spearman (b) correlation matrices for variables of the ethanol SCWG process.
Eng 06 00208 g005
Figure 6. Validation of tes-thermo results with simulation data reported by Tang and Kitagawa [22] (Reference 01) for the SCWG process of methanol. Methanol feed fixed at 15 wt% and 27.6 MPa ((a): hydrogen; (b): carbon dioxide; (c): methane; (d): carbon monoxide).
Eng 06 00208 g006
Figure 7. Validation of tes-thermo results with simulated data from Tang and Kitagawa [22] (Reference 01) for the SCWG process of methanol at 973 K and 27.6 MPa ((a): hydrogen; (b): carbon dioxide; (c): methane; (d): carbon monoxide).
Eng 06 00208 g007
Figure 8. Combined effects of the reaction system temperature and methanol feed concentration (%wt) on product formation ((a): methane, (b): carbon dioxide, (c): carbon monoxide, and (d): hydrogen).
Eng 06 00208 g008
Figure 9. Pearson (a) and Spearman (b) correlation matrices for variables in the methanol SCWG process.
Eng 06 00208 g009
Table 1. Critical properties and formation properties, as reported by Poling et al. [43].
ComponentsTc (K)Pc (bar)ωHf (cal/mol)Gf (cal/mol)
H2O647.140220.6400.344−5.78 × 10⁴−5.46 × 10⁴
H232.98012.930−0.21700
CH4190.56045.9900.011−1.78 × 10⁴−1.21 × 10⁴
CO2304.15073.7400.225−9.41 × 10⁴−9.43 × 10⁴
CO132.85034.9400.045−2.64 × 10⁴−3.28 × 10⁴
O2154.58050.4300.02200
CH4O512.64080.9700.565−4.80 × 10⁴−3.88 × 10⁴
C2H6305.32048.7200.099−2.00 × 10⁴−7.61 × 10³
C3H8369.83042.4800.152−2.50 × 10⁴−5.81 × 10³
C2H4282.34050.4100.0871.250 × 1041.64 × 104
CH3OH512.60087.9700.564−2.351 × 10⁴−1.684 × 10⁴
C2H6O513.90061.4800.645−2.006 × 10⁴−1.619 × 10⁴
Disclaimer/Publisher’s Note: The statements, opinions and data contained in all publications are solely those of the individual author(s) and contributor(s) and not of MDPI and/or the editor(s). MDPI and/or the editor(s) disclaim responsibility for any injury to people or property resulting from any ideas, methods, instructions or products referred to in the content.