Article

Simplifying Data Processing in AFM Nanoindentation Experiments on Thin Samples

by
Stylianos Vasileios Kontomaris
1,*,
Anna Malamou
2 and
Andreas Stylianou
1,*
1
Cancer Mechanobiology and Applied Biophysics Group, School of Sciences, European University Cyprus, 2404 Nicosia, Cyprus
2
School of Electrical and Computer Engineering, National Technical University of Athens, 15773 Athens, Greece
*
Authors to whom correspondence should be addressed.
Submission received: 7 January 2025 / Revised: 3 February 2025 / Accepted: 6 February 2025 / Published: 8 February 2025
(This article belongs to the Section Materials Engineering)

Abstract

:
When testing soft biological samples using the Atomic Force Microscopy (AFM) nanoindentation method, data processing is typically based on equations derived from Hertzian mechanics. To account for the finite thickness of the samples, precise extensions of Hertzian equations have been developed for both conical and parabolic indenters. However, these equations are often avoided due to the complexity of the fitting process. In this paper, the determination of Young’s modulus is significantly simplified when testing soft, thin samples on rigid substrates. Using the weighted mean value theorem for integrals, an ‘average value’ of the correction function (symbolized as g(c)) due to the substrate effect for a specific indentation depth is derived. These values (g(c)) are presented for both conical and parabolic indentations in the domain 0 < r/H ≤ 1, where r is the contact radius between the indenter and the sample, and H is the sample’s thickness. The major advantage of this approach is that it can be applied using only the area under the force–indentation curve (which represents the work performed by the indenter) and the correction factor g(c). Examples from indentation experiments on fibroblasts, along with simulated data processed using the method presented in this paper, are also included.

1. Introduction

Atomic Force Microscopy (AFM) nanoindentation has significantly advanced biomedical sciences by facilitating the mechanical characterization of biological samples at the nanoscale [1,2,3]. This capability indicates that AFM has the potential to aid in early disease diagnosis, particularly in cancer, and to develop into a valuable clinical tool [2,4,5,6,7,8,9]. Hertzian mechanics has been widely utilized for data analysis, yielding highly significant results over the past two decades [10,11,12,13,14,15,16,17,18,19,20,21,22,23,24,25]. It is important to note that the equations of Hertzian mechanics are valid when considering samples with infinite depth [26,27,28,29,30,31,32]. For this purpose, these equations have also been modified to address the case of thin homogeneous samples tested on rigid substrates [26,27,28,29]. For a homogeneous sample of finite thickness, the relationship between the applied force by the indenter (F), the indentation depth (δ) and the sample thickness (H) is expressed as follows [26,27,28]:
F = F i n f . t h i c k n e s s f δ , H
In Equation (1), F i n f . t h i c k n e s s represents the classical equation of Hertzian mechanics, while f ( δ , H ) is a function that depends on the indentation depth, the sample’s thickness and whether the sample is bonded to the substrate [26,27,28,29]. For δ / H 0 , f δ , H 1 . In addition, both the F i n f . t h i c k n e s s and f ( δ , H ) functions depend on the shape of the indenter. For axisymmetric indenters, Equation (1) can also be expressed as follows [26,27,28]:
F = a δ n f δ , H
where a , n are positive constants that depend solely on the properties of the tested sample and the indenter. For example, for conical indenters [33,34],
a = 2 π Ε 1 v 2 tan θ ,   n = 2
where E , v are the Young’s modulus and Poisson’s ratio of the tested sample, respectively, and θ is the cone’s half-angle. In AFM indentation experiments, typical pyramidal indenters are often approximated as perfect cones [27]. For parabolic indenters (or spherical indenters at small indentation depths relative to the tip radius) [33,34]:
a = 4 3 Ε 1 v 2 R 1 / 2 ,   n = 3 / 2
where R is the indenter’s radius. In addition, several functions for the correction factor f δ , H have been proposed in the literature. For conical indenters, f δ , H is a polynomial function [27,28,29]:
f δ , H = 1 + c 1 δ H + c 2 δ H 2 + c 3 δ H 2 + c 4 δ H 2
where the coefficients c 1 , c 2 , c 3 and c 4 depend on the cone’s half-angle and whether the sample is bonded to the substrate or not. Gavara and Chadwick derived a general equation valid for any cone’s half-angle [28]. According to their equation, c 1 = β 2 t a n ( θ ) π 2 and c 2 = 16 β 2 tan 2 θ , where β = 1.7795 for adherent and β = 0.388 for non-adherent samples. Higher-order terms are neglected in this model. A more recent equation was derived by Garcia and Garcia [29], focusing on soft biological materials bonded to the substrate with a Poisson’s ratio of 0.5 (due to the high water content). According to this model, c 1 = 0.721 tan ( θ ) , c 2 = 0.650 tan 2 ( θ ) , c 3 = 0.491 tan 3 ( θ ) and c 4 = 0.225 tan 4 ( θ ) [29]. Therefore,
F δ = 8 3 π E tan θ δ 2 1 + 0.721 tan θ δ H + 0.650 tan 2 θ δ H 2 + 0.491 tan 3 θ δ H 3 + 0.225 tan 4 θ δ H 4  
In this case, four terms are present. Other models have also been proposed in the literature. For example, according to Santos et al.’s model, for non-adherent samples to the substrate, with semi-angles in the range of 60 ° θ 80 ° , c 1 = 0.2664 tan ( θ ) , c 2 = 1.173 tan 2 ( θ ) , c 3 = 0.98 tan 3 ( θ ) and c 4 = 0.5168 tan 4 ( θ ) [27]. For adherent samples to the substrate, c 1 = 0.6298 tan ( θ ) , c 2 = 0.7236 tan 2 ( θ ) , c 3 = 1.249 tan 3 ( θ ) and c 4 = 0.3556 tan 4 ( θ ) [27]. In both the Santos et al. and Garcia and Garcia models, powers higher than the 4th are neglected [27,29]. For the case of parabolic indentations (or spherical indentations considering small indentation depths relative to the tip radius) and v = 0.5 [26]:
F = 16 9 E R 1 / 2 δ 3 / 2 1 + c 1 R 1 / 2 δ 1 / 2 H + c 2 R δ H 2 + c 3 R 3 / 2 δ 3 / 2 H 3 + c 4 R 2 δ 2 H 4
According to Dimitriadis et al.’s model, for bonded samples to the substrate c 1 = 1.133 , c 2 = 1.283 , c 3 = 0.769 and c 4 = 0.0975 [26]. On the contrary, when the sample is not bonded to the substrate, c 1 = 0.884 , c 2 = 0.781 , c 3 = 0.386 and c 4 = 0.0048 [26]. A similar model has also been derived by Garcia and Garcia in which c 1 = 1.133 , c 2 = 1.497 , c 3 = 1.469 and c 4 = 0.755 [29]. In both the Dimitriadis et al. and Garcia and Garcia models, five terms are considered in the f δ , H function.
When testing soft biological samples, such as cells on rigid substrates, Equations (6) and (7) ensure that the results for the Young’s modulus calculations are independent of the substrate effects. However, fitting the force–indentation data to these equations is not straightforward. Therefore, in this paper, a new simplified procedure will be proposed for data processing. By applying the weighted mean value theorem for integrals, we will derive simple values that can be used in place of the f δ , H function for both conical and parabolic indenters. These values will depend on the indenter properties, the indentation depth and the sample’s thickness. Therefore, appropriate tables for a wide range of indentation depths will be provided in each case. These numerical factors will simplify the procedure for determining Young’s modulus, even for samples with finite thickness.
This paper is organized as follows. In Section 2 (Materials and Methods), the mathematical approach for deriving the appropriate numerical values explained above will be presented. In addition, the protocol for AFM indentation experiments on fibroblasts, as well as simulated data (open-access data), will be discussed. In Section 3 (Results), the mathematical approach presented in Section 2 will be applied to the case of conical and parabolic indenters. Additionally, the Young’s modulus values determined by fitting the data to Equation (6) and applying the method proposed in this paper will be provided. In Section 4 (Discussion), additional clarifications regarding the generality of the proposed approach are provided.

2. Materials and Methods

2.1. Simplifying Data Processing Using Classic Mathematical Tools

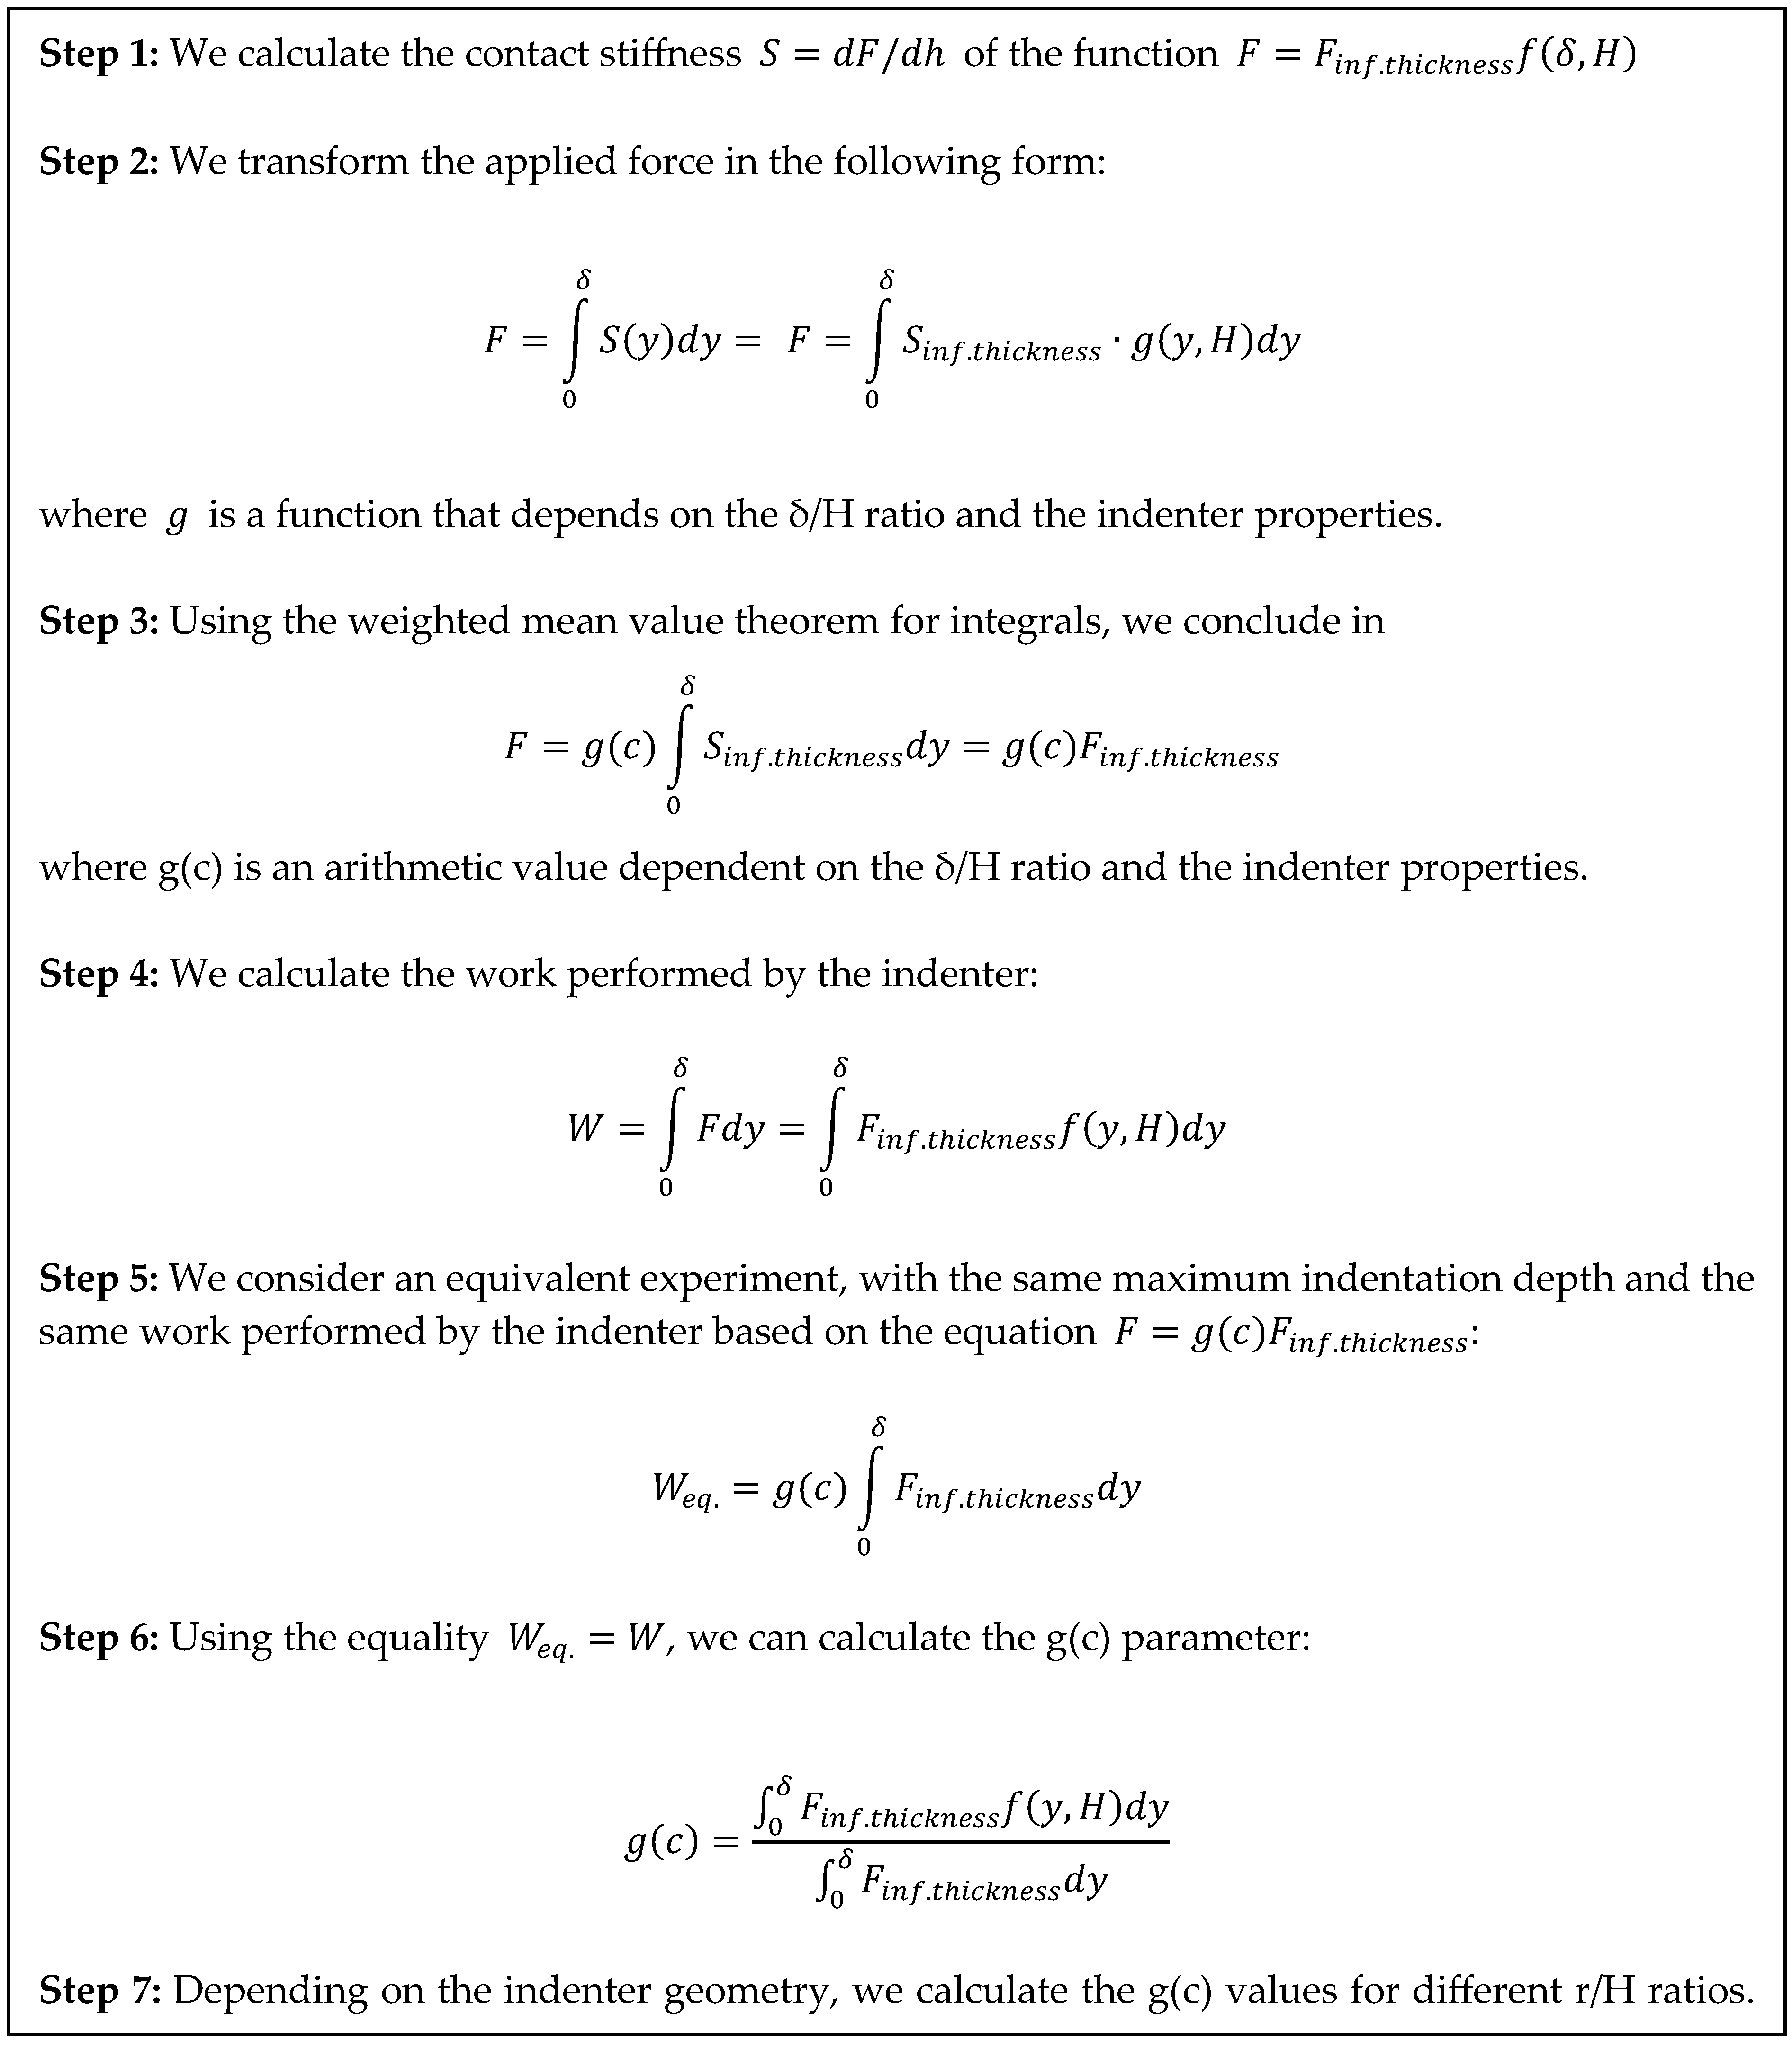
The proposed method is based on the weighted mean value theorem for integrals [35]. According to this theorem
Let a , β : [ 0 , δ ] R be such that a is continuous and β is integrable and does not change the sign on [0, δ]. Then, there exists a number c 0 , δ such that
0 δ a y β y d y = α c 0 δ β y d y
To apply Equation (8), we will express the applied force on the sample as follows [36]:
F = 0 δ S y d y  
where S y = d F / d y   is the contact stiffness. For example, consider the case of a conical indenter. In this case,
S = d F d δ = 16 3 π tan θ E δ 1 + 3 2 c 1 δ H + 2 c 2 δ 2 H 2 + 5 2 c 3 δ 3 H 3 + 3 c 4 δ 4 H 4 = S i n f .   t h i c k n e s s · g ( δ , H )
where S i n f .   t h i c k n e s s is the contact stiffness when the classic Hertzian equations apply (i.e., for a sample with infinite thickness). In addition, Equation (9) can also be written as follows:
F = 0 δ S i n f .   t h i c k n e s s · g y , H d y  
where g ( δ , H ) is a function related to the indentation depth, the indenter’s geometry and the sample’s finite thickness. For conical indenters,
g δ , H = 1 + 3 2 c 1 δ H + 2 c 2 δ 2 H 2 + 5 2 c 3 δ 3 H 3 + 3 c 4 δ 4 H 4
The number of terms in Equation (12) depends on the model being used, as already mentioned in the Introduction [27,28,29]. Thus, by applying the weighted mean value theorem for integrals to Equation (11), we conclude the following:
F = g ( c ) 0 δ S i n f . t h i c k n e s s d y = g ( c ) F i n f . t h i c k n e s s
In other words, we can provide a simple correction factor for the classic Hertzian equations to account for the substrate effect. For a specific indentation experiment (specific δ/H ratio), g(c) is a ‘representative’ or ‘weighted average’ value of the function f(δ,H). In this way, Young’s modulus for conical indenters can be easily determined using the following equation:
F = 8 3 π tan θ E g ( c ) δ 2
At this point, it is important to emphasize that the value of g(c) depends on the maximum indentation depth and the sample’s thickness in each experiment. This is why tables are needed for different δ/H ratios. To calculate the g(c) parameter, we can work as follows. The work performed by the indenter is given by
W = 0 δ F d y = 8 3 π tan θ E 0 δ y 2 + c 1 y 3 H + c 2 y 4 H 2 + c 3 y 5 H 3 + c 4 y 6 H 4 d y = 8 3 π tan θ E δ 3 3 + c 1 δ 4 4 H + c 2 δ 5 5 H 2 + c 3 δ 6 6 H 3 + c 4 δ 7 7 H 4  
In addition, consider an ‘equivalent’ experiment with the same work performed by the indenter as follows:
W = 8 3 π g ( c ) tan θ E 0 δ y 2 d y = 8 9 π g ( c ) tan θ E δ 3
Therefore, using Equations (15) and (16), it can be easily concluded that
g c = 1 + 3 4 c 1 δ H + 3 5 c 2 δ 2 H 2 + 3 6 c 3 δ 3 H 3 + 3 7 c 4 δ 4 H 4
A similar calculation can also be easily performed for spherical indenters.

2.2. AFM Data from Fibroblasts (Open-Access Data from Reference [37])

Open-access nanoindentation data, obtained with a conical indenter on human fibroblasts, were used in this study [37]. The fibroblasts were cultured and maintained at 37 °C in a humidified atmosphere containing 5% CO2. The AFM tip (Veeco Probes) employed had a nominal tip radius of 20 nm, a half-angle of 25° and a spring constant of 0.01 N/m [37]. The spring constant used for the calculation of Young’s modulus was determined using the thermal tune method [37]. The force–indentation data used in this study are available in the AtomicJ repository: (https://sourceforge.net/projects/jrobust/files/TestFiles, accessed on 1 December 2024).
For the determination of the contact point, the AtomicJ_2.3.1 software and the robust successive search method procedure [37] were used. The force–indentation data were created and processed using the classic equations that include bottom-effect corrections (e.g., Equation (6)). Subsequently, the method was applied to the same data to focus on comparing the classic equations with the proposed approach and exclude the influence of other factors on the results. It is also important to note that open-source algorithms for an accurate, model-independent calculation of the contact point are included in the AtomicJ software. In addition, the integration in the approach proposed in this paper (i.e., the calculation of the area under the force–indentation data) was performed using the command ‘trapz(δ, F)’ in MATLAB 2021a.

2.3. Simulated Data (Open-Access Data from Reference [37])

This research employed open-access simulated data for an elastic half-space with a Young’s modulus of E = 20 kPa and a Poisson’s ratio of 0.5. The data were generated using Mathematica 8.0, considering a parabolic indenter with a radius of 1 μm, mounted on a cantilever with a spring constant of 0.1 N/m. The sample’s thickness was H = 2 μm, and the maximum indentation depth varied between 0.8 μm and 1 μm. The force–indentation data used in this study are available in the AtomicJ repository: (https://sourceforge.net/projects/jrobust/files/TestFiles, accessed on 1 December 2024).

3. Results

The approach presented in Section 2.1 can be applied to all models described in the Introduction. In this paper, we will first use Equation (6), as it is the most recent one for conical indenters. Equation (17) can also be written in the following form:
g c = 1 + 3 4 β 1 t a n ( θ ) δ H + 3 5 β 2 t a n 2 ( θ ) δ 2 H 2 + 3 6 β 3 t a n 3 ( θ ) δ 3 H 3 + 3 7 β 4 t a n 4 ( θ ) δ 4 H 4
where β 1 = 0.721 , β 2 = 0.650 , β 3 = 0.491 and β 4 = 0.225 .
The contact radius between a conical indenter and the sample is given below [38]
r = 2 π tan θ δ
By combining Equations (18) and (19), it can be concluded that
g c = 1 + 3 π 8 β 1 r H + 3 π 2 20 β 2 r 2 H 2 + 3 π 3 48 β 3 r 3 H 3 + 3 π 4 112 β 4 r 4 H 4
Figure 1 (and Table A1 in the Appendix A) presents the g(c) correction factor for samples bonded to the substrate with respect to the r/H ratio.
Consider, for example, an indentation experiment on a thin sample bonded to a rigid substrate using a conical indenter. In this case, c 1 = 0.721 t a n ( θ ) , c 2 = 0.650 tan 2 ( θ ) , c 3 = 0.491 tan 3 ( θ ) and c 4 = 0.225 tan 4 ( θ ) according to Garcia and Garcia’s model [29] as already mentioned. Assume that θ = 60 ° , δ = 500   nm ,   H = 1000   nm and E = 1   kPa . Therefore, δ H = 0.5 . According to Equation (19),
r H = 2 t a n ( θ ) π δ H = 0.55
Using the result from Equation (21), Equation (20) provides the following: g c = 1.97 . A theoretical force–indentation curve obtained using the aforementioned values is presented in Figure 2. In Figure 2a, the area under the force–indentation curve (Equation (15)), which represents the work performed by the indenter, is highlighted ( W = 1.21 · 10 16 J ). In Figure 2b, the ‘equivalent’ Equation (14) with g c = 1.97 is also presented for comparison (in this case, F = 2896 δ 2 (S.I.)). The area under the graph ( W = 1.21 · 10 16 J ) and the indentation depth ( δ = 500   nm ) in Figure 2a,b are identical.
In Figure 2c, the actual force–indentation curve (from Equation (6)) and the equivalent curve (from Equation (14)) are presented for comparison. Both curves correspond to the same Young’s modulus.
In addition, a paradigm using open-access real force–indentation data obtained from a human fibroblast is presented in Figure 3. The data were taken by the AtomicJ repository as already explained in Section 2.2 [37]. In Figure 3a, the actual force–indentation data and a fit using Equation (6) are presented. The data presented in Figure 3a were obtained from a region with a thickness approximately equal to H = 2 μm (the thickness was calculated using a topography image, as explained in reference [37]).
Using the classic fitting procedure, the data were fitted to the equation:
F δ = 1229 δ 2 1 + 0.3360 δ H + 0.1412 δ H 2 + 0.0497 δ H 3 + 0.0106 δ H 4   S . I .
Subsequently, the Young’s modulus can be easily calculated as follows:
8 3 π tan θ E = 1229 N m 2 E = 3.11   kPa
The graph resulting from Equation (22) is also presented in Figure 3a. Since the maximum indentation depth is equal to δ = 800   nm , δ H = 0.4 . According to Equation (21),
r H = 2 t a n ( θ ) π δ H = 0.12
Thus, using Equation (20), we obtain the following: g c = 1.11 . In Figure 3b, the area under the graph is highlighted and is equal to W = 2.34 · 10 16 J . The Young’s modulus using the ‘equivalent’ curve can be easily calculated using Equation (16):
W = 8 9 π g ( c ) tan θ E δ 3 E = 3.12 kPa
The graph of the ‘equivalent’ experiment is presented in Figure 3c. In this case, Equation (12) yields F = 1364 δ 2   ( S . I . )
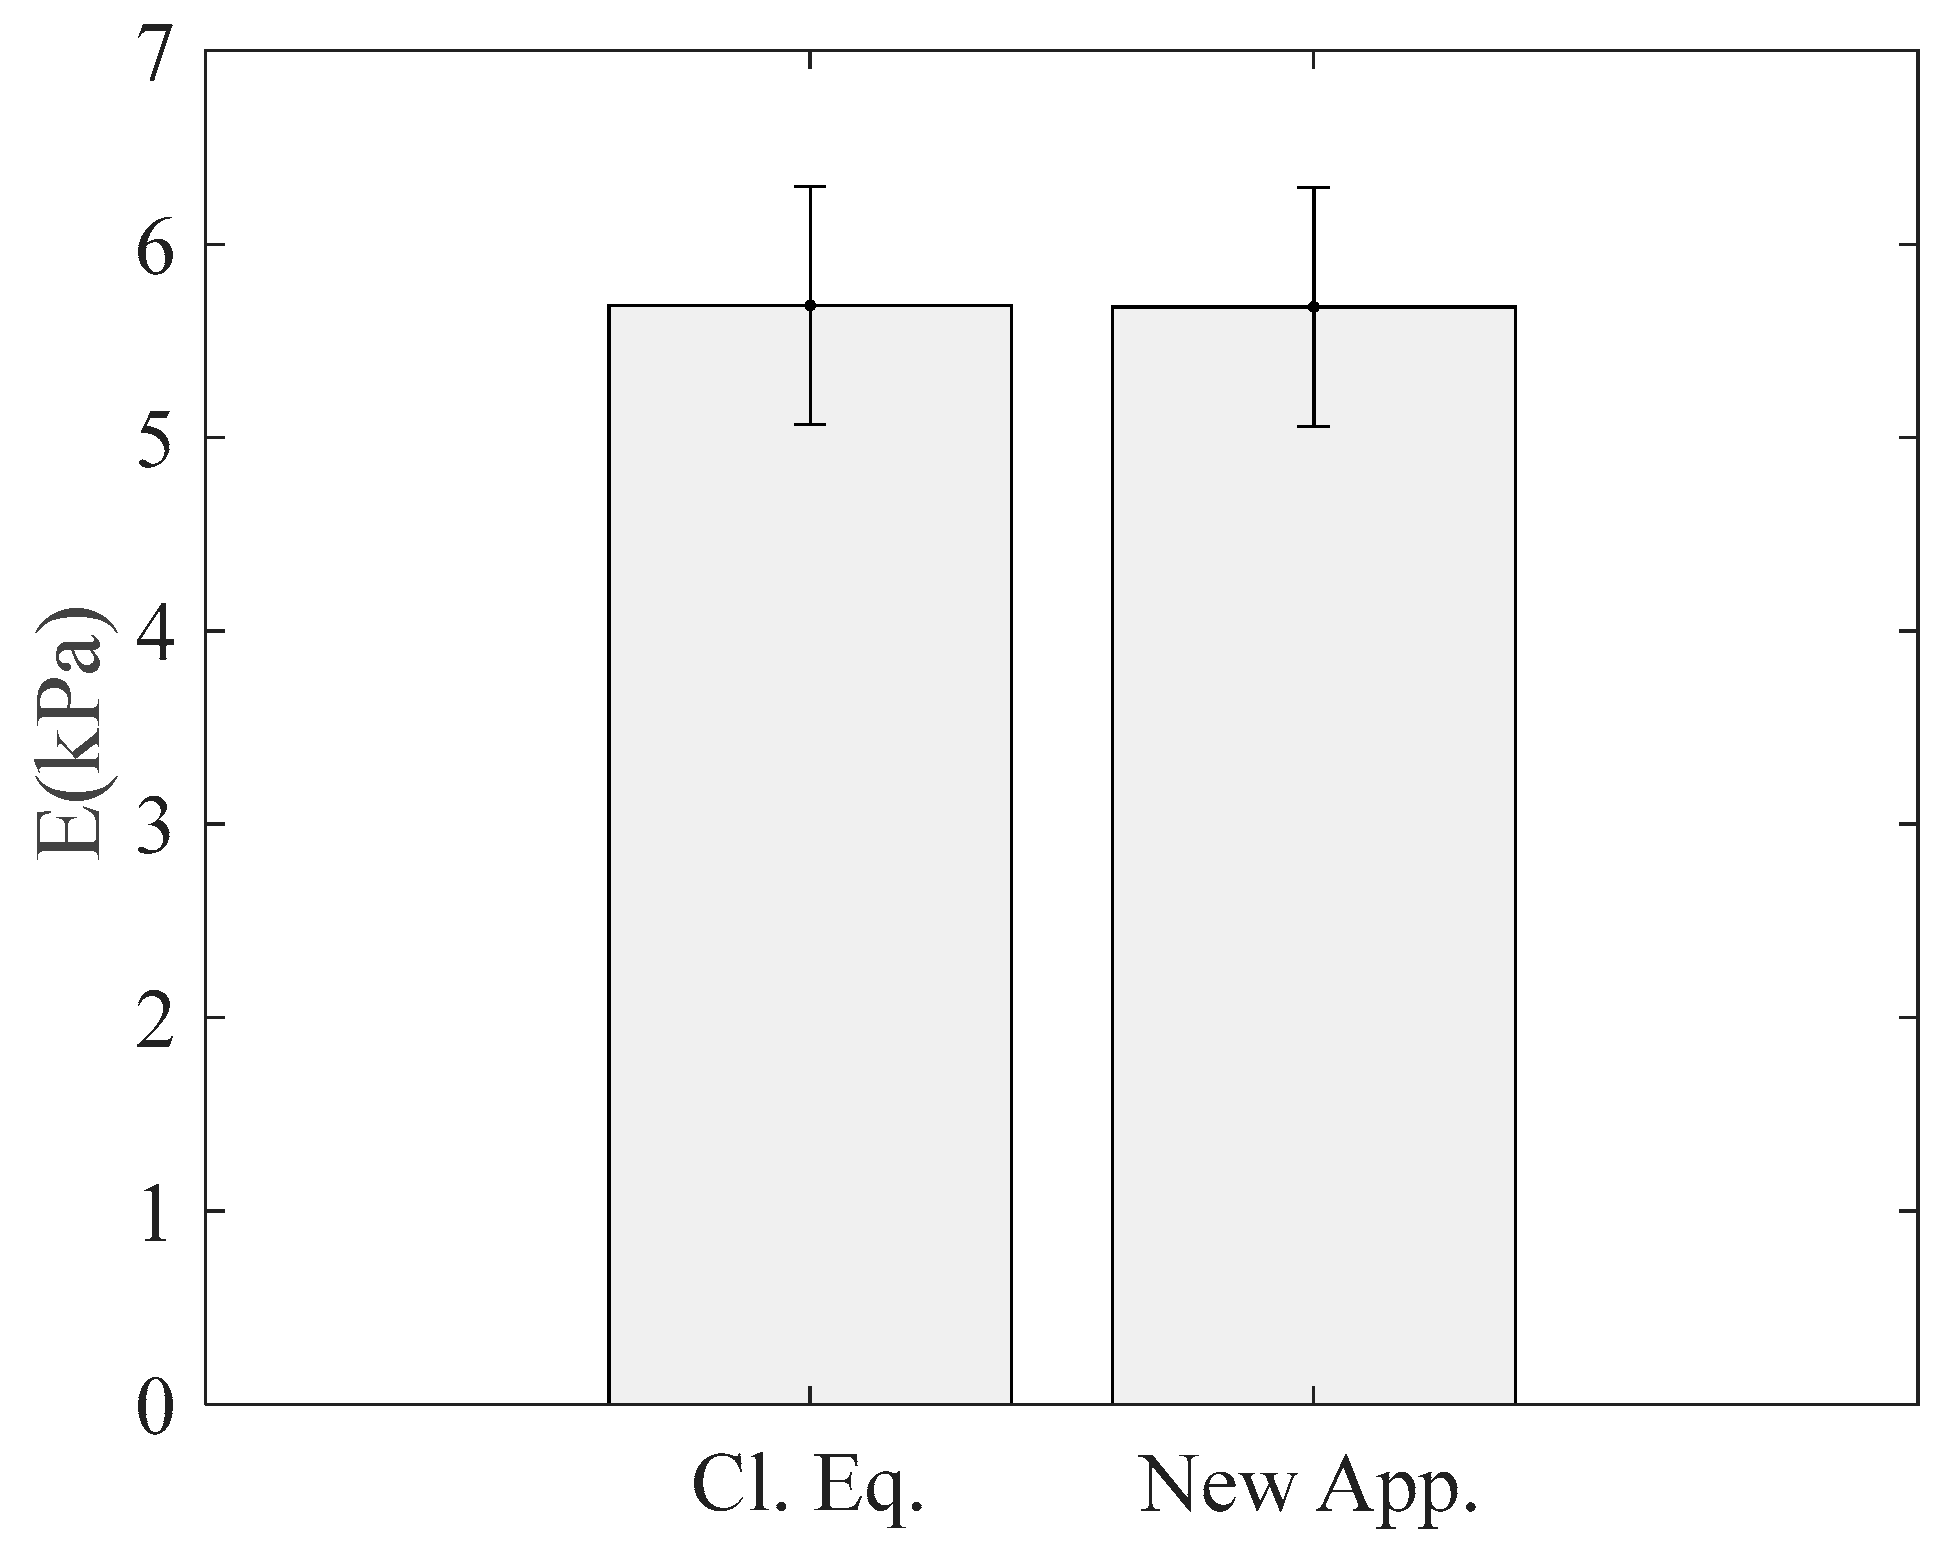
Table 1 presents additional examples of 15 force–indentation curves with maximum indentation depths ranging from 750 nm to 950 nm. Given that the angle θ was 25 degrees and the sample thickness was approximately 2000 nm, the g -values can be easily obtained using Equations (19) and (20). The Young’s modulus values, calculated using Equation (6) and the approach proposed in this paper (Equation (16)), are presented for comparison. The same results are also displayed as bar charts in Figure 4. The results in each case were nearly identical, with minor deviations arising from the use of a two-decimal approximation for the g(c)-values for simplicity. When using the classic approach (Equation (6)), E c l a s s i c = 5.683 ± 0.616   kPa . In addition, when using the approach proposed by this paper (Equation (16)), E approx . = 5.675 ± 0.619   kPa . The mean value ± standard deviation for the results obtained using the classic method and those obtained using the approach proposed in this paper were calculated using MATLAB 2021a. It is also important to note that another reason for the minor differences between the classic approach and the approach proposed in this paper is that both the generic Equation (1) and the simplified equations presented in this paper are approximations for real biological samples. In other words, the force–indentation data do not perfectly follow the generic Equation (1) under real conditions. Therefore, small differences may arise depending on the equations used in each case. However, the differences in the results are negligible, as shown in both Table 1 and Figure 4. It is also important to note that for a hypothetical sample in which the data perfectly follow Equation (1), the results provided by Equations (1) and (13) should be identical.
The same procedure can also be applied for parabolic indenters on thin samples. In this case,
f r , H = 1 + c 1 r H + c 2 r H 2 + c 3 r H 3 + c 4 r H 4
In Equation (25), r = R δ [26]. In addition, for bonded samples to the substrate, c 1 = 1.133 , c 2 = 1.283 , c 3 = 0.769 and c 4 = 0.0975 [26]. On the contrary, when the sample is not bonded to the substrate, c 1 = 0.884 , c 2 = 0.781 , c 3 = 0.386 and c 4 = 0.0048 [26]. The applied force on the sample is related to the indentation depth through the following equation:
F = 16 9 E R 1 / 2 δ 3 / 2 1 + c 1 r H + c 2 r H 2 + c 3 r H 3 + c 4 r H 4
F = 16 9 E R 1 / 2 δ 3 / 2 1 + c 1 R 1 / 2 δ 1 / 2 H + c 2 R δ H 2 + c 3 R 3 / 2 δ 3 / 2 H 3 + c 4 R 2 δ 2 H 4  
F = 16 9 E R 1 / 2 δ 3 / 2 + c 1 R 1 / 2 δ 2 H + c 2 R δ 5 / 2 H 2 + c 3 R 3 / 2 δ 3 H 3 + c 4 R 2 δ 7 / 2 H 4
The contact stiffness in this case can be calculated as follows:
S = d F d δ = 16 9 E R 1 / 2 3 2 δ 1 / 2 + 2 c 1 R 1 / 2 δ H + 5 2 c 2 R δ 3 / 2 H 2 + 3 c 3 R 3 / 2 δ 2 H 3 + 7 2 c 4 R 2 δ 5 / 2 H 4  
S = 8 3 R 1 / 2 δ 1 / 2 1 + 4 3 c 1 R 1 / 2 δ 1 / 2 H + 5 3 c 2 R δ H 2 + 2 c 3 R 3 / 2 δ 3 / 2 H 3 + 7 3 c 4 R 2 δ 2 H 4    
S = S i n f .   t h i c k n e s s 1 + 4 3 c 1 R 1 / 2 δ 1 / 2 H + 5 3 c 2 R δ H 2 + 2 c 3 R 3 / 2 δ 3 / 2 H 3 + 7 3 c 4 R 2 δ 2 H 4  
Therefore,
F = 0 δ S i n f .   t h i c k n e s s · g y , H d y
In addition, also using the weighted mean value theorem for integrals as for the case of conical indenters, we conclude in Equation (13). However, in this case,
F = 16 9 E g ( c ) R 1 / 2 δ 3 / 2
To calculate the g c , the same procedure as for the case of conical indenters will be followed. The work performed by the indenter should be as follows:
W = 16 9 E R 1 / 2 0 δ y 3 / 2 + c 1 R 1 / 2 y 2 H + c 2 R y 5 / 2 H 2 + c 3 R 3 / 2 y 3 H 3 + c 4 R 2 y 7 / 2 H 4 d y
W = 32 9 E 1 v 2 R 1 / 2 1 5 δ 5 / 2 + 1 6 c 1 R 1 / 2 δ 3 H + 1 7 c 2 R δ 7 / 2 H 2 + 1 8 c 3 R 3 / 2 δ 4 H 3 + 1 9 c 4 R 2 δ 9 / 2 H 4
In addition, consider an ‘equivalent’ experiment with the same work performed by the indenter and the same indentation depth as follows:
W = 16 9 E g ( c ) R 1 / 2 0 δ y 3 / 2 d y = 32 45 E g ( c ) R 1 / 2 δ 5 / 2
Therefore, using Equations (30) and (31), it is concluded
g c = 1 + 5 6 c 1 R 1 / 2 δ 1 / 2 H + 5 7 c 2 R δ H 2 + 5 8 c 3 R 3 / 2 δ 3 / 2 H 3 + 5 9 c 4 R 2 δ 2 H 4
By substituting R δ 1 / 2 = r to Equation (32), the parameter g c is determined as follows:
g c = 1 + 5 6 c 1 r H + 5 7 c 2 r H 2 + 5 8 c 3 r H 3 + 5 9 c 4 r H 4
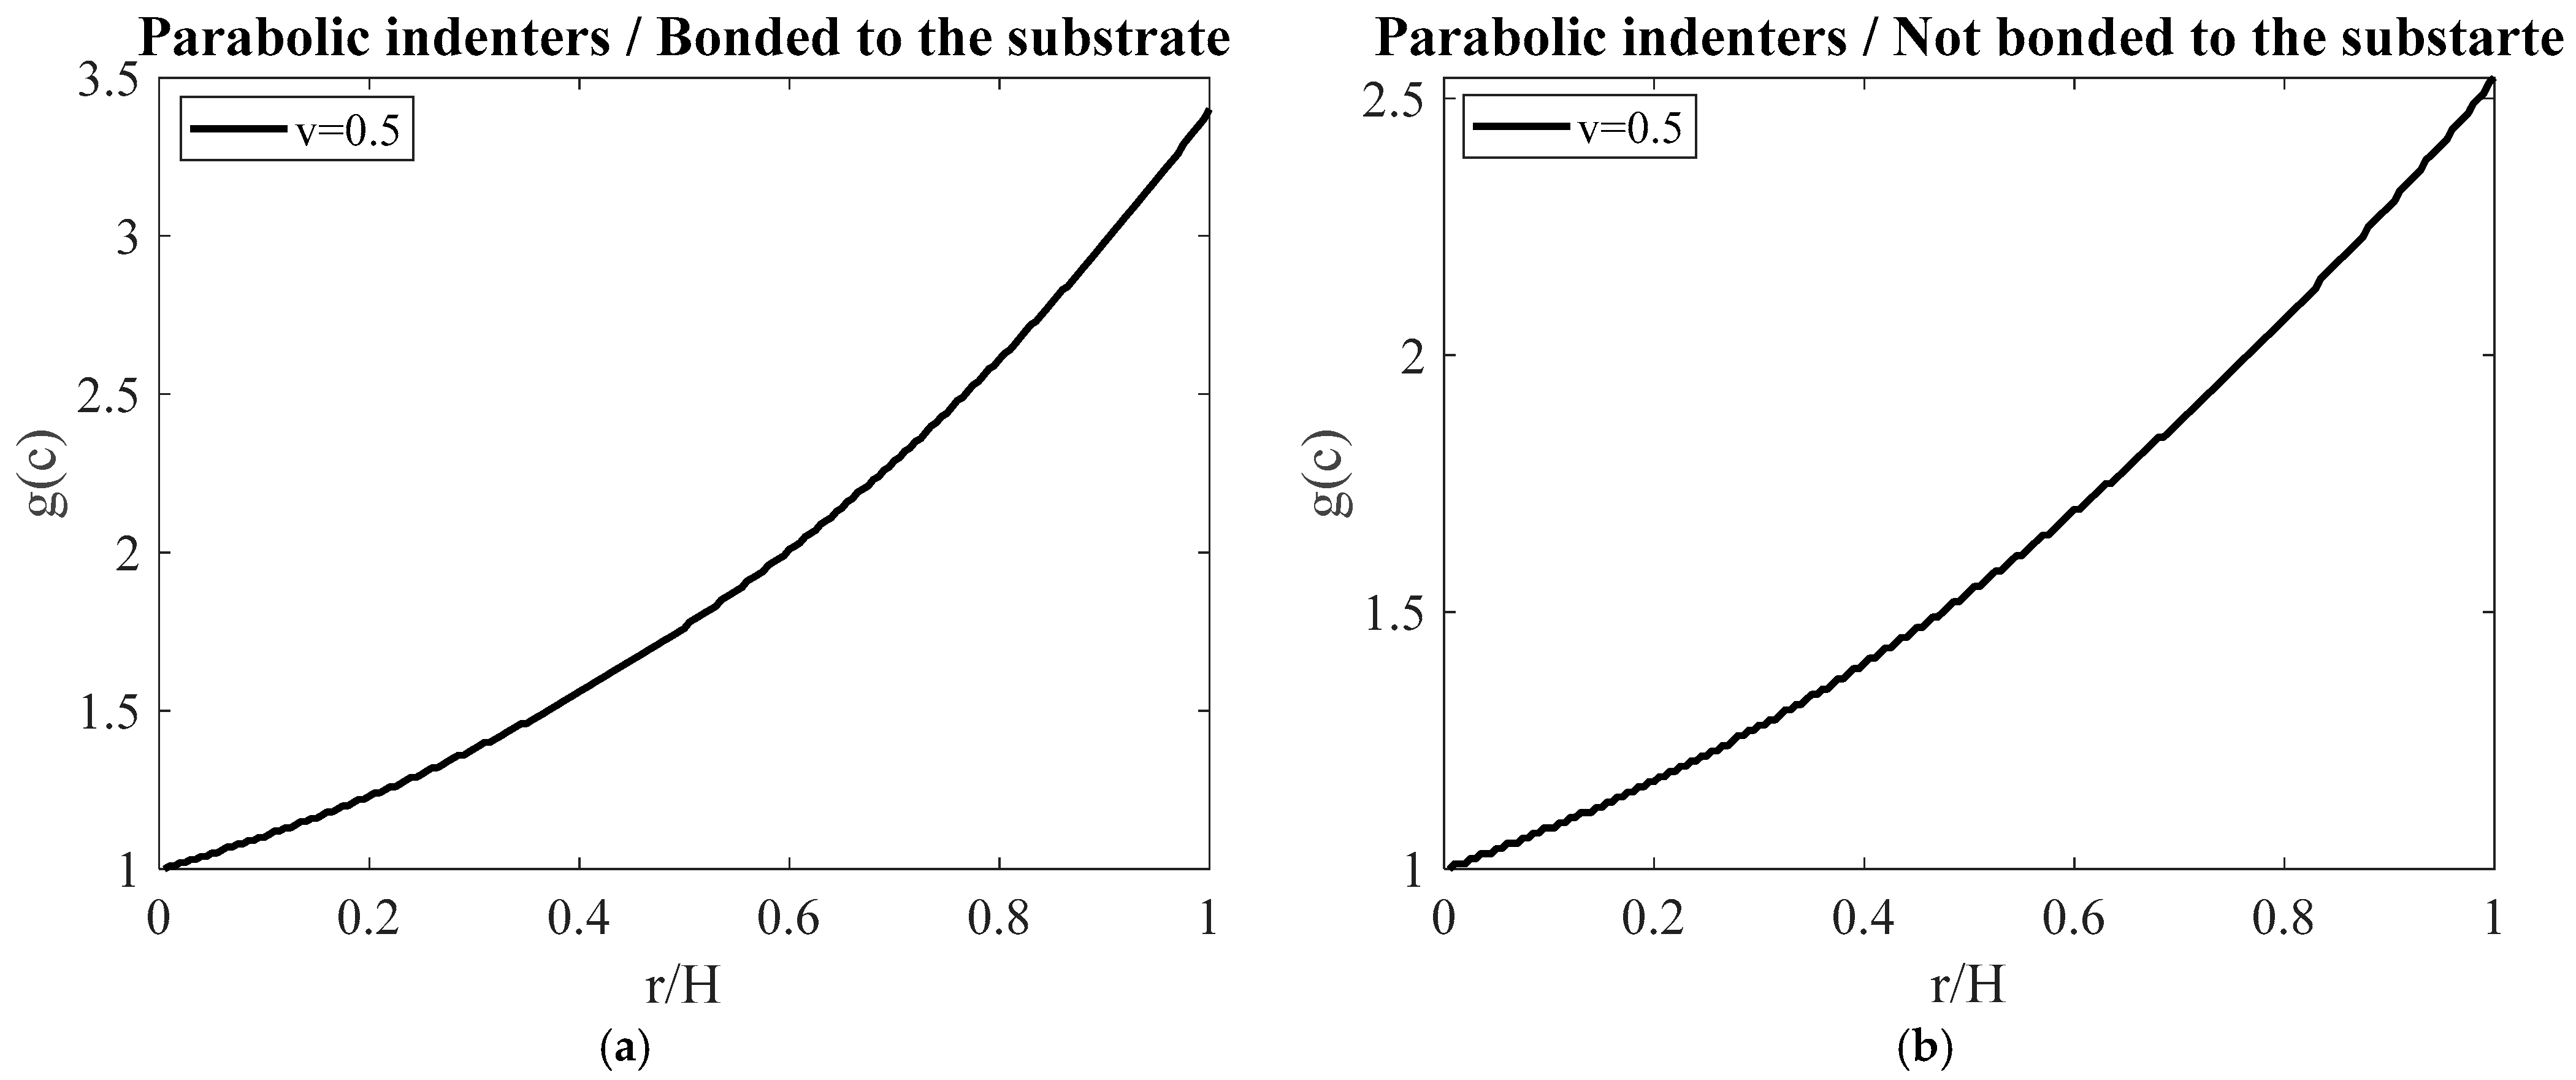
Figure 5 and Table A2 in the Appendix A present the g(c) correction factor as a function of the r/H ratio.
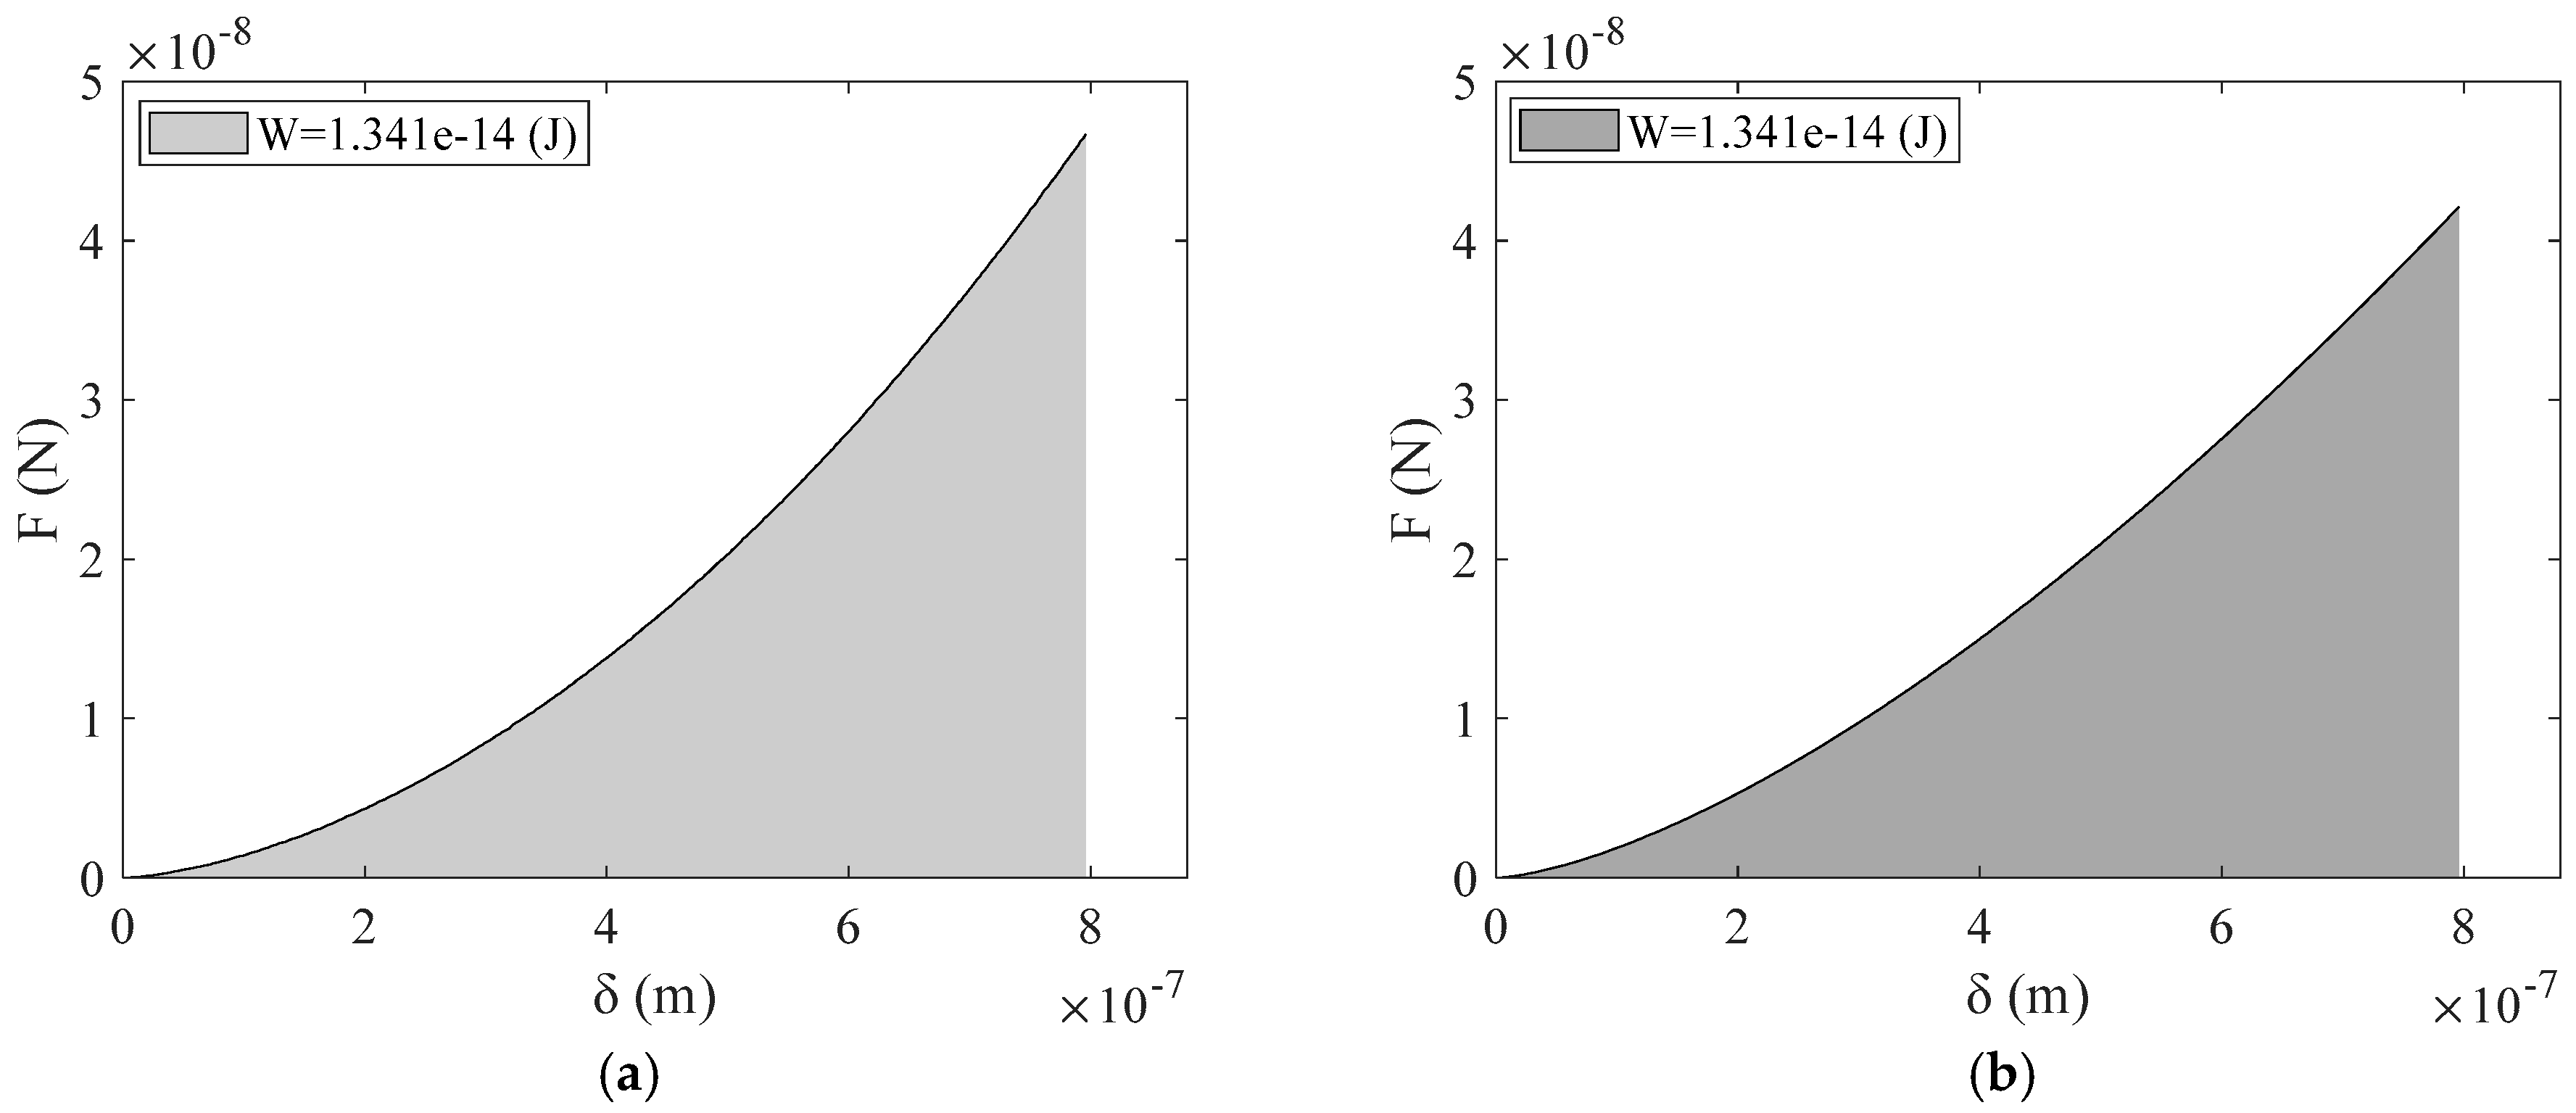
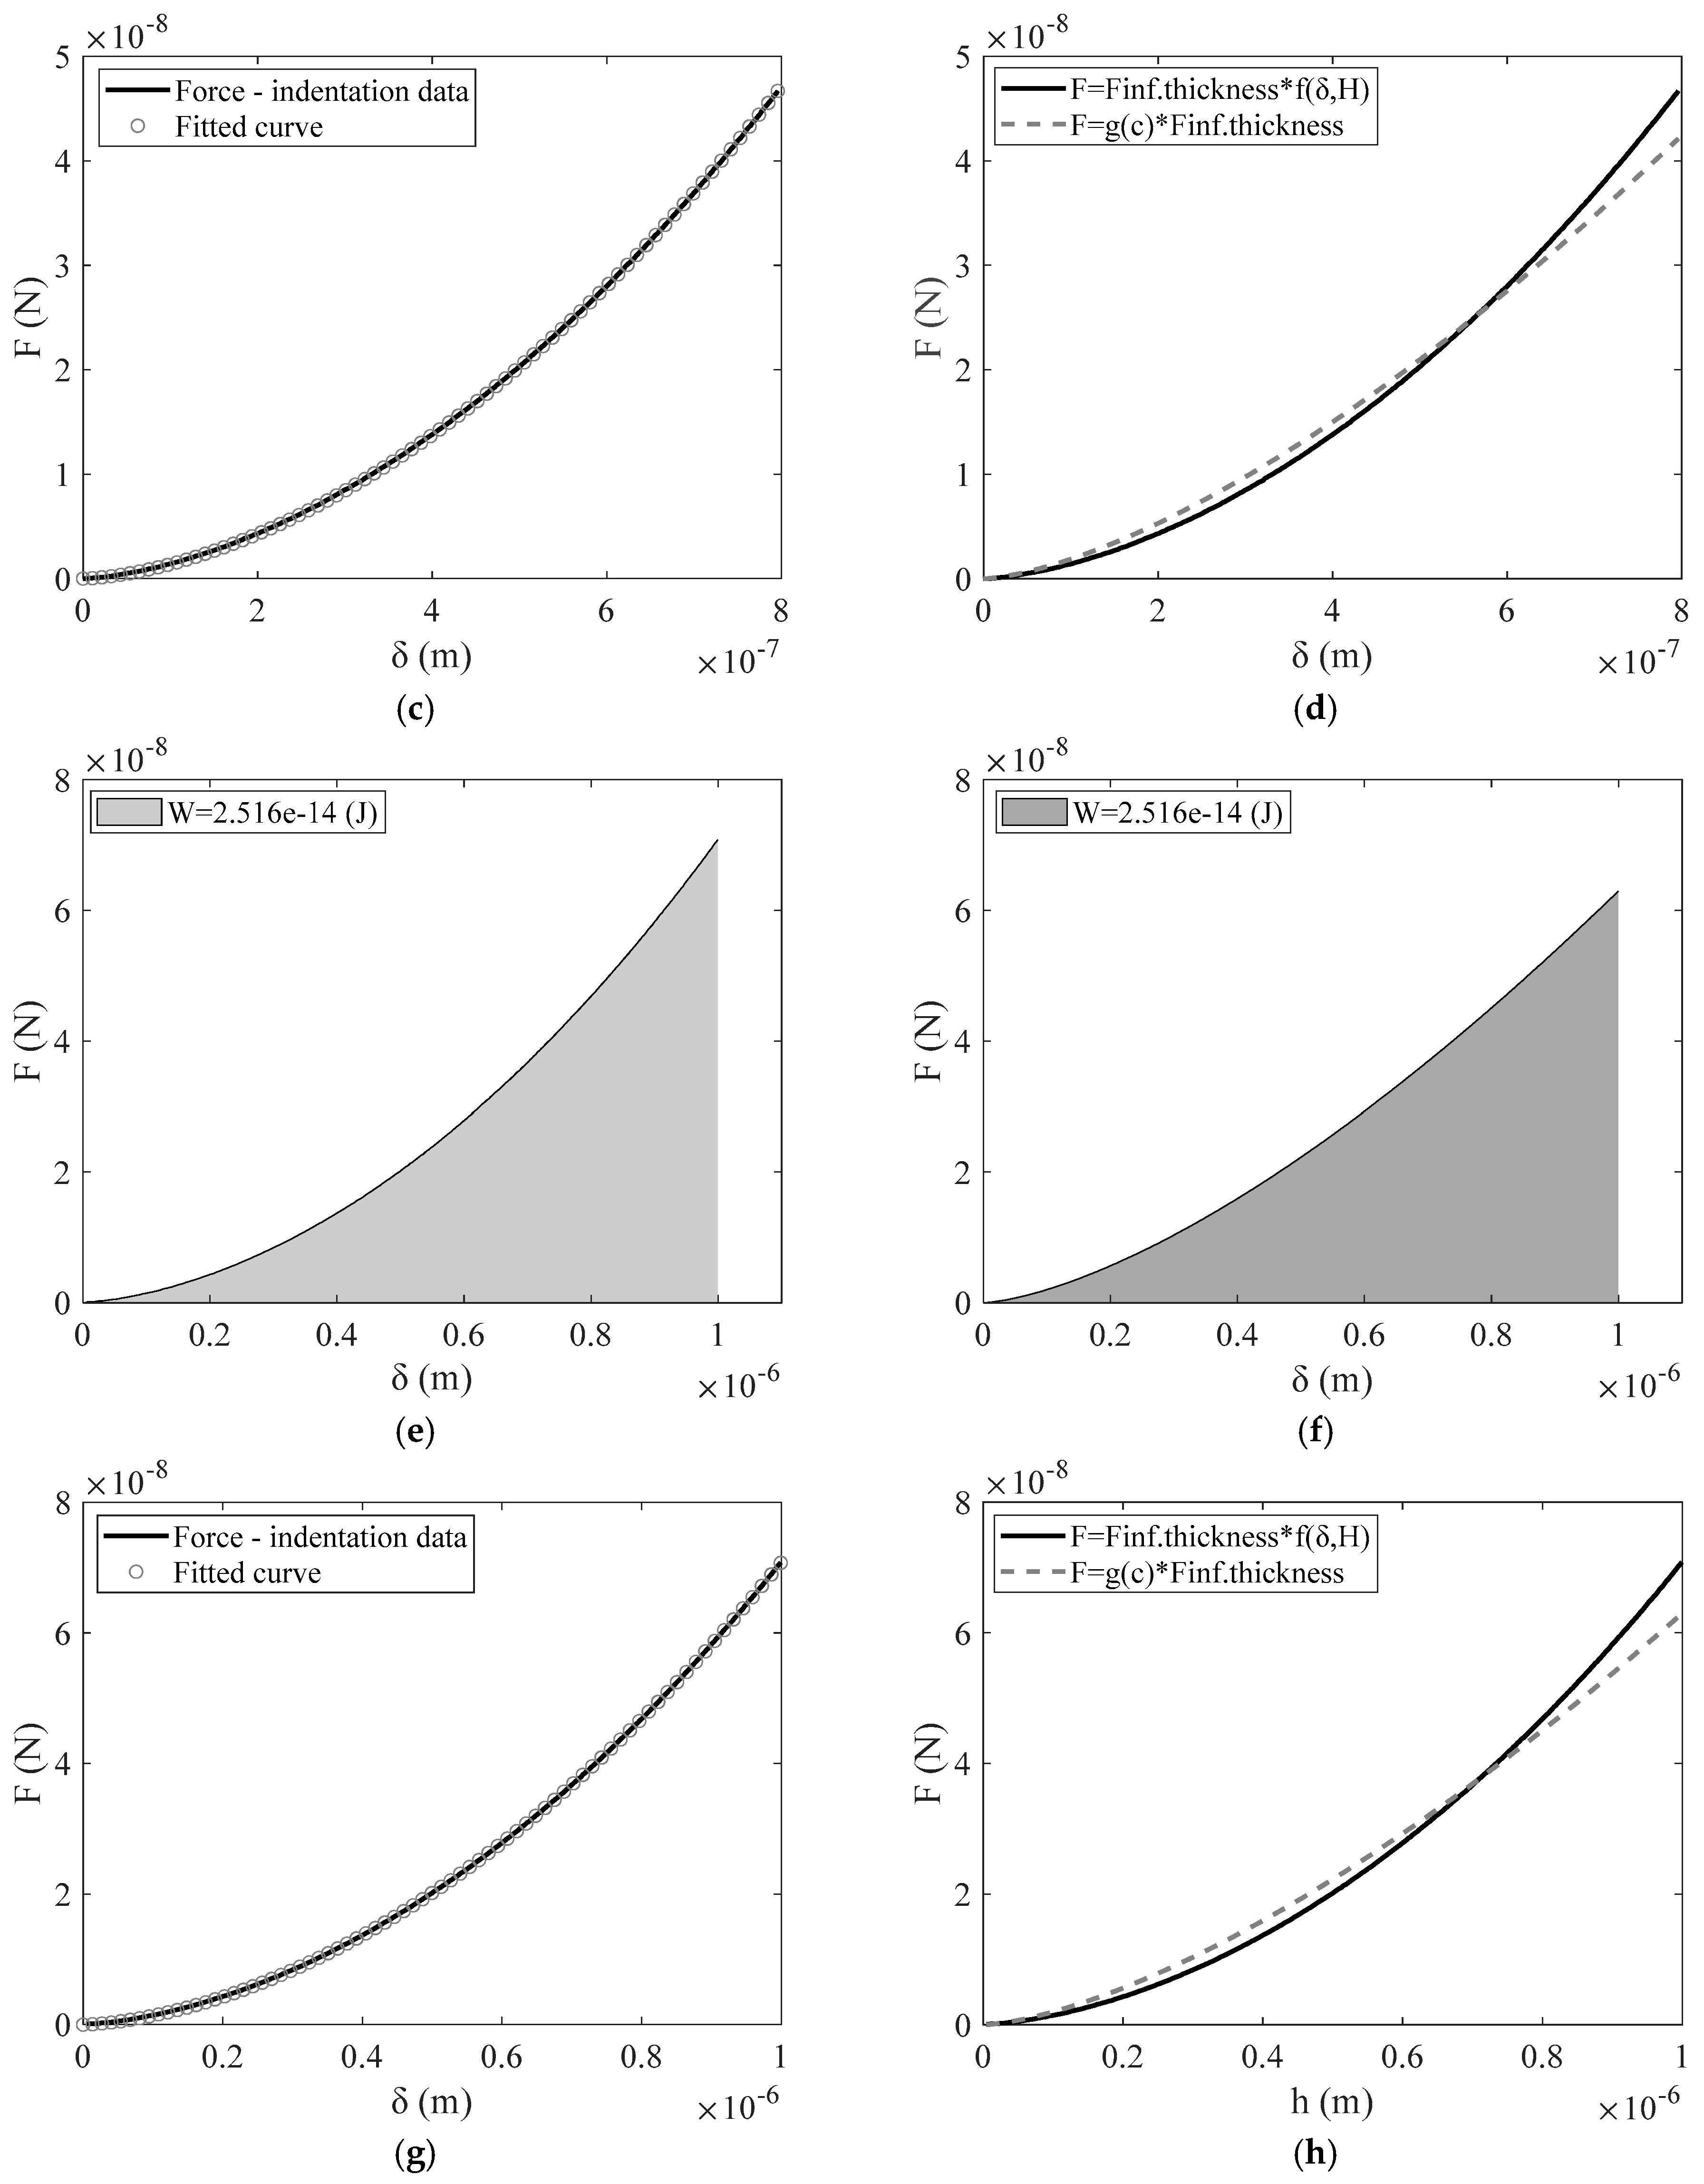
In Figure 6, simulated data from the AtomicJ repository using a parabolic indenter with radius R = 1 μm and a sample with thickness H = 2 μm are presented. In Figure 6a–d, the maximum indentation depth was 800 nm, yielding r/H = 0.445. Therefore, g(c) = 1.65. The Young’s modulus obtained by fitting the data to Equation (26) was 20.27 kPa, while using the equation proposed in this paper (Equation (31)) resulted in 20.21 kPa. In Figure 6e–h, the maximum indentation depth was 1000 nm, yielding r/H = 0.5. Therefore, g(c) = 1.76. The Young’s modulus obtained by fitting the data to Equation (26) was 20.15 kPa, while using the equation proposed in this paper (Equation (31)) resulted in 20.14 kPa. In both cases, the proposed approach provided excellent results.

4. Discussion

According to Buckle’s rule, when the indentation depth exceeds 5–10% of the sample’s thickness, the influence of the substrate becomes significant, resulting in an overestimation of the Young’s modulus [39,40,41]. To address this issue, several models have been developed in the literature, based on the exact shape of the indenter and whether the sample is bonded to the substrate [26,27,28,29,30]. In this paper, the procedure for determining the Young’s modulus of thin samples on rigid substrates has been significantly simplified. In particular, by applying the weighted mean value theorem for integrals, we derived a simpler equation than Equation (1) (Equation (13)), in which the power-law series f(δ,H) is replaced by a simple numerical factor g(c). The parameter g(c) depends on the shape of the indenter, whether the sample is bonded to the substrate and the indentation depth.
In this paper, we focused on cases where the sample is bonded to the substrate, which is the typical scenario in most AFM experiments on biological samples such as cells [29]. We also present appropriate tables for conical indenters (Table A1) and parabolic indenters (Table A2) (see Appendix A). Table A2 is also valid for spherical indenters under the condition that the indentation depth is smaller than the indenter’s radius [29]. It is important to note that these tables were developed based on the r/H ratio (where r represents the contact radius between the indenter and the sample). The reason is that the r/H ratio includes information such as the cone’s half-angle for conical indenters and the indenter’s radius for parabolic (or spherical) indenters. For example, for a specific indentation experiment with a conical indenter with a half-angle θ, the r/H ratio can be easily calculated if the maximum indentation depth and the sample’s thickness at the tested point are known.
The tables presented in this paper are based on the García and García model [29,42] for conical indenters (Table A1 in the Appendix A) and the Dimitriadis et al. model [26] for parabolic indenters (Table A2 in the Appendix A). However, the approach presented in this paper is generic and can be applied to any model in the literature where the function f(δ, H) in Equation (1) is expressed as a power-law series of the term δ/H [26,27,28,29]. For example, García and García [29] have also derived equations for parabolic indenters. In this case, Equation (33) applies to the García and García model but with different coefficients. In particular, c 1 = 1.133 , c 2 = 1.497 , c 3 = 1.469   and   c 4 = 0.755 . In addition, the approach presented in this paper can also be easily extended to other indenter geometries, as described in [29]. The steps for calculating the g(c) coefficients for different r/H ratios and various indenter geometries are also presented in Figure 7.
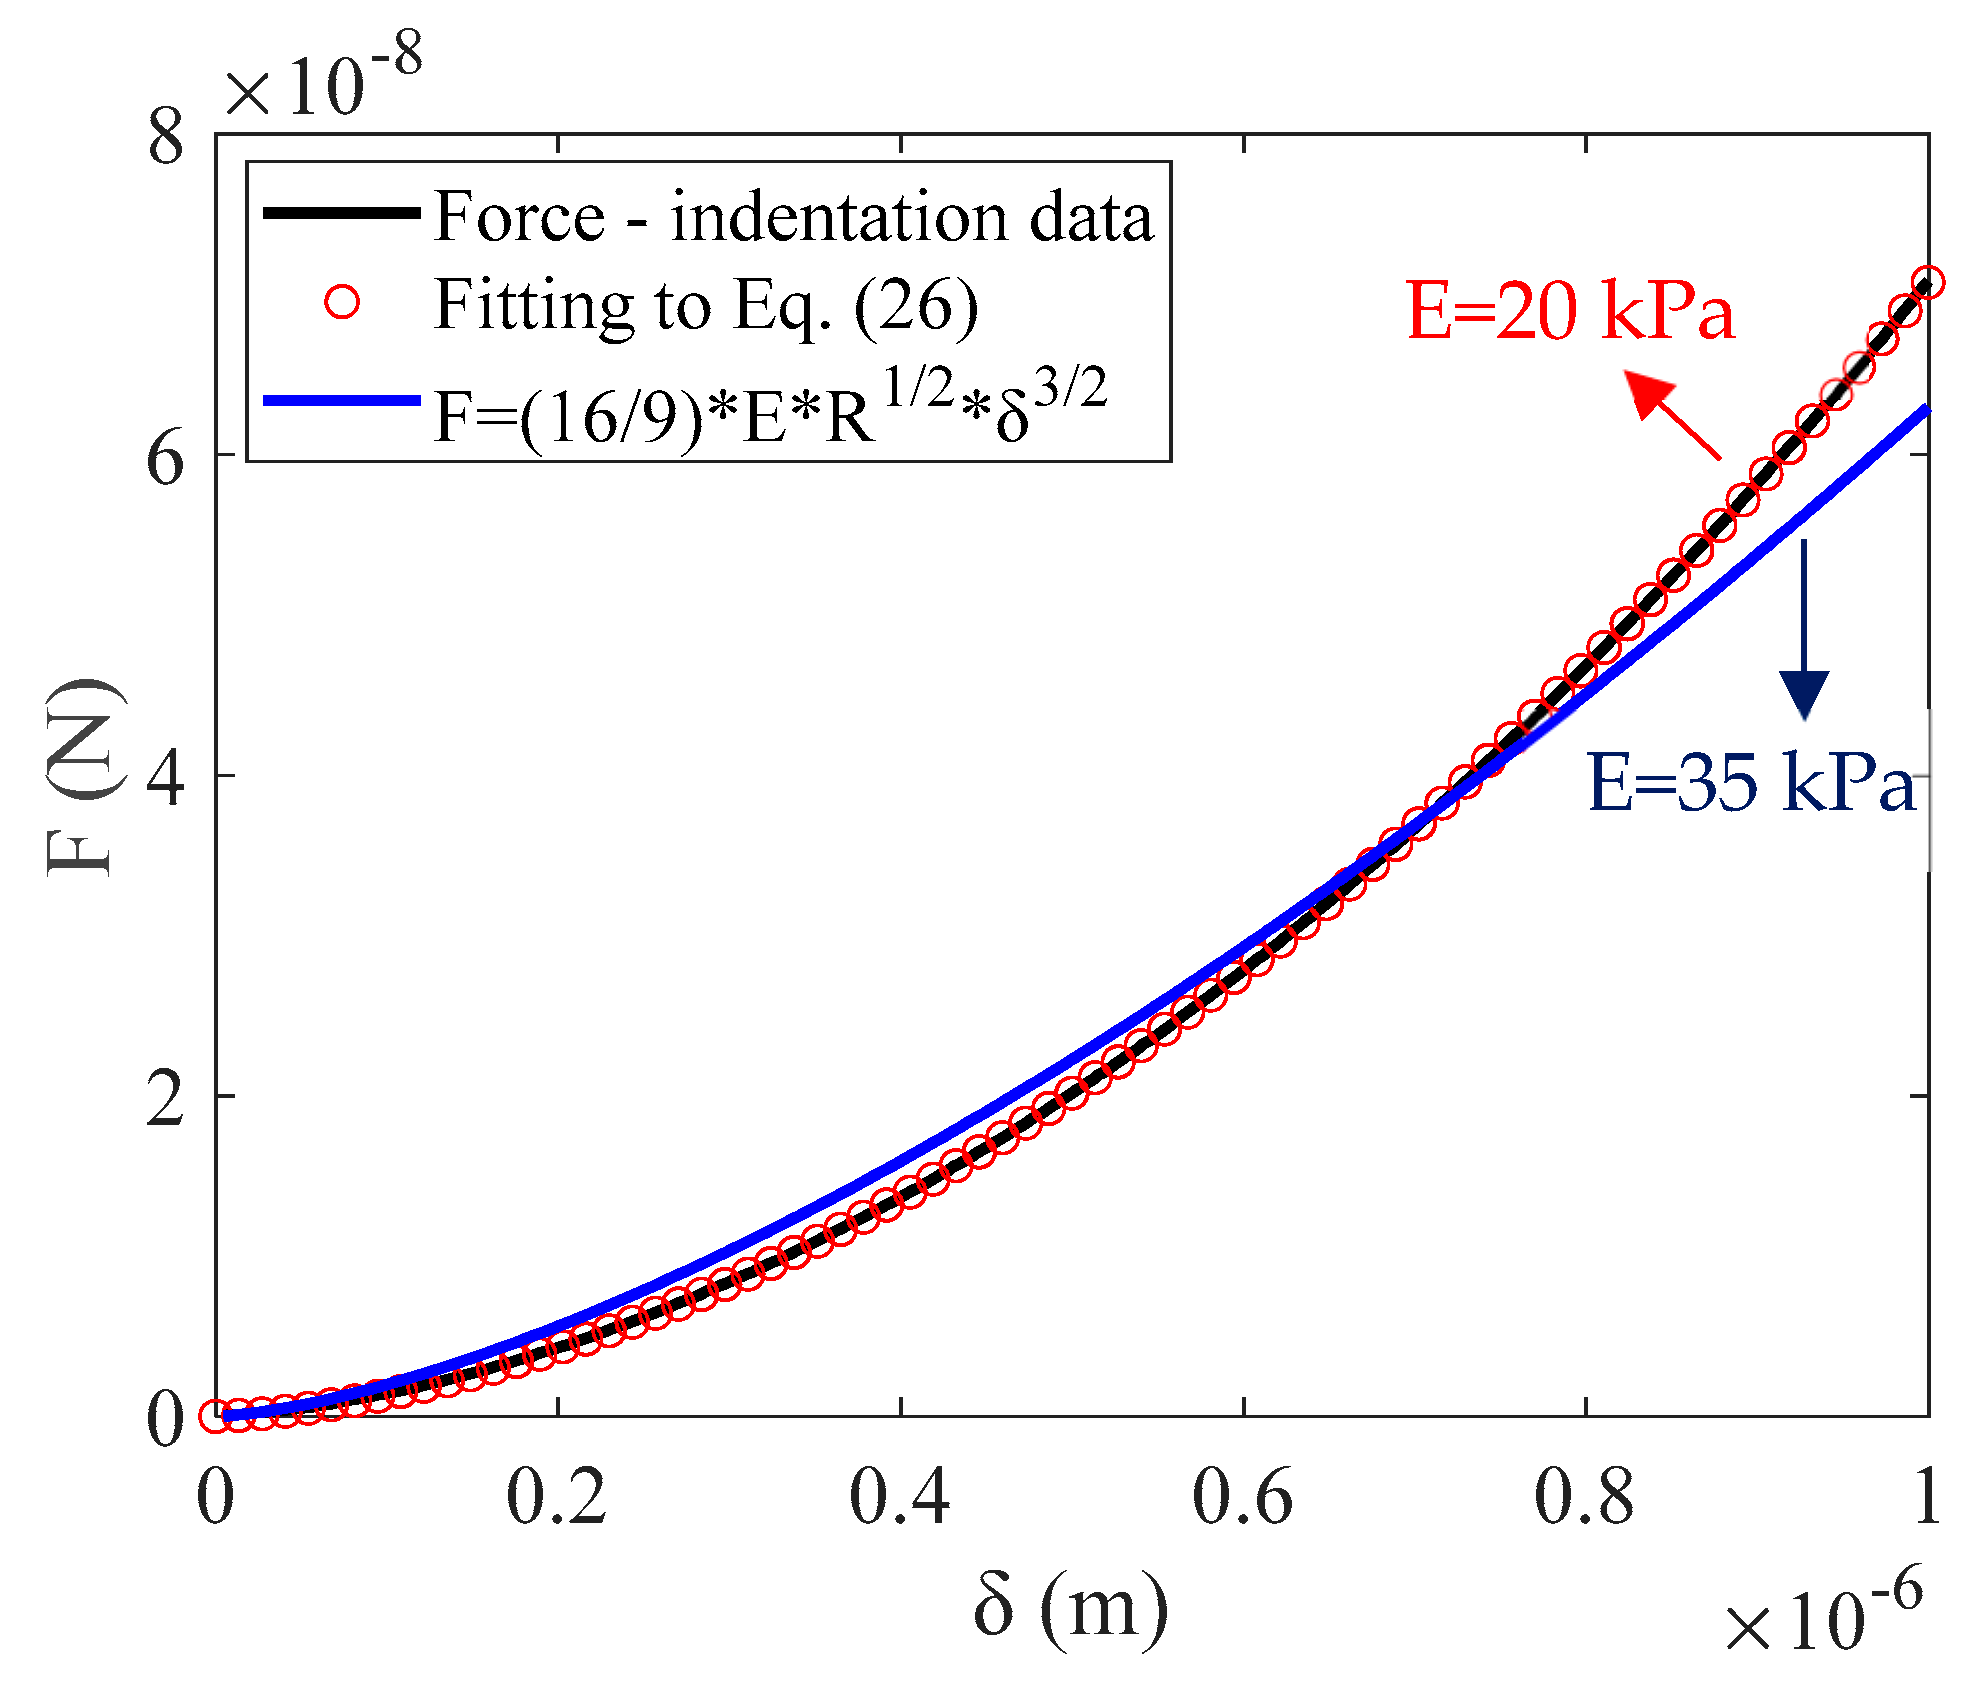
It is important to note that while Hertzian equations are commonly used in AFM indentations due to their simplicity (as they consider samples with infinite thickness), they can introduce significant errors when calculating Young’s modulus, particularly when the indentation depth-to-sample thickness ratio (δ/H) is large [26,27,28,29,30]. Another example is presented in Figure 8. Simulated force–indentation data with parabolic indenters of radius R = 1 μm were used on thin films with a thickness of H = 2 μm. Therefore, in this case, r/H = 0.5 and g(c) = 1.76. When processing the data using the accurate Equation (26), which accounts for the substrate effect, the result for the sample’s Young’s modulus is approximately 20 kPa. On the other hand, a typical fit to the classic Hertz equation for parabolic indenters will yield approximately 35 kPa. However, if we use the equation proposed in this paper (Equation (31)), we obtain the correct value of E = 20 kPa. This simple example highlights the influence of the substrate effect on the results of the Young’s modulus calculations and explains the need for finding simple yet accurate methods for determining Young’s modulus in samples with finite thickness.
The approach provided in this article offers a simplified yet accurate alternative for processing experimental data from samples with finite thickness. This approach presents a more reliable method compared to traditional Hertzian equations, ensuring more accurate and meaningful results in AFM-based studies. One of the major advantages of this approach is its simplicity, as it does not require any fitting procedure; it only requires the area under the force–indentation data and the numerical parameters g(c) (for example, see the calculations based on Equation (16) in the Results section). There is no need to rely on more complex algorithms for fitting processes (e.g., Equations (6) and (7)). The classic Hertzian equations can be used, multiplied by an appropriate numerical factor, such as those presented in Table A1 and Table A2 in the Appendix A. The Young’s modulus can then be easily calculated using the area under the force–indentation curve (e.g., Equation (16) for conical indenters). This approach removes the need for computationally intensive models while maintaining accuracy. Experimental results from fibroblasts and simulated data using parabolic indenters validated the accuracy of the proposed simplified approach.
However, a critical question that may arise at this point is why use the approach presented in this paper, given that software packages utilizing the accurate power-law series equations already exist. The main challenge when applying the exact equations to biological samples with finite thickness (e.g., Equations (6) and (26)) is the variability in sample thickness when generating Young’s modulus maps. In other words, the sample thickness (H) differs across measurements within a Young’s modulus map. When testing a real biological sample, such as a cell, each force–indentation curve corresponds to a different sample thickness. As a result, the algorithm for the fitting process should first use a topographical image to retrieve the exact thickness at each point and then fit the data at the corresponding point using the appropriate thickness. In other words, the fitting algorithm should also use information from the topographical image in the region of interest simultaneously with the fitting procedure. Since this is extremely challenging, in most cases, an approximate value of the sample’s thickness is used for all force–indentation data (i.e., data in different nanoregions). A much easier approach is presented in this paper. The data processing strategy involves first calculating the factor g ( c ) E at every nanoregion of interest (e.g., in a mechanical properties map). Subsequently, a second map is created, which includes the g(c)-values based on the δ/H ratios. The final step is to divide the initially obtained g(c)E values by the g-values to extract the real Young’s modulus in each case. Thus, when a large number of curves need to be processed (e.g., a map consisting of 64 × 64 = 4096 curves), it is more accurate to avoid assuming a constant sample thickness. Instead, the area under the curve can be calculated first, followed by the calculation of the g(c)E parameter using the simplest standardized algorithms. Finally, these values can be divided by the corresponding g(c)-values to obtain the correct result. Therefore, the method presented in this paper can be easily integrated into standard software for AFM data processing, as it is not computationally expensive and does not require simultaneous image processing during the fitting procedure.
AFM nanoindentation has shown significant potential in cancer diagnosis, as the mechanical properties of normal and malignant cells differ [1,2,3,4,5]. Specifically, cancer cells are generally “softer”, with lower Young’s modulus values compared to normal cells [1]. Overestimations of Young’s modulus, caused by substrate effects, can lead to inaccurate results and misdiagnosis. The approach presented in this article offers a reliable and simplified method for processing AFM data, which is particularly beneficial for scientists working in cancer diagnostics.

5. Conclusions

AFM indentation experiments offer a user-independent method for diagnosing various diseases, such as cancer. However, data processing can be challenging, as it involves advanced algorithms for fitting procedures. Simplifying this process could increase the likelihood of AFM techniques being used in clinical practice. Therefore, this paper presents a new method that significantly simplifies data processing in AFM indentation experiments on thin, soft samples on rigid substrates, without requiring any fitting procedure. The first step for the proposed approach is to calculate the contact stiffness using accurate equations for indentations on thin samples. This stiffness is the product of the stiffness for an infinitely thick sample and a substrate correction function. The weighted mean value theorem for integrals provides an ‘average value’ for the correction function based on the indentation depth. This ‘average value’ is calculated by dividing the work performed by the indenter, using the accurate expressions for thin samples, by the work performed for a sample with infinite thickness. This approach can be applied to basic indenter geometries commonly employed in AFM experiments, and to any model where the force function can be written in the generic form of Equation (1).

Author Contributions

Conceptualization, S.V.K. and A.S.; methodology, S.V.K.; software, S.V.K., A.M. and A.S.; validation, S.V.K., A.M. and A.S.; investigation, S.V.K., A.M. and A.S.; resources, S.V.K., A.M. and A.S.; writing—original draft preparation, S.V.K.; writing—review and editing, S.V.K., A.M. and A.S.; supervision, A.S.; project administration, S.V.K. and A.S.; funding acquisition, S.V.K. and A.S. All authors have read and agreed to the published version of the manuscript.

Funding

Funded by the European Union. Views and opinions expressed are, however, those of the author(s) only and do not necessarily reflect those of the European Union or European Research Executive Agency. Neither the European Union nor the granting authority can be held responsible for them.

Institutional Review Board Statement

Not applicable.

Informed Consent Statement

Not applicable.

Data Availability Statement

The original contributions presented in the study are included in the article, further inquiries can be directed to the corresponding author.

Conflicts of Interest

The authors declare no conflicts of interest.

Appendix A

Table A1. The correction factor g(c) for different r/H ratios in thin samples bonded to a substrate when using conical indenters.
Thin samples bonded to the substrate with v = 0.5 (conical indenters)
F δ = 8 3 π E tan θ δ 2 1 + 0.721 tan θ δ H + 0.650 tan 2 θ δ H 2 + 0.491 tan 3 θ δ H 3 + 0.225 tan 4 θ δ H 4 e q u i v . e q . F = 8 g ( c ) 3 π Ε tan θ δ 2
To   determine   the   r / H   ratio ,   we   use   the   δ / H   ratio   as   follows :   r H = 2 t a n ( θ ) π δ H
r / H g ( c ) r / H g ( c ) r / H g ( c ) r / H g ( c )
0.00510.2551.300.5051.840.7552.79
0.0101.010.2601.310.5101.850.7602.83
0.0151.010.2651.320.5151.870.7652.84
0.0201.020.2701.320.5201.870.7702.86
0.0251.020.2751.320.5251.900.7752.89
0.0301.030.2801.340.5301.910.7802.92
0.0351.030.2851.340.5351.930.7852.94
0.0401.030.2901.350.5401.940.7902.97
0.0451.040.2951.350.5451.950.7953.00
0.0501.040.3001.370.5501.970.8003.03
0.0551.050.3051.390.5551.990.8053.05
0.0601.050.3101.390.5602.010.8103.08
0.0651.060.3151.410.5652.020.8153.11
0.0701.060.3201.410.5702.030.8203.14
0.0751.070.3251.420.5752.050.8253.15
0.0801.080.3301.420.5802.070.8303.19
0.0851.080.3351.440.5852.090.8353.22
0.0901.090.3401.450.5902.100.8403.24
0.0951.090.3451.450.5952.120.8453.28
0.1001.090.3501.470.6002.150.8503.31
0.1051.100.3551.470.6052.150.8553.33
0.1101.100.3601.480.6102.180.8603.37
0.1151.110.3651.500.6152.180.8653.40
0.1201.110.3701.500.6202.220.8703.44
0.1251.130.3751.520.6252.230.8753.46
0.1301.130.3801.520.6302.250.8803.50
0.1351.130.3851.530.6352.270.8853.52
0.1401.140.3901.550.6402.280.8903.56
0.1451.140.3951.560.6452.310.8953.59
0.1501.150.4001.570.6502.320.9003.62
0.1551.150.4051.580.6552.350.9053.66
0.1601.160.4101.600.6602.360.9103.69
0.1651.170.4151.610.6652.380.9153.73
0.1701.170.4201.620.6702.410.9203.75
0.1751.190.4251.620.6752.420.9253.79
0.1801.190.4301.650.6802.450.9303.83
0.1851.200.4351.650.6852.470.9353.86
0.1901.200.4401.660.6902.490.9403.90
0.1951.220.4451.670.6952.510.9453.93
0.2001.220.4501.680.7002.530.9503.98
0.2051.220.4551.710.7052.560.9554.01
0.2101.230.4601.710.7102.580.9604.05
0.2151.230.4651.730.7152.600.9654.09
0.2201.250.4701.740.7202.630.9704.12
0.2251.250.4751.750.7252.650.9754.15
0.2301.260.4801.770.7302.670.9804.19
0.2351.260.4851.780.7352.690.9854.23
0.2401.270.4901.790.7402.730.9904.26
0.2451.280.4951.820.7452.730.9954.32
0.2501.280.5001.820.7502.771.0004.35
Table A2. The correction factor g(c) for different r/H ratios in thin samples bonded to a substrate when using parabolic indenters.
Thin samples bonded to the substrate with v = 0.5 (conical indenters)
F = 16 9 E R 1 2 δ 3 2 1 + 1.133 R 1 2 δ 1 2 H + 1.283 R δ H 2 + 0.769 R 3 2 δ 3 2 H 3 + 0.0975 R 2 δ 2 H 4 e q u i v . e q . F = 16 9 E g ( c ) R 1 / 2 δ 3 / 2
To   determine   the   r / H   ratio ,   we   use   the   δ / H   ratio   as   follows :   r / H = R δ / H
r / H g ( c ) r / H g ( c ) r / H g ( c ) r / H g ( c )
0.0051.000.2551.310.5051.780.7552.46
0.0101.010.2601.320.5101.790.7602.48
0.0151.010.2651.320.5151.800.7652.49
0.0201.020.2701.330.5201.810.7702.51
0.0251.020.2751.340.5251.820.7752.53
0.0301.030.2801.350.5301.830.7802.54
0.0351.030.2851.360.5351.850.7852.56
0.0401.040.2901.360.5401.860.7902.58
0.0451.040.2951.370.5451.870.7952.59
0.0501.050.3001.380.5501.880.8002.61
0.0551.050.3051.390.5551.890.8052.63
0.0601.060.3101.400.5601.910.8102.64
0.0651.070.3151.400.5651.920.8152.66
0.0701.070.3201.410.5701.930.8202.68
0.0751.080.3251.420.5751.940.8252.70
0.0801.080.3301.430.5801.960.8302.72
0.0851.090.3351.440.5851.970.8352.73
0.0901.090.3401.450.5901.980.8402.75
0.0951.100.3451.460.5951.990.8452.77
0.1001.100.3501.460.6002.010.8502.79
0.1051.110.3551.470.6052.020.8552.81
0.1101.120.3601.480.6102.030.8602.83
0.1151.120.3651.490.6152.050.8652.84
0.1201.130.3701.500.6202.060.8702.86
0.1251.130.3751.510.6252.070.8752.88
0.1301.140.3801.520.6302.090.8802.90
0.1351.150.3851.530.6352.100.8852.92
0.1401.150.3901.540.6402.110.8902.94
0.1451.160.3951.550.6452.130.8952.96
0.1501.160.4001.560.6502.140.9002.98
0.1551.170.4051.570.6552.160.9053.00
0.1601.180.4101.580.6602.170.9103.02
0.1651.180.4151.590.6652.190.9153.04
0.1701.190.4201.600.6702.200.9203.06
0.1751.200.4251.610.6752.210.9253.08
0.1801.200.4301.620.6802.230.9303.10
0.1851.210.4351.630.6852.240.9353.12
0.1901.220.4401.640.6902.260.9403.14
0.1951.220.4451.650.6952.270.9453.16
0.2001.230.4501.660.7002.290.9503.18
0.2051.240.4551.670.7052.300.9553.20
0.2101.240.4601.680.7102.320.9603.22
0.2151.250.4651.690.7152.330.9653.24
0.2201.260.4701.700.7202.350.9703.26
0.2251.260.4751.710.7252.360.9753.29
0.2301.270.4801.720.7302.380.9803.31
0.2351.280.4851.730.7352.400.9853.33
0.2401.290.4901.740.7402.410.9903.35
0.2451.290.4951.750.7452.430.9953.37
0.2501.300.5001.760.7502.441.0003.40

References

  1. Lekka, M.; Laidler, P. Applicability of AFM in cancer detection. Nat. Nanotechnol. 2009, 4, 72. [Google Scholar] [CrossRef]
  2. Plodinec, M.; Loparic, M.; Monnier, C.A.; Obermann, E.C.; Zanetti-Dallenbach, R.; Oertle, P.; Hyotyla, J.T.; Aebi, U.; Bentires-Alj, M.; Lim, R.Y.H.; et al. The nanomechanical signature of breast cancer. Nat. Nanotechnol. 2012, 7, 757–765. [Google Scholar] [CrossRef] [PubMed]
  3. Stylianou, A.; Lekka, M.; Stylianopoulos, T. AFM assessment of nanomechanical fingerprints for cancer early diagnosis and classification: From single cell to tissue level. Nanoscale 2018, 10, 20930–20945. [Google Scholar] [CrossRef] [PubMed]
  4. Stylianou, A.; Gkretsi, V.; Stylianopoulos, T. TGF-β modulates pancreatic cancer-associated fibroblasts cell shape, stiffness, and invasion. Biochim. Biophys. Acta 2018, 1862, 1537–1546. [Google Scholar] [CrossRef]
  5. Stylianou, A.; Kontomaris, S.V.; Alexandratou, E.; Grant, C. AFM on biological materials related to pathological conditions. Scanning 2019, 45, 8452851. [Google Scholar]
  6. Lekka, M.; Gil, D.; Pogoda, K.; Dulińska-Litewka, J.; Jach, R.; Gostek, J.; Laidler, P. Cancer cell detection in tissue sections using AFM. Arch. Biochem. Biophys. 2012, 518, 151–156. [Google Scholar] [CrossRef]
  7. Lekka, M. Discrimination between normal and cancerous cells using AFM. BioNanoScience 2016, 6, 65–80. [Google Scholar] [CrossRef] [PubMed]
  8. Zemła, J.; Danilkiewicz, J.; Orzechowska, B.; Pabijan, J.; Seweryn, S.; Lekka, M. AFM as a tool for assessing cellular elasticity and adhesiveness to identify cancer cells and tissues. Semin. Cell Dev. Biol. 2018, 73, 115–124. [Google Scholar] [CrossRef] [PubMed]
  9. Cross, S.E.; Jin, Y.-S.; Tondre, J.; Wong, R.; Rao, J.; Gimzewski, J.K. AFM-based analysis of human metastatic cancer cells. Nanotechnology 2008, 19, 384003. [Google Scholar] [CrossRef] [PubMed]
  10. Holuigue, H.; Lorenc, E.; Chighizola, M.; Schulte, C.; Varinelli, L.; Deraco, M.; Guaglio, M.; Gariboldi, M.; Podestà, A. Force sensing on cells and tissues by AFM. Sensors 2022, 22, 2197. [Google Scholar] [CrossRef]
  11. Ludwig, T.; Kirmse, R.; Poole, K.; Schwarz, U.S. Probing cellular microenvironments and tissue remodeling by AFM. Pflug. Arch. Eur. J. Physiol. 2008, 456, 29–49. [Google Scholar] [CrossRef] [PubMed]
  12. Hayashi, K.; Iwata, M. Stiffness of cancer cells measured with AFM indentation method. J. Mech. Behav. Biomed. Mater. 2015, 49, 105–111. [Google Scholar] [CrossRef]
  13. Sokolov, I.; Dokukin, M.E.; Guz, N.V. Method for quantitative measurements of elastic modulus of biological cells in AFM indentation experiments. Methods 2013, 60, 202–213. [Google Scholar] [CrossRef]
  14. Viji Babu, P.K.; Radmacher, M. Mechanics of brain tissues studied by AFM: A perspective. Front. Neurosci. 2019, 13, 600. [Google Scholar] [CrossRef] [PubMed]
  15. Jorba, I.; Uriarte, J.J.; Campillo, N.; Farré, R.; Navajas, D. Probing micromechanical properties of ECM of soft tissues by AFM. J. Cell. Physiol. 2017, 232, 19–26. [Google Scholar] [CrossRef]
  16. Gautier, H.O.B.; Thompson, A.J.; Achouri, S.; Koser, D.E.; Holtzmann, K.; Moeendarbary, E.; Franze, K. AFM-based force measurements on animal cells and tissues. Biophys. Methods Cell Biol. 2015, 125, 211–235. [Google Scholar]
  17. Abidine, Y.; Constantinescu, A.; Laurent, V.M.; Rajan, V.S.; Michel, R.; Laplaud, V.; Duperray, A.; Verdier, C. Mechanosensitivity of cancer cells in contact with soft substrates using AFM. Biophys. J. 2018, 114, 1165–1175. [Google Scholar] [PubMed]
  18. Liu, S.; Han, Y.; Kong, L.; Wang, G.; Ye, Z. AFM in disease-related studies: Exploring tissue and cell mechanics. Microsc. Res. Tech. 2023, 87, 660–684. [Google Scholar] [CrossRef]
  19. Zhou, G.; Zhang, B.; Tang, G.; Yu, X.F.; Galluzzi, M. Cells nanomechanics by AFM: Focus on interactions at the nanoscale. Adv. Phys. X 2021, 6. [Google Scholar] [CrossRef]
  20. Liang, W.; Shi, H.; Yang, X.; Wang, J.; Yang, W.; Zhang, H.; Liu, L. Recent advances in AFM-based biological characterizations and applications at multiple levels. Soft Matter 2020, 16, 8962–8984. [Google Scholar]
  21. Kiio, T.M.; Park, S. Nano-scientific application of AFM in pathology: From molecules to tissues. Int. J. Med. Sci. 2020, 17, 844–858. [Google Scholar] [CrossRef]
  22. Calò, A.; Romin, Y.; Srouji, R.; Zambirinis, C.P.; Fan, F.; Santella, A.; Feng, E.; Fujisawa, S.; Turkekul, M.; Huang, S.; et al. Spatial mapping of collagen distribution in human and mouse tissues by force volume AFM. Sci. Rep. 2020, 10, 15664. [Google Scholar] [CrossRef] [PubMed]
  23. Ihnatouski, M.; Pauk, J.; Karev, D.; Karev, B. AFM-based method for measurement of normal and osteoarthritic human articular cartilage surface roughness. Materials 2020, 13, 2302. [Google Scholar] [CrossRef]
  24. Stolz, M.; Gottardi, R.; Raiteri, R.; Miot, S.; Martin, I.; Imer, R.; Staufer, U.; Raducanu, A.; Düggelin, M.; Baschong, W.; et al. Early detection of aging cartilage and osteoarthritis in mice and patient samples using AFM. Nat. Nanotechnol. 2009, 4, 186–192. [Google Scholar] [CrossRef]
  25. Loparic, M.; Wirz, D.; Daniels, A.U.; Raiteri, R.; Vanlandingham, M.R.; Guex, G.; Martin, I.; Aebi, U.; Stolz, M. Micro- and nanomechanical analysis of articular cartilage by indentation-type AFM: Validation with gel-microfiber composite. Biophys. J. 2010, 98, 2731–2740. [Google Scholar] [CrossRef] [PubMed]
  26. Dimitriadis, E.K.; Horkay, F.; Maresca, J.; Kachar, B.; Chadwick, R.S. Determination of elastic moduli of thin layers of soft material using AFM. Biophys. J. 2002, 82, 2798–2810. [Google Scholar] [CrossRef]
  27. Santos, J.A.C.; Rebêlo, L.M.; Araujo, A.C.; Barros, E.B.; de Sousa, J.S. Thickness-corrected model for nanoindentation of thin films with conical indenters. Soft Matter 2012, 8, 4441. [Google Scholar] [CrossRef]
  28. Gavara, N.; Chadwick, R.S. Determination of elastic moduli of thin samples and adherent cells using conical AFM tips. Nat. Nanotechnol. 2012, 7, 733–736. [Google Scholar] [CrossRef] [PubMed]
  29. Garcia, P.D.; Garcia, R. Determination of elastic moduli of a single cell cultured on a rigid support by force microscopy. Biophys. J. 2018, 114, 2923–2932. [Google Scholar] [CrossRef]
  30. Chiodini, S.; Ruiz-Rincón, S.; Garcia, P.D.; Martin, S.; Kettelhoit, K.; Armenia, I.; Werz, D.B.; Cea, P. Bottom Effect in Atomic Force Microscopy Nanomechanics. Small 2020, 16, 2000269. [Google Scholar] [CrossRef] [PubMed]
  31. Argatov, I.; Jin, X. Self-Consistent Approximations for the Frictionless Paraboloidal and Conical Depth-Sensing Indentation: The Generalized Bottom Effect. Int. J. Solids Struct. 2024, 291, 112713. [Google Scholar] [CrossRef]
  32. Hermanowicz, P. Determination of Young’s Modulus of Samples of Arbitrary Thickness from Force Distance Curves: Numerical Investigations and Simple Approximate Formulae. Int. J. Mech. Sci. 2021, 193, 106138. [Google Scholar] [CrossRef]
  33. Kontomaris, S.V.; Stylianou, A.; Malamou, A.; Nikita, K.S. An Alternative Approach for the Young’s Modulus Determination of Biological Samples Regarding AFM Indentation Experiments. Mater. Res. Express 2018, 6, 025407. [Google Scholar] [CrossRef]
  34. Kontomaris, S.V.; Stylianou, A.; Chliveros, G.; Malamou, A. Determining Spatial Variability of Elastic Properties for Biological Samples Using AFM. Micromachines 2023, 14, 182. [Google Scholar] [CrossRef] [PubMed]
  35. Polezzi, M. On the Weighted Mean Value Theorem for Integrals. Int. J. Math. Educ. Sci. Technol. 2006, 37, 868–870. [Google Scholar] [CrossRef]
  36. Kontomaris, S.V.; Stylianou, A.; Georgakopoulos, A.; Malamou, A. Is It Mathematically Correct to Fit AFM Data (Obtained on Biological Materials) to Equations Arising from Hertzian Mechanics? Micron 2023, 164, 103384. [Google Scholar] [CrossRef]
  37. Hermanowicz, P.; Sarna, M.; Burda, K.; Gabryś, H. An Open Source Software for Analysis of Force Curves. Rev. Sci. Instrum. 2014, 85, 063703. [Google Scholar] [CrossRef]
  38. Kontomaris, S.V.; Malamou, A. Hertz Model or Oliver & Pharr Analysis? Tutorial Regarding AFM Nanoindentation Experiments on Biological Samples. Mater. Res. Express 2020, 7, 033001. [Google Scholar]
  39. Baldwin, S.J.; Sampson, J.; Peacock, C.J.; Martin, M.L.; Veres, S.P.; Lee, J.M.; Kreplak, L. A New Longitudinal Variation in the Structure of Collagen Fibrils and Its Relationship to Locations of Mechanical Damage Susceptibility. J. Mech. Behav. Biomed. Mater. 2020, 110, 103849. [Google Scholar] [CrossRef] [PubMed]
  40. Persch, G.; Born, C.; Utesch, B. Nano-Hardness Investigations of Thin Films by an Atomic Force Microscope. Microelectron. Eng. 1994, 24, 113–121. [Google Scholar] [CrossRef]
  41. Stolz, M.; Raiteri, R.; Daniels, A.U.; VanLandingham, M.R.; Baschong, W.; Aebi, U. Dynamic Elastic Modulus of Porcine Articular Cartilage Determined at Two Different Levels of Tissue Organization by Indentation-Type Atomic Force Microscopy. Biophys. J. 2004, 86, 3269–3283. [Google Scholar] [CrossRef]
  42. Managuli, V.; Roy, S. Asymptotical Correction to Bottom Substrate Effect Arising in AFM Indentation of Thin Samples and Adherent Cells Using Conical Tips. Exp. Mech. 2018, 58, 733–741. [Google Scholar] [CrossRef]
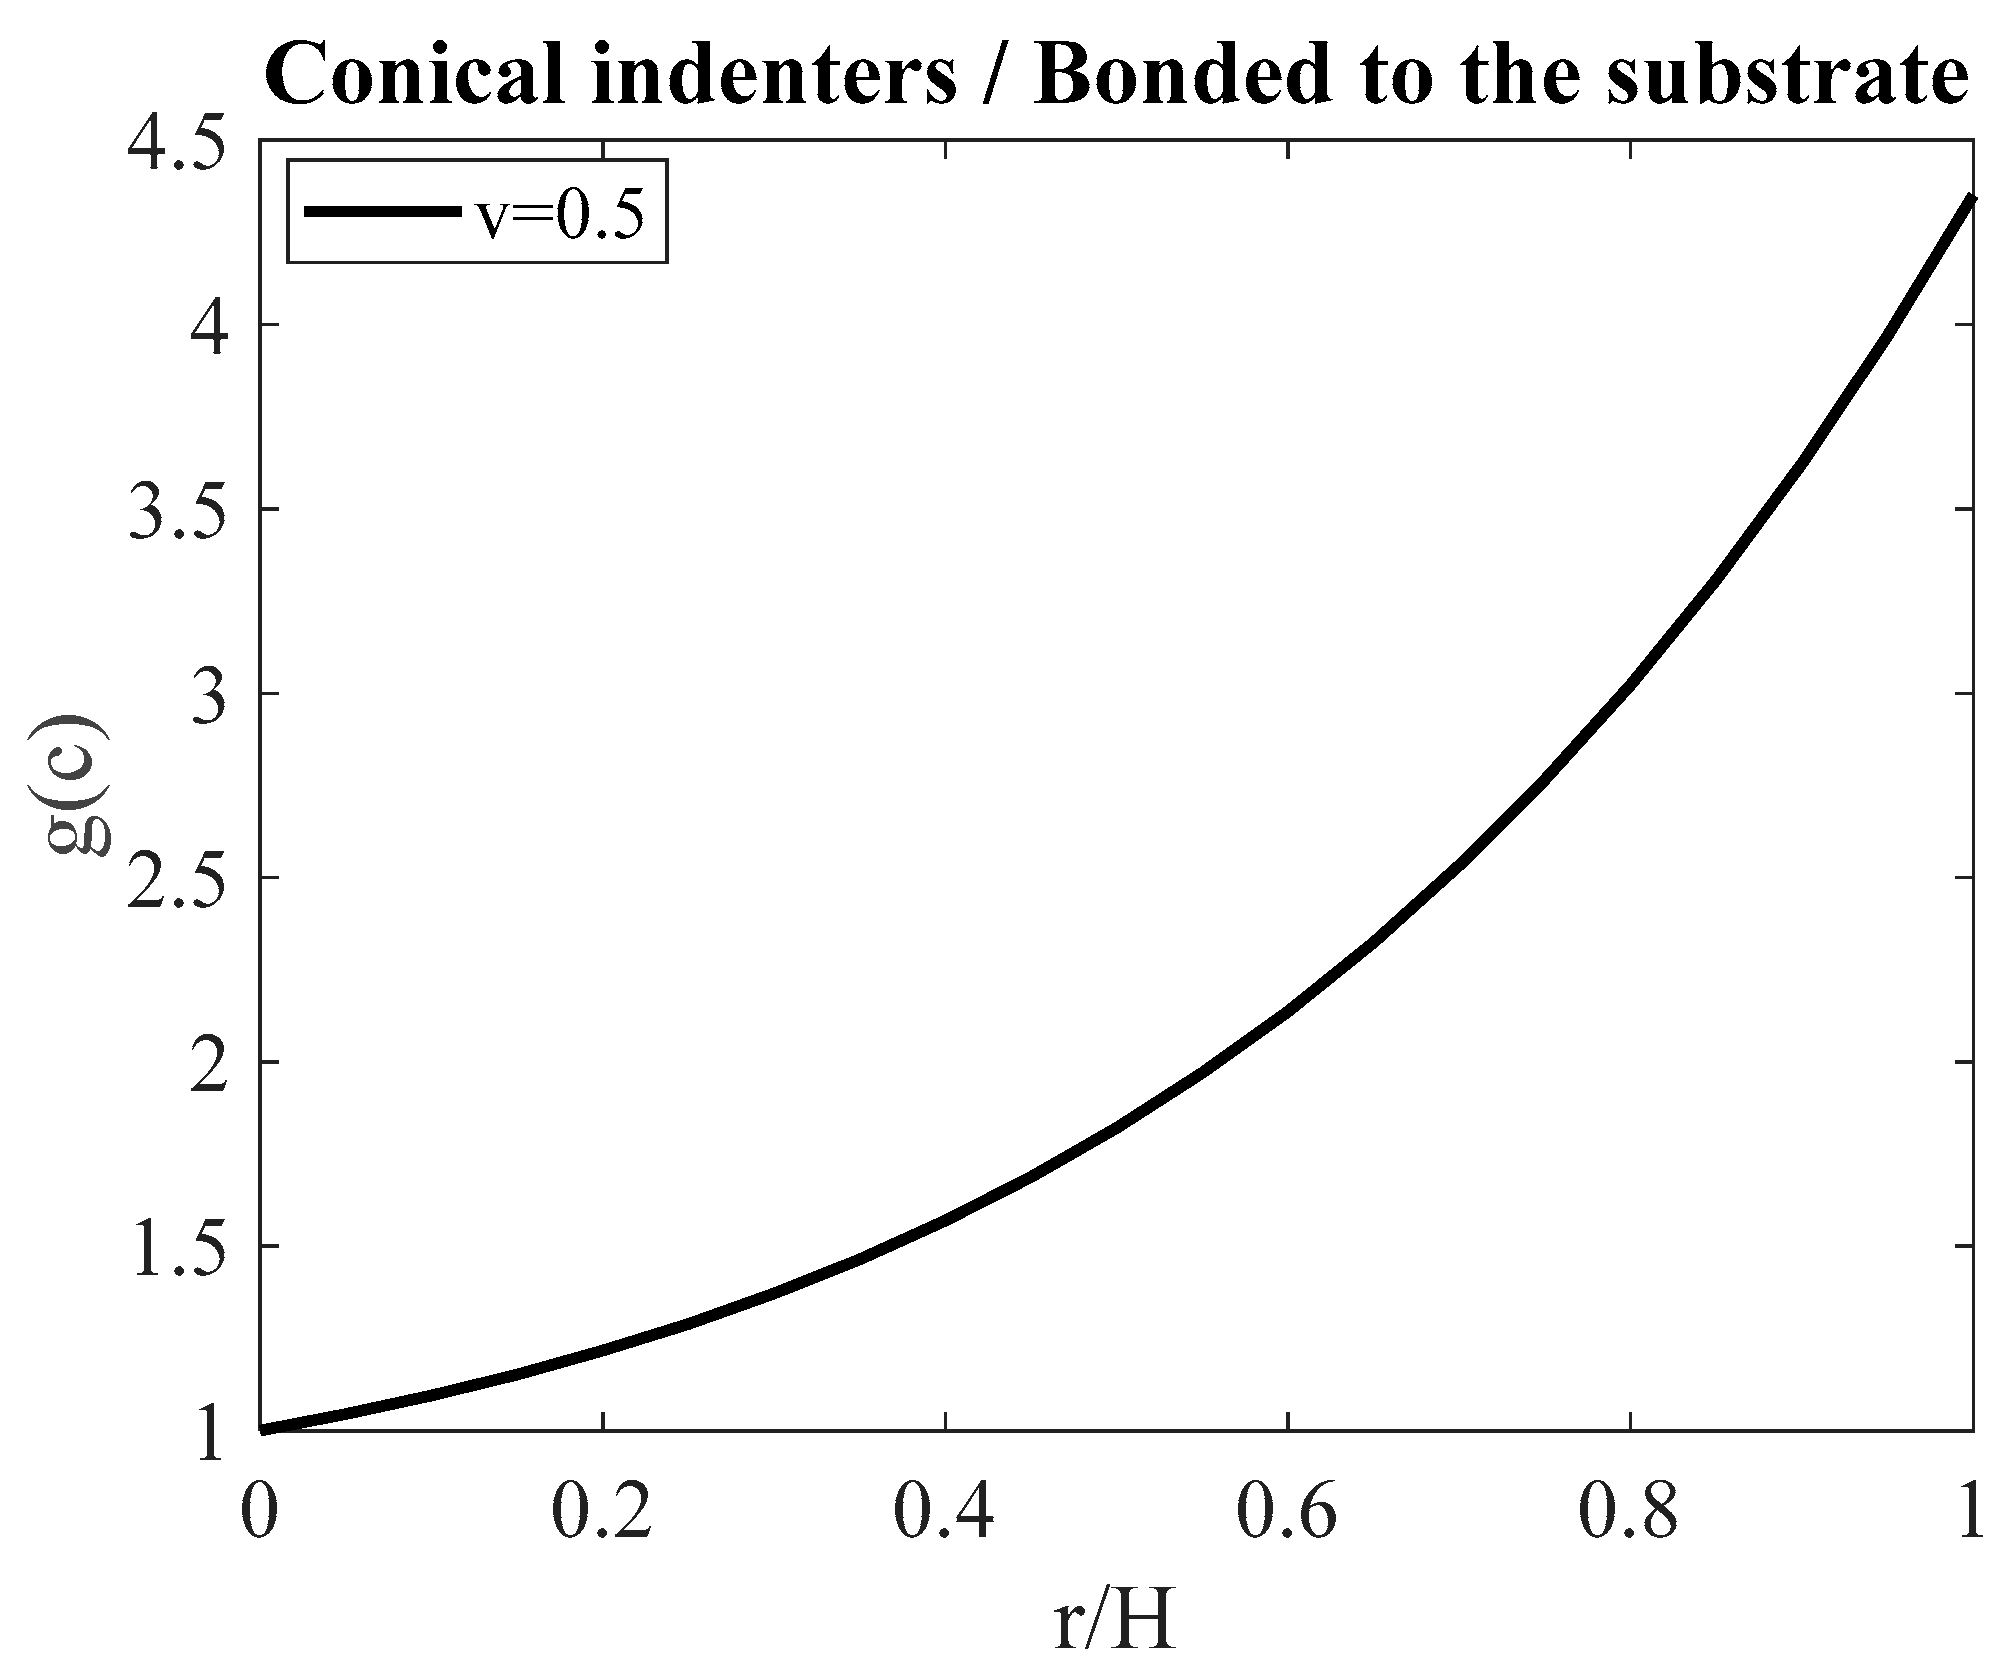
Figure 1. Conical indenters and v = 0.5. The g ( c ) = f ( r / H ) data for samples bonded to the substrate.
Eng 06 00032 g001
Figure 2. A theoretical example of the simplified process. (a) Theoretical force–indentation data on a thin sample bonded on a rigid substrate with a conical indenter, considering θ = 25 ° , δ = 500   nm , H = 1000   nm and E = 1 kPa (Equation (6)). The area under the graph is highlighted and is equal to the work performed by the indenter. (b) An ‘equivalent’ curve (Equation (14)) with the same indentation depth and the same work performed by the indenter. In this case, F = 2896 δ 2 (S.I.). (c) The actual and the ‘equivalent’ curve are presented for comparison. Both curves correspond to the same Young’s modulus (E = 1 kPa).
Eng 06 00032 g002
Figure 3. Experimental data from human fibroblast. (a) Force–indentation data on a human fibroblast bonded to the substrate with a conical indenter with half-angle θ = 25 ° . In the region of the experiment, the cell’s thickness was approximately H = 2 μm. The data were fitted to Equation (6), resulting in Equation (22). The Young’s modulus was calculated as 3.11 kPa. (b) The work performed by the indenter (calculated using the area under the F-δ curve) was W = 2.34 · 10 16 J . This value should be substituted into Equation (24) to calculate the Young’s modulus of the tested sample using the method proposed in this paper, provided that the g(c)-value is known. In this case, the maximum indentation depth was δ = 800   nm ; therefore, δ H = 0.4 . Thus, Equation (18) results in g c = 1.11 . The Young’s modulus using this approach resulted in 3.12 kPa. (c) Using the g(c)-value and the calculated Young’s modulus from Equation (24), the force–indentation curve of the ‘equivalent’ experiment (i.e., Equation (14)) can be plotted ( F = 1364 δ 2 ( S . I . ) ). The areas under the graphs presented in (b,c) are identical.
Eng 06 00032 g003
Figure 4. Experimental data from fibroblast. The data presented in Table 1: ‘Cl. Eq.’ indicate the classic Equation (6) for data processing, while ‘New App.’ indicates the equation presented in this paper (Equation (16)). The results are nearly identical.
Eng 06 00032 g004
Figure 5. Parabolic indenters and v = 0.5. The g(c) = f(r/H) data for (a) samples bonded to the substrate, (b) samples not bonded to the substrate.
Eng 06 00032 g005
Figure 6. Open-access simulated data from the AtomicJ repository (R = 1 μm, H = 2 μm): (ad) δ m a x = 800   nm , g c = 1.65 , (eh) δ m a x = 1000   nm , g c = 1.76 . (a) The area under the graph is equal to W = 1.341 · 10 14   J . (b) An equivalent case with the same indentation depth and the same work performed by the indenter on a sample with infinite thickness. (c) The force–indentation data were fitted to Equation (29), yielding a Young’s modulus of 20.27   kPa . (d) The actual and ‘equivalent’ curves are presented for comparison. The Young’s modulus, determined using the simplified approach presented in this paper (Equation (31)), resulted in 20.21   kPa . (e) The area under the graph is equal to W = 2.516   ·   10 14   J . (f) An equivalent case with the same indentation depth and the same work performed by the indenter on a sample with infinite thickness. (g) The force–indentation data were fitted to Equation (29), yielding a Young’s modulus of 20.15   kPa . (h) The actual and equivalent curves are presented for comparison. The Young’s modulus, determined using the simplified approach presented in this paper (Equation (31)), resulted in 20.14   kPa .
Eng 06 00032 g006aEng 06 00032 g006b
Figure 7. The proposed approach applies to any indenter geometry and any model for samples with finite thickness, based on Equation (1). The steps for calculating the g(c) coefficients for different r/H ratios and various indenter geometries are clearly outlined.
Eng 06 00032 g007
Figure 8. Explaining the significance of taking the substrate effect into account. Simulated force–indentation data using a parabolic indenter with a radius of R = 1 μm on a sample with a thickness of H = 2 μm were processed using the accurate Equation (26) and the classic Hertzian equation for parabolic indenters. The error when using the classic Hertzian equation ( F = 16 9 E R 1 / 2 δ 3 / 2 ) was approximately 75%. An accurate and simple alternative is using Equation (31), which yields the correct result (E = 20 kPa).
Eng 06 00032 g008
Table 1. Open-access experimental data from fibroblast. Fifteen force–indentation curves were processed using the classic approach (Equation (6)) and the approach proposed in this paper (Equation (16)). The indentation depths ranged from 750 nm to 950 nm, while the sample thickness was 2 μm. The g -values can be easily obtained in each case using Equations (19) and (20) (see also Table A1 in the Appendix A). When using the classic approach (Equation (6)), E c l a s s i c = 5.683 ± 0.616   kPa . In addition, when using the approach proposed by this paper (Equation (16)), E a p p r o x . = 5.675 ± 0.619   kPa .
r/H g (c)Young’s Mod. (kPa) (Equation (6))Young’s Mod. (kPa) (Equation (16))
0.1261.136.046.00
0.1321.135.135.14
0.1291.135.765.75
0.1281.135.875.85
0.1391.144.794.79
0.1251.135.615.57
0.1391.144.744.73
0.1371.145.055.04
0.1211.116.326.37
0.1121.116.756.74
0.1311.135.635.63
0.1301.135.505.49
0.1171.116.496.51
0.1261.135.305.26
0.1251.136.296.25
Disclaimer/Publisher’s Note: The statements, opinions and data contained in all publications are solely those of the individual author(s) and contributor(s) and not of MDPI and/or the editor(s). MDPI and/or the editor(s) disclaim responsibility for any injury to people or property resulting from any ideas, methods, instructions or products referred to in the content.