Article

Performance and Uncertainty Analysis of Digital vs. Analog Pressure Scanners Under Static and Dynamic Conditions

1
National Research and Development Institute for Gas Turbines—Romanian Research & Development Institute for Gas Turbines, 061126 Bucharest, Romania
2
Faculty of Electronics, Telecommunication and Information Technology, National University of Science and Technology Politehnica of Bucharest, 060042 Bucharest, Romania
*
Author to whom correspondence should be addressed.
Eng 2025, 6(10), 263; https://doi.org/10.3390/eng6100263
Submission received: 14 August 2025 / Revised: 9 September 2025 / Accepted: 18 September 2025 / Published: 4 October 2025
(This article belongs to the Section Electrical and Electronic Engineering)

Abstract

Dynamic pressure measurement is an important component in the turbo engine testing process. This paper presents a comparative analysis between two types of multichannel electronic pressure measurement systems, commonly known as pressure scanners, used for this purpose: ZOC17/8Px, with analog amplification per channel, and MPS4264, a modern digital system with integrated A/D conversion. The study was conducted in two stages: a metrological verification and validation in static mode, using a high-precision pressure standard, and an experimental stage in dynamic mode, where data was acquired from a turbojet engine test stand, in constant engine speed mode. The signal stability of the pressure scanners was statistically analyzed by determining the coefficient of variation in the signal and the frequency spectrum (FFT) for each channel of the pressure scanners. Furthermore, comprehensive uncertainty budgets were calculated for both systems. The results highlight the superior stability and reduced uncertainty of the MPS4264 pressure scanner, attributing its enhanced performance to digital integration and a higher resilience to external noise. The findings support the adoption of modern digital systems for dynamic applications and provide a robust metrological basis for the optimal selection of measurement systems.

1. Introduction

Pressure is an essential parameter for evaluating turbojet engine performance, contributing significantly to the analysis of their reliability, safety and efficiency in the testing and validation stages [1,2].
Multichannel pressure acquisition systems are a common solution for simultaneous pressure measurement at multiple points [3,4]. In this field, Scanivalve Corp. is a leading manufacturer that popularized the term ‘scanivalve’ [5] and provided foundational work on the uncertainty analysis of its systems [6]. In turbojet testing and aerodynamic applications, dynamic pressure measurement has traditionally relied on analog pressure scanners (e.g., the ZOC17), combined with statistical and spectral analysis (Fast Fourier Transform, FFT) to identify noise sources and stabilize the signal [5,7].
However, most existing studies have focused on static characterization or standard calibration [8], without rigorous combination of metrological validation with FFT data. As a result, the aggregated signal uncertainty in the dynamic regime has remained little investigated [9,10]. While the general evaluation of measurement uncertainty for sensor networks [11] and the estimation of uncertainties for dynamic mechanical quantities are active research areas [12], a direct comparative application to two distinct pressure scanner technologies within a relevant industrial dynamic context is still lacking.
The dynamic calibration of piping systems has been studied using a single pressure measuring device [13,14,15], including recent work addressing shock tube calibration technology under low-pressure conditions [15]. Methods that characterize the frequency response of transmission systems also applicable to multichannel setups [16]. Recent research has increasingly integrated frequency analysis into the assessment of measurement quality. The utility of the FFT has been demonstrated for adjusting transfer functions [9] and for estimating low frequency uncertainty [1]. The dynamic calibration approach using a single sensor [13] emphasizes the need to normalize amplitudes for comparability [16], while other studies highlight the impact of connecting tubing on signal fidelity [17] and the need to include amplification and phase delay in uncertainty calculations [18]. In parallel, the technical literature [18,19,20,21] increasingly emphasizes combining static uncertainty (e.g., resolution, calibration, hysteresis) with dynamic contributions (e.g., noise, temporal instability), proposing methods to couple FFT and combined standard uncertainty components, as defined by the Guide to the Expression of Uncertainty in Measurement (GUM), to obtain a complete uncertainty budget [12,22].
Recent studies have explored various aspects relevant to this research. Methods for evaluating static and dynamic uncertainty in aerodynamic tests have been proposed [23], highlighting the importance of sensor stability and the impact of flow dynamics on signal fidelity [2]. Recent research [24] also shows that temperature can introduce significant errors in static measurements, providing support for the choice to ignore or include thermal uncertainty, as appropriate.
The influence of vibrations, temperature, and piping configuration on signal stability in wind tunnels has also been analyzed [3,25]. A probabilistic approach was developed to quantify noise and uncertainty from digitalization, highlighting the importance of knowing the error distribution in metrological analysis [26]. This direction is consistent with the use in this paper of the standard deviation calculated from the dynamic regime as a type B uncertainty component in this paper. Furthermore, the authors in [27] proposed a method for compensating for thermal errors in multichannel systems, demonstrating a significant improvement in measurement stability under variable temperature conditions. The current study continues the direction of recent research [21], comparatively analyzing an analog and a digital pressure scanner, with a focus on dynamic response and uncertainty.
Despite this progress, an obvious gap remains in the literature, with few studies directly comparing the performances of two generations of pressure scanners (analog vs. digital) under real turbo engine test conditions. More specifically, there is a lack of integrated analyses that combine FFT analysis, metrological validation, and a detailed uncertainty calculation for both technologies. The present work addresses this gap by offering a comprehensive analysis of the dynamic behavior (variability, dominant frequencies, normalized amplitudes) and the metrological validation in static mode (calibration, uncertainty budget according to GUM), demonstrating how the system’s architecture influences measurement quality. The methodology for dynamic pressure measurements and their associated uncertainties is a topic of ongoing research, with key guidelines provided by international metrology organizations such as the European Association of National Metrology Institutes (EURAMET) [28].
The use of pressure scanner systems represents an indispensable solution in advanced turbo engine testing, due to their ability to perform simultaneous multichannel measurements [3,5]. These systems allow monitoring of pressure distribution at multiple critical points of the installation, without requiring a separate acquisition system for each point. Also, these systems optimize space, weight and complexity of the test infrastructure while providing precise data correlation and reducing errors associated with time lags or external interference. A multichannel electronic pressure scanner is a key instrument for acquisition of pressure parameters in aerospace applications [3]. Each channel is equipped with an individual pressure sensor [29]. The paper proposes a comparison between two generations of pressure scanners:
  • The ZOC17/8Px-APC Module (Scanivalve, Liberty Lake, WA, USA), analog system: This pressure scanner has 8 channels, with amplification on each channel and is representative of existing configurations on test stands.
  • The MPS4264 Ethernet Miniature Pressure Scanner (Scanivalve, Liberty Lake, WA, USA), digital system: This modern pressure scanner has 64 channels with an internal 16-bit resolution, integrated analog-to-digital conversion and serial data transmission.
The analog ZOC17/8Px-APC Module system is known to be sensitive to electrical noise, thermal drift and gain variations between channels, which affects measurement stability in dynamic mode. In contrast, the digital MPS4264 Ethernet Miniature Pressure Scanner system minimizes external influences, drift and signal losses, providing superior repeatability and stability under vibration and temperature variations.
The main contributions of this paper are:
  • A direct comparative evaluation of two distinct pressure scanner technologies (analog vs. digital) in a relevant industrial context.
  • A combined analysis of signal stability, spectral content (FFT), and metrological uncertainty in both static and dynamic measurement regimes.
  • The quantification of the performance difference between the two systems, supported by a detailed uncertainty budget.
  • A set of clear recommendations regarding the optimal choice of pressure scanners for high-precision dynamic applications.
This paper is structured as follows: Section 2 describes the experimental setup and the detailed methodology for both static and dynamic tests. Section 3 presents the obtained results, including statistical data, FFT analysis, and the calculated uncertainty budgets. Section 4 provides a comprehensive discussion of the findings, including their implications and a justification of the chosen methods. Finally, Section 5 presents the main conclusions of the study and proposes directions for future research.

2. Materials and Methods

To evaluate the performance of the two systems, the methodology was structured in two distinct stages: a dynamic analysis and a static analysis. The procedures for each test regime are detailed in a clear and logical sequence of steps.
In the dynamic mode, data were obtained during engine operation on the test bench at constant speeds, and the signal stability was assessed by the signal’s coefficient of variation and by FFT spectral analysis. In the static mode, calibration was performed under known environmental conditions, errors were analyzed against a reference standard, and the uncertainty budget was calculated according to GUM requirements.

2.1. Test Stand and the Acquisition System Presentation

The experiments were conducted on a dedicated turbo engines test stand, equipped with a complete instrumentation system and a digital data acquisition and control system (DACS) that enables simultaneous monitoring of critical parameters such as pressure, temperature, flow rates and vibrations. As shown in the block diagram (Figure 1) the stand’s architecture includes a control desk, an operator panel and a PC for data acquisition and post-processing.
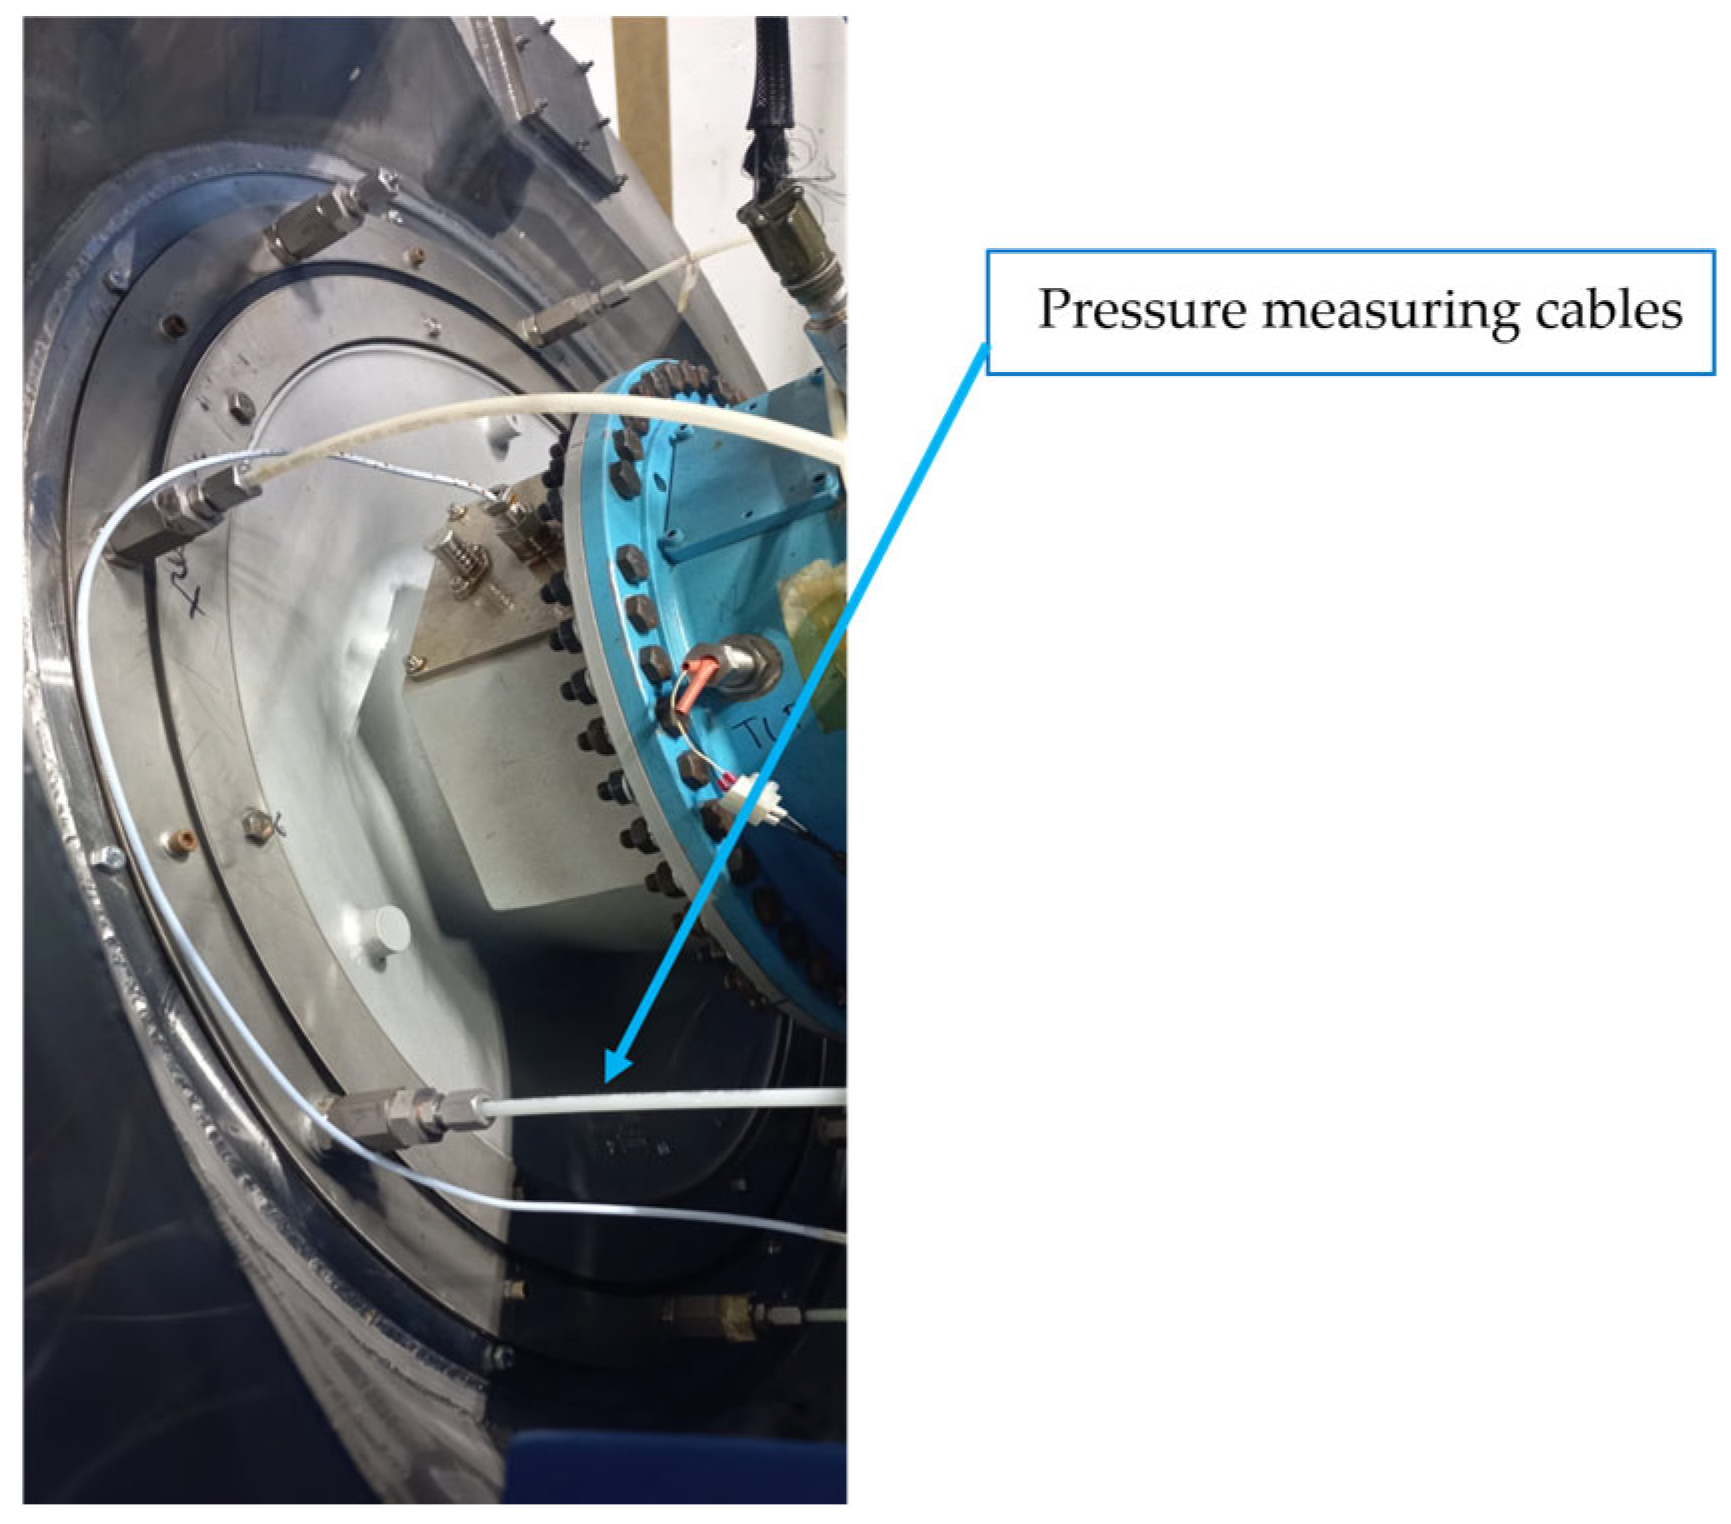
The ZOC17 and MPS4264 electronic pressure scanner systems analyzed were mounted directly on the turbo engine volute, using a network of pressure measurement cables, Figure 2. This setup ensured that both systems acquired data under identical operating conditions, allowing for a direct and valid comparative analysis.
A fundamental difference between the two systems is the structure of the acquisition chain. The ZOC17 analog system individually amplifies each channel’s pressure signal, to a nominal level of ±2.5 Vdc, transmitted to a PR4114 signal adapter (PR electronics, Ronde, Denmark), which performs an A/D conversion through an external module and is then fed into a programmable logic controller (PLC), from where it is routed to the PC for processing (Figure 1).
The MPS4264 digital system integrates a pressure microsensor and an analog-to-digital converter (A/D) on each channel. It also incorporates a Dynamic Zero Correction algorithm to automatically compensate for electronic and temperature drift. The data is transmitted directly in digital format via an Ethernet connection to the PC, eliminating the need for an intermediate PLC and thus reducing potential sources of error while improving measurement fidelity. The digital system also allows synchronized channel sampling and operation at high acquisition frequencies (up to 500 Hz per channel).
The pressure measurement range with pressure scanner system is ±20 mbar. In this work, only the first four channels of each pressure scanner were used. This multi-sensor architecture contributes to the accuracy and flexibility of systems in distributed measurement applications, such as dynamic tests on turbo engines.

2.2. Testing Procedure in Dynamic Regime

The dynamic characterization procedure is presented as follows:
  • Engine preparation: The engine was mounted on a test bench, and the pressure scanners were connected to the measurement points.
  • Stable dynamic conditions: The engine was started and stabilized at a constant, steady-state revolutions per minute (RPM) to ensure controlled operating conditions.
  • Data acquisition: The dynamic data acquisition process was initiated, with each system (analog and digital) recording pressure signals separately, at the same measurement point.
  • Data analysis: The collected time-series data were analyzed in the frequency domain using FFTs to identify noise characteristics.
  • Uncertainty budget: The dynamic noise was quantified and incorporated as a component in the overall measurement uncertainty budget.
  • Performance comparison: The metrological performance of the two systems was compared based on their noise levels, stability, and total uncertainty under dynamic conditions
The characterization in dynamic mode was achieved by the real-time acquisition of pressure values, obtained directly from the intake manifold of a turbo engine. During the tests, the engine was maintained at a constant speed of 25,500 rpm, generating a pulsating pressure profile specific to its operation. For each of the four active channels of both systems, 324 consecutive values were acquired at a sampling rate of f s = 5 Hz.
This sampling rate was considered sufficient to monitor the long-term pressure variations, low frequency pressure oscillations expected in the stationary intake manifold. Testing under these conditions allows the evaluation of the pressure scanners behavior in dynamic mode, under conditions similar to those of the real application.
The data were acquired during engine operation at constant speed on the test bench. This condition was essential to isolate pressure fluctuations caused by the scanners themselves, not by engine variability. Moreover, maintaining constant speed ensured test safety and stability, preventing uncontrolled variations that could compromise both the test integrity and the equipment’s safety. Although speed remained fixed, the regime was dynamic due to continuous time-series recording, enabling evaluation of signal stability and noise.

2.3. Testing Procedure in Static Regime

The static characterization procedure is presented as follows:
  • System Preparation: The pressure scanners were installed on the test bench and connected to the Fluke pressure standard, which was used as the calibration reference.
  • Environmental Stabilization: The temperature and pressure were allowed to stabilize to ensure consistent measurement conditions.
  • Calibration Cycles: Three complete calibration cycles were performed, with pressure being gradually increased (ascending cycle) and then decreased (descending cycle) back to zero.
  • Data Acquisition: Pressure readings from the two systems were recorded at specific, predetermined calibration points.
  • Data Analysis: The collected data were analyzed to determine the metrological characteristics of each scanner, including repeatability and hysteresis.
  • Uncertainty Calculation: The measurement uncertainty was evaluated based on the GUM guidelines, integrating both Type A uncertainties (from repeatability) and various Type B uncertainties (from manufacturer specifications and other known sources).
  • Performance Assessment: A comprehensive performance evaluation was conducted based on the calculated metrological characteristics and the total measurement uncertainty.
The calibration of each active channel of both acquisition systems was carried out directly on the test stand, under specific environmental conditions. This approach ensured that the entire measurement chain was characterized in its operating environment, integrating the noise specific to the test environment, including the electronic noise of the scanners (also present in the A/D conversion for the analog model), into the calibration and subsequent uncertainty evaluation. The individual calibration of each channel was crucial for compensating for minor variations in offset and gain, ensuring maximum accuracy for each acquisition point. The calibration process involved the controlled application of pressure using an air pressure pump. The values from the pressure scanner acquisition system were compared against a certified Fluke digital pressure standard, with an accuracy of 0.02% of the measurement range, (−1, …, 2) Bar and with known uncertainty.
For each channel, three complete measurement cycles were performed, ascending and descending, covering the entire pressure range of ±200 mbar. Although this range exceeds the typical ±20 mbar observed during dynamic operation, it allowed us to fully characterize the instruments’ behavior, ensuring all values from the dynamic regime were captured within the calibration range.

2.4. Data Analysis Methods for Dynamic Regime

The analysis of the data recorded in dynamic mode was aimed at the comparative evaluation of the pressure scanners performance and indication of noise introduced by each system. The following methods were used:

2.4.1. Coefficient of Variation (CV)

In order to evaluate the stability of the pressure signal in dynamic mode, the coefficient of variation (CV) of the signal was calculated for each active channel of the two scanivalve systems. This statistical indicator expresses the degree of relative variation in the signal with respect to its average, on each channel of the systems. It allows the exact evaluation of the noise level and the stability of the measurements during experimental tests at constant speed. The CV calculation was performed on a set of N = 324 records for each channel, according to the Equation (1).
C V = σ μ   × 100 %
where σ is the standard deviation of the series of recorded pressures calculated with Equation (2).
σ = 1 N 1 i = 1 N P i μ 2
where μ is the arithmetic average of the 324 recorded values.
A lower CV reflects a lower relative variation in measurements and, implicitly, a relatively lower noise level in relation to the average signal, suggesting a better stability of the respective channel.

2.4.2. Frequency Analysis by Fast Fourier Transform (FFT)

To analyze the spectral content of the pressure signals and identify the distribution of noise and harmonic components, the Fast Fourier Transform (FFT) was applied to convert the signal from the time domain to the frequency domain. This method allows for the identification of the frequencies at which the signal variations are concentrated.
The analysis was performed on the first N = 256 records of each pressure signal, as the FFT algorithm requires the number of points to be a power of 2 (in this case, 28).
The frequency corresponding to each index k, denoted as f k , was calculated using the sampling rate f s = 5   H z and the total number of points N = 256, resulting in a frequency resolution of 0.0195 Hz.

2.4.3. Normalization of Spectral Amplitudes

To compare the spectral behavior of the two pressure scanners, the normalized amplitude of the FFT components was calculated. This method provides a common basis for comparison between the two systems, as the amplitude, expressed directly in physical units (mbar), facilitates the identification of the real noise level present on each channel. This approach allows us to highlight significant differences in low-frequency response and pressure signal spectral distribution. The normalized amplitude A k was derived from the modulus of the complex FFT coefficients X A k or X D k , using the following equation:
A 0 = X 0 N
For the DC component (k = 0), which is 0 Hz, this value represents the average of the signal in the time domain.
A k = 2 X k N
For useful positive frequencies (k = 1, …, N/2 − 1), the amplitude is multiplied by 2, to reflect the actual amplitude (sinusoid peak) of the components in the original signal, given that the energy is symmetrically distributed between the positive and negative frequencies.

2.4.4. Relative Frequency Comparison (Relative Transfer Function)

In order to evaluate the differences in frequency response and noise content between the two types of pressure scanners, the ratio of amplitudes for each frequency component was calculated. This ratio, Ratio [k], directly compares the amplitude detected by the analog scanner ( A A k ) with that detected by the digital scanner ( A D k ) at the same frequency f k using the Equation (5):
R a t i o k = A A k A D   [ k ]
The analysis of noise components and spectral distribution was performed using standard statistical functions (e.g., STDEV.P, AVERAGE, IMABS) and FFT analysis in Microsoft Excel. While more specialized tools like MATLAB or Python are available for high-precision spectral analysis, the choice of Excel was justified by its ease of direct integration with the experimental data and its capacity to efficiently provide the standard deviations and signal amplitudes required for the metrological characterization of the dynamic regime. These instruments allowed an efficient estimation of standard deviations and signal amplitudes, based on which the Type B uncertainty associated with noise was quantified.

2.4.5. Two-Sample t-Test

The present study adopted a rigorous statistical approach to validate the observed differences between the two systems. To statistically validate the observed differences between the two systems, a two-sample t-test was performed on the data from the dynamic tests. This test was used to determine if the mean values and the noise levels between the analog and digital systems were statistically different. A significance level of α = 0.05 was adopted, with a p-value below this threshold indicating a statistically significant difference between the two systems.

2.5. Data Analysis Methods for Static Regime

To evaluate the fundamental metrological performance of the pressure scanners and to estimate the measurement uncertainty, data from the static calibration were subjected to detailed analysis. The calibration data were used to determine key metrological characteristics, such as hysteresis and repeatability, and to establish a comprehensive uncertainty budget in accordance with the GUM guidelines.

2.5.1. Metrological Characteristics

Based on the three ascending and descending measurement cycles in the ±200 mbar range, the following characteristics were determined for each channel:
Hysteresis: The maximum difference between readings obtained at the same pressure, but reached once during the ascending cycle and once during the descending cycle.
Repeatability: The ability of the instrument to provide the same readings for the same input pressure, under the same conditions. It was evaluated by calculating the standard deviation of repeated readings at identical pressure points during the three calibration cycles.

2.5.2. Measurement Uncertainty Calculation

The measurement uncertainty for each pressure scanner was evaluated according to the principles of the Measurement Uncertainty Expression (GUM) guidelines. These can be divided into two types:
Type A uncertainty: is evaluated by statistical analysis of a series of repeated observations and reflects the random variation in the measurement process.
Type B uncertainty: is evaluated by means other than statistical analysis of immediate repetitions (e.g., manufacturer specifications, calibration certificates, experience, reasoning based on assumed probability distributions).
The standard combined uncertainty ( u c ) was calculated as the square root of the sum of the squares of the standard uncertainty components, considered independent.
u c = u r e p 2 + u h 2 + u s t 2 + u d 2 + u n 2 + u s c 2 + u a 2 + u r e 2 + u t 2
The extended uncertainty (U), Equation (7), was obtained by multiplying the standard combined uncertainty, Equation (6), with a coverage factor (k), usually k = 2 for a confidence level of about 95%.
U = k · u c
The uncertainty components were evaluated as follows:
Uncertainty due to repeatability ( u r e p ): This is the Type A uncertainty determined by the statistical analysis of three repeated measurements at each pressure point. For each pressure scanner, three successive cycles of measurements were performed, at the calibrated pressure points: −200, −100, −20, 0, 20, 100 and 200 mbar, in both an ascending and descending mode. The average values and standard deviations were calculated for each regime separately. ( n c = 3 for ascending mode, n d = 3 for descending mode).
For each pressure point i, the average of the values measured in the increasing mode were calculated separately ( P ¯ i , c ) and in the decreasing mode ( P ¯ i , d ) as well as the standard deviation associated with each regime ( s c and s d ), calculated with Equations (8) and (9).
s c = 1 n c 1 j = 1 n c P i j , c P ¯ i , c 2
s d = 1 n d 1 j = 1 n d P i j , c P ¯ i , d 2  
where P i j , c and P i j , d are the individual readings, also   P ¯ i , c and   P ¯ i , d are the averages for point i and the corresponding cycle.
The standard uncertainties of Type A, represented by the standard uncertainty of the mean, are determined with Equation (10) for the ascending cycle and with the Equation (11) for the descending cycle.
u A , c = s c n c
u A , d = s d n d
Considering that the best estimate of the measured value at a given point, P m a s is the arithmetic average of the averages obtained on the ascending and descending cycle:
P m a s = P ¯ i , c + P ¯ i , d 2
The standard uncertainty associated with this estimate was then determined by applying the law of uncertainty propagation. The standard uncertainty of repeatability for each pressure point is calculated with Equation (13):
u r e p = u A , c 2 + u A , d 2 4 = 1 2 u A , c 2 + u A , d 2
Uncertainty due to residual hysteresis ( u h ): The uncertainty associated with the hysteresis phenomenon was evaluated separately as a Type B component. For each nominal pressure point ( P i ), the average values of the indications of the instrument have been determined both on the ascending cycle ( x ¯ c , i ), as well as on the descending cycle ( x ¯ d , i ). Hysteresis at each measurement point has been defined with the equation:
H i = x ¯ d , i x ¯ c , i
The standard uncertainty of Type B was calculated with the equation:
u h = H i 12
This approach is in line with the GUM recommendations for the assessment of Type B uncertainty in the absence of a known distribution and provides an estimate of the influence of hysteresis on the measurement result.
Reference standard uncertainty ( u s t ): The standard uncertainty of the Fluke pressure standard, obtained from the data specified by its calibration certificate, is the Type B component.
According to the certificate, the uncertainty of the standard is expressed as an extended uncertainty ( U c e r t i f i c a t e ), a specified confidence level (95%) and a coverage factor ( k c e r t i f i c a t e ). Since the probability distribution of the uncertainty of the standard is considered to be normal, the standard uncertainty ( u s t ) was calculated according to the equation:
u s t   = U c e r t i f i c a t e k c e r t i f i c a t e
Uncertainty due to drift ( u d ): It is a Type B component, which reflects the variation in the instrument’s indications over time between two successive calibrations. Its variations are usually based on the analysis of historical data from previous calibration certificates. It is defined by the equation:
u d = U C E n e w U C E o l d k 3
where U C E n e w and U C E o l d represents the extended uncertainties in the current and previous calibration certificates, and k is the coverage factor. This approach assumes a rectangular distribution for the residual drift in the range of variation.
Noise uncertainty ( u n ): Standard noise uncertainty was evaluated as a Type B component. This was estimated by the standard deviation analysis ( σ n ) of the pressure signal, obtained from the 324 consecutive recordings in dynamic mode. This approach reflects the inherent fluctuations and instrument’s readings under operational conditions, a component distinct from repeatability assessed under controlled static conditions. Since the probability distribution of this noise is not known with certainty, and given its dynamically fluctuating nature, it was considered a rectangular distribution. In this context, the standard deviation ( σ n ) was used as an estimate of the semi-width of the noise variation range. Thus, the standard uncertainty was calculated according to the principles (GUM) for Type B assessments, using the equation:
u n = σ 3
Uncertainty due to the accuracy of pressure scanners ( u s c ): This component of uncertainty comes from the accuracy limitations of each pressure scanner as specified by the manufacturer. It reflects the maximum allowable deviations of the pressure scanner from the ideal value, including errors such as nonlinearity, gain and offset uncertainty (as long as they are not quantified separately). Since no further information is available on the distribution of these precision errors for the specified domain, a rectangular distribution was considered. Standard uncertainty of Type B ( u s c ) is calculated with the equation:
u s c = a 3
The half-width of the interval in which the precision error is assumed to be uniformly distributed is calculated with the following equation:
a = a c c u r a c y % 100 × F S     m b a r
Uncertainty due to the PR4114 signal adapter ( u a ): The signal adapter used exclusively in the ZOC17 analog system. The uncertainty due to it has been evaluated as a Type B component. This adapter works as a voltage-to-current (V/mA) signal converter, converting the voltage output signal of the scanner into a standardized current signal (4−20 mA) for the PLC input.
The manufacturer’s specified accuracy for the adapter is ±0.1% of its full output signal measurement range in current. The current output range of the adapter is 16 mA (20 mA − 4 mA). Therefore, the maximum error in current introduced by the adapter, according to the specification, is 0.1% of 16 mA, i.e., 0.016 mA.
To express this error in units of pressure, the conversion factor of the system from current to pressure was used. Since the pressure range of ±200 mbar (a range of 400 mbar) is covered by the current range of 16 mA, the conversion factor is 400 mbar/16 mA = 25 mbar/mA.
The maximum permissible error of the adapter, converted to pressure units, is 0.016 mA × 25 mbar/mA = 0.4 mbar. Assuming a rectangular distribution for this error, where the maximum calculated error (0.4 mbar) represents the half-width of the range, the standard Type B uncertainty associated with the signal adapter is calculated with the equation:
u a = ε a d 3
Uncertainty due to the resolution of the operator panel ( u r e ): The uncertainty associated with the digital resolution of pressure scanner readings. It is especially important for very precise measurements, when the resolution is comparable to the signal variation. Assuming a rectangular distribution of the error in the defined range of resolution (least significant bit, LSB), the standard uncertainty is calculated according to the equation:
u r e = L S B 12
Uncertainty due to variations in ambient temperature ( u t ): The contribution of ambient temperature variations to the measurement uncertainty was evaluated as a Type B component. The experiments were carried out in a temperature range of 23.5–23.9 °C, resulting in a maximum temperature variation ( T ) of 0.4 °C.
Both multi-channel systems benefit from internal temperature compensation in the range 0–50 °C.
For the MPS4264 digital scanner, the temperature effect is considered to be included in the overall accuracy specification of the instrument, thanks to its advanced internal compensation, which includes “dynamic zero correction” and a pressure-temperature matrix. Therefore, a separate component of uncertainty due to temperature is not required for the MPS4264.
In the case of the ZOC17 analog scanner, according to the technical specifications, the residual temperature sensitivity is 0.009% FS/°C for zero and 0.007% FS/°C for span.
Considering a maximum temperature variation during the measurement of 0.4 °C and a complete measuring range (full scale, FS) of 200 mbar, the individual errors were calculated with the equations:
Zero   error :   ε 0 = ( S e n s i b i l i t a t e a   z e r o   [ % ] / 100 ) × F S × T
Span   error :     ε s p = ( S e n s i b i l i t a t e a   s p a n   [ % ] / 100 ) × F S × T
The maximum total error due to temperature is calculated with the Equation (25), assuming the worst-case scenario:
ε t e m p = ε 0 + ε s p a n
Assuming a rectangular distribution for this total maximum error, the standard uncertainty of Type B associated with ambient temperature was calculated with the Equation:
u t = ε t e m p 3
Calibration in static mode is performed in the same measurement chain as in dynamic mode; this component reflects the noise of the instrument (including that from the A/D conversion of the analog pressure scanner).
Each uncertainty component was evaluated individually, and their contribution to the standard combined uncertainty was calculated for each individual pressure scanner.

3. Results

Based on the methods presented above, this section presents and interprets the results obtained from both dynamic and static tests.

3.1. Results in Dynamic Regime

This section presents and interprets the results obtained from dynamic tests, aimed to comparing the behavior of the two pressure scanners under real operating conditions. The analysis focused on signal variation, spectral content, and overall measurement stability. The statistical significance of the observed differences was validated using a two-sample t-test, confirming a high degree of confidence in the performance disparities (p < 0.05), as shown in Table 1.
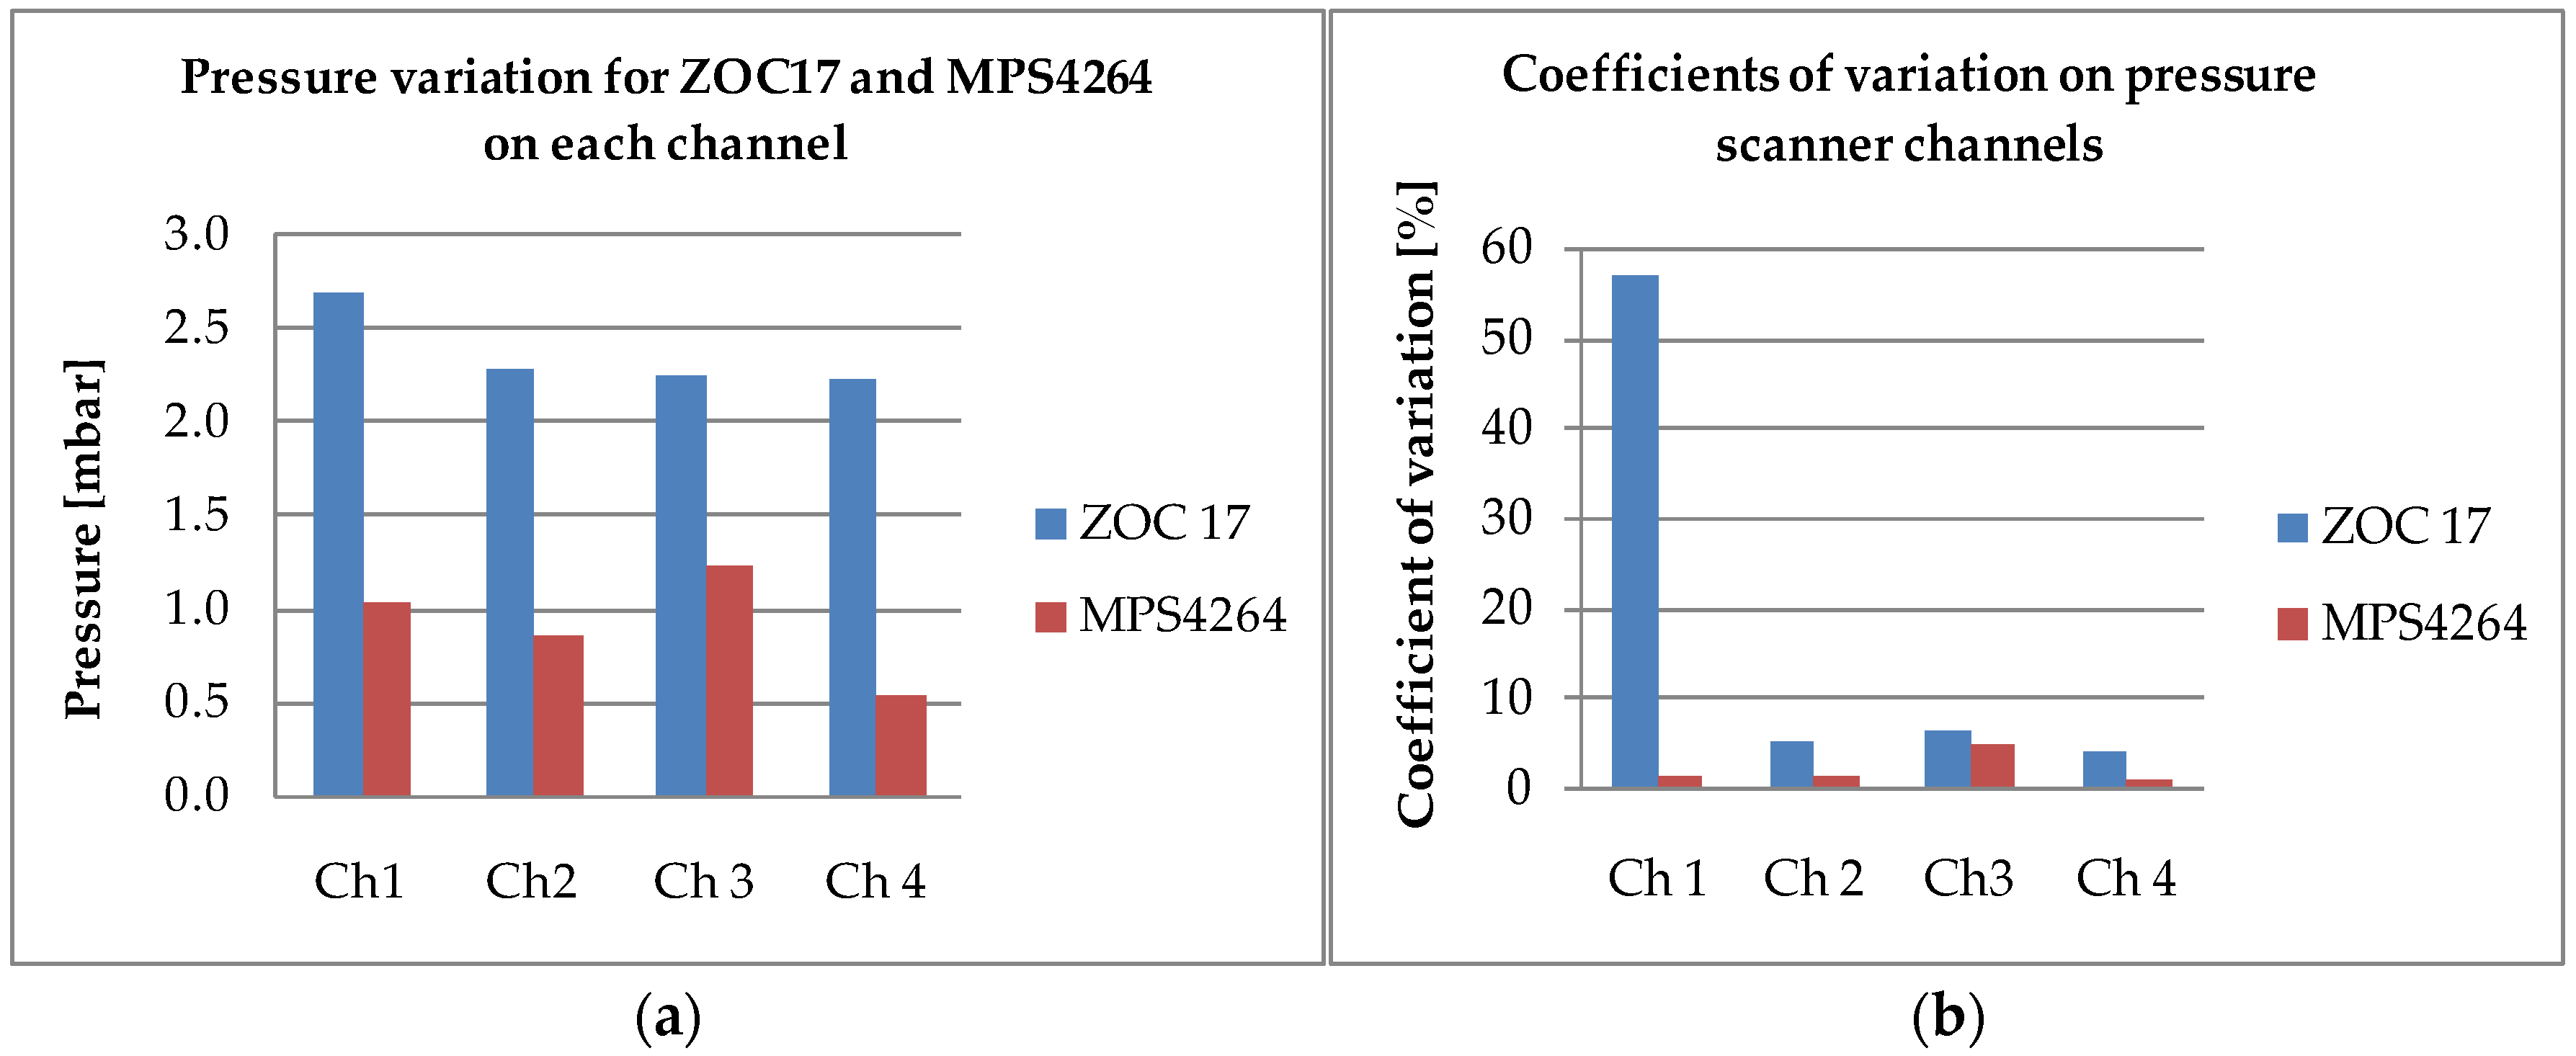
The first indicators evaluated were the maximum pressure variation and the coefficient of variation (CV) for each active channel. This maximum pressure variation was calculated as the difference between the maximum and minimum values of the 324 records available for each channel.
The results, as presented in Figure 3a,b, show a significant difference between the two systems: the amplitude of fluctuations is about three times greater in the case of the ZOC17 analog system, compared to the MPS4264 digital system.
The ZOC17 analog pressure scanner demonstrates significantly greater relative variation, with CV values reaching up to 57% for Channel 1. Even for the other channels of the analog scanner, CVs of over 4% suggest considerable variability of the signal in dynamic mode.
The MPS4264 digital pressure scanner shows much smaller values, ranging from 1.25% to 4.88%.
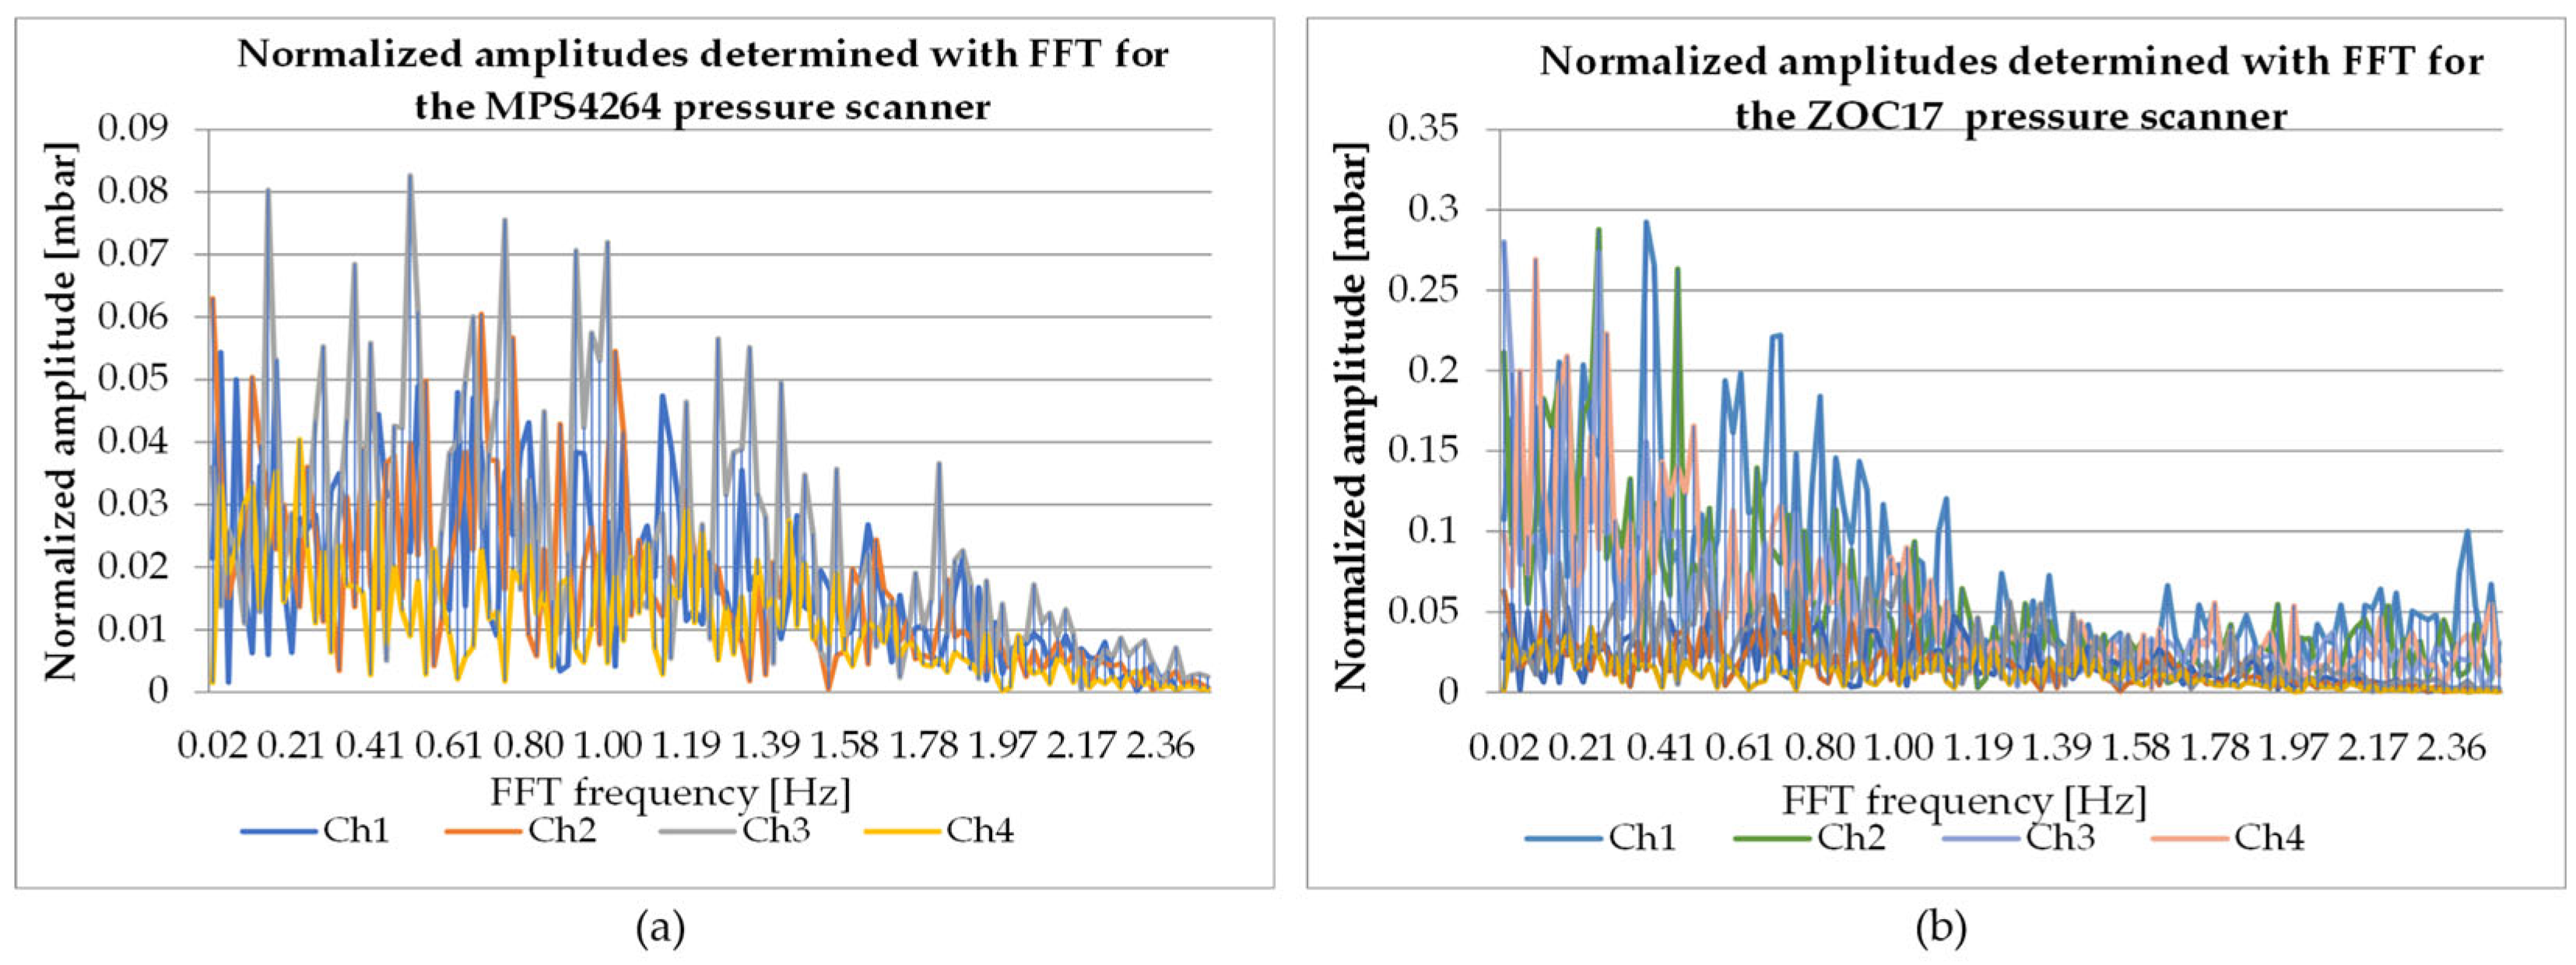
The dynamic behavior of the two pressure scanners is further evidenced by the FFT analysis, which reveals the frequency components of the pressure signals. The resulting amplitude spectra, illustrated in Figure 4a (for the MPS4264) and Figure 4b (for the ZOC17), show clear differences. The FFT transform applied to N = 256 points generates N spectral components. For real signals, the spectrum is symmetrical, and the relevant information is found in the first half of it, from 0 Hz to the Nyquist frequency ( f s 2 ).
The resulting amplitude spectrum was used for the evaluation of frequency components. To better visualize the fluctuations and noise components of interest, the value corresponding to the frequency of 0 Hz (the DC component) was excluded from the analysis.
It is important to note that any frequency of the original signal above the Nyquist frequency would have led to aliasing, manifesting as spectral artifacts or appearing incorrectly in the spectrum as a lower frequency.
The ZOC17 analog system displayed significantly higher spectral peaks, indicating an increased level of noise and dynamic fluctuations, with values up to 0.30 mbar for certain low frequency components (below 0.5 Hz). In comparison, the MPS4264 digital system had a much cleaner frequency spectrum with lower-amplitude peaks, the maximum amplitudes below 0.08 mbar.
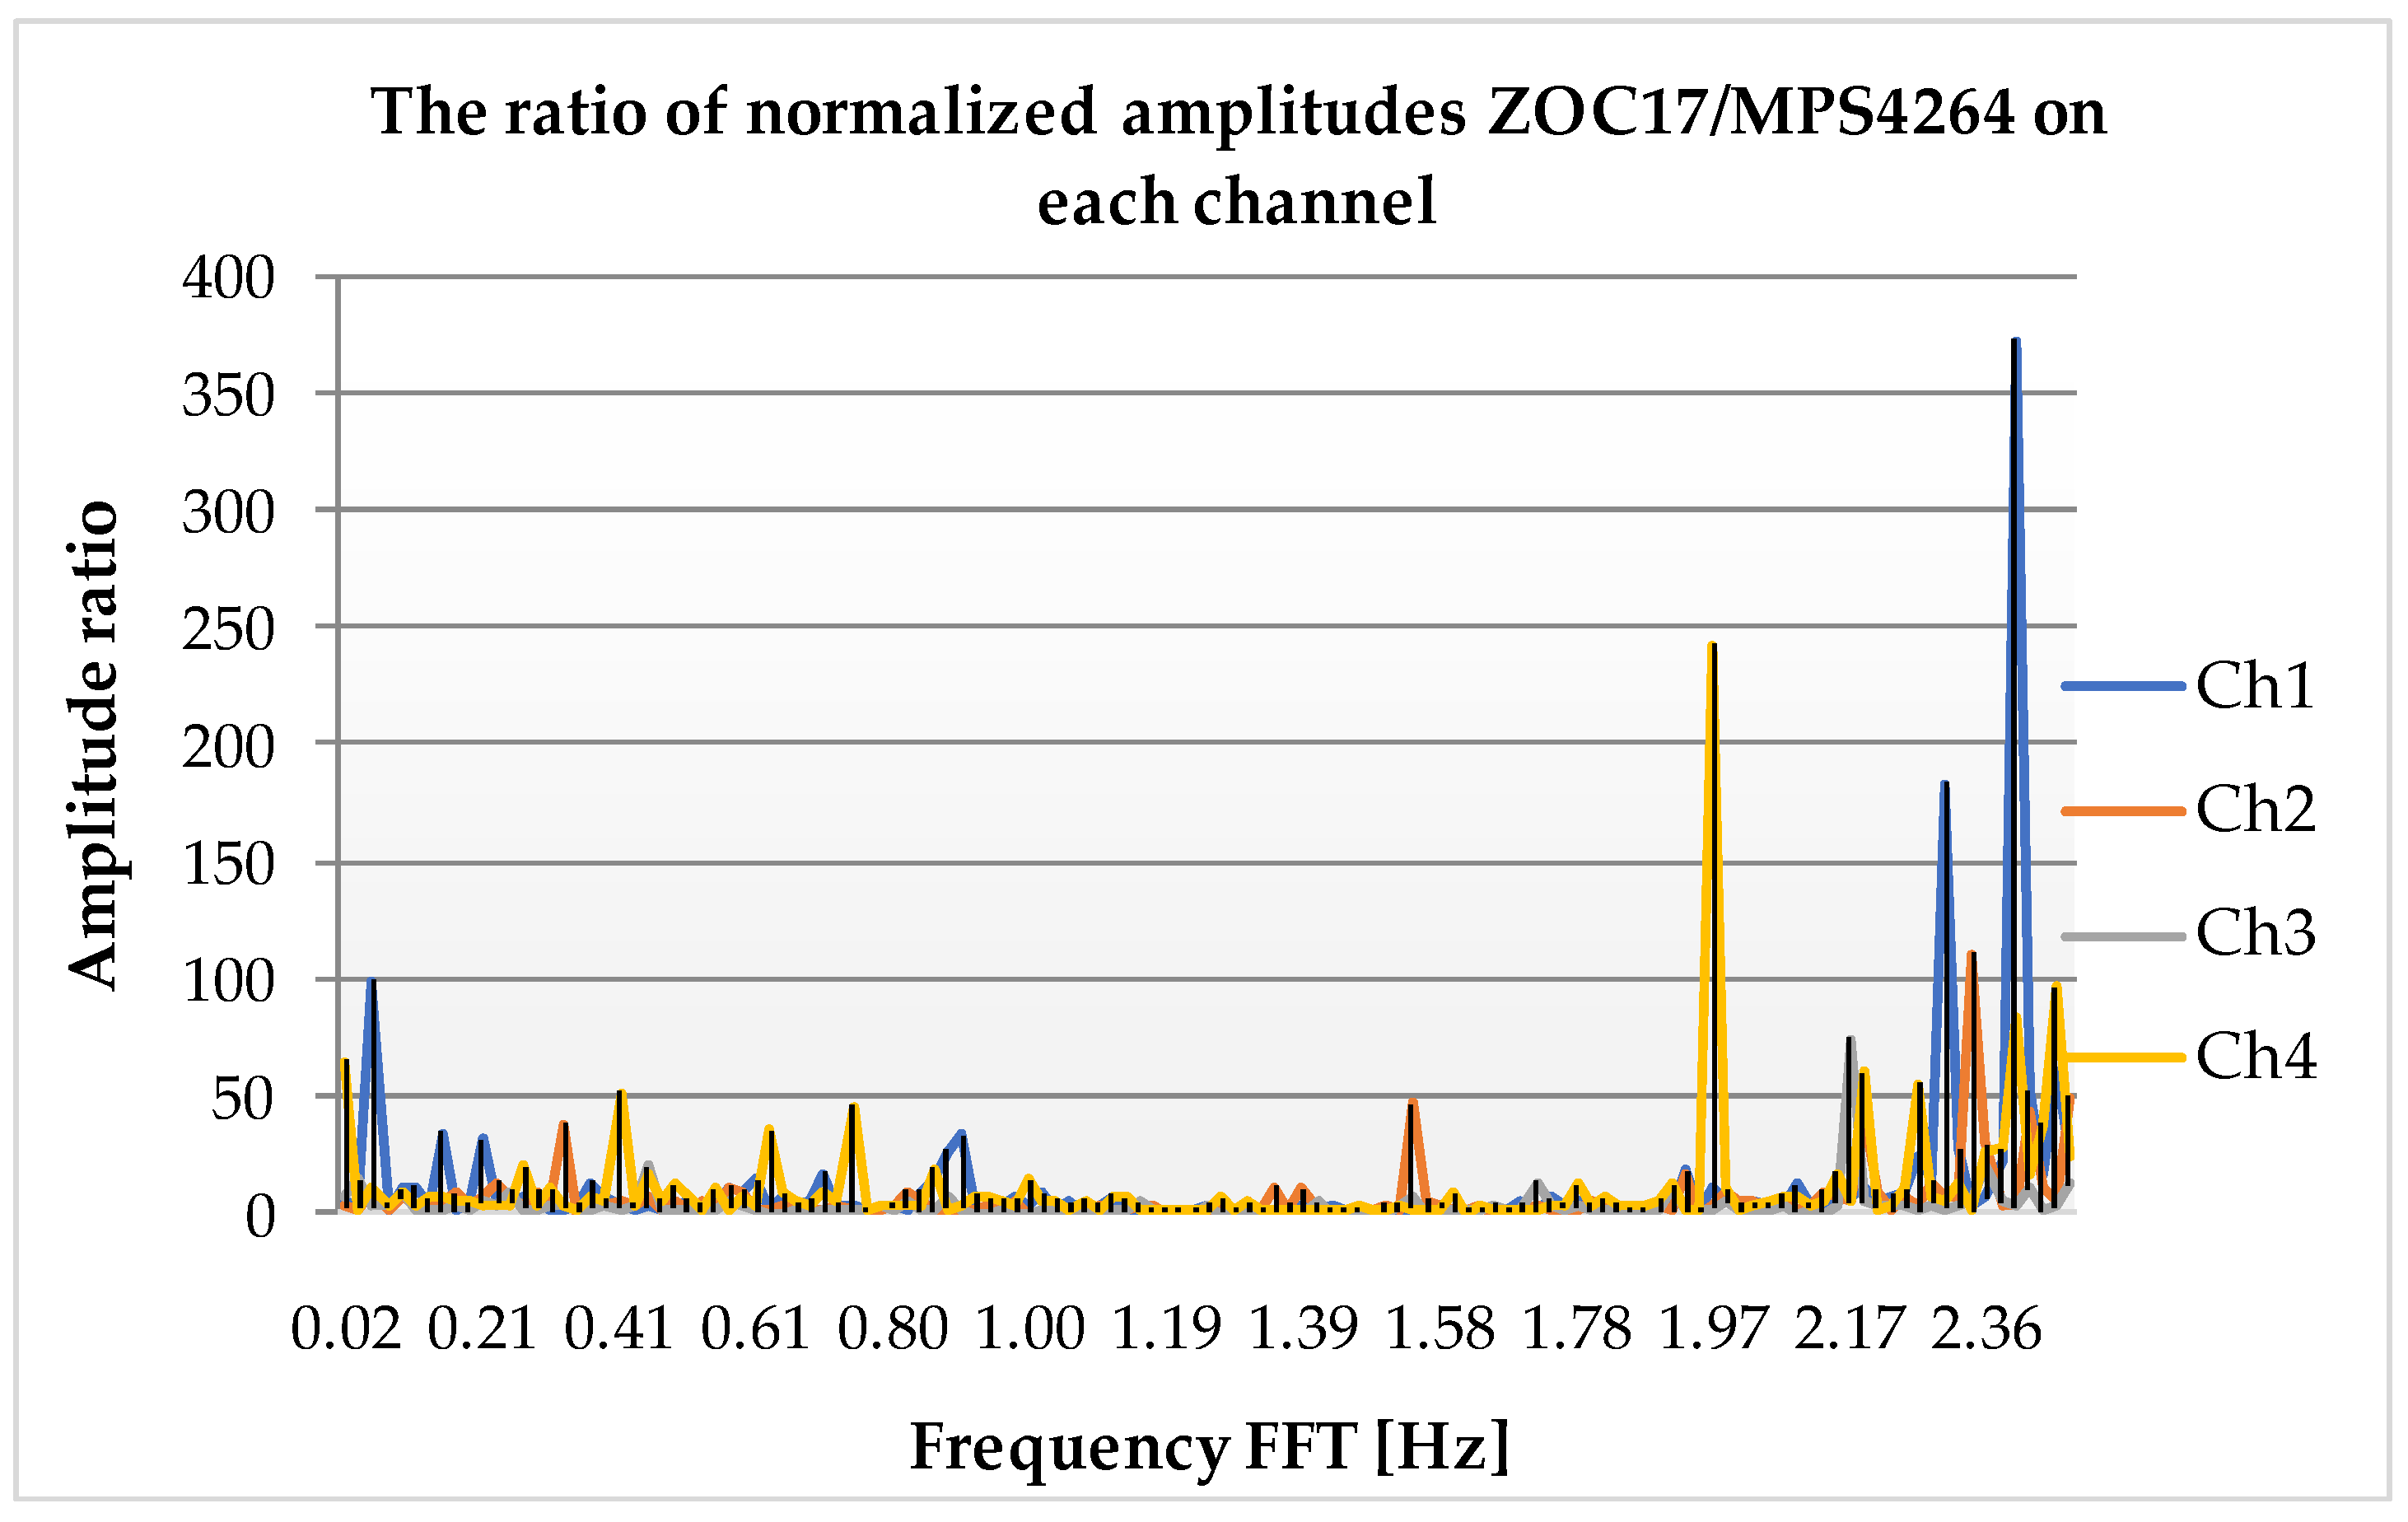
The ratio of normalized amplitudes (ZOC17/MPS4264), presented in Figure 5, confirms that the analog system exhibits much greater fluctuations due to noise amplification, with a maximum ratio of 372 at 2.4 Hz, indicating a substantial noise amplification. Values significantly higher than 1 (e.g., 96 or 372, as observed in some cases) at certain frequencies, especially at high frequencies, are evidence of the increased contribution of electronic noise and quantization in the analog system.
The results of the two-sample t-test, presented in Table 1, demonstrate that the difference between the mean pressure measurements for each channel pair is statistically significant (p < 0.05). The extremely low p-values (often approaching zero) indicate a high degree of confidence in the observed performance disparities between the two systems.

3.2. Results in Static Regime

In the previous Section 2.3 and Section 2.5, the methodology for evaluating the performance of static pressure scanners has been detailed, including the determination of repeatability, hysteresis and calculation of measurement uncertainty according to GUM. This section presents the results of the static calibration tests, focusing on the evaluation of each uncertainty component (Type A and Type B) and their contribution to the total measurement uncertainty.

3.2.1. Evaluation of Uncertainty Components

The standard Type A uncertainty associated with repeatability ( u r e p ) was calculated for each calibrated pressure point and for each pressure scanner (ZOC17 and MPS4264), according to the described methodology.
As shown in Table 2 and Table 3, ( u r e p ) for the ZOC17 ranged from 0.016 mbar to 0.05 mbar, while for the MPS4264, it ranged from 0.014 mbar to 0.03 mbar, indicating lower random variations for the digital system.
Type B uncertainties were evaluated from various sources, each contributing differently to the total uncertainty budget. These include:
  • Hysteresis was evaluated for each measurement point. For ZOC17, (Channel 3), at the pressure point of (−20 mbar), the difference Hi was 0.03 mbar. Thus, the standard Type B uncertainty associated with hysteresis at this point was calculated according to the Equation (15), u h = 0.01 mbar.
  • Pressure standard: The uncertainty of the Fluke pressure standard, with an extended uncertainty of 0.0003 bar (k = 2), was calculated with Equation (16): u s t = 0.15 mbar
  • Drift: The contribution from drift was considered negligible, U CEnew = U CEold = 0.0003 bar.
  • Noise: The Type B uncertainty associated with noise showed significant differences, with the ZOC17 system having a standard noise deviation of up to 0.523 mbar, while the MPS4264’s deviation was significantly lower, ranging from 0.113 mbar to 0.257 mbar. This was calculated with Equation (18).
  • Pressure scanner accuracy: Based on manufacturer specifications, the Type B uncertainty was evaluated at 0.12 mbar for the ZOC17 and 0.007 mbar for the MPS4264. Was calculated with Equation (19).
  • Signal adapter: For the ZOC17 system, a Type B uncertainty of 0.23 mbar, calculated with Equation (21), was added due to the PR4114 signal adapter.
  • Resolution of the operator panel: The resolution of the display system, LSB, is 0.1 mbar. The standard Type B uncertainty associated with resolution was calculated with the Equation (22), u r e = 0.03 mbar.
  • Temperature: For the ZOC17, the Type B uncertainty associated with temperature variations was quantified based on the residual temperature sensitivity and the maximum variation observed by 0.4 °C. u t was calculated with the Equation (26), u t = 0.00739 mbar. Also, we calculated for the worst-case thermal effect by considering the full compensated temperature range of the scanner (0 °C to 50 °C). Assuming a maximum temperature variation ( T ) of 50 °C, the maximum combined error due to temperature was calculated with Equation (25) as 1.6 mbar. Result u t = 0.9 mbar. Even under significant thermal variations, the scanner’s performance remains within its specified limits.

3.2.2. Combined Uncertainty and Conclusions

A complete uncertainty budget for each channel was compiled according to GUM guidelines. The uncertainty budget for the ZOC17 scanner at [−20 mbar], developed according to the GUM guidelines and with the sources detailed in Section 2.5.2, is presented in Table 2 (Channel 1) and Table 3 (Channel 3).
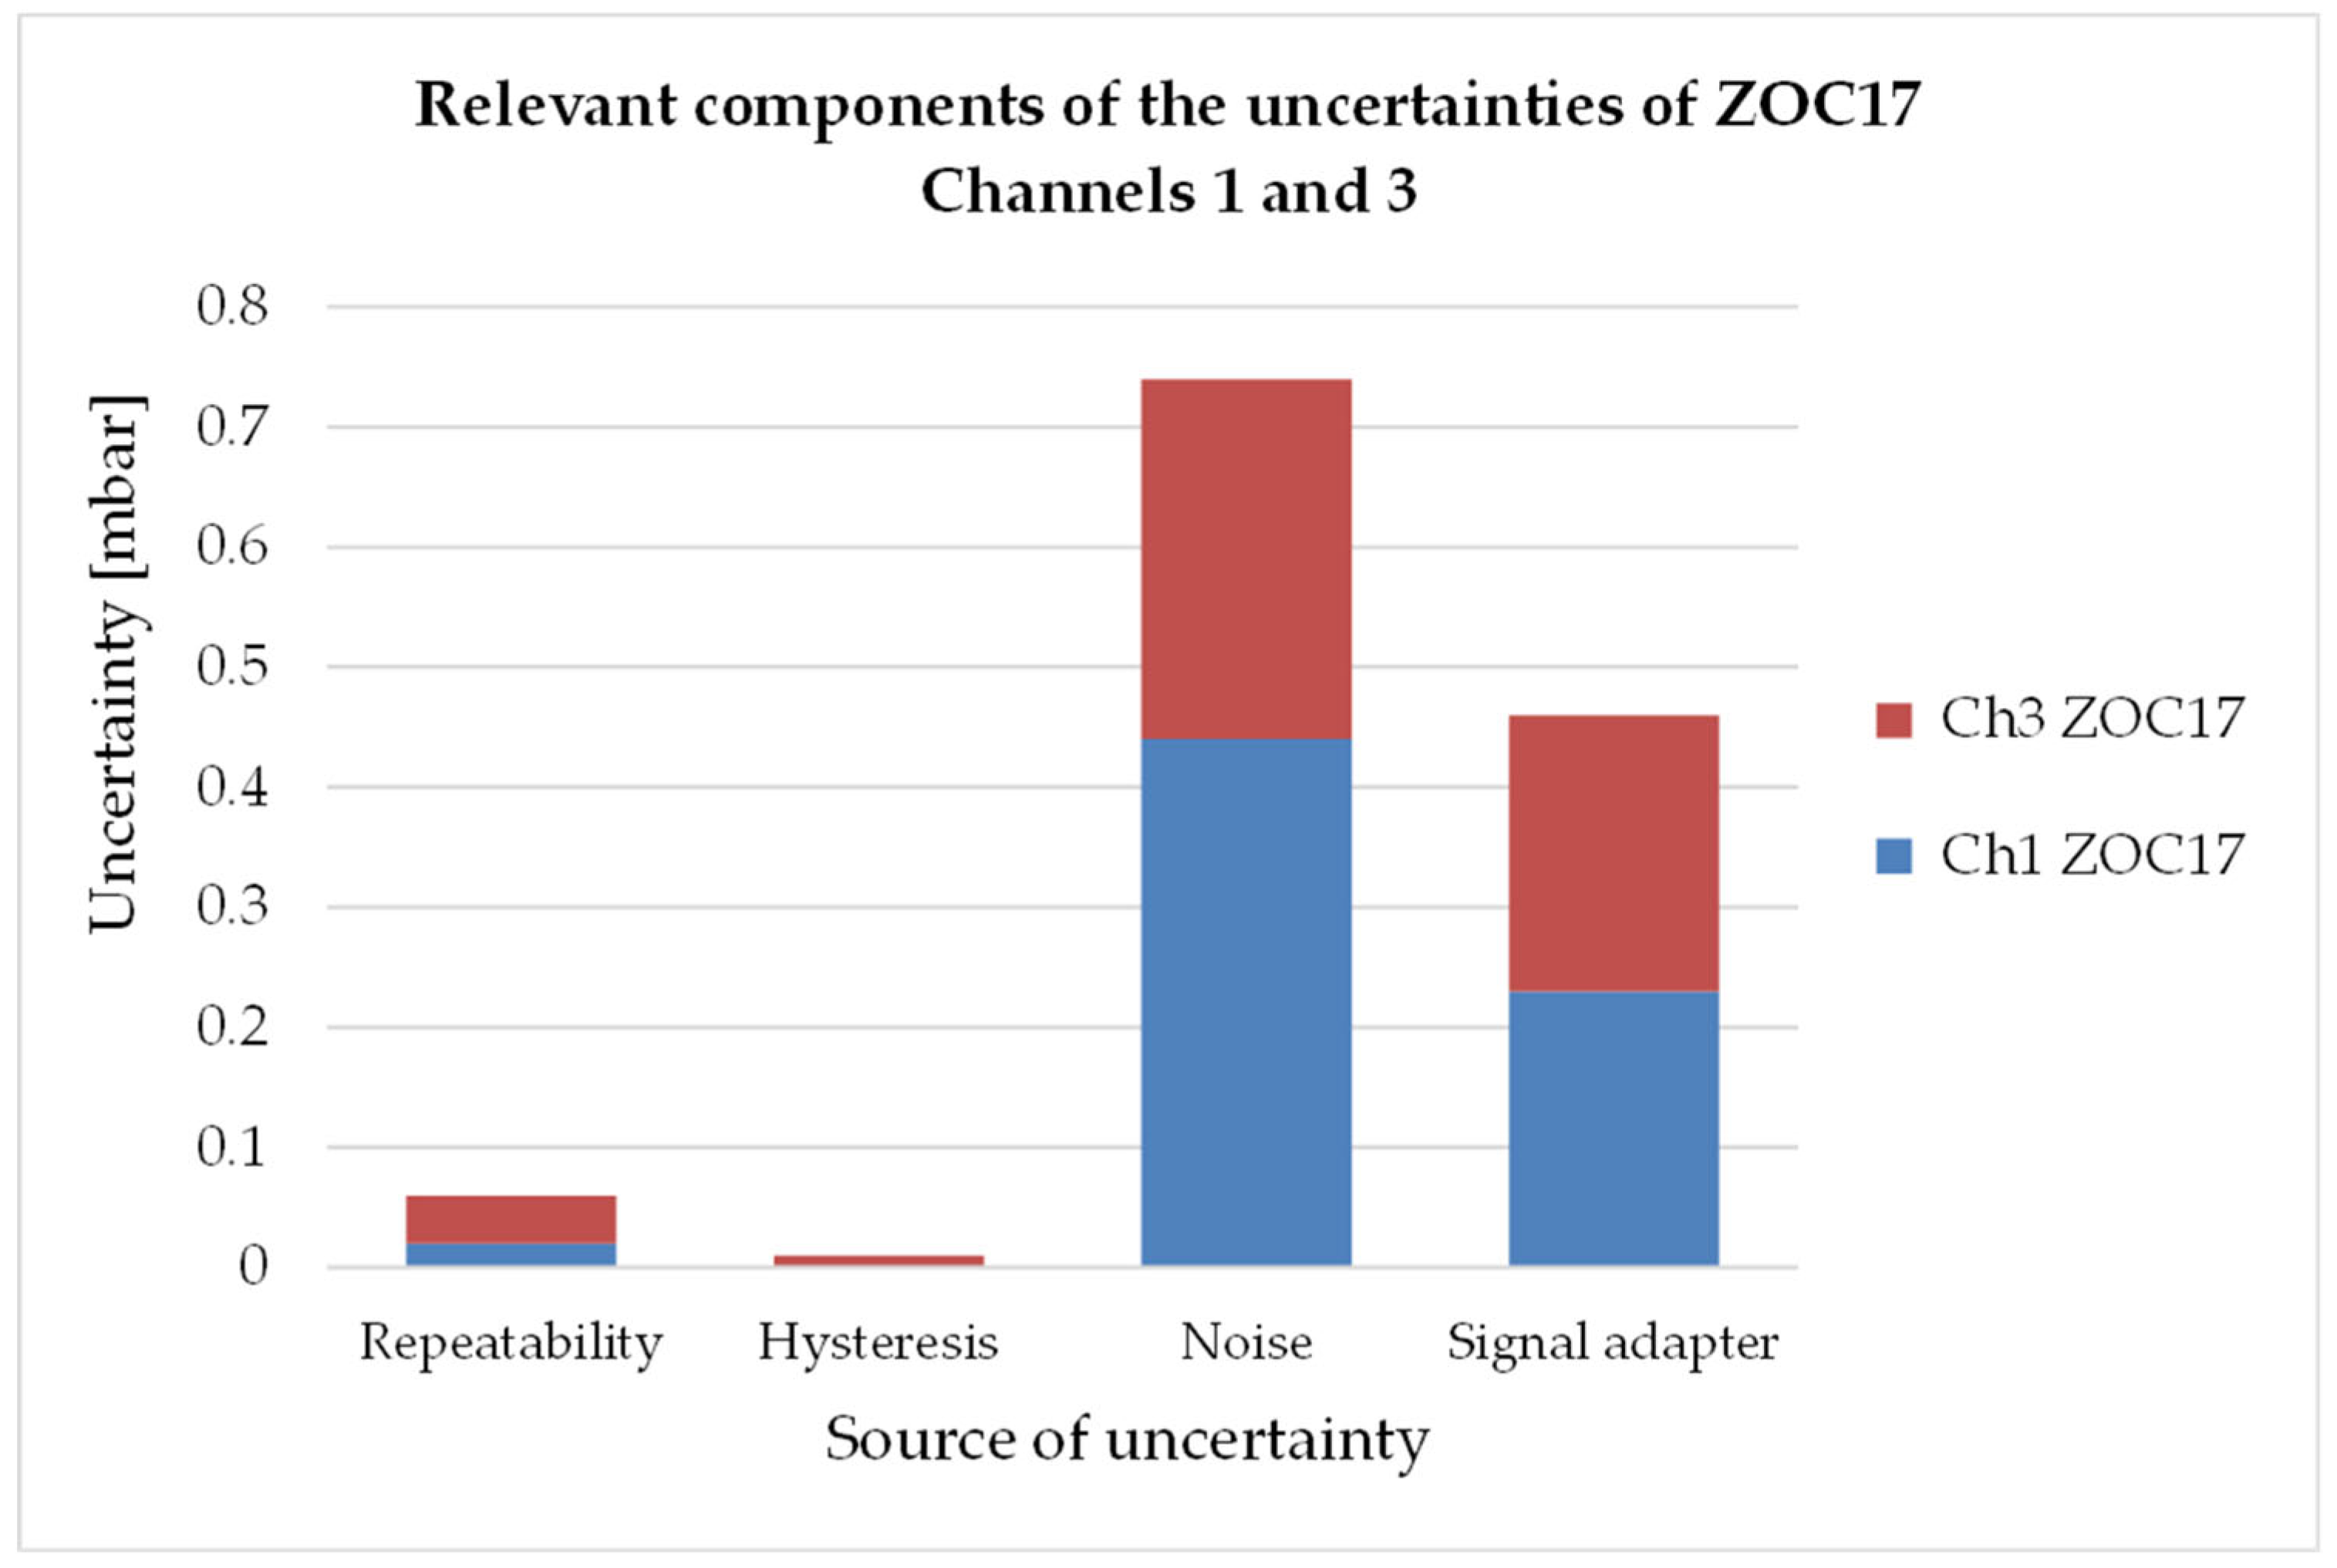
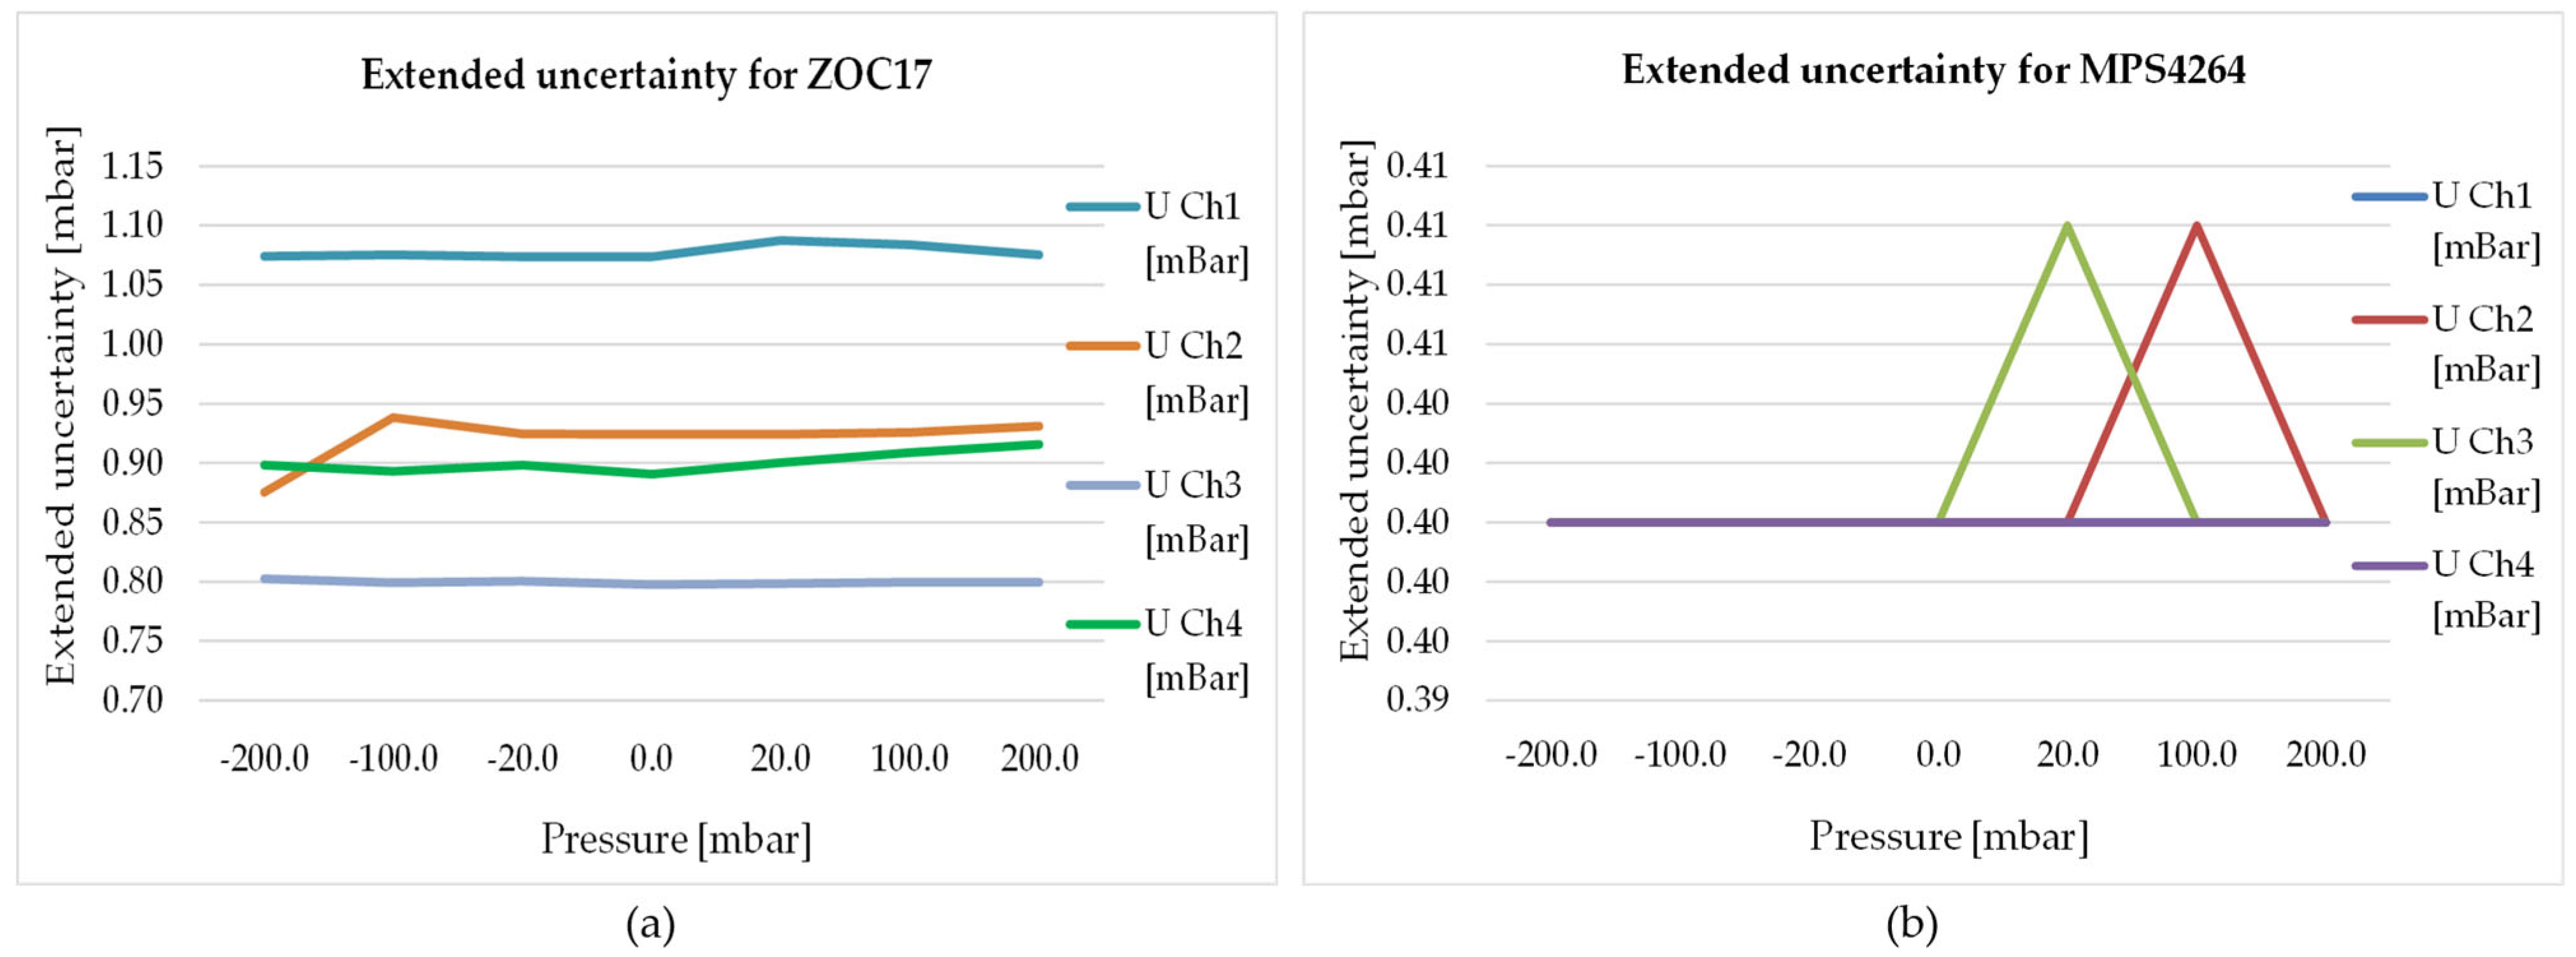
As shown in Figure 6, the main contribution to the ZOC17 system’s uncertainty comes from noise and the signal adapter. The detailed results in Table 4 and Table 5, and the graphical illustrations in Figure 7a,b, show that the expanded uncertainty for the ZOC17 can exceed 1 mbar, whereas for the MPS4264, it consistently remains below 0.4 mbar. This major difference confirms the superior metrological performance of the MPS4264 digital scanner, which is attributed to its advanced design with internal compensation and integrated components.
This component shall be included in the combined standard uncertainty budget for each measurement point of the ZOC17 analog channels.
In Figure 6, a graph is presented for the ZOC17 system, comparing Channels 1 and 3, for which full uncertainty budgets have been compiled. The contribution of repeatability, hysteresis, noise and adapter were represented separately. They were selected because they cover the most relevant sources of uncertainty in the analog measurement chain. Figure 6 shows that the uncertainty due to noise varies depending on the channel.
The most significant contributor to the total uncertainty of the ZOC17 is output noise, with a contribution of around 0.44 mbar. This high noise level is due to low-frequency components, as confirmed by FFT analysis. In contrast, the MPS4264 digital system shows a considerably lower noise contribution, ranging from 0.065 to 0.15 mbar.
Other Type B uncertainty components that differ between the two systems are: Scanner accuracy, the ZOC17 has a higher uncertainty of 0.12 mbar, while the MPS4264’s is much lower at 0.007 mbar and signal adapter, the ZOC17 introduces an additional 0.23 mbar uncertainty from its signal adapter, a component absent from the digital system.
Due to these factors, the total expanded uncertainty for the ZOC17 system is significantly higher, with a maximum value of 1.07 mbar. The overall result clearly demonstrates the superior performance of the digital system in terms of reduced uncertainty.

4. Discussion

This section interprets the results obtained from both dynamic and static tests, focusing on comparing the behavior of the two pressure scanners. The analysis reveals fundamental differences in their performance, with the dynamic and uncertainty evaluations supporting the same core conclusion.

4.1. Dynamic Behavior and Spectral Analysis

The analysis of maximum pressure variation and the coefficient of variation (CV) demonstrate the superior stability of the MPS4264 digital system. As shown in Figure 3a, the amplitude of fluctuations is approximately three times greater for the ZOC17 analog system, confirming the significant influence of noise. This is further supported by the CV values (Figure 3b), where the high CV of the ZOC17 (reaching up to 57% for Channel 1 and over 4% for other channels) indicates a considerable level of noise or instability in relation to the average amplitude of the measured pressure, suggesting an increased uncertainty in dynamic operation. In contrast, the MPS4264 digital scanner demonstrates superior signal stability and a much better ability to reproduce a constant or repetitive signal with a relatively negligible noise level, maintains CVs between 1.25% and 4.88%. This order of magnitude difference between the two technologies validates the superior efficiency of integrated digitization and signal processing in noise reduction. Thus, the hypothesis is confirmed that analog-to-digital conversion noise and other sources of electronic noise have a major impact on the fidelity of analog multichannel system measurements, especially under fast acquisition conditions, is confirmed.
A high CV directly translates into higher measurement uncertainty and reduced signal fidelity. This implies that analog measurements, made under dynamic conditions or at a constant speed, are much less reliable for applications requiring high accuracy and stability, highlighting the advantages of digital systems for advanced turbo engine testing.
The distinct behavior of the two systems is further evidenced by a comparative analysis of their frequency spectra (Figure 4a,b). The uniform distribution and low values of the normalized amplitudes observed at the MPS4264 (below 0.08 mbar) suggest good acquisition stability and low background noise. The high consistency of signals between channels also confirms the advantages of the integrated digital architecture. On the other hand, the ZOC17 exhibits significantly higher amplitudes (up to 0.30 mbar) and a more inhomogeneous spectrum, indicating the influence of analog amplification and sensitivity to external interference. The normalized amplitude ratio (Figure 5) accurately shows these performance differences, with high ratios (e.g., up to 372 at 2.4 Hz) confirming the high noise amplification of the analog system.
Overall, the analysis in the frequency range revealed significant differences between the two types of scanners. The MPS4264 system, with integrated digital conversion, has proven to be superior in terms of signal stability, spectral uniformity between channels and low noise levels. In contrast, the ZOC17 scanner showed a more chaotic and disturbance-prone response, visibly influenced by analog amplification and additional stages of the procurement chain, which introduce noise and uncertainty. These findings underscore the importance of digital architecture for achieving reliable and high-precision measurements in demanding dynamic environments such as turbine engine testing.

4.2. Uncertainty Analysis and the Advantages of Digital Architecture

The detailed analysis of the uncertainty components confirms the fundamental differences in performance between the two systems. The significantly reduced noise level recorded at MPS4264 (0.065–0.15 mbar) is attributed to the superior stability of the integrated analog-to-digital (A/D) conversion and advanced digital signal processing. This major difference reflects the increased sensitivity of the analog measurement chain (ZOC17) to external interference, power variations or instabilities of the amplifier and signal adapter, compared to which the integrated digital architecture of the system MPS4264 clearly superior resistance. The drastic difference in scanner accuracy (0.12 mbar for ZOC17 vs. 0.007 mbar for MPS4264), along with the 0.23 mbar uncertainty component from the ZOC17’s signal adapter, further underscores the inherent advantages of the digital system in controlling systematic errors.
The significant difference in extended uncertainty between the two systems (1.07 mbar for ZOC17 and a lower value for MPS4264, resulting from the combined calculation of its components) confirms the advantages of implementing a modern digital pressure scanner.
The maximum expanded uncertainty of 1.07 mbar at (–20 mbar), obtained on channel 1 of the ZOC17 analog pressure scanner, is metrologically justified. It does not indicate poor performance, but rather reflects the inherent characteristics of analog amplification and signal adaptation for PLC integration. On the contrary, this result has shown the relevance of adopting modern digital technologies to reduce such effects. To enable a comparative assessment of metrological performance, the relative uncertainty was also determined, defined as the ratio between the expanded uncertainty and the measured pressure value.

5. Conclusions

The paper highlighted the significant metrological differences between two generations of pressure scanners used for dynamic pressure measurements in applications specific to turbo engine testing.
The dynamic analysis, using the coefficient of variation and the Fast Fourier Transform (FFT), demonstrated a superior stability of the digital MPS4264 system. The maximum amplitude of fluctuations for the analog ZOC17 system was found to be approximately three times greater compared to the digital system. This is reflected in the relative uncertainty, which was 5.35% for the ZOC17 versus only 2.00% for the MPS4264 at a reference pressure of −20 mbar. The results confirm that the MPS4264 offers reduced measurement uncertainty, with an expanded total uncertainty consistently remaining below 0.4 mbar, whereas the ZOC17 system frequently exceeded 1 mbar. This marked difference is not coincidental, but a direct consequence of the technological architecture of each system. The MPS4264, with its integrated A/D conversion, eliminates the sources of error introduced by analog amplification and the external stages of the acquisition chain, which are characteristic of the ZOC17 system. This finding is not only a brand difference, but a validation of the superiority of modern digital architectures for high-precision dynamic measurements.
While this study was based on two specific devices, our findings strongly suggest a broader conclusion regarding the technological generations they represent. The significant performance disparities are not attributed to the specific brands but to the fundamental architectural differences: the ZOC17’s reliance on analog amplification and external A/D conversion introduces additional errors, while the MPS4264’s integrated digital architecture provides superior stability and noise rejection. This evidence supports the hypothesis that modern digital scanners inherently offer a substantial advantage for high-precision dynamic measurements.
A primary limitation of this study is its small sample size, which prevents definitive generalization of the results. To overcome this, future work should focus on a broader comparative analysis including a wider range of pressure scanners from both analog and digital generations. Further research could also explore the impact of a wider range of operating conditions, such as varying RPMs and temperature profiles, to better characterize the performance of these systems in more extreme environments.

Author Contributions

R.N. and C.-D.O. designed the study. R.S. and D.L. performed the data acquisition and processing. R.N. wrote the original draft. All authors have read and agreed to the published version of the manuscript.

Funding

This research received no external funding.

Institutional Review Board Statement

Not applicable.

Informed Consent Statement

Not applicable.

Data Availability Statement

The data presented in this study are available on request from the corresponding author. No publicly archived datasets are available.

Conflicts of Interest

The authors declare no conflicts of interest.

References

  1. Green, J.E. Uncertainty Analysis of the NASA Glenn 8 × 6 Supersonic Wind Tunnel; NASA Technical Report; National Aeronautics and Space Administration (NASA): Washington, DC, USA, 2016.
  2. Bhatnagar, L.; Paniagua, G.; Cuadrado, D.G.; Aye-Addo, P.A.N.; Sauca, A.C.; Lozano, F.; Bloxham, M. Uncertainty in High-Pressure Stator Performance Measurement in an Annular Cascade at Engine-Representative Reynolds and Mach. In Proceedings of the ASME Turbo Expo 2022: Turbomachinery Technical Conference and Exposition, Rotterdam, The Netherlands, 13–17 June 2022; ASME: New York, NY, USA, 2022; Volume 10, p. GTP-21-1362. [Google Scholar] [CrossRef]
  3. Xu, F.; Tan, Y.; Zhao, X.; Zhang, Z. Test Study of Performance of Electronic Scanivalve System. In Proceedings of the 2009 International Conference on Electronic Measurement & Instruments, Beijing, China, 16–19 August 2009; IEEE Xplore: Beijing, China, 2009; pp. 1–4. [Google Scholar] [CrossRef]
  4. Zhang, W.; Chen, Y.; Li, Y. Research on Multi-Channel Dynamic Pressure Measurement System Based on MEMS Sensors. In Proceedings of the 2017 IEEE International Conference on Mechatronics and Automation (ICMA), Takamatsu, Japan, 6–9 August 2017; IEEE: Piscataway, NJ, USA, 2017; pp. 106–110. [Google Scholar] [CrossRef]
  5. Pemberton, R. An Overview of Dynamic Pressure Measurement Considerations; Scanivalve Corp.: Liberty Lake, WA, USA, 2010. [Google Scholar]
  6. Scanivalve DTS3250; Uncertainty Analysis. Scanivalve Corp.: Liberty Lake, WA, USA, 2013.
  7. Amer, E.; Jönsson, G.; Arrhén, F. Secondary measurement standard for calibration of dynamic pressure sensor to bridge the gap between existing static and dynamic standards. Measurement 2025, 242, 116253. [Google Scholar] [CrossRef]
  8. Pereira, J.D. Pressure Sensors: Working Principles of Static and Dynamic Calibration. Sensors 2024, 24, 629. [Google Scholar] [CrossRef] [PubMed]
  9. McCarthy, J.; Jones, M. The Estimation of Uncertainty in Theoretical Corrections to Unsteady Pressure Measurements Through Tubes; DST-Group-TR-3579; Defence Science and Technology Group: Melbourne, Australia, 2019.
  10. Platte, T. Evaluation of the Uncertainty of Measurement for a Dynamic Calibration Approach for Pressure Sensors. Meas. Sens. 2021, 18, 100252. [Google Scholar] [CrossRef]
  11. Harris, P.; Østergaard, P.F.; Tabandeh, S.; Söderblom, H.; Kok, G.; van Dijk, M.; Luo, Y.; Pearce, J.; Tucker, D.; Vedurmudi, A.P.; et al. Measurement Uncertainty Evaluation for Sensor Network Metrology. Metrology 2025, 5, 3. [Google Scholar] [CrossRef]
  12. Esward, T.J.; Eichstädt, S.; Smith, I.; Bruns, T.; Davis, P.; Harris, P.M. Estimating Dynamic Mechanical Quantities and Their Associated Uncertainties. Metrologia 2018, 56, 015002. [Google Scholar] [CrossRef]
  13. Pallas, N.-P.; Kellaris, K.; Bouris, D. Dynamic Calibration of Complex Tubing Systems Using a Single Pressure Measurement Device. J. Wind Eng. Ind. Aerodyn. 2024, 249, 105715. [Google Scholar] [CrossRef]
  14. Kovaerk, M.; Amatucci, L.; Gillis, K.A.; Potra, F.; Ratino, J.; Levitan, M.L.; Yeo, D. Calibration of Dynamic Pressure in a Tubing System and Optimized Design of Tube Configuration: A Numerical and Experimental Study; National Institute of Standards and Technology (NIST): Gaithersburg, MD, USA, 2018.
  15. Li, F.; Shi, B.; Yang, J. Study on Shock Tube Calibration Technology under Low Pressure. Meas. Sens. 2025, 38, 101693. [Google Scholar] [CrossRef]
  16. Shi, B.; Yao, Z.; Li, F.; Chen, X.; Yao, L.; Ding, Y. Identifying the Frequency Characteristics of the Pressure Measurement System with a Pressure Transmission Tube Using Shock Tube Method. Measurement 2025, 242, 116293. [Google Scholar] [CrossRef]
  17. Svete, A.; Kutin, J. Identifying the High-Frequency Response of a Piezoelectric Pressure Transducer. Mech. Syst. Signal Process. 2022, 162, 108014. [Google Scholar] [CrossRef]
  18. Jentzsch, M.; Lechner, W.; Woszidlo, R.; Nayeri, C.N.; Paschereit, C.O. The Dynamic Response of a Pressure Transducer for Measurements in Water. Exp. Fluids 2024, 65, 125. [Google Scholar] [CrossRef]
  19. Platte, T. Dynamic Sine Calibration of Pressure Transducers. In Proceedings of the XXII IMEKO World Congress, Belfast, UK, 3–6 September 2018; International Measurement Confederation (IMEKO): Budapest, Hungary, 2018. [Google Scholar]
  20. Durgut, Y.; Ganioglu, O.; Aydemir, B.; Turk, A.; Yilmaz, R.; Hamarat, A.; Bagci, E. Improvement of Dynamic Pressure Standard for Calibration of Dynamic Pressure Transducers. In Proceedings of the 19th International Congress of Metrology, Paris, France, 24–26 September 2019. [Google Scholar] [CrossRef]
  21. Bandyopadhyay, M.; Kolay, S.C.; Chattopadhyay, S.; Mandal, N. Modification of De’ Sauty Bridge Network for Accurate Measurement of Process Variables by Variable Parameter Transducers. IEEE Trans. Instrum. Meas. 2021, 70, 9506510. [Google Scholar] [CrossRef]
  22. Lu, J.; Wang, H. Evaluation of the Uncertainty of Measurement for a Dynamic Calibration Approach. Meas. Sci. Technol. 2023, 34, 055008. [Google Scholar]
  23. Li, Q.; Liu, D.; Zhu, J. Uncertainty Evaluation for Wind Tunnel Test Based on New Flow Field and Balance Models. Aerosp. Sci. Technol. 2025, 167, 110593. [Google Scholar] [CrossRef]
  24. Kurihara, D.; Sakaue, H. Temperature Dependency Model in Pressure Measurement. Sensors 2023, 23, 9714. [Google Scholar] [CrossRef] [PubMed]
  25. Svete, A.; Hernández Castro, F.J.; Kutin, J. Effect of the Dynamic Response of a Side-Wall Pressure Measurement System on Determining the Pressure Step Signal in a Shock Tube Using a Time-of-Flight Method. Sensors 2022, 22, 2103. [Google Scholar] [CrossRef] [PubMed]
  26. Semmelmayer, F.; Reeder, M.; Seymour, R. Determination of a Probability Distribution for Pressure Scanner Noise and Digitization Uncertainty Reporting. Meas. Sci. Technol. 2019, 30, 115011. [Google Scholar] [CrossRef]
  27. Wang, H.; Zeng, Q.; Zhang, Z.; Wang, H. Temperature Compensation of Multi-Channel Pressure Scanner Based on an Improved Cuckoo Search Optimizing a BP Neural Network. Micromachines 2022, 13, 1351. [Google Scholar] [CrossRef] [PubMed]
  28. EURAMET. Calibration and Uncertainty for Dynamic Pressure Measurements; EURAMET: Braunschweig, Germany, 2018; Available online: https://www.euramet.org (accessed on 9 September 2025).
  29. Reinhardt, C.; Masalehdan, H.; Croatto, S.; Franke, A.; Kunze, M.B.K.; Schaffran, J.; Sültmann, N.; Lindner, A.; Schnabel, R. Self-Calibrating Gas Pressure Sensor with a 10-Decade Measurement Range. ACS Photonics 2024, 11, 1438–1446. [Google Scholar] [CrossRef]
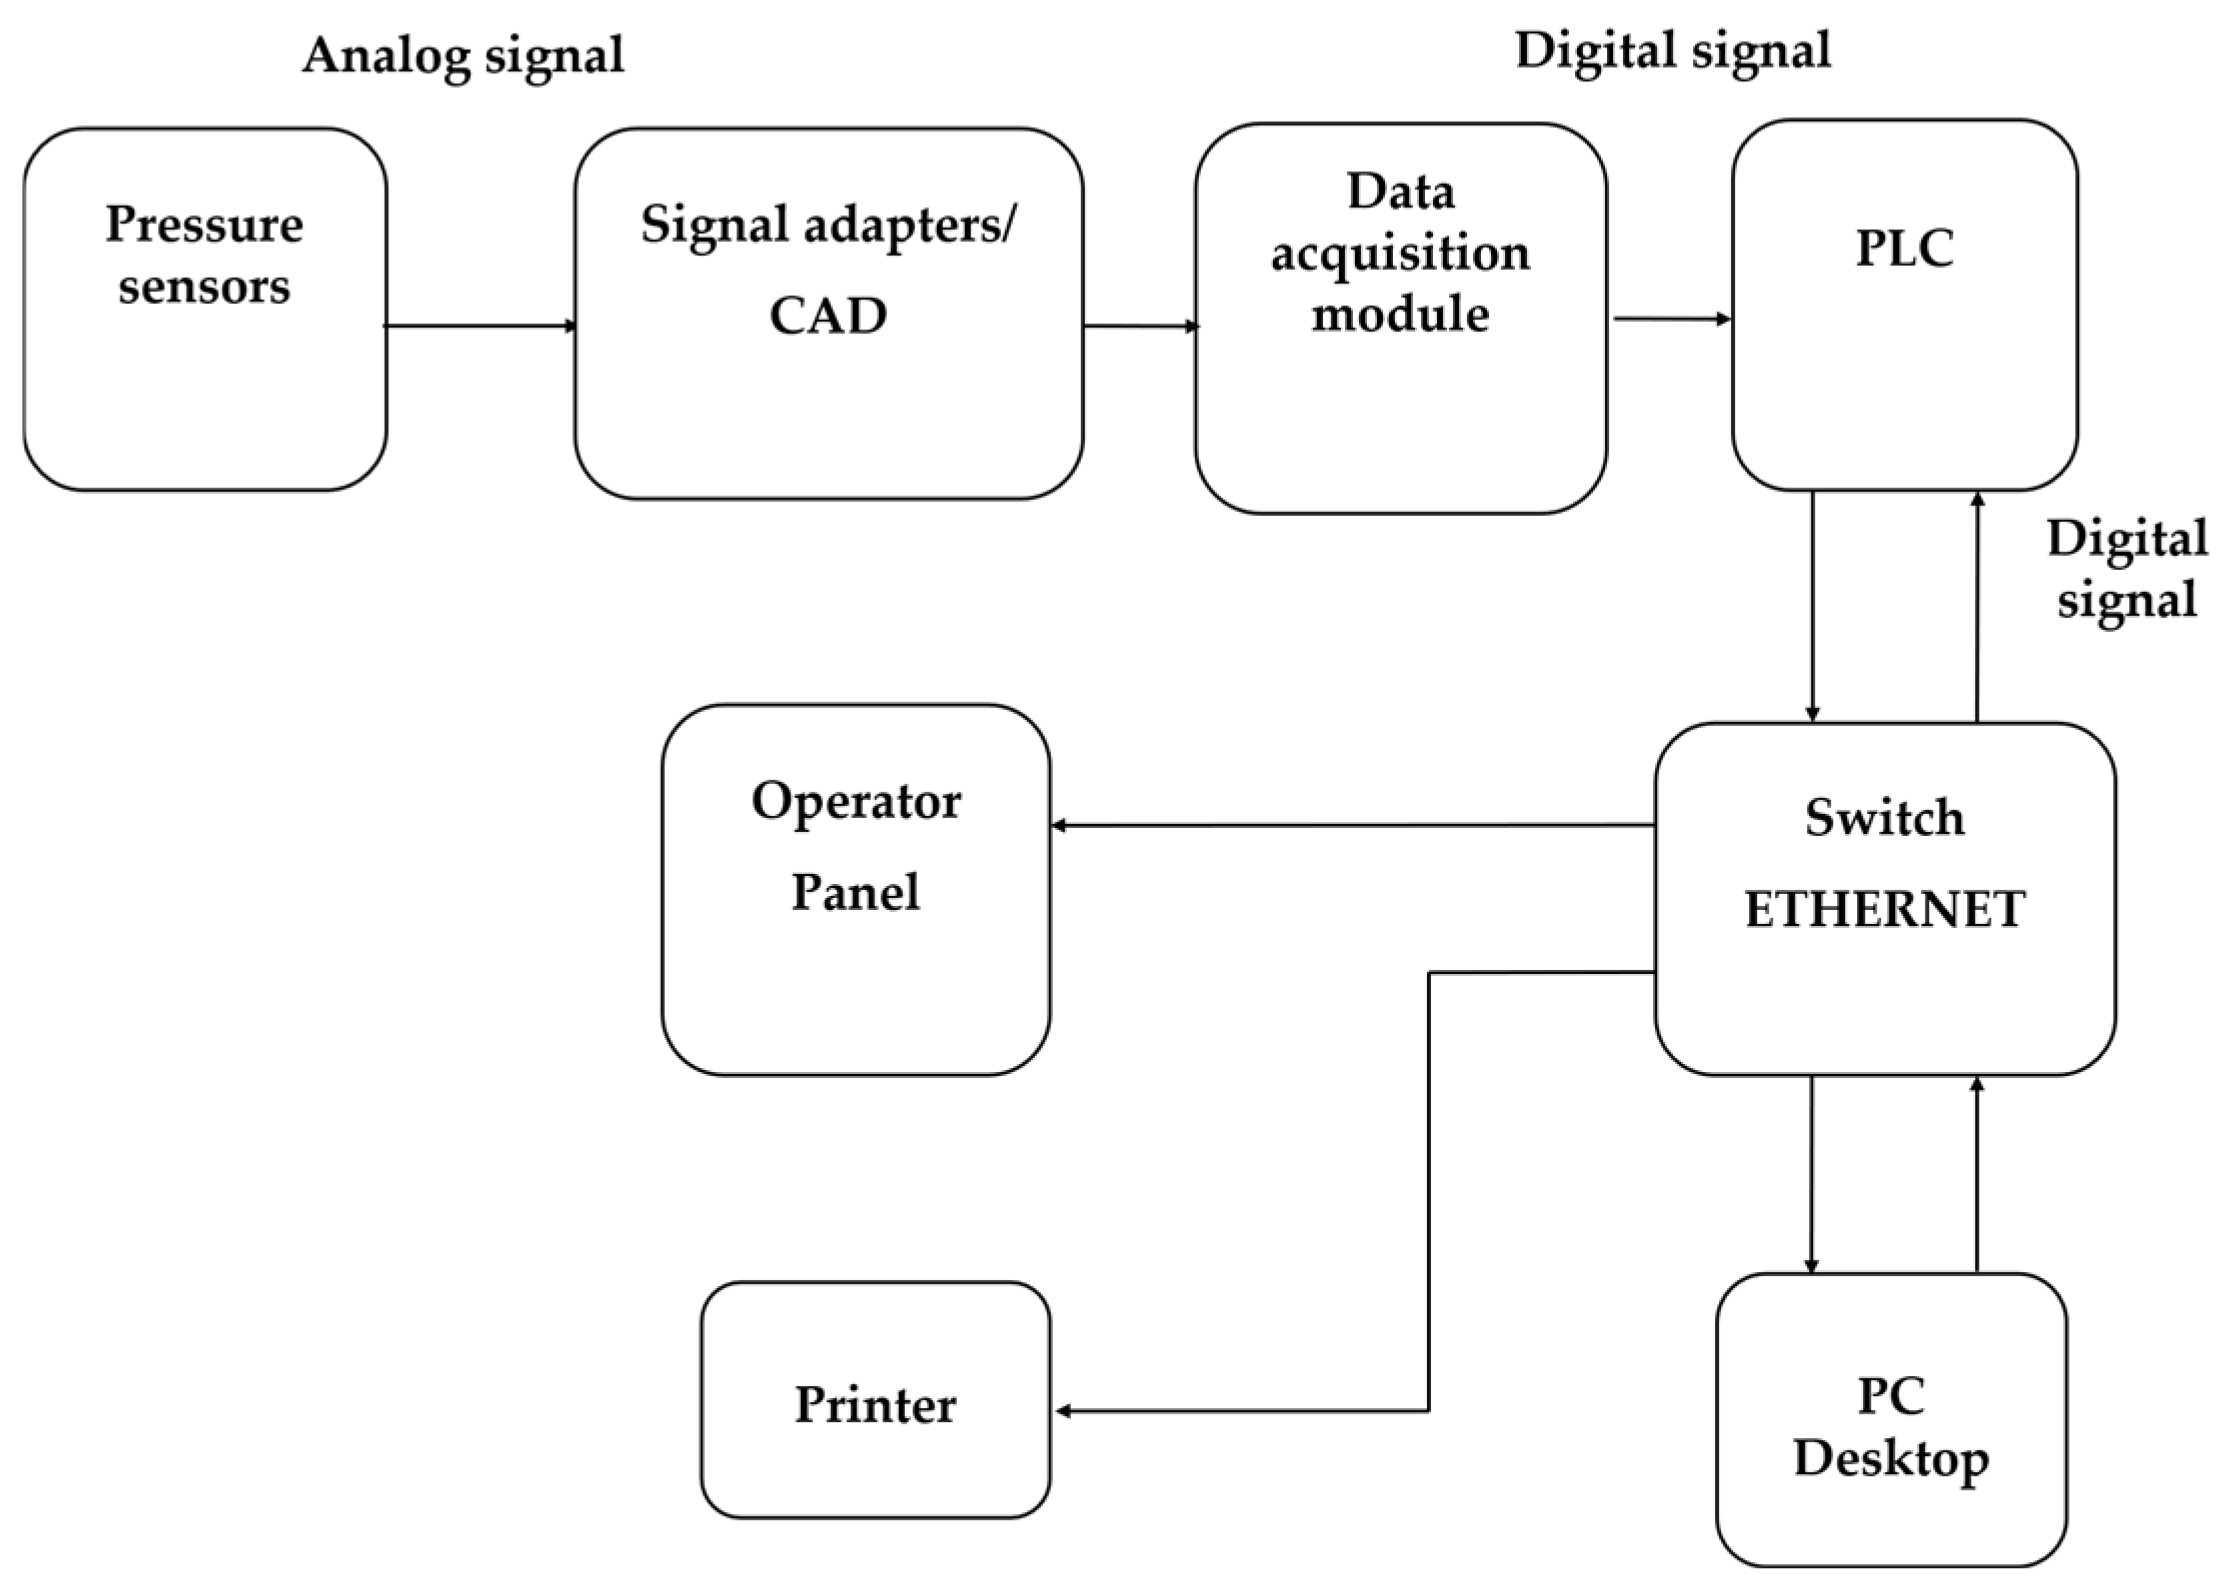
Figure 1. Block schema of the data acquisition system.
Eng 06 00263 g001
Figure 2. Positioning of pressure scanners on the turbo engine.
Eng 06 00263 g002
Figure 3. Comparison between pressure scanners in dynamic regime. (a) Pressure variation for each channel of pressure scanners. (b) Comparison of each value of the coefficients of variation.
Eng 06 00263 g003
Figure 4. The normalized amplitudes of the pressure signals, determined with FFT, for each channel of the pressure scanners. (a) For MPS4264, (b) For ZOC17.
Eng 06 00263 g004
Figure 5. Ratio of normalized amplitudes for four channels of pressure scanner.
Eng 06 00263 g005
Figure 6. Comparison between the relevant components of the uncertainties of ZOC17 Channel 1 and Channel 3.
Eng 06 00263 g006
Figure 7. Extended uncertainty variation for each channel of pressure scanners. (a) For ZOC17, (b) For MPS 4264.
Eng 06 00263 g007
Table 1. Statistical comparison of pressure averages of the ZOC17 and MPS4264 systems (t-test).
ChannelsMean
(ZOC17) [mbar]
Mean
(MPS4264) [mbar]
Standard
Deviation (ZOC17)
Standard
Deviation (MPS4264)
t Statp-Value
Ch1 Analog vs. Ch1 Digital−1.35−12.270.7700.178−248.890
Ch2 Analog vs. Ch2 Digital−11.10−11.850.6070.175−21.29<0.05
Ch3 Analog vs. Ch3 Digital7.80−5.260.5230.257−403.610
Ch4 Analog vs. Ch4 Digital13.56−9.030.5700.113−699.660
Table 2. Uncertainty budget for Channel 1 of pressure scanner ZOC17.
Source of UncertaintyEstimate [mbar]DivisorStandard Uncertainty   u i Method of EvaluationProbability Distribution Sensitivity   Coefficient   c i Uncertainty Contribution
c i · u i
[mbar]
Repeatability0.0210.02Anormal10.02
Hysteresis0.00 12 0.00Brectangular10.00
Standard pressure gauge0.3020.15Bnormal10.15
Drift of the standard pressure gauge0.00 3 0.00Brectangular10.00
Noise0.77 3 0.44Brectangular10.44
Pressure scanner accuracy0.20 3 0.12Brectangular10.12
Signal adapter0.40 3 0.23Brectangular10.23
Resolution0.10 12 0.03Brectangular10.03
Ambient temperature variations0.013 3 0.01Brectangular10.01
Combined Standard Uncertainty0.54
Expanded Uncertainty (k = 2, 95% confidence)1.07
Table 3. Uncertainty budget for Channel 3 of pressure scanner ZOC17.
Source of UncertaintyEstimate [mbar]DivisorStandard
Uncertainty ui
Method of EvaluationProbability DistributionSensitivity Coefficient ciUncertainty Contribution
ci·ui
[mbar]
Repeatability0.0410.04Anormal10.04
Hysteresis0.03 12 0.01Brectangular10.01
Standard pressure gauge0.3020.15Bnormal10.15
Drift of the standard pressure gauge0.30 3 0.00Brectangular10.00
Noise0.52 3 0.30Brectangular10.30
Pressure scanner accuracy0.20 3 0.12Brectangular10.12
Signal adapter0.40 3 0.23Brectangular10.23
Resolution0.10 12 0.03Brectangular10.03
Ambient temperature variations0.013 3 0.01Brectangular10.01
Combined Standard Uncertainty0.40
Expanded Uncertainty (k = 2, 95% confidence)0.80
Table 4. Extended uncertainty (U) for pressure scanner ZOC17 (mbar).
Pressure [mbar]Channel 1
Extended
Uncertainty
U [mbar]
Channel 2
Extended
Uncertainty
U [mbar]
Channel 3
Extended
Uncertainty
U [mbar]
Channel 4
Extended
Uncertainty
U [mbar]
−200.01.070.880.800.90
−100.01.080.940.800.89
−20.01.070.920.800.90
0.01.070.920.800.89
20.01.090.920.800.90
100.01.080.930.800.91
200.01.080.930.800.92
Table 5. Extended uncertainty (U) for pressure scanner MPS4264 (mbar).
Pressure [mbar]Channel 1
Extended
Uncertainty
U [mbar]
Channel 2
Extended
Uncertainty
U [mbar]
Channel 3
Extended
Uncertainty
U [mbar]
Channel 4
Extended
Uncertainty
U [mbar]
−200.00.400.400.400.40
−100.00.400.400.400.40
−20.00.400.400.400.40
0.00.400.400.400.40
20.00.400.400.410.40
100.00.400.410.400.40
200.00.400.400.400.40
Disclaimer/Publisher’s Note: The statements, opinions and data contained in all publications are solely those of the individual author(s) and contributor(s) and not of MDPI and/or the editor(s). MDPI and/or the editor(s) disclaim responsibility for any injury to people or property resulting from any ideas, methods, instructions or products referred to in the content.