1. Introduction
CVDs are the leading cause of death worldwide. According to estimates by the World Health Organization, in 2019, 17.9 million people died from CVDs, accounting for 32% of all global deaths. Of these deaths, 85% were due to heart attacks and strokes. Among the 17 million premature deaths (under the age of 70) from non-communicable diseases recorded in 2019, 38% were caused by CVDs [
1]. IHD is one of the most common forms of CVD and a major cause of mortality [
2]. According to 2022 data, diseases of the circulatory system are the most prevalent among the adult population of Kazakhstan, with 3962.5 cases per 100,000 population. Of these, IHD accounts for 560.7 cases per 100,000 population. These figures confirm the high prevalence of IHD within the structure of cardiovascular pathology [
3].
IHD continues to pose a significant burden on individuals and healthcare systems worldwide. The impact of this condition is considerable, contributing substantially to both mortality and morbidity [
4]. Coronary artery disease (CAD), most commonly resulting from atherosclerosis, is the leading cause of IHD, which manifests as myocardial ischemia. The primary mechanism underlying IHD is obstructive atherosclerosis of the coronary arteries, leading to impaired blood flow to the heart muscle [
5]. Increasingly, sleep health is recognized as a critical, modifiable risk factor for CVD. Poor sleep quality, insufficient duration, and disorders like obstructive sleep apnea directly contribute to the progression of atherosclerosis and hypertension through mechanisms involving systemic inflammation, endothelial dysfunction, and sympathetic nervous system overactivity. Given the growing global demand on healthcare systems, there is an urgent need to develop early risk stratification tools capable of identifying individuals at high risk for IHD before the occurrence of irreversible complications such as myocardial infarction or chronic heart failure (CHF) [
6].
HRV is defined as the fluctuation in the duration of cardiac cycles [
7]. It is a non-invasive indicator obtained through heart rhythm monitoring that provides valuable insights into the overall health status of the body [
8]. HRV reflects the dynamic capacity of the heart and the general physiological ability of an individual to adapt to varying environmental conditions through compensatory mechanisms [
9]. It is directly influenced by the primitive components of the ANS, particularly the parasympathetic branch, and also reflects the combined activity of both the sympathetic and parasympathetic divisions. Low HRV values have been associated with adverse cardiac events such as myocardial infarction, atherosclerosis progression, heart failure, IHD, and sudden cardiac death [
10]. HRV analysis is essential for assessing the functional state of the ANS [
11].
Current clinical tests used to assess coronary health are often expensive, invasive, and insufficiently effective for the timely detection of progressing coronary ischemic conditions [
12]. Although analytical angiography is considered one of the most accurate procedures for identifying heart abnormalities, it is associated with high costs, potential side effects, and requires significant technological expertise. Traditional diagnostic methods are time-consuming, prone to human error, and may lead to inaccurate diagnoses, making them costly and labor-intensive [
13]. HRV analysis emerges as a promising non-invasive alternative, as HRV is a recognized indicator of autonomic imbalance and a predictor of adverse cardiac events, and low HRV values have been directly linked to IHD. However, the standard diagnosis of HRV is based on 24 h Holter ECG, which limits its widespread use. Such conventional ECG systems require clinical supervision and meticulous electrode placement, which increase operating costs and inconvenience users. Against this backdrop, PPG has attracted particular attention, offering a significantly cheaper and more convenient alternative to ECG for continuous heart monitoring.
While the link between HRV and CVDs is well established, a practical method for IHD screening with consumer-grade PPG sensors is still lacking and the most informative HRV biomarkers obtainable from such devices have yet to be defined. To fill this gap, the present pilot introduces Zhurek, a fingertip PPG device designed in-house that performs on-board, real-time analysis of HRV metrics and securely streams the data to a cloud repository. Bench tests against a three-lead Holter ECG show clinically acceptable differences of −0.601 bpm for mean heart rate (HR), +33.1 ms for standard deviation of NN intervals (SDNN), and −4.8 ms for root mean square of successive differences (RMSSDs). Using Zhurek, HRV recordings were collected from patients drawn from the Cardiology center in Almaty, Kazakhstan. Our findings indicate a strong link between HRV and IHD. Mutual information analysis revealed that the frequency-domain features High frequency (HF) and Low frequency (LF) have the highest statistical dependency on IHD status. To address a limited sample size, we employed a CTGAN model to generate synthetic HRV data, successfully expanding our dataset while preserving key statistical properties. We then trained several ML classifiers on our dataset. The RF model demonstrated the best performance, achieving an accuracy of 94% in distinguishing between individuals with and without IHD. A SHAP analysis confirmed the importance of frequency-domain metrics, identifying HF and LF as the most influential features for the model’s predictions. These results underscore the potential of using ML with HRV analysis for the non-invasive detection of IHD. Our pilot study shows that measurements obtained with an affordable PPG device allow for the analysis of key HRV markers. While this method is not intended to replace the “gold standard”—24 h Holter monitoring—it demonstrates the potential of low-cost wearable sensors for HRV analysis. This lays the foundation for the development of future scalable and cost-effective screening and monitoring systems for IHD.
2. Literature Review
CVDs remain the leading cause of morbidity and mortality worldwide, highlighting the critical importance of early diagnosis in high-risk individuals and the development of effective preventative and interventional strategies. The diagnosis of IHD remains a complex challenge. Invasive coronary angiography is the “gold standard”; however, there is a pressing need for non-invasive, rapid, and reliable alternatives [
14,
15]. In this context, risk prediction methods play a key role, assessing the probability of future cardiovascular events (myocardial infarction, mortality) based on risk factor analysis, which allows for the identification of high-risk patients for timely intervention [
16,
17,
18]. Recent research has focused on creating multifactorial models that integrate physiological indicators, lifestyle factors, and clinical history to improve risk assessment reliability and enable a more personalized approach [
19]. ML models offer a powerful tool for these tasks, effectively integrating clinical variables, imaging data, and biomarkers to improve diagnostic and prognostic accuracy [
16,
20,
21].
HRV, which measures the variation in time intervals between consecutive heartbeats (RR or NN intervals), is a non-invasive indicator widely used to assess cardiovascular health [
22]. In the context of IHD, reductions in the time-domain indices SDNN, RMSSDs, and pNN50, along with changes in the low-frequency to high-frequency (LF/HF) ratio, correlate with myocardial injury and a higher risk of adverse events, while imbalance between LF and HF components reflects impaired autonomic regulation during ischemic episodes. This review systematizes these key HRV parameters and underscores their clinical relevance for monitoring and managing patients with IHD [
6,
23]. In patients with IHD and arrhythmias, HRV metrics are significantly reduced compared to healthy individuals. Notably, time-domain parameters such as SDNN, SDANN, RMSSD, pNN50, and the triangular HRV index, along with non-linear measures like α, α1, α2, SD1, SD2, Approximate Entropy (AppEn), and Sample Entropy (SampEn), show marked decreases in these patients [
24]. These changes reflect impaired autonomic regulation of the heart and underline the utility of HRV analysis for evaluating cardiac function and disease progression in IHD [
22].
Traditionally, the assessment of cardiovascular function relies on ECG, which records the heart’s electrical activity from the skin surface using electrodes [
25]. Although conventional ECG systems provide high accuracy, they require clinical supervision, careful electrode placement, and regular calibration, which increase operating costs and reduce user convenience [
25]. Over the past decade, growing demand for continuous, convenient, and low-cost solutions has stimulated the search for alternative monitoring methods [
26]. Against this background, PPG has attracted particular attention because of its simple hardware implementation and easy integration into consumer devices, offering a cheaper and more convenient option for continuous monitoring in both clinical and everyday settings [
27]. Breakthroughs in microelectronics and sensor technologies have led to the miniaturization of PPG sensors and their integration into wristbands, smartwatches, mobile phones, and in-ear devices, which has democratized access to continuous cardiac monitoring [
28]. The additional pairing of PPG with wireless data transmission and cloud analytics provides a unique combination of affordability, portability, and convenience that conventional ECG systems cannot fully deliver [
29].
Deep learning models demonstrate outstanding effectiveness in analyzing ECG signals, where they can automatically extract key features from raw data that distinguish normal from ischemic patterns. Experimental studies confirm that such models can achieve a classification accuracy exceeding 98% in distinguishing IHD and myocardial infarction from healthy states by detecting minute deviations in ST-segment morphology and QRS complex duration—key indicators of ischemia [
30]. To enhance performance, hybrid architectures combining convolutional (CNN) and recurrent (RNN) layers are used, which capture both spatial and temporal dependencies in the data [
31,
32]. In addition to analyzing the full ECG signal, ML algorithms are widely applied to classify condition-based HRV. Among these, RF stands out for its effective handling of non-linear patterns, achieving an accuracy of 95.1% in binary classification [
33]. Additionally, K-nearest neighbors (KNN) and decision trees (DTs) have shown high accuracy, up to 92.86%, in cardiovascular status assessment tasks [
34,
35,
36].
Along with ECG and PPG data, visual diagnostic data such as non-contrast CT, echocardiograms, and CT angiograms are increasingly analyzed using deep learning models. These models form hierarchical representations of coronary artery anatomy, identifying subtle changes in vessel caliber and myocardial wall motion [
37,
38]. Architectures like autoencoders compress multidimensional data to create interpretable latent features for further analysis [
38]. However, a major challenge in working with medical data is class imbalance, where there are far fewer abnormal cases than normal ones. To address this, unsupervised anomaly detection approaches are applied, such as k-means clustering, which segments data by similarity metrics and flags deviating samples as potential anomalies, thereby improving the performance of subsequent supervised classifiers [
39]. Synthetic oversampling is also used: traditional methods like SMOTE balance the classes and significantly improve the performance of algorithms such as the support vector machine (SVM) [
40]. Furthermore, more modern approaches based on generative adversarial networks (GANs and CTGANs) have shown even higher effectiveness compared to classic techniques, especially in SVM and logistic regression classification models [
31].
Despite advancements, several challenges remain. Linear methods for HRV analysis have limited sensitivity and fail to detect complex patterns in physiological signals. Modified non-linear methods demonstrate greater effectiveness in identifying atypical patterns, including U-shaped dependencies [
41]. In the domain of ML, many studies lack adequate consideration of model uncertainty, which is a critical aspect when using ML algorithms. Neglecting this factor reduces the reliability of the results and limits their reproducibility [
33]. Furthermore, the relevance of some traditional diagnostic methods is being questioned; for example, in a study focused on the diagnosis of IHD, the AUC value for exercise testing was significantly lower compared to results obtained through the analysis of volatile organic compounds (VOCs). This indicates lower diagnostic relevance of exercise testing in this context [
42]. Finally, several studies have only focused on short-term outcomes. A study aimed at predicting stroke outcomes based on HRV indicators did not consider long-term cardiovascular events.
3. Materials and Methods
3.1. System Description
The proposed hybrid physiological monitoring system is engineered for continuous HRV analysis to enable the ambulatory assessment of ANS status. The system integrates a wearable sensing device with on-device signal processing and remote data logging, as shown in
Figure 1.
The system is composed of three integrated subsystems: the sensing and processing module, the communication and storage layer, and the analytics and classification domain. Bidirectional arrows indicate continuous data exchange and feedback between subsystems.
At the sensing module, the Zhurek IoT device is responsible for acquiring PPG signals and computing core HRV metrics in real time. The device captures fingertip-based PPG data, processes it locally to extract time-domain features, and prepares it for wireless transmission. The embedded software processes the raw signal in real time and extracts several well-established HRV metrics, including HR, R wave to R wave intervals (RR intervals), standard deviation of normal-to-normal intervals (SDNN), and RMSSD. A detailed description of Zhurek’s hardware and firmware architecture is provided in
Section 3.2.
Processed HRV features are encapsulated in JavaScript Object Notation (JSON) format and transmitted via Wi-Fi using the MQTT protocol. The device publishes data to the topic zhurek/ppg/hrv, which is managed by a Mosquitto 2.0 MQTT broker hosted on a centralized server. All communication is secured using TLS 1.3 with mutual certificate-based authentication to ensure data integrity and privacy.
At the storage layer, incoming MQTT messages are parsed and stored in a relational SQL database. Each record is timestamped using a synchronized internal real-time clock, which is regularly updated via Network Time Protocol (NTP) to maintain temporal accuracy across devices. In parallel, the wearable device retains a local backup log in CSV format, providing redundancy in case of connectivity loss.
At the analytics and classification domain, the extracted HRV features are utilized to predict the risk of autonomic dysfunction associated with IHD. The stored data is periodically processed using various ML algorithms, including gradient boosting methods (XGBoost, CatBoost), RF, interpretable generalized additive models (EBMs), and hybrid architectures combining deep neural networks (DNNs) with least-mean-square support vector machines (LMSVMs). These models are trained on labeled datasets to classify patients by risk level and to detect early patterns of dysfunction. This approach enables automated preliminary diagnostics and supports wellness assessment and risk stratification in remote monitoring scenarios.
This system enables continuous monitoring and structured data analysis by integrating embedded signal processing, secure wireless transmission, and modular analytics. The use of open-source tools and commercially available components supports reproducibility and facilitates deployment in remote monitoring scenarios.
3.2. Zhurek IoT Device
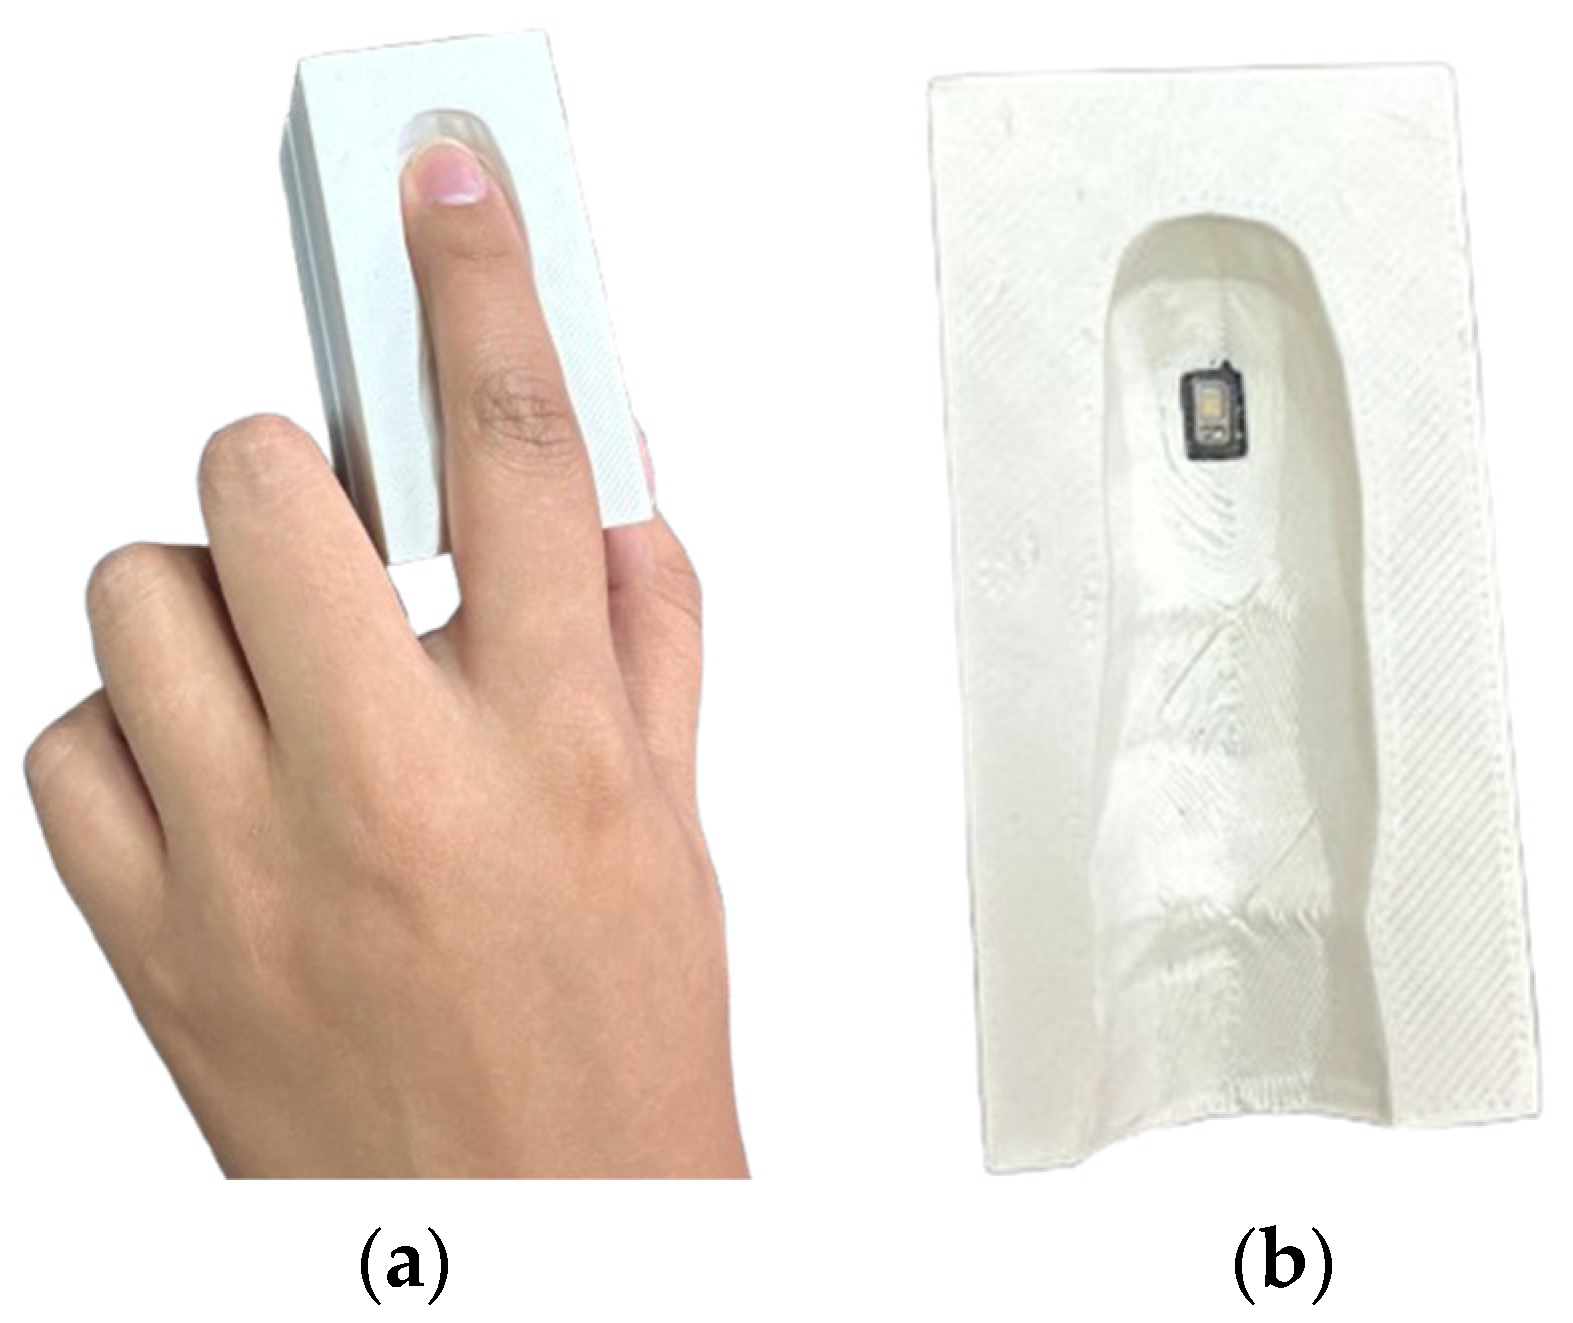
Zhurek, shown in
Figure 2, is a custom-engineered, non-invasive wearable device designed to capture and process PPG signals in real time. Its compact form factor, self-contained electronics, and on-device analytics make it suitable for long-term ambulatory monitoring outside clinical environments.
The Zhurek device integrates MAX30102 optical sensor (DFRobot Gravity: SEN0344, DFRobot, Shanghai, China) with a Raspberry Pi Zero 2 W microcontroller (ARM Cortex-A53, 1 GHz, 512 MB RAM, Raspberry Pi Ltd., Cambridge, UK) running Raspberry Pi OS Lite (64-bit, Version 6.12, Raspberry Pi Foundation, Cambridge, UK). Only the infrared channel is used for signal acquisition, sampled at 100 Hz over a hardware I2C bus (address 0 × 57). The sensor is enclosed in a 3D-printed PLA shell with an IR-shielded finger clip and soft elastomer padding to reduce motion artefacts and ambient interference.
The device is designed as a finger-clip wearable, intended primarily for resting-state measurements. Power can be supplied either by a rechargeable Li-Po battery (~6 h in wireless mode) or continuously through a USB power adapter, depending on the application. In terms of reliability, the system maintains >95% valid beat detection under resting conditions. Accuracy was benchmarked against a clinical-grade Holter ECG, with deviations of −0.601 bpm for HR, +33.1 ms for SDNN, and −4.8 ms for RMSSD, demonstrating clinically acceptable agreement.
All acquisition and processing code is implemented in Python 3.11, with smbus2 used for I2C communication. The raw PPG signal undergoes baseline correction and smoothing (via moving average filtering). A derivative-based peak detection algorithm derived from HeartPy identifies cardiac cycles, with physiological validation applied to exclude outliers. RR intervals are calculated from peak timestamps, and time-domain HRV metrics—HR, SDNN, and RMSSD—are computed in 30 s windows with a 5 s step. Frequency-domain metrics (LF, HF, LF/HF) and Max_HR are obtained offline together with the anthropometric features of BMI and age, forming an eight-item feature vector.
Each result is serialized as JSON object and published via MQTT. In addition to live data transmission, the device logs the results locally in CSV format as a fallback mechanism. All data points are timestamped using a real-time clock (RTC) synchronized periodically via NTP.
Zhurek delivers optimal signal quality and high physiological accuracy under resting conditions. Resting monitoring reduces motion artefacts and yields stable autonomic patterns, ensuring reliable HRV computation. Validation results align with published evidence showing that resting acquisition provides the greatest accuracy and reproducibility for HRV, gas exchange, and metabolic rate measurements [
43,
44,
45]. Remote HR and HRV recorded in this state correlate closely with ECG readings, and baseline metabolic rate together with respiratory exchange ratio remains stable and accurate during steady rest [
45]. Physiological data collected under these conditions faithfully reflect ANS activity and serve as a robust baseline for IHD risk surveillance.
The clinical utility and predictive value of numerous HRV parameters are well established in the existing literature. Prior research [
45], primarily using the gold-standard ECG, has confirmed that metrics such as SDNN, RMSSD, and the triangular index are significantly associated with patient outcomes. The primary challenge, however, lies in translating this diagnostic power from clinical-grade ECGs to convenient, non-invasive wearable devices.
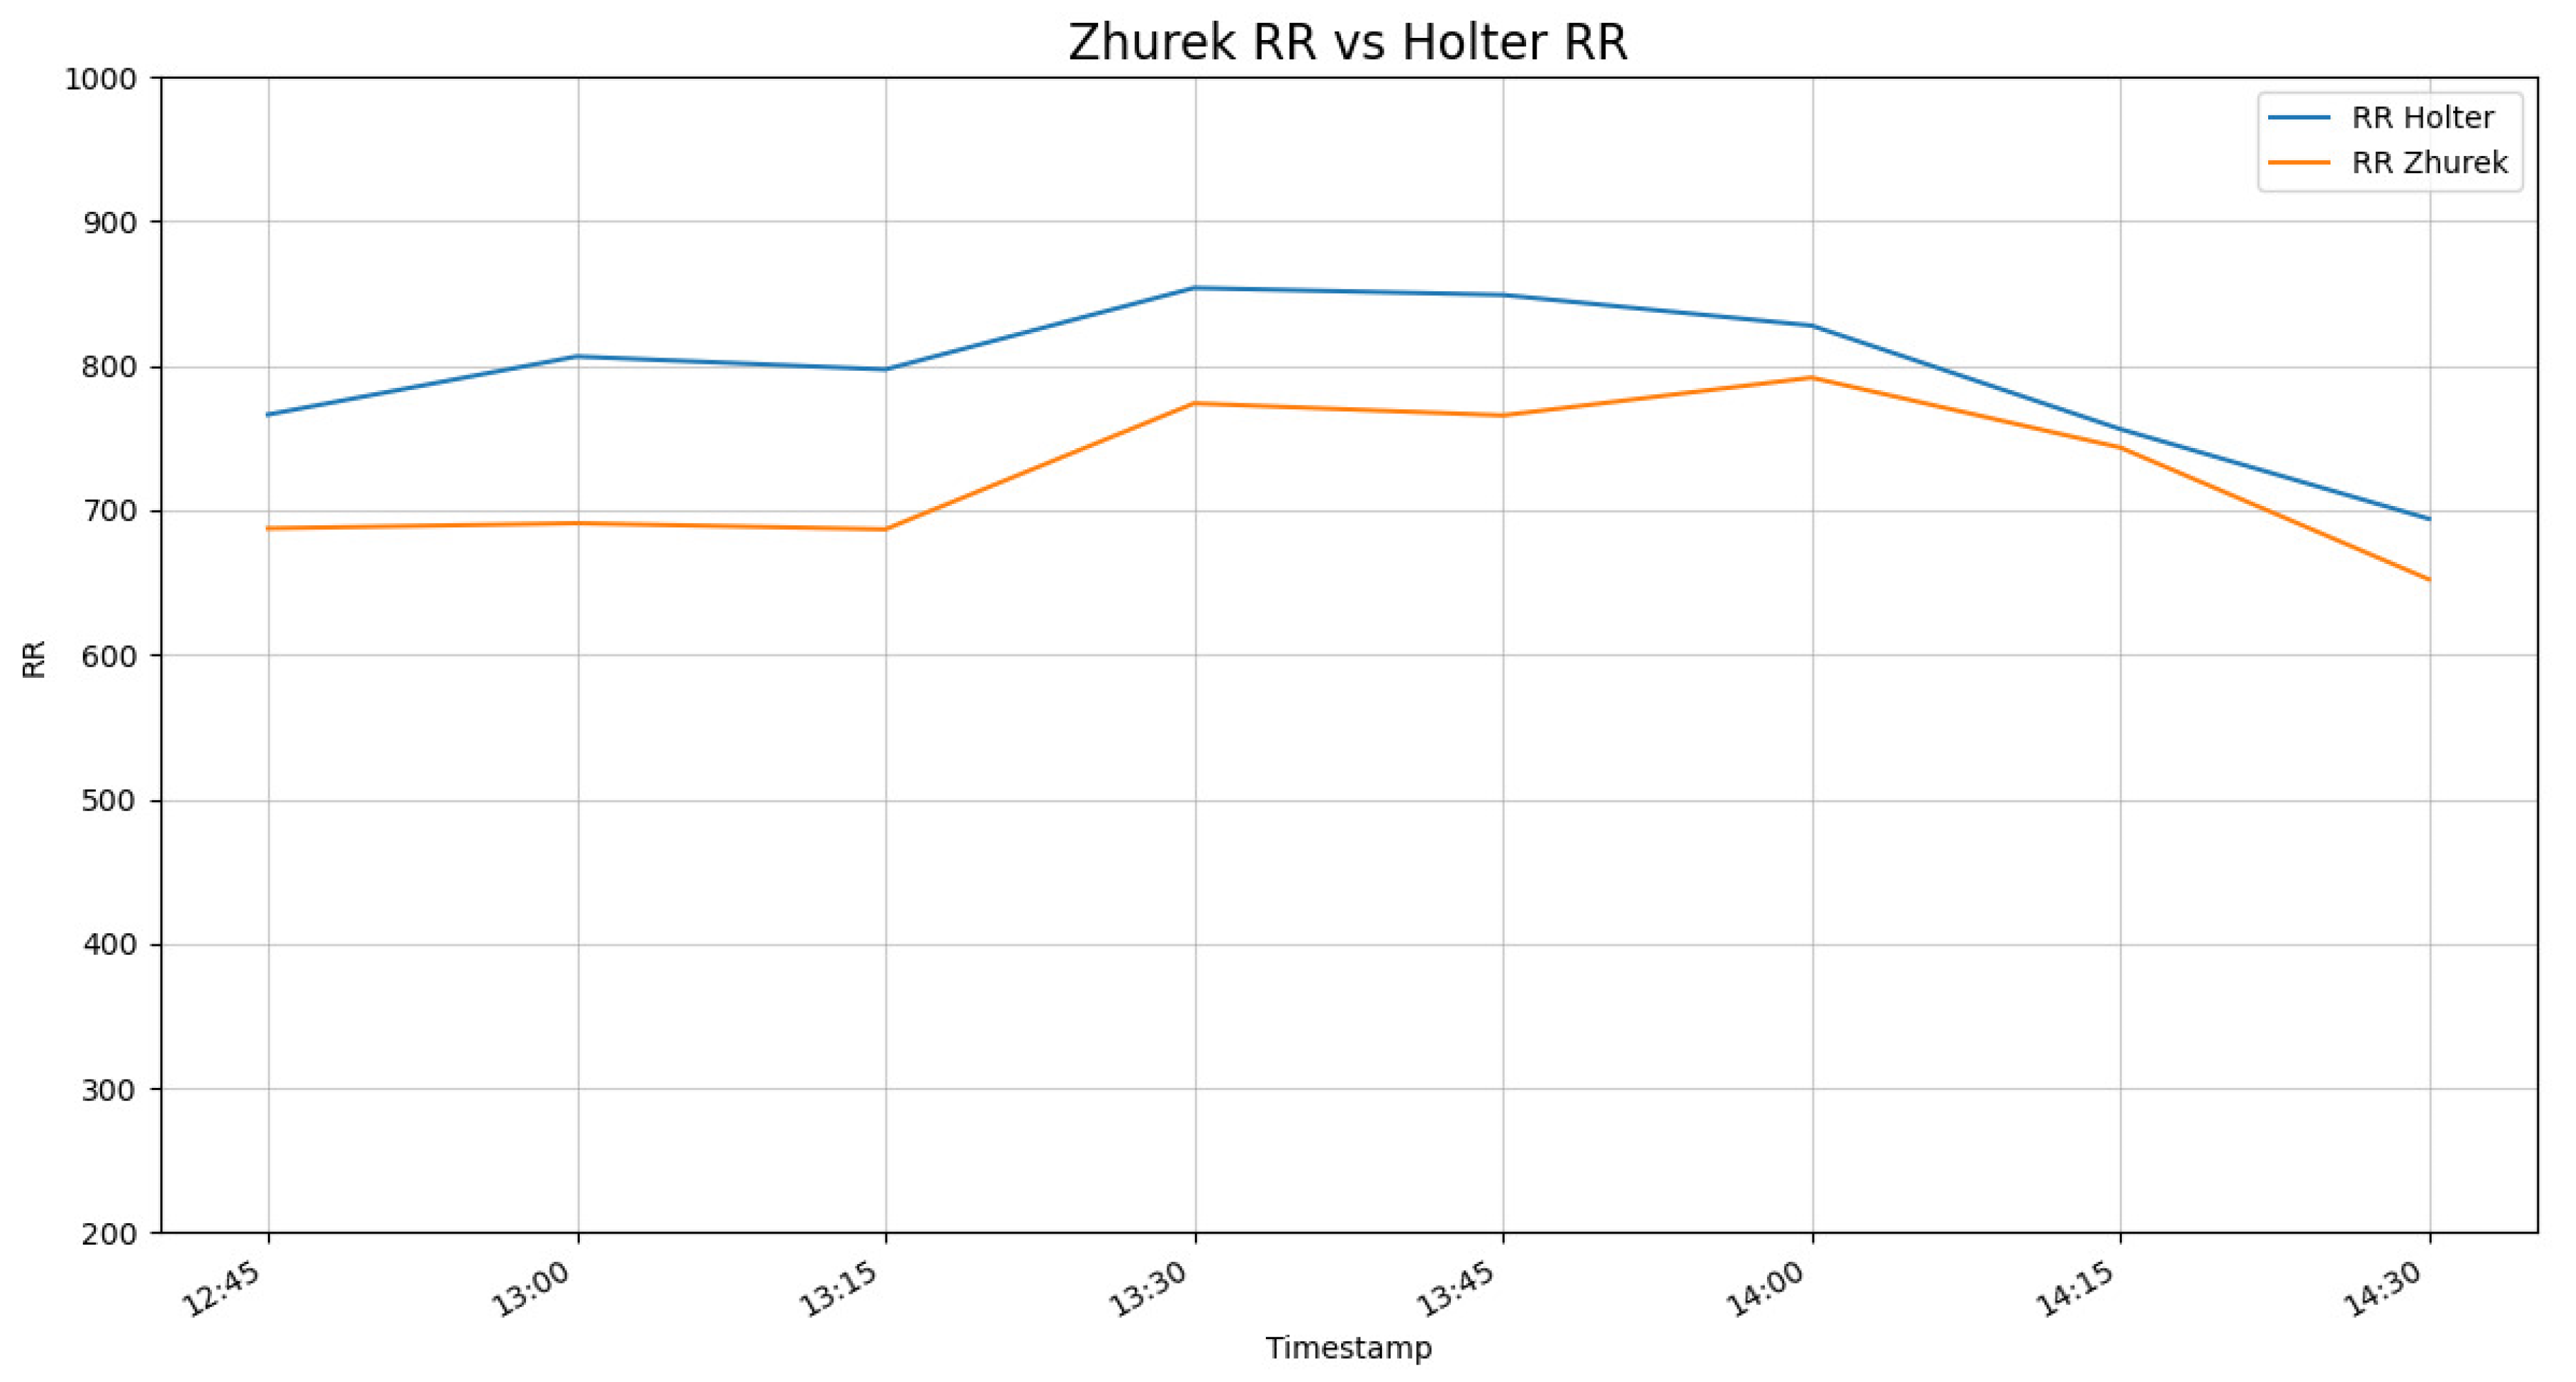
To assess the suitability of the Zhurek device for HRV analysis, a validation study was conducted by comparing its readings against a reference clinical-grade three-lead Holter monitor. The devices demonstrated a high degree of concordance, with the signal trends from Zhurek closely tracking the Holter ECG, as shown in
Figure 3 and
Figure 4.
The data reveals a strong temporal correlation, confirming that the Zhurek device accurately captures the dynamic fluctuations of cardiac rhythm. A minor, stable offset in the absolute values was observed, which characterizes the inherent difference between the PPG and ECG measurement techniques. Given that the primary goal of HRV analysis is to assess the variability in rhythm rather than absolute values, this high degree of trend alignment validates the Zhurek device as a reliable tool for its intended application.
These findings are consistent with a growing body of research focused on validating PPG-based sensors. Authors of a study [
46] also validated a wearable device, demonstrating that its HRV readings closely align with reference ECG data and can serve as a valid substitute for longer, standard measurements. Further reinforcing this, another study [
47] found that the accuracy of certain PPG-derived HRV parameters could be adequate for patient monitoring, underscoring the importance of parameter-specific evaluation.
3.3. Study Population and Data Collection
To ensure the robust training and evaluation of ML models for IHD prediction, HRV data were collected from two independent cohorts: a clinical group of patients with confirmed CVDs (300 patients) and a healthy control group. This dual-cohort design allows the models to learn patterns of autonomic dysfunction observed in real-world pathological states while distinguishing them from the normal physiological variability found in healthy individuals.
Monitoring of both cohorts was conducted using high-quality RR-interval acquisition devices to ensure the consistency and reliability of HRV measurements. Recordings from participants diagnosed with IHD and from healthy volunteers were collected under controlled laboratory conditions using a BTL-08 Holter ECG system (BTL Industries, Stevenage, Hertfordshire, UK) and the Zhurek IoT device (Almaty, Kazakhstan). The BTL-08 is a multi-lead ambulatory ECG recorder with up to 12-lead configuration, continuous monitoring for 24–48 h, and a sampling frequency of 1000 Hz at 12-bit resolution. It is CE-certified for diagnostic use and has validated performance in arrhythmia and ischemia detection, making it a widely adopted gold-standard reference for HRV research.
HRV data of adult inpatients with confirmed cardiovascular conditions were acquired at the Research Institute of Cardiology and Internal Diseases (Almaty, Kazakhstan). Diagnoses were established according to clinical protocols under the supervision of the institute’s cardiology department. Continuous recordings were collected using the BTL-08 Holter ECG monitors and the Zhurek device.
Participants represented both early and advanced stages of cardiovascular pathology. This broad distribution increases population heterogeneity and supports the development of generalizable ML models. All recordings were stored as high-resolution numerical RR-interval files, and the resulting dataset already includes the key HRV variables—HR, RR intervals, SDNN, and RMSSD—automatically computed and ready for downstream analysis.
To establish a physiological baseline for HRV under normal autonomic conditions, data were collected from healthy volunteers. All participants reported no history of cardiovascular, neurological, or metabolic disorders. To minimize confounding factors, participants were instructed to abstain from alcohol, tobacco, caffeine, and intense physical activity for at least 24 h prior to data collection, and to maintain regular sleep (7–8 h) the night before. Participants were excluded if they had an acute illness, failed to meet the preparation criteria, or if signal recordings showed excessive artifacts.
Descriptive statistics and categorical characteristics of the healthy control group are summarized in
Table 1 and
Table 2.
3.4. Data Preprocessing
In this pilot study, data preprocessing involved the integration of two distinct cohorts: a healthy control group and a group of patients diagnosed with IHD. Large Language Models (LLMs) were used to process the raw patient data, enabling the transformation and structuring of the initial information to extract the necessary parameters for analysis. The dataset includes important HRV features such as SDNN, percentage of successive normal-to-normal intervals that differ by more than 50 milliseconds (pNN50), and RMSSD, along with frequency-domain measures including LF, HF, and the LF/HF ratio. To balance the dataset and improve model robustness, data from healthy participants were augmented using a conditional tabular generative adversarial network (CTGAN), increasing the healthy group records from 20 to 200. As a result, the total dataset consisted of 500 observations.
CTGAN is a generative model specifically designed to synthesize realistic tabular data, including both continuous and categorical features, by conditioning the generation process on selected discrete values. The model utilizes a conditional generator to resample imbalanced columns and employs mode-specific normalization to better model multi-modal distributions. The objective function of CTGAN follows the standard GAN minimax formulation, conditioned on discrete variables:
where G is the generator; D is the discriminator; c is the conditional vector (discrete feature); and z is the noise input [
48].
CTGAN has repeatedly demonstrated its effectiveness as a data augmentation method. In a recent medical-data study, CTGAN presented a better performance (AUC, F1-score, precision, etc.) than ROS, SMOTE, and ADASYN, outperforming 17 baseline models [
31]. It has been used to generate samples of the minority class, significantly improving the performance of various ML models [
49]. Experimental results showed that the use of CTGAN led to substantial improvements in classification quality based on precision, recall, and F1-score metrics compared to traditional data augmentation methods. This makes the model an optimal choice for enhancing reliability in situations with limited original data [
14].
Prior to model training, the data were preprocessed by removing all rows with missing values. This approach eliminates incomplete records, reducing the risk of bias caused by inaccurate or partial information. Removing rows with missing data ensures more reliable model training, as only complete and valid observations are retained—an especially important consideration in the context of medical data analysis.
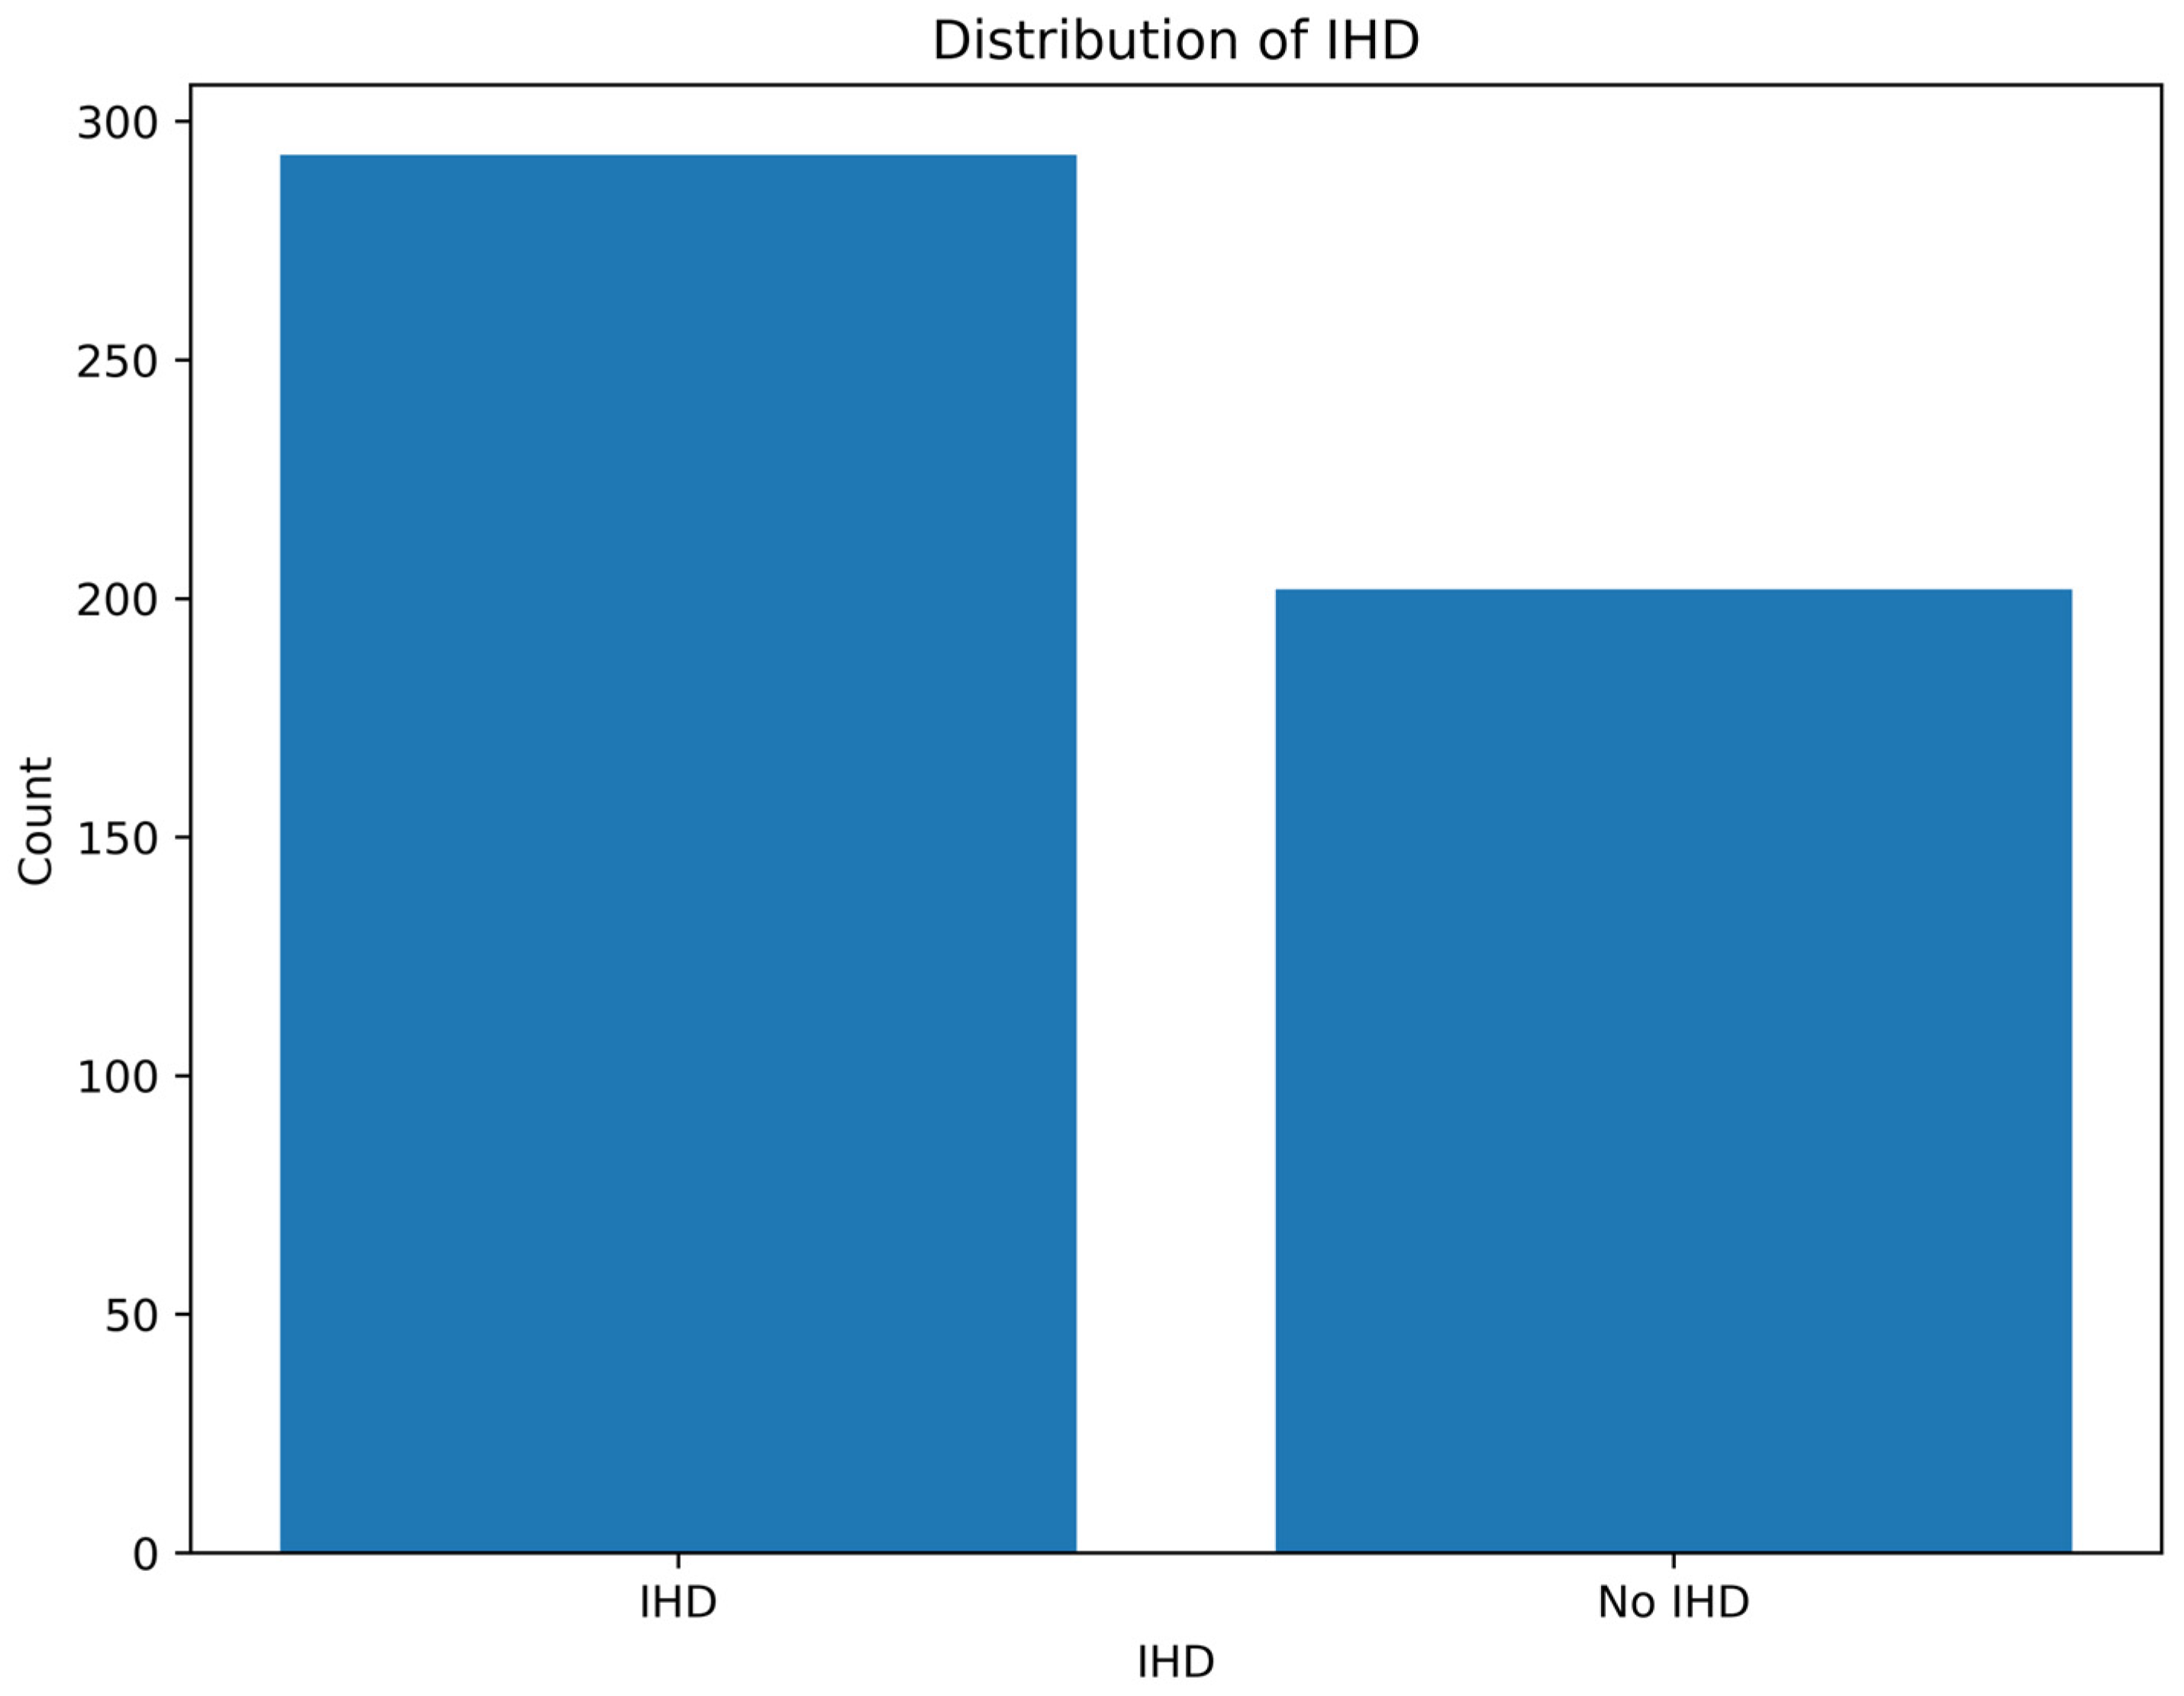
To assess the outcome of class balancing, a class distribution plot was created after applying CTGAN, showing the number of records classified as having IHD and those without it (No IHD).
Figure 5 demonstrated improved class balance, which contributed to enhanced performance and generalizability of the ML models.
3.5. Feature Analysis and Selection
For the analysis of cardiological data, several ML models were utilized, including RF, a DNN-LMSVM, XGBoost, CatBoost, and EBMs. These models were selected based on their proven effectiveness in handling complex, non-linear relationships in biomedical data, as well as their capability to process structured and high-dimensional features. DNNs uncover hidden interactions and complex dynamics in systems purely from observational data, allowing analysis without relying on predefined models [
50]. XGBoost and RF utilize ensemble learning to enhance the accuracy and reliability of assessment [
15]. Moreover, EBMs are applied to create interpretable models through generalized additive modeling, facilitating the understanding of feature contributions.
The classification task was formulated as a multi-class problem aimed at categorizing patients into different cardiovascular risk groups based on clinical and physiological features.
To ensure optimal hyperparameter settings and model robustness, grid search combined with cross-validation (CV = 5) was performed. This approach systematically explores various hyperparameter combinations and evaluates model generalizability across different data splits, reducing overfitting and improving predictive accuracy.
The DNN-LMSVM model leverages deep hierarchical feature extraction combined with the robust margin maximization of LMSVMs to capture subtle patterns in the data. Ensemble methods such as RF, XGBoost, and CatBoost were incorporated to improve predictive performance and reduce overfitting by aggregating multiple decision trees. Additionally, EBMs were applied to build interpretable models with the ability to analyze feature contributions through generalized additive modeling. To enhance interpretability, SHapley Additive exPlanations (SHAP) values were computed for tree-based models, allowing quantitative assessment of feature impact on individual predictions.
Data preprocessing included encoding categorical variables to ensure compatibility across all models. Target labels representing cardiovascular risk categories were encoded into numerical classes to facilitate supervised learning. The dataset comprised numerous clinical indicators and physiological measurements relevant to cardiovascular health.
Model development and training were conducted in Python using libraries including Scikit-learn (for RF and EBMs), XGBoost, CatBoost, and PyTorch (for DNN-LMSVM). The performance of the models was assessed using four primary evaluation metrics. Accuracy quantifies the overall proportion of correct predictions made by the model. Precision measures the proportion of true positive instances among all instances predicted as positive. Recall evaluates the model’s ability to identify all actual positive cases within the dataset. The F1-score, as the harmonic mean of precision and recall, provides a balanced measure that captures both the model’s precision and sensitivity, thereby enabling a comprehensive assessment of its reliability and predictive effectiveness.
5. Discussion
A central innovation of this study is the development and rigorous clinical validation of the Zhurek IoT device, a custom-engineered, non-invasive tool designed to overcome the practical limitations of conventional cardiovascular monitoring. While the 24 h Holter ECG is the gold standard [
53] for HRV analysis, its application is often restricted by high costs [
54], user inconvenience [
55], and the need for clinical supervision. The Zhurek device was specifically engineered to bridge this gap, offering a low-cost, ambulatory solution that captures high-fidelity PPG signals and performs real-time, on-device processing of critical HRV metrics. Thus, a primary objective was to evaluate the device’s performance and reliability under real-world conditions, establishing its viability as an accessible tool for scalable screening. To empirically prove its clinical utility, the Zhurek device was benchmarked directly against a gold-standard three-lead Holter ECG monitor in a supervised clinical setting. Concurrent HRV data were collected from both patients diagnosed with IHD and healthy controls, enabling a direct, head-to-head comparison. The results demonstrated a high degree of concordance, with signal trends from the Zhurek device closely tracking those recorded by the Holter ECG. This strong temporal correlation confirms that our device accurately captures the dynamic fluctuations in cardiac rhythm essential for meaningful HRV analysis.
The ML classification results further demonstrate that a custom, low-cost PPG system can classify IHD with high performance (AUC = 0.98) and strong signal fidelity. Specifically, it achieved a low absolute deviation of −4.8 ms for RMSSD and +33.1 ms for SDNN against a Holter ECG. This performance is particularly noteworthy when compared to prior validations, such as the 24 h wrist-recording study in [
47], which reported significant relative mean absolute errors for high-frequency measures like RMSSD (≈17%) and the LF/HF ratio (≈36%). Our system’s minimal deviation for RMSSD suggests a robust capability in capturing sensitive beat-to-beat variations, a known challenge for PPG technology.
Furthermore, while other foundational studies have focused on the technical nuances of signal fidelity—such as achieving a low RR-series error standard deviation (≈5.4 ms) with smartphone PPGs [
56] or highlighting the necessity of up-sampling to 200 Hz to improve RMSSD agreement [
46]—their primary objective remained signal-level validation. Our research builds upon these findings by applying the derived HRV metrics to a downstream clinical classification task. Consequently, our approach is distinct in its combination of a custom, low-cost hardware platform, validated high performance for sensitive HRV metrics, and its successful deployment in a ML model for the specific clinical purpose of IHD risk stratification.
This successful validation shows that an affordable, user-friendly PPG sensor can reliably detect the physiological differences between IHD and healthy states, establishing the Zhurek device as a foundational technology for future remote and cost-effective screening systems.
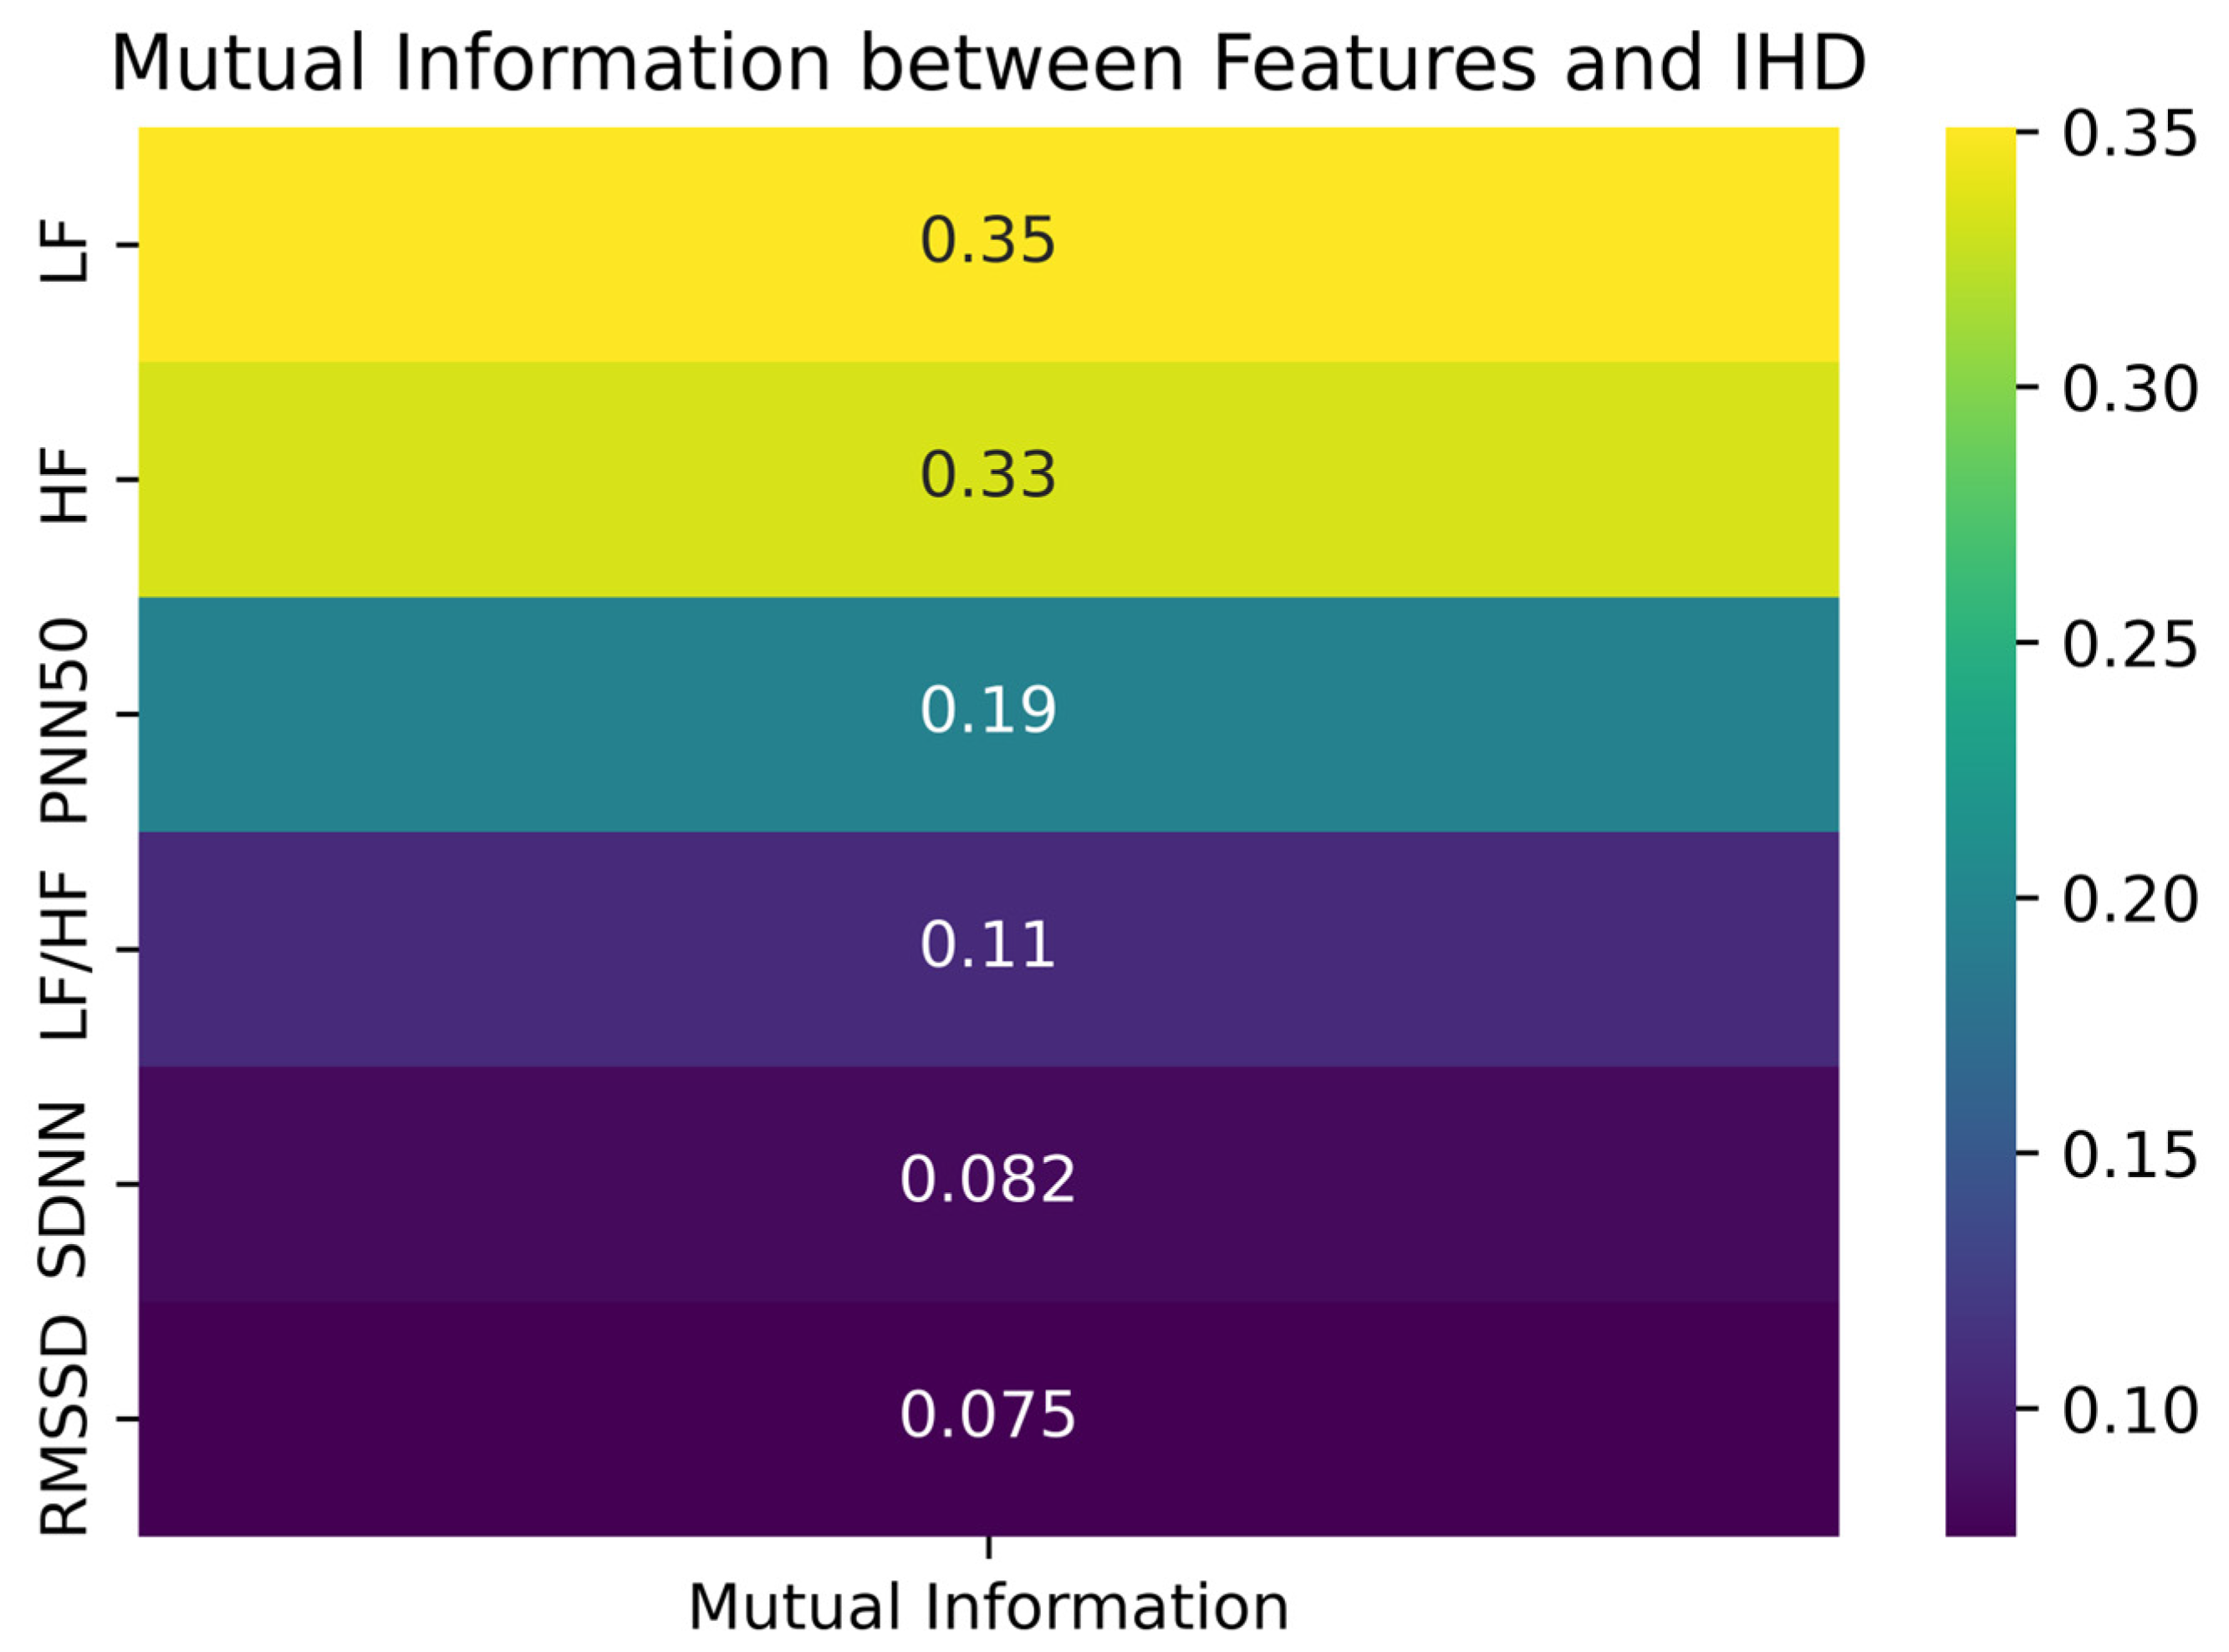
The mutual information analysis revealed that frequency-domain features, particularly LF and HF, were more strongly associated with IHD. To overcome the imbalance in class distribution, particularly due to the small number of healthy control participants, we employed CTGAN to generate synthetic HRV data. While synthetic data cannot fully replicate the complexity of physiological signals, it can approximate their statistical structure and support more balanced learning during model development.
We compared the results of CTGAN-ENN with the conventional hybrid techniques SMOTE-ENN and ADASYN-ENN, and CTGAN-ENN consistently delivered superior AUC, F1-score, and G-mean across six customer-churn datasets [
57]. Our experiments further indicated that classical generative algorithms like SMOTE and ADASYN only worked well in a single dataset, whereas CTGAN-based methods remained robust across all scenarios [
57].
Moreover, the use of synthetic samples provides a practical solution to privacy concerns, reducing the risk of re-identification in health datasets, thereby supporting ethical data sharing practices. Additionally, it facilitates broader access to healthcare datasets, enabling researchers to conduct timely investigations even when access to real clinical data is restricted. Synthetic datasets also serve as a valuable resource for developing and testing software solutions, especially in scenarios where realistic data are unavailable or insufficient. Despite these benefits, synthetic data must be applied with careful consideration of its limitations. Its fidelity depends heavily on the underlying generative model and the quality of the original data used for training. Not all synthetic samples fully replicate the distributions or dependencies present in real datasets, which may introduce biases or affect downstream model performance. Moreover, there remains a recognized risk of data leakage if synthetic generation is not properly managed, and overreliance on imputation models may obscure true physiological variability [
16,
17,
18]. In this study, slight discrepancies were observed in features such as PNN50 and LF/HF, underscoring the need for cautious interpretation.
In probability and information theory, mutual information measures how much two random variables depend on each other. It specifically quantifies how much information is gained about one variable by knowing the value of the other [
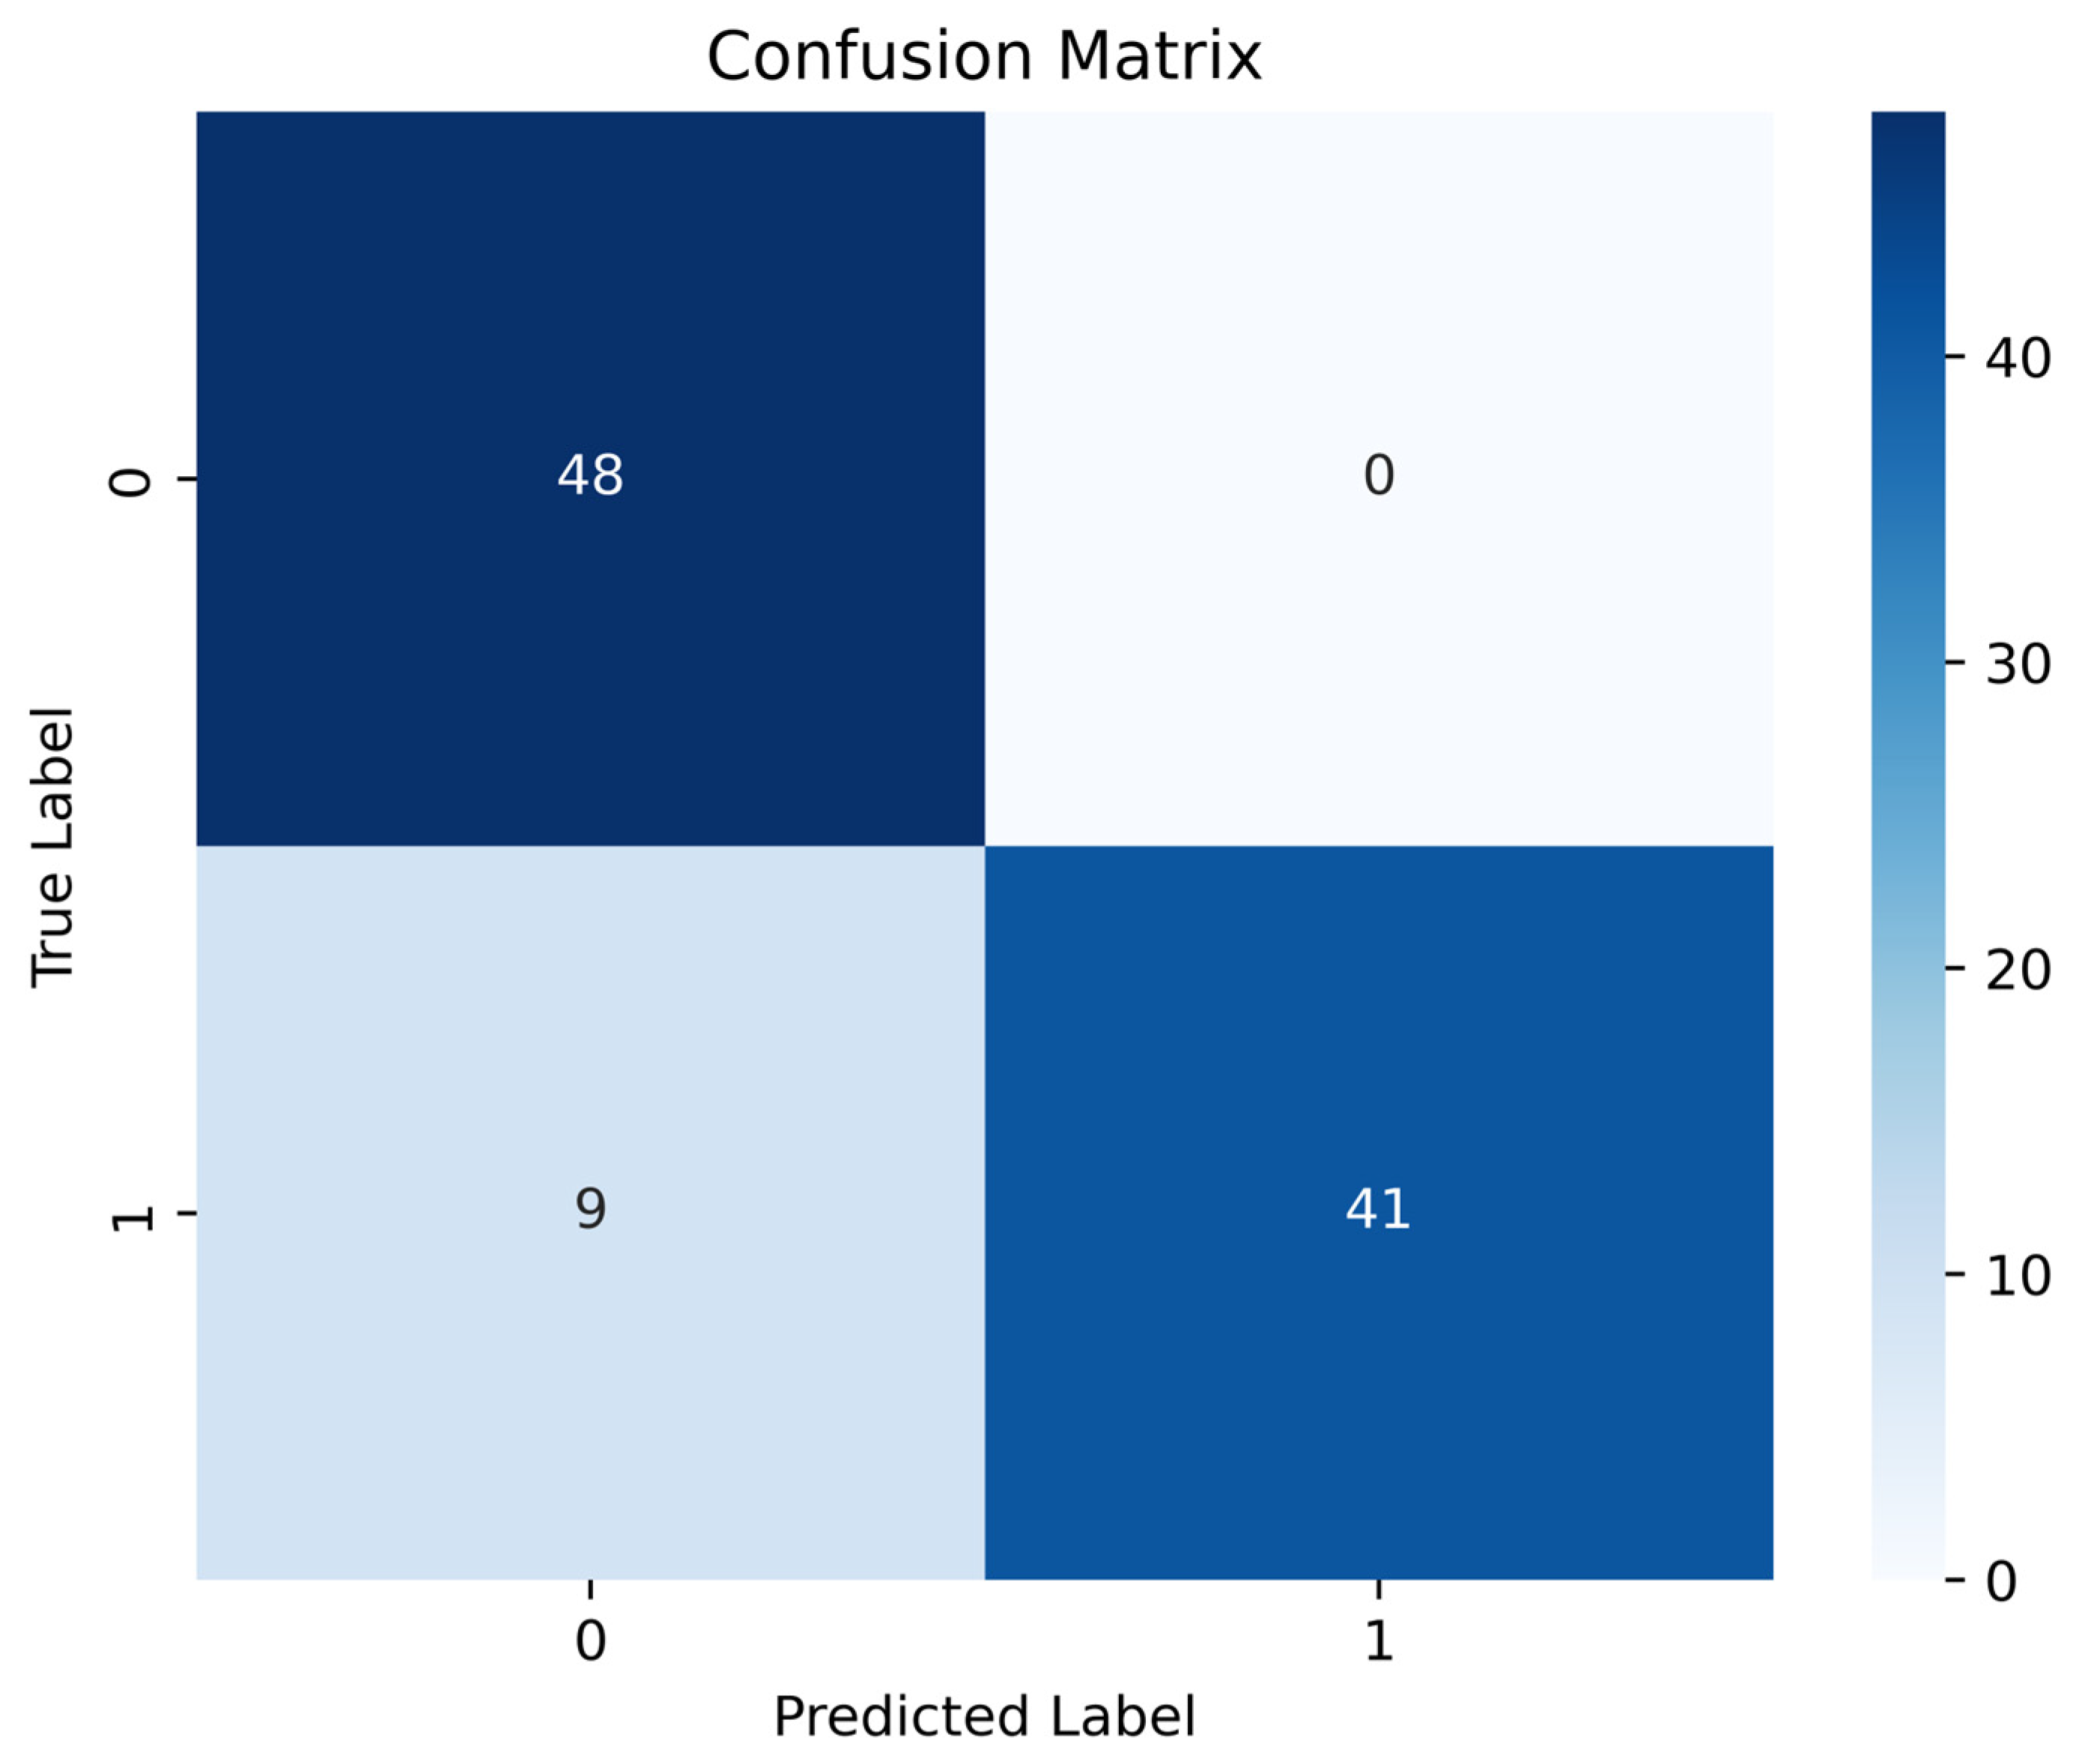
20]. Applied to our dataset, this analysis demonstrated that frequency-domain HRV features (LF and HF) exhibit the strongest dependency on the target variable, suggesting they carry the most relevant physiological signals associated with autonomic imbalance in IHD. Evaluation metrics, including the ROC and precision–recall curves, confirmed the reliability of the classifiers. The high area under the ROC curve (AUC = 0.98) reflects strong sensitivity and specificity, while the histogram of decision scores provides a visual representation of the model’s discriminative ability. The negative class distribution is highly skewed, with a strong peak near a decision score of 0.0, indicating that the model confidently assigns low scores to the majority of samples from this class. Conversely, the positive class distribution is broader, with a noticeable concentration of scores in the high range (0.8–0.9), reflecting the model’s ability to identify a large subset of positive samples with high confidence. However, the histogram also reveals a region of overlap between the two class distributions. This overlap indicates that for a portion of the samples, the model’s predictive certainty is diminished, as both negative and positive class data points occupy this same range. This observation underscores the importance of considering the decision score itself, beyond a simple binary classification, especially for clinical decision support where borderline cases may require further scrutiny. Visualizations using PCA and t-SNE further illustrate the separability between classes. Although some overlap exists—as is typical in biological data—the overall clustering supports the discriminative power of HRV features. These projections also help to interpret the feature space learned by the model and highlight regions of higher classification uncertainty.
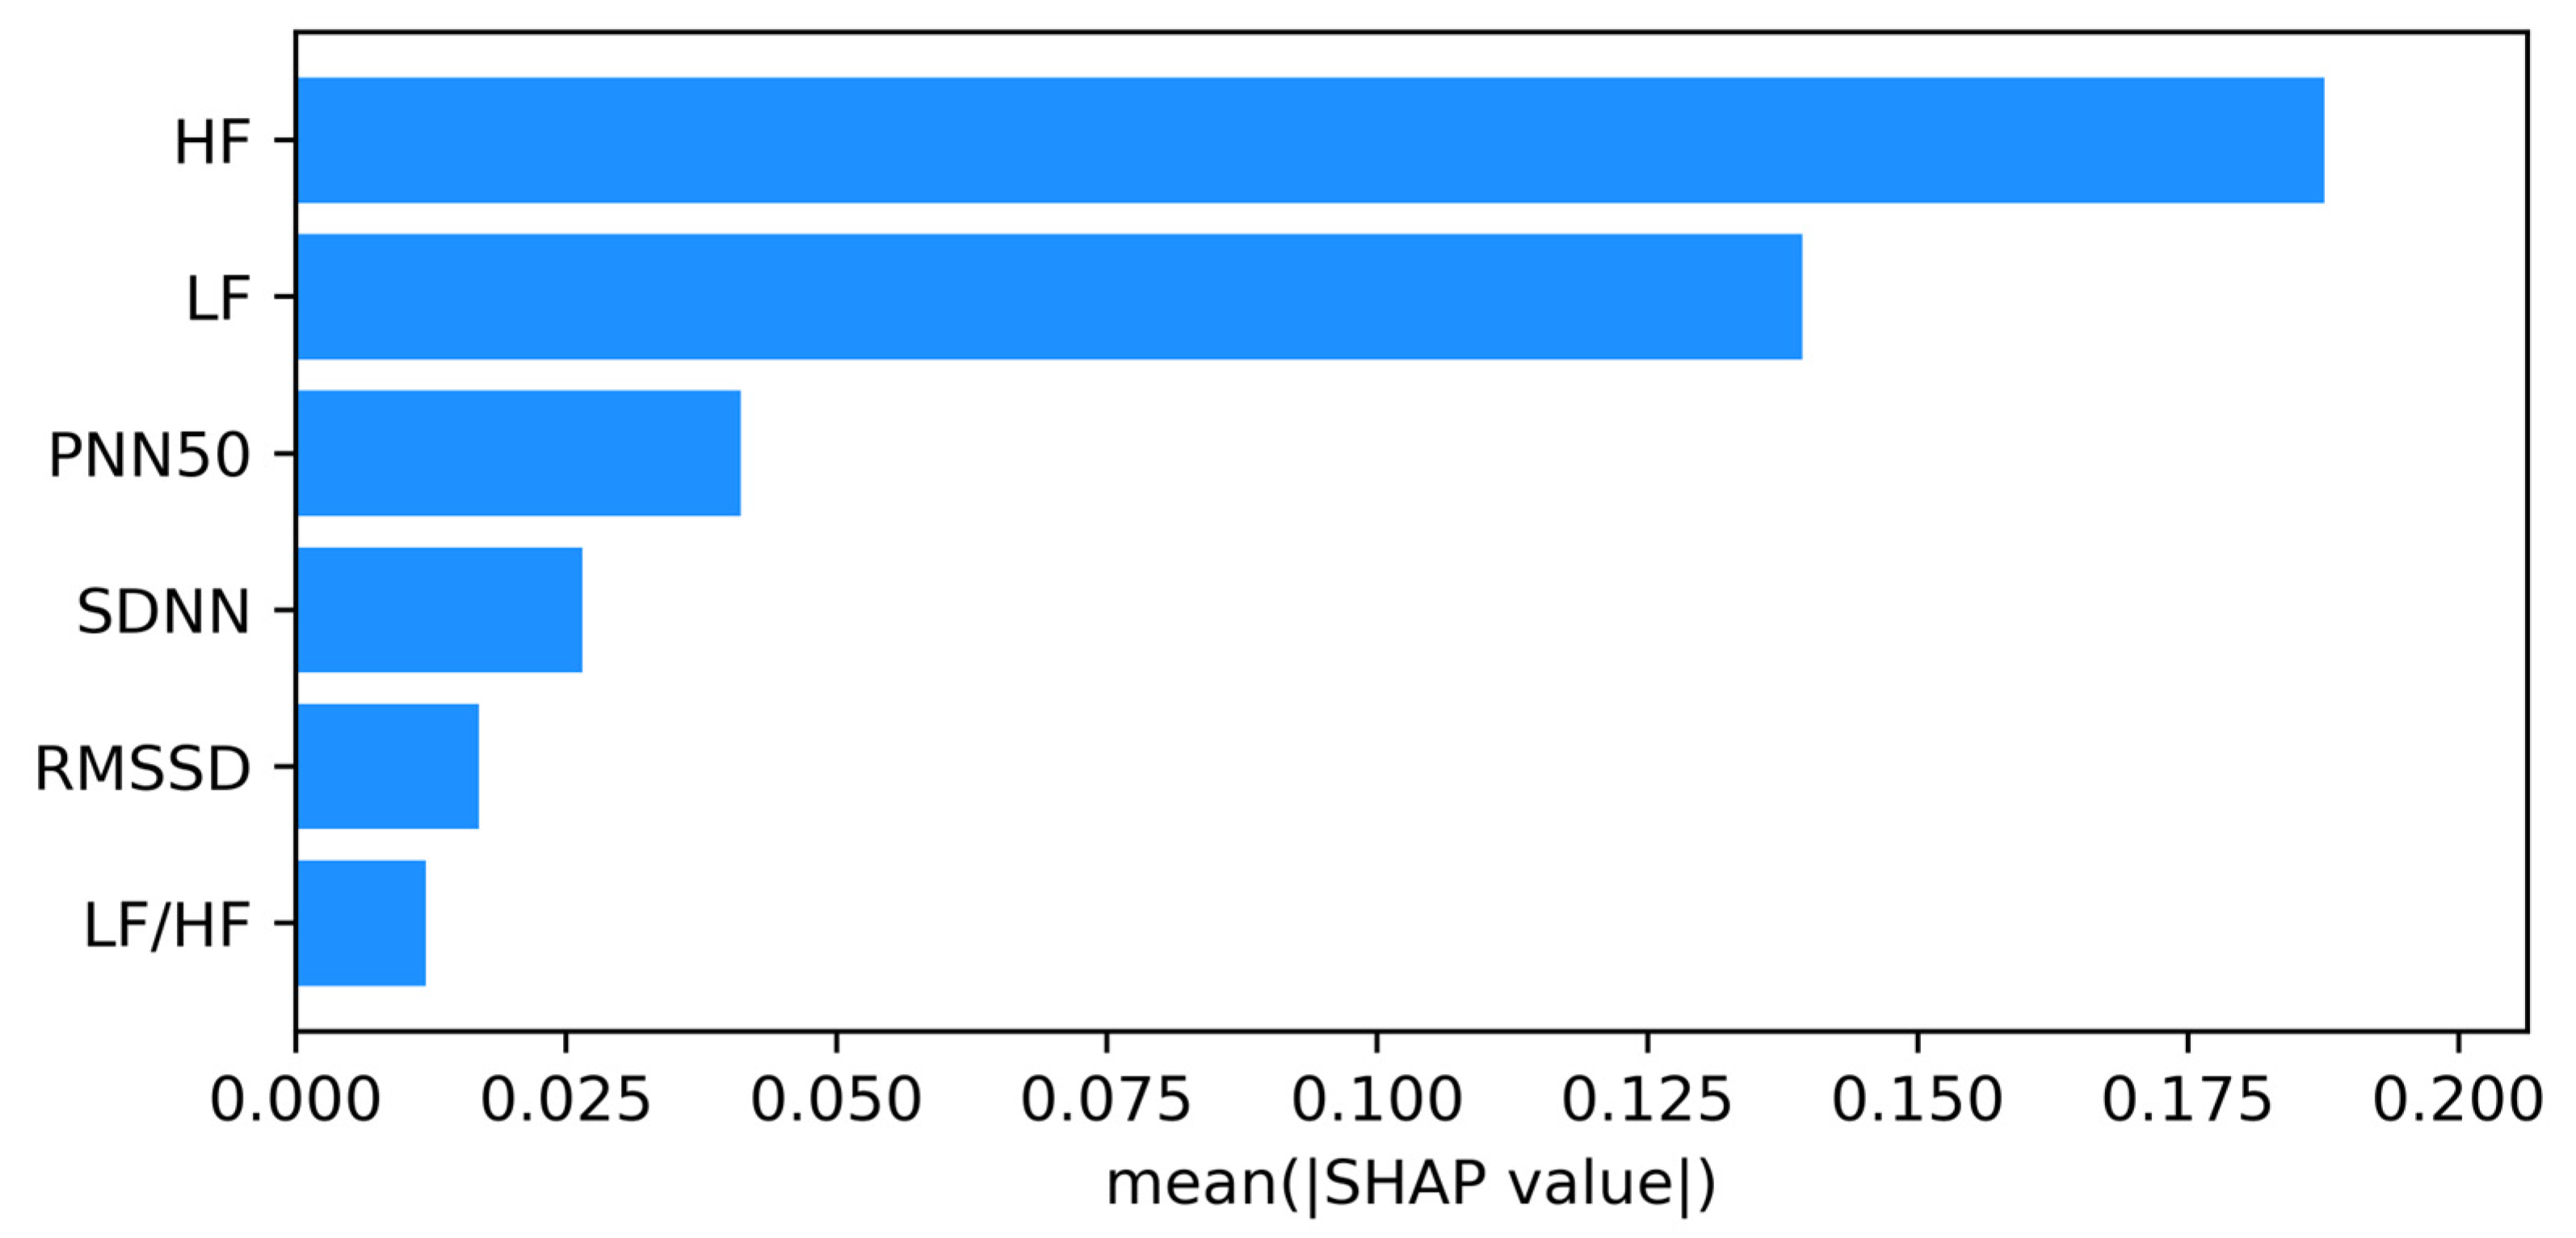
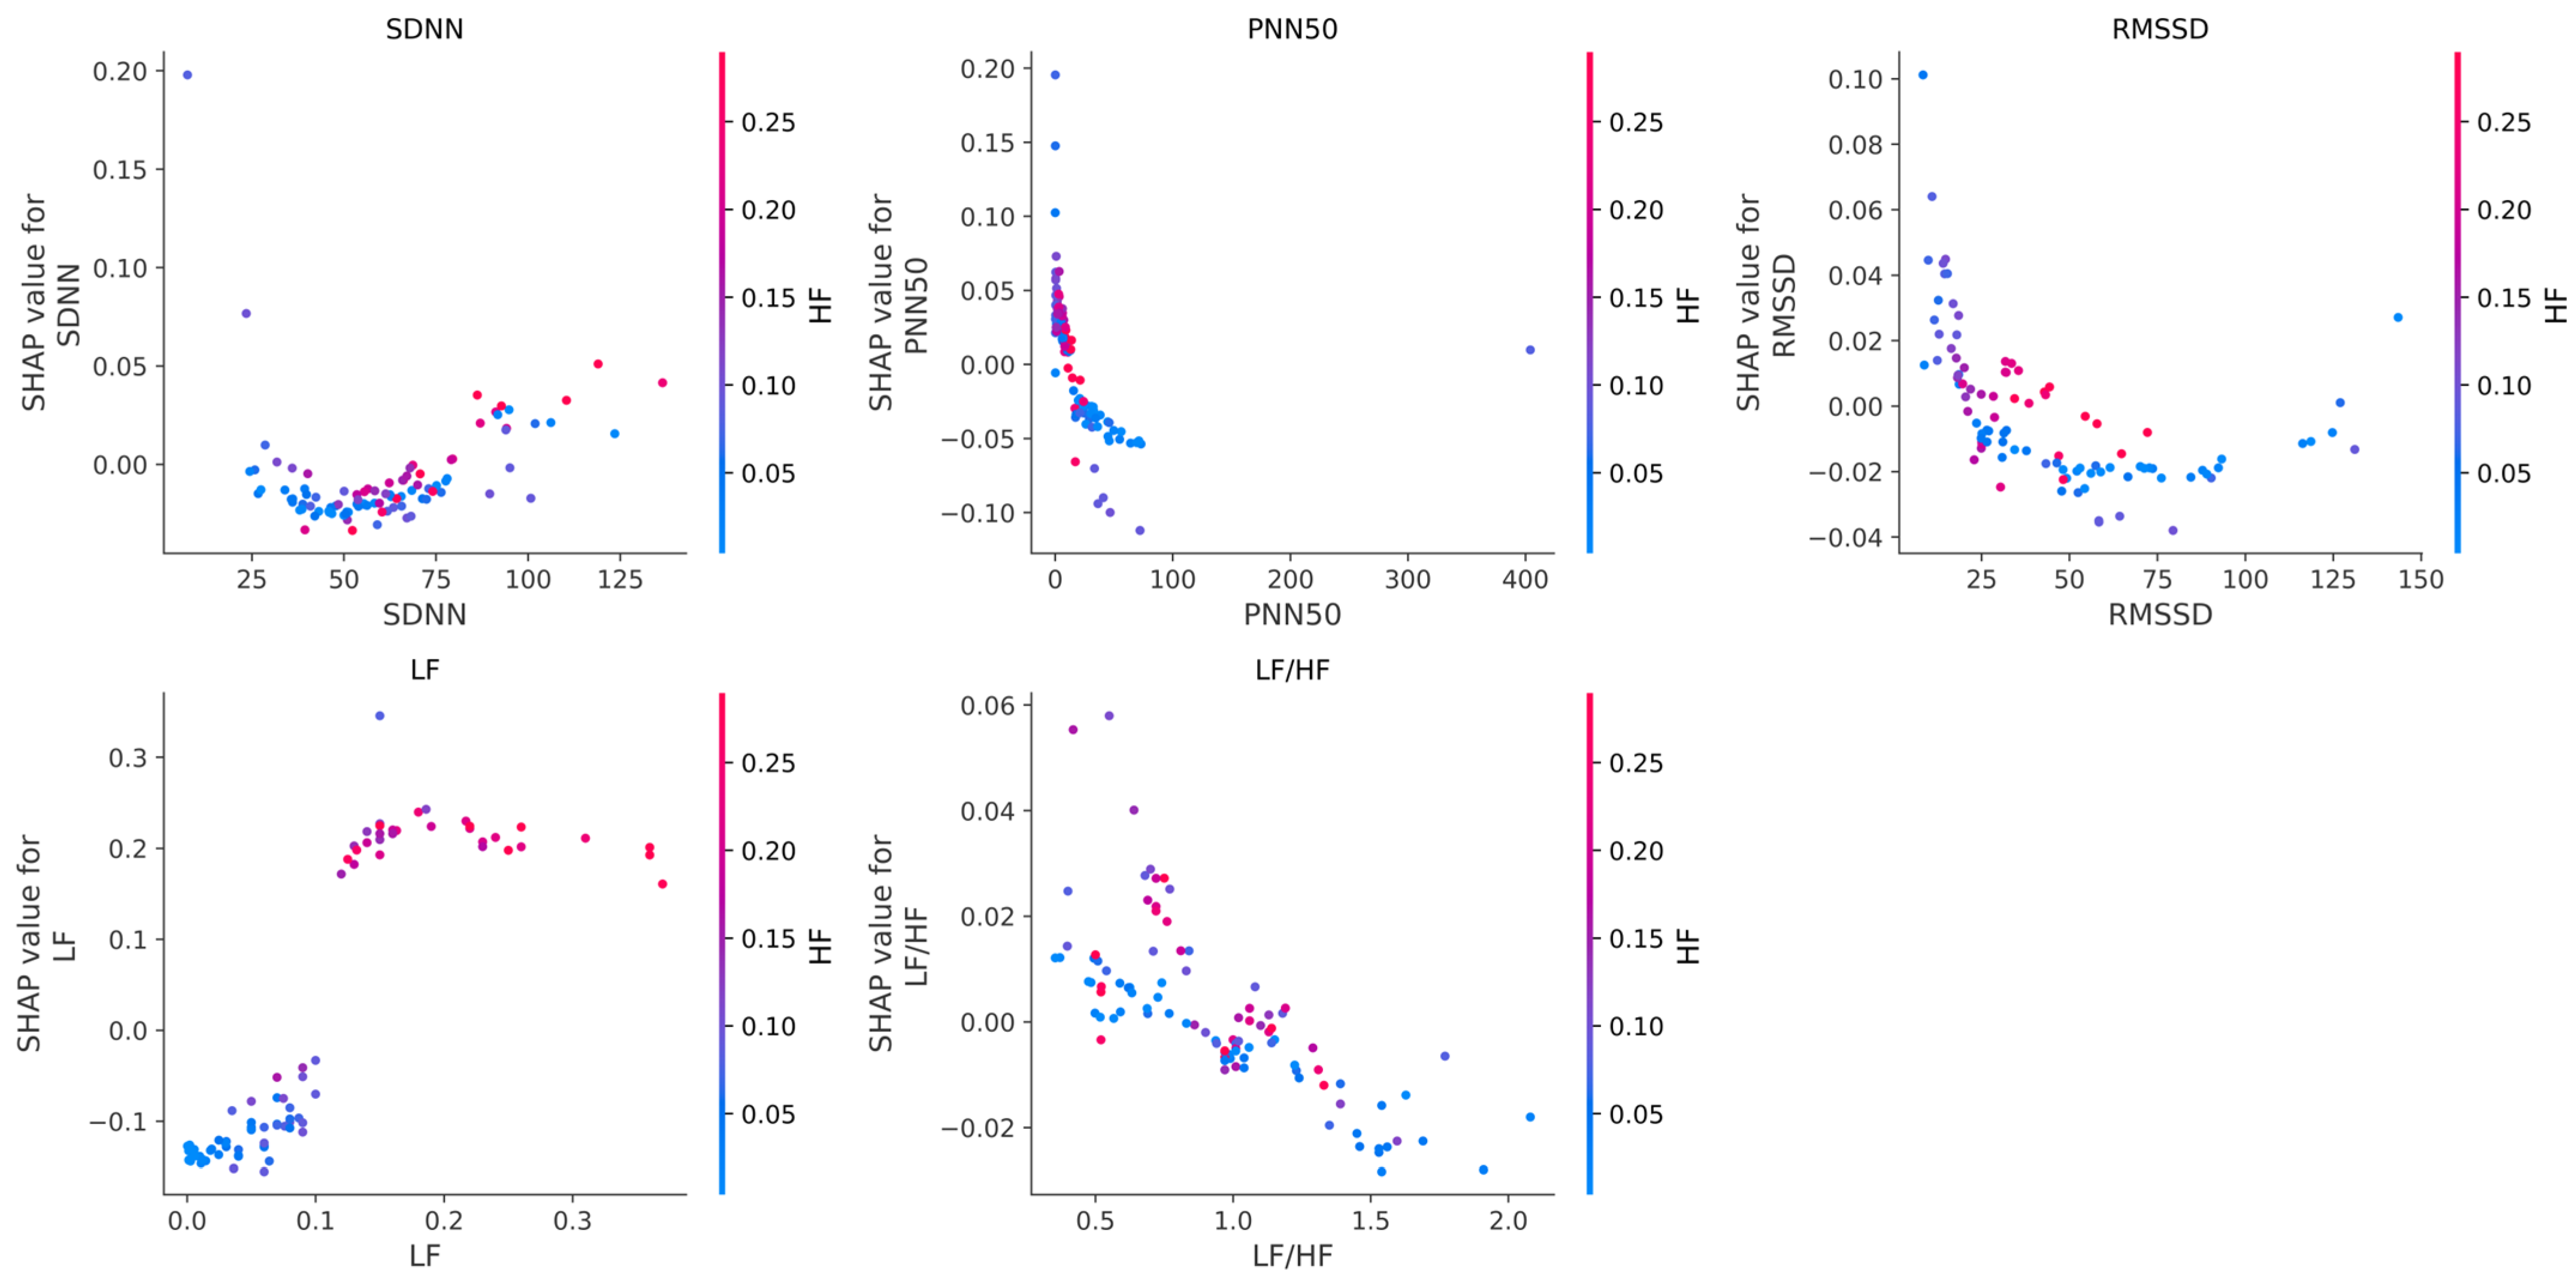
The SHAP analysis revealed that frequency domain features, particularly HF and LF, play a central role in distinguishing between IHD and non-IHD cases. These findings are consistent with physiological evidence linking reduced autonomic function, especially diminished parasympathetic activity, with cardiovascular risk [
21,
34,
36]. The prominence of HF suggests a strong connection between vagal tone and IHD prediction.
Several limitations should be acknowledged in this pilot study. One of the key objectives was to evaluate the performance and reliability of the Zhurek IoT device, which utilizes PPG technology to collect data in real-world, ambulatory conditions. For data verification, we conducted parallel data collection using standard three-lead Holter ECG monitors. While the Holter ECG is a device that records the heart’s electrical activity, allowing for the detection of rhythm disturbances, ischemia, and other issues, PPG, in turn, measures volumetric blood pulsation in peripheral vessels.
This methodological difference determines their respective strengths and weaknesses. Comparative studies confirm that ECG often outperforms other methods in terms of signal quality and respiratory signal extraction [
58]. However, ECG is susceptible to interference and motion artifacts arising from unstable skin contact [
59]. PPG, as an optical technique, measures volumetric changes in blood flow within the microvascular bed. Since PPG captures hemodynamic changes indirectly, factors such as poor peripheral perfusion or incorrect sensor placement (for instance, on the wrist, as with the Zhurek device) can significantly degrade signal quality and reduce diagnostic specificity [
26]. Despite this, modern research indicates that with the use of advanced signal processing algorithms, PPG-based devices can achieve performance comparable to ECG in tasks such as AF detection [
60]. Our work supports this thesis, demonstrating high accuracy (AUC = 0.95) in classifying IHD based on HRV metrics obtained from PPG.
Another significant limitation of this pilot study is the small number of participants, which is particularly noticeable in the healthy control group. A small sample size can reduce the statistical power and the model’s generalization ability, potentially distorting the interpretation of intergroup differences. To address the class imbalance problem, we employed a generative adversarial network, CTGAN, to create synthetic data. While synthetic data cannot fully replicate the complexity of physiological signals, it successfully approximates their statistical structure, which allowed for more balanced model training. Nevertheless, to definitively confirm the obtained results and enhance their reliability, we plan to conduct a larger-scale study with a significantly increased number of participants in both groups.
Furthermore, a critical limitation of this study is that all data were collected from participants exclusively in a resting state. While this controlled approach allowed us to establish a baseline performance and validate the device against the gold-standard Holter under ideal conditions, it does not account for the impact of motion artifacts. PPG signals are notoriously susceptible to corruption from physical activities such as walking or even minor hand movements. The current study did not evaluate the device’s stability or anti-interference capabilities in dynamic, real-world scenarios. Therefore, while our results are promising for resting-state applications, the device’s utility for continuous monitoring during daily life remains to be validated.
Finally, the generalizability of our findings may be limited as the model was trained and validated exclusively on a single-center sample from Kazakhstan. This specific demographic and geographic context means that the model’s performance on other ethnic or regional populations is unknown. It is not possible to rule out potential biases stemming from unique genetic, lifestyle, or environmental factors characteristic of the study population. Therefore, external validation on diverse, multi-center datasets is a necessary next step to confirm the robustness and broader applicability of our model.
6. Conclusions
The pilot study showed that PPG recordings obtained with the “Zhurek” device reproduce HRV metrics with clinically acceptable accuracy. In comparative tests, the deviation from the three-lead Holter monitor was −0.601 bpm for mean HR, +33.1 ms for SDNN, and −4.8 ms for RMSSD. HRV data were obtained from the Research Institute of Cardiology and Internal Medicine; they were recorded using ECG Holter and the custom Zhurek IoT device. The ML models trained on HRV features showed promising results in classifying individuals with and without IHD. Among them, the RF model achieved the highest accuracy of 90.82%, demonstrating strong performance across precision (92.11%), recall (91.00%), and F1-score (90.11%) metrics. Testing conducted exclusively on real data confirmed the model’s high efficacy: at the optimal cutoff threshold, the sensitivity was 88%, and the specificity was 100%. The use of CTGAN for synthetic data generation addressed the class imbalance issue by expanding the healthy control group from 50 to 250 samples, contributing to improved model generalizability and robustness. Analysis of the model’s internal logic using the SHAP method showed that the contribution of each HRV feature to the prediction of IHD is modulated by changes in parasympathetic activity, as reflected in the high-frequency (HF) component. It was established that in cases of sympathovagal imbalance and low vagal tone (low HF values), metrics such as LF/HF, LF, and RMSSD were the primary contributors to an increased risk of IHD. Conversely, in the presence of strong parasympathetic modulation (high HF values), features like SDNN, PNN50, and RMSSD played a protective role in the prediction. These results underscore that the model identified non-linear, multivariate dependencies, and that the predictive value of HRV markers is context-dependent and dynamically influenced by autonomic balance.
These findings confirm that the IoT device Zhurek is a viable and affordable platform for ambulatory HRV monitoring, and that the intelligent models developed using its data can be effectively applied to the early risk detection of IHD.
Our future work will focus on evolving the Zhurek IoT device from a validated prototype into a scalable, intelligent platform for proactive cardiovascular health management. Addressing the limitations of the current pilot study is our immediate priority.
First, and most critically, we will move our analysis from a controlled resting state to dynamic, real-world conditions. Future research will be aimed at conducting experiments to assess the device’s noise immunity during various activities, such as walking and jogging. Concurrently, we will focus on developing and implementing advanced algorithms to suppress the motion artifacts inherent in PPG signals, which is essential for reliable ambulatory monitoring.
To further enhance the robustness and generalizability of our models, we will markedly increase the sample size, particularly in the healthy volunteer cohort, to improve statistical power. Critically, we plan to conduct external validation using multi-center and multi-ethnic datasets to ensure our model performs well across diverse populations and is free from the geographic or genetic biases identified in this study. We will also broaden the feature set by incorporating non-linear, geometric, and segment-based HRV indices, along with relevant clinical covariates, to create a more comprehensive picture of cardiovascular health.
The ultimate goal is to integrate the validated device with interpretable ML models. This will enable continuous ambulatory heart monitoring, provide early alerts for at-risk groups, and facilitate personalized treatment strategies. Collectively, these steps will help lessen the burden of CVDs through early intervention and proactive health management.

