1. Introduction
Fiber-reinforced polymer (FRP) composites are materials in which fibers and their products serve as reinforcement and synthetic resins act as the matrix [
1]. Owing to their high specific strength, corrosion resistance, light weight, and design flexibility, FRP composites have been widely used in civil engineering, transportation, electrical equipment, aerospace, and wind-energy systems [
2,
3]. With the rapid expansion of these applications, especially the large-scale use of thermoset glass-fiber-reinforced polymer (GFRP) in wind-turbine blades, the disposal of end-of-life composite products has become an increasingly important environmental issue. Because most of these materials are non-biodegradable and difficult to remanufacture once cured, their continued accumulation may impose considerable long-term environmental burdens if effective recycling routes are not developed [
4].
Among the available treatment options for waste composites, mechanical recycling is generally regarded as one of the most economical and industrially feasible routes. It is currently the most widely used commercial recycling technology for glass- and carbon-fiber composites, exhibits relatively low energy consumption compared with other recycling methods, and can effectively reduce the environmental risks associated with retired wind-turbine blades and other composite wastes [
5,
6,
7]. However, the practical value of mechanically recycled GFRP depends strongly on how it can be reused in downstream applications. In recent years, cement-based materials have been considered a promising outlet because they can consume large volumes of recycled composite waste while also benefiting from the filling and crack-bridging effects of recycled fibers and powders.
Existing studies have shown that the influence of rGFRP on cementitious materials is closely related to the morphology, particle size, fiber length, dosage, and replacement mode of the recyclate. Farinha [
8], Zhou [
9], and Bu [
10] incorporated recycled GFRP into mortar or cement paste systems and reported improvements in mechanical performance under suitable conditions. Ribeiro [
11] added rGFRP to precast concrete blocks and observed enhanced properties; Asokan [
12] used GFRP waste as a partial replacement for fine aggregate and found improvements in both mechanical and durability performance; and Garcia [
13] further demonstrated that recycled GFRP can act as short-fiber reinforcement and significantly increase the flexural and compressive strengths of microconcrete. At the same time, other studies have noted that excessive replacement ratios or unsuitable recycled forms may reduce workability and even deteriorate hardened properties [
14,
15,
16,
17,
18,
19]. These findings suggest that recycled FRP should not be regarded as a uniform material, but rather as a family of recycled constituents with different reinforcing and filling roles depending on their geometry and load-transfer characteristics. Overall, rGFRP has shown clear potential in concrete, especially for crack control and post-cracking resistance, but its effectiveness still needs to be evaluated in relation to specific structural forms and loading conditions.
This issue is particularly relevant to concrete pipe structures. Concrete pipes are widely used for the conveyance of water, sewage, oil, and other fluids, and they usually operate in buried environments where load-carrying capacity, serviceability, and durability are all critical. In conventional reinforced concrete pipes, circumferential reinforcement is typically used to enhance bending resistance; however, steel corrosion remains a key concern in long-term service, especially when cracks allow moisture, chloride ions, or aggressive substances in wastewater to reach the reinforcement [
20]. Once corrosion initiates, crack propagation, stiffness degradation, and durability loss may accelerate. Therefore, replacing steel reinforcement with corrosion-resistant GFRP bars offers an attractive alternative for pipe structures exposed to aggressive environments.
Against this background, the structural use of GFRP bars in concrete has received extensive attention. Compared with steel reinforcement, GFRP bars exhibit excellent corrosion resistance and high tensile strength, but they also possess distinctive mechanical characteristics, including a lower elastic modulus, an almost linear-elastic response up to rupture, and bond behavior that depends strongly on surface treatment. These characteristics mean that GFRP-reinforced concrete members often face more demanding serviceability issues, particularly in terms of crack width and deflection control. Shabani [
21] showed that fiber incorporation can improve the flexural and serviceability response of GFRP-reinforced concrete beams. Bui [
22] found that the equivalent reinforcement ratio and FRP bar type significantly affect the load-carrying capacity and deformation performance of reinforced concrete beams. Sun [
23,
24] further reported that hybrid-reinforced concrete beams and FRP-reinforced concrete beams can provide favorable corrosion resistance together with competitive structural performance. Other studies have also emphasized the importance of bond characteristics and reinforcement configuration in determining crack development, stiffness variation, and failure mode in GFRP-reinforced members [
25,
26,
27,
28]. These results indicate that although GFRP bars are promising substitutes for steel, their application in concrete structures must be accompanied by careful evaluation of cracking behavior and service performance.
For concrete pipes, such concerns are even more critical because crack width directly affects leakage resistance, durability, and serviceability assessment under external loading. Existing studies on the TEB behavior of concrete pipes have mainly focused on conventional reinforced concrete pipes, steel-fiber-reinforced concrete pipes, and synthetic-fiber-reinforced concrete pipes. These studies have shown that fiber addition can improve crack distribution, toughness, and load-carrying performance, and that pipe diameter, reinforcement form, and material composition all affect the response of pipes under external load [
29,
30,
31]. Nevertheless, most available research still centers on traditional reinforcement systems or single-fiber modification. Studies on concrete pipes simultaneously reinforced with GFRP bars and recycled rGFRP fibers remain very limited, especially under TEB conditions where circumferential bending governs the structural response.
This study investigates the load-carrying and cracking behavior of concrete pipes reinforced with rGFRP fibers and GFRP bars under TEB conditions. At the cracked section, a fiber-bridging characterization approach is introduced with crack width as the core variable; combined with Monte Carlo random distribution and single-filament pull-out test fitting, the “bond-slip-pull-out” contribution of fibers is quantified. On this basis, TEB tests on specimens with different reinforcement types and fiber dosages are conducted to validate the model, clarify the inhibition effect of rGFRP fibers on crack initiation and propagation, and reveal the mechanisms governing differences in crack control and ultimate capacity when GFRP bars replace steel bars. The results provide experimental data and theoretical support for crack-resistant design and capacity prediction of concrete pipes using recycled GFRP materials.
2. Method for Calculating TEB Load-Carrying Capacity Considering Crack Width and Fiber Bridging
In the structural performance evaluation of concrete drainage pipes, the three-edge bearing (TEB) test is an internationally recognized standard loading method (e.g., ASTM C497 [
32] and GB/T 11836 [
33]). Under the boundary condition of a crown line load with two side supports, this test reasonably simulates the typical circumferential stress state of pipes subjected to backfill soil pressure, surface concentrated loads, or uneven foundation reactions. Under TEB loading, the pipe primarily behaves as a ring structure in which bending moments dominate, accompanied by a certain axial-force effect. Tensile stress concentrations generally develop at the crown and invert, as well as in the vicinity of the supports, leading to a progressive failure process characterized by the elastic stage, cracking stage, stable crack propagation stage, and ultimate capacity stage. In engineering design and durability assessment, pipes are often governed not only by material strength but also by serviceability indicators such as crack width, deflection, and crack growth rate. Therefore, traditional simplifications, such as equating cracking with failure or neglecting post-cracking tensile contributions, are insufficient to accurately characterize the actual load-carrying and deformation behavior of reinforced and fiber-composite pipe systems under TEB conditions.
2.1. Theoretical Modeling and Basic Assumptions
To balance computational tractability and engineering applicability, the following assumptions are adopted:
Under TEB loading, the pipe is assumed to satisfy the small-deformation condition, and the influence of geometric nonlinearity on internal-force redistribution is neglected. The circumferential section is further assumed to remain plane, which facilitates the establishment of flexibility coefficients and compatibility equations based on the virtual work method.
- 2.
Stage-wise load-sharing assumption
Elastic stage (uncracked): Concrete, GFRP bars, and fibers are assumed to deform compatibly. Because short fibers primarily function through interfacial bonding, their contribution to the global stiffness may be represented by an equivalent stiffness in the internal-force analysis or considered separately in the sectional capacity calculation.
Post-cracking stage: The tensile concrete is assumed to cease carrying load, and the stress in the tensile-zone concrete is neglected. The sectional tensile force is resisted by the tensile force in the GFRP (or steel) bars together with the fiber-bridging tensile force across the crack plane. The compression zone is carried by concrete and is simplified using an equivalent stress block.
- 3.
Linear elasticity and failure criterion assumption
When establishing the flexibility coefficients in the force-method formulation, the materials are assumed to behave linearly elastically prior to failure, consistent with the basis of the virtual displacement calculation. The ultimate limit state is assumed to be governed by either crushing of the concrete in the compression zone or rupture of the GFRP bars.
Applicability: This method is applicable to reinforced concrete or FRP-reinforced concrete pipes whose geometry and loading conform to the standard TEB configuration, particularly for pipes containing short fibers, in which crack width and fiber-bridging effects need to be explicitly considered. It is not applicable to cases involving severe local indentation, pronounced slip, impact or dynamic effects. It is not applicable to cases with severe local indentation, pronounced slip, or impact/dynamic effects.
Under TEB conditions, a rigid loading beam applies a vertical concentrated load at the crown, while two parallel support beams provide reactions at the bottom sides, forming a typical “top load–bottom supports” configuration, as shown in
Figure 1a. Because the loading and support conditions are symmetric with respect to the vertical mid-plane, and the pipe behaves as an axisymmetric ring, the circumferential internal-force distribution is also symmetric.
For simplification, only a semi-ring is modeled, as shown in
Figure 1b, and the cut at the axis of symmetry is treated as a statically indeterminate system with two redundant constraints. For statically indeterminate structures, the redundant forces can be solved using either the force method or the displacement method. In this study, the force method in structural mechanics is adopted. Specifically, the compatibility equations are formulated in the form of a “basic structure + redundant forces” system, and the flexibility coefficients are determined using the unit-load method to solve for the redundant forces and recover the actual internal forces in the closed ring.
This simplification preserves the essential boundary conditions and the statically indeterminate nature of the TEB “top load–bottom supports” configuration, thereby enabling effective evaluation of the bending moment and axial force distributions at critical sections, such as the crown, invert, and regions near the supports.
2.2. Pull-Out Force Model for rGFRP Fibers
The bridging force provided by an individual fiber is related to its effective embedded (bond) length, as expressed in Equation (1). To establish the relationship between bond force and embedded length, the single-filament pull-out test shown in
Figure 2a was conducted, and the corresponding experimental results are presented in
Figure 2b. It can be seen that the force carried by a short fiber is approximately linearly correlated with its embedded length, which is consistent with the trend indicated by Equation (1). Therefore, a linear function is adopted to fit the single-filament pull-out test data, thereby completing the expression for calculating bond force as a function of embedded length.
where
denotes the bond area between the rGFRP fibers and concrete, and
represents the interfacial bond strength between the rGFRP fibers and the concrete matrix.
2.3. Internal Force Analysis of the Ring Structure
According to the force method in structural mechanics, for an
-degree statically indeterminate structure, it is necessary to establish
deformation compatibility equations to solve for the redundant unknown forces. It is assumed that concrete, rGFRP fibers and GFRP bars all remain in the linear elastic deformation stage prior to failure, and their stress-strain relationship conforms to Hooke’s law. This assumption provides the basis for the virtual displacement calculation. In this paper, the unit-load method is adopted to determine the flexibility coefficients. The unknown forces are denoted as
and
, as shown in
Figure 3.
Based on Zhang’s derivation [
34], the unknown forces is
where the coefficients
Once the unknown forces are determined, the internal forces of the closed ring structure under TEB loading can be obtained, as shown in Equation (4):
where
represent the internal forces in the tube wall when only
acts on the primary structure;
represent the internal forces in the tube wall when only
acts on the primary structure, as shown in Equation (5):
2.4. Sectional Load-Carrying Capacity Calculation
The sectional forces of the concrete pipe are assumed to consist of the following components: the concrete compressive resultant, represented using the equivalent rectangular stress block specified in ACI 318 [
35]; the tensile force provided by the circumferential reinforcement, treated as a concentrated force; and the tensile force provided by the short fibers, taken as the resultant of all short fibers. In particular, for concrete containing rGFRP short fibers, the fiber-bridging force at the cracked section cannot be neglected.
Based on the sectional force diagram of the pipe shown in
Figure 4, the mechanical equilibrium equations are established, as shown in Equation (6):
where
is the sum of the tensile forces provided by all short fibers, and
is the sum of the moments provided by all short fibers about the centroid of the concrete compression zone.
2.5. Short-Fiber Force Calculation Considering Crack Width
The key to quantifying the fiber-bridging force is the introduction of crack width into the sectional equilibrium analysis. After cracking, the short fibers spanning the crack plane generate pull-out resistance through interfacial bonding, thereby forming a bridging tensile force. To capture the controlling effect of crack width on the bridging force, the following equivalent description is adopted:
The crack is idealized as a planar state without local warping, with a maximum opening
, and the crack width is assumed to vary linearly along the depth direction. The tensile stress of concrete in the crack zone is neglected, as shown in
Figure 5.
The crack width is assumed to vary approximately linearly along the crack depth, as follows:
Due to the randomness of fiber position, orientation, and bond length, the Monte Carlo random sampling method is adopted to generate
fibers crossing the crack plane. The bridging contribution of each fiber is calculated individually, and the resultant axial force
and moment contribution
are obtained by summing the contributions of all fibers.
The position and bond length of the short fibers are assumed to be random. According to the actual distribution characteristics, in the Monte Carlo random sampling procedure, the position coordinate of the short fibers is assumed to be uniformly distributed over , and the bond length is uniformly distributed over .
The orientations of the short fibers are randomly distributed in three-dimensional space. Accordingly, the probability density function of the angle
between the short fibers and the crack plane is given as follows:
The fiber number
is determined using the calculation method for the number of fibers on a concrete cross-section proposed by Zhao [
36]:
where
is the fiber orientation coefficient,
is the volume of the concrete pipe,
is the fiber volume fraction,
is the side length of the specimen perpendicular to the cross-section, and
is the cross-sectional area of the rGFRP short fibers, calculated by Equation (11).
where
is the diameter of the rGFRP short fibers.
2.6. Section Summary
This section proposes a calculation method for the TEB load-carrying capacity that accounts for crack width and the bridging effect of rGFRP short fibers. At the control section, an equilibrium framework consisting of the equivalent concrete compression stress block, the tensile force of the main reinforcement, and the tensile force provided by fiber bridging is established. Combined with single-filament pull-out tests and Monte Carlo simulations, the contribution of fiber bridging is quantitatively evaluated. This framework provides the basis for the subsequent experimental comparison and parameter determination.
3. Specimens and Test Program
3.1. Specimen Design and Materials
To systematically evaluate the synergistic and individual effects of rGFRP short fibers and GFRP bars on the mechanical performance of concrete drainage pipes, four categories of comparative specimens were designed, with two replicates in each category, resulting in a total of eight concrete pipe specimens. All specimens were designed, fabricated, and cured in strict accordance with the national standard GB/T 11836-2023, Concrete and reinforced concrete drainage pipes [
33], to ensure the standardization and comparability of the test results.
The geometric parameters of the large-diameter specimens were uniformly specified as follows: length of 2000 mm, outer diameter of 600 mm, and wall thickness of 100 mm, thereby forming a standard ring section. The concrete matrix consisted of concrete with a specified cube compressive strength of 40 MPa, and the mix proportion was optimized through laboratory trial mixes.
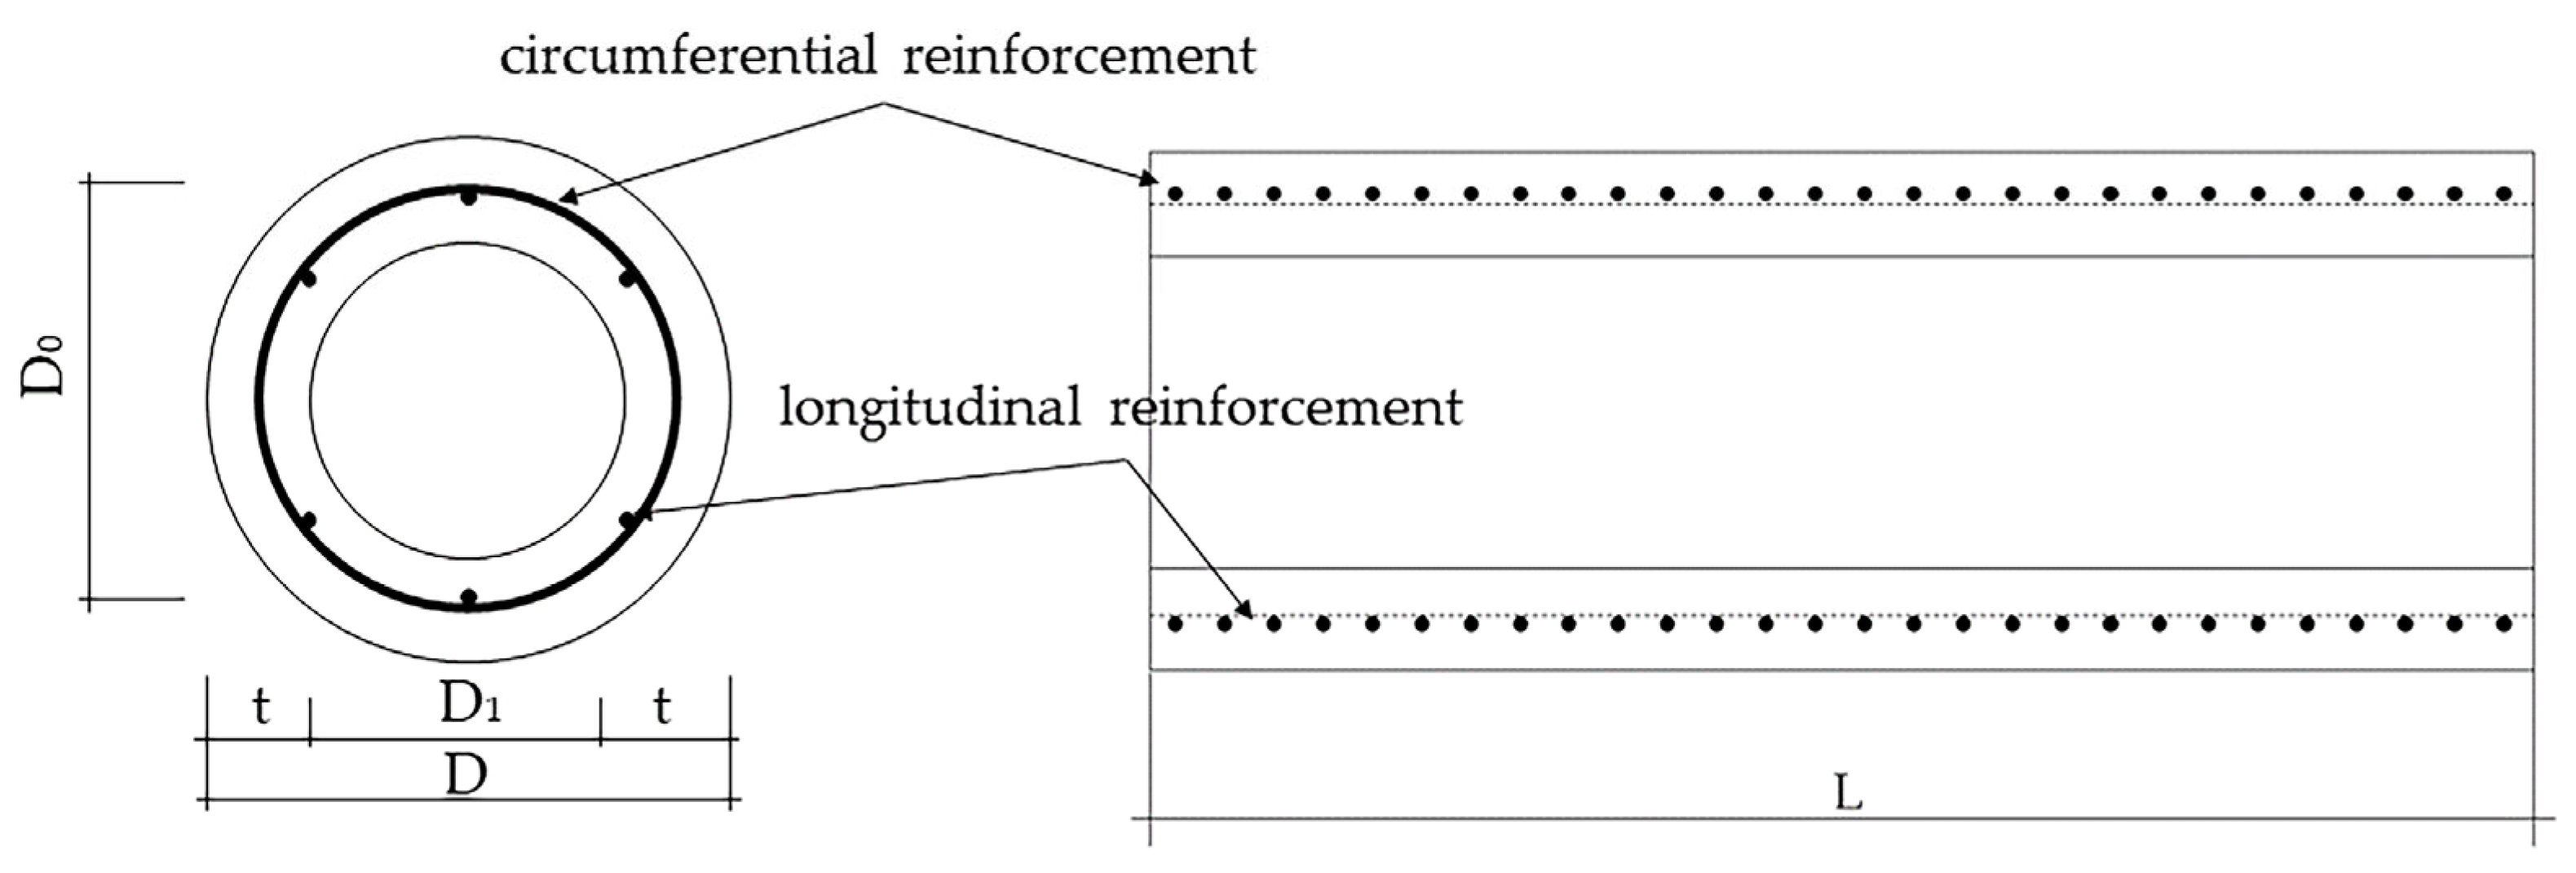
For the reinforcement layout, 12 longitudinal distribution bars with a diameter of 6 mm were uniformly arranged along the circumference, as shown in
Figure 6. The circumferential load-carrying reinforcement consisted of 28 closed rings with a diameter of 6 mm and a spacing of approximately 70 mm. Two types of main reinforcement were used: HRB400 hot-rolled ribbed steel bars and GFRP bars, both provided with spiral ribs to enhance mechanical interlock with the concrete. The nominal cross-sectional areas of the two types of bars were identical, ensuring the same reinforcement ratio. For both the steel-bar and GFRP-bar specimens, the longitudinal and circumferential bars were tied together using steel wire.
In the figure, denotes the position of the circumferential reinforcement, and denotes the pipe length.
The geometric parameters of the small-diameter specimens were uniformly specified as follows: length of 300 mm, outer diameter of 380 mm, and inner diameter of 315 mm, thereby forming a standard ring section. The concrete matrix consisted of concrete with a specified cube compressive strength of 40 MPa, and the mix proportion was optimized through laboratory trial mixes.
The rGFRP short fibers were produced from waste wind-turbine blades through cutting, crushing, and screening. The fibers had a length of 6 mm and a nominal diameter of approximately 0.5 mm, with an irregular flat shape. The fibers were incorporated into the concrete mixture at a volume fraction of 1%. To ensure uniform dispersion, a “dry mixing followed by wet mixing” procedure was adopted: cement, sand, aggregate, and fibers were first dry-mixed for 3 min, after which water and superplasticizer were added and wet-mixed for 4 min until no obvious fiber agglomeration was observed.
The specimen IDs and key parameters are listed in
Table 1.
All specimens were cast in steel molds and compacted using an internal vibrator. After 24 h, the specimens were demolded and cured for 28 days in a standard curing room at 20 ± 2 °C and a relative humidity of at least 95%. They were then stored in the laboratory environment for 7 days at 23 ± 2 °C and a relative humidity of 50% to stabilize their moisture content prior to the loading tests.
3.2. Loading Setup for External Pressure Tests
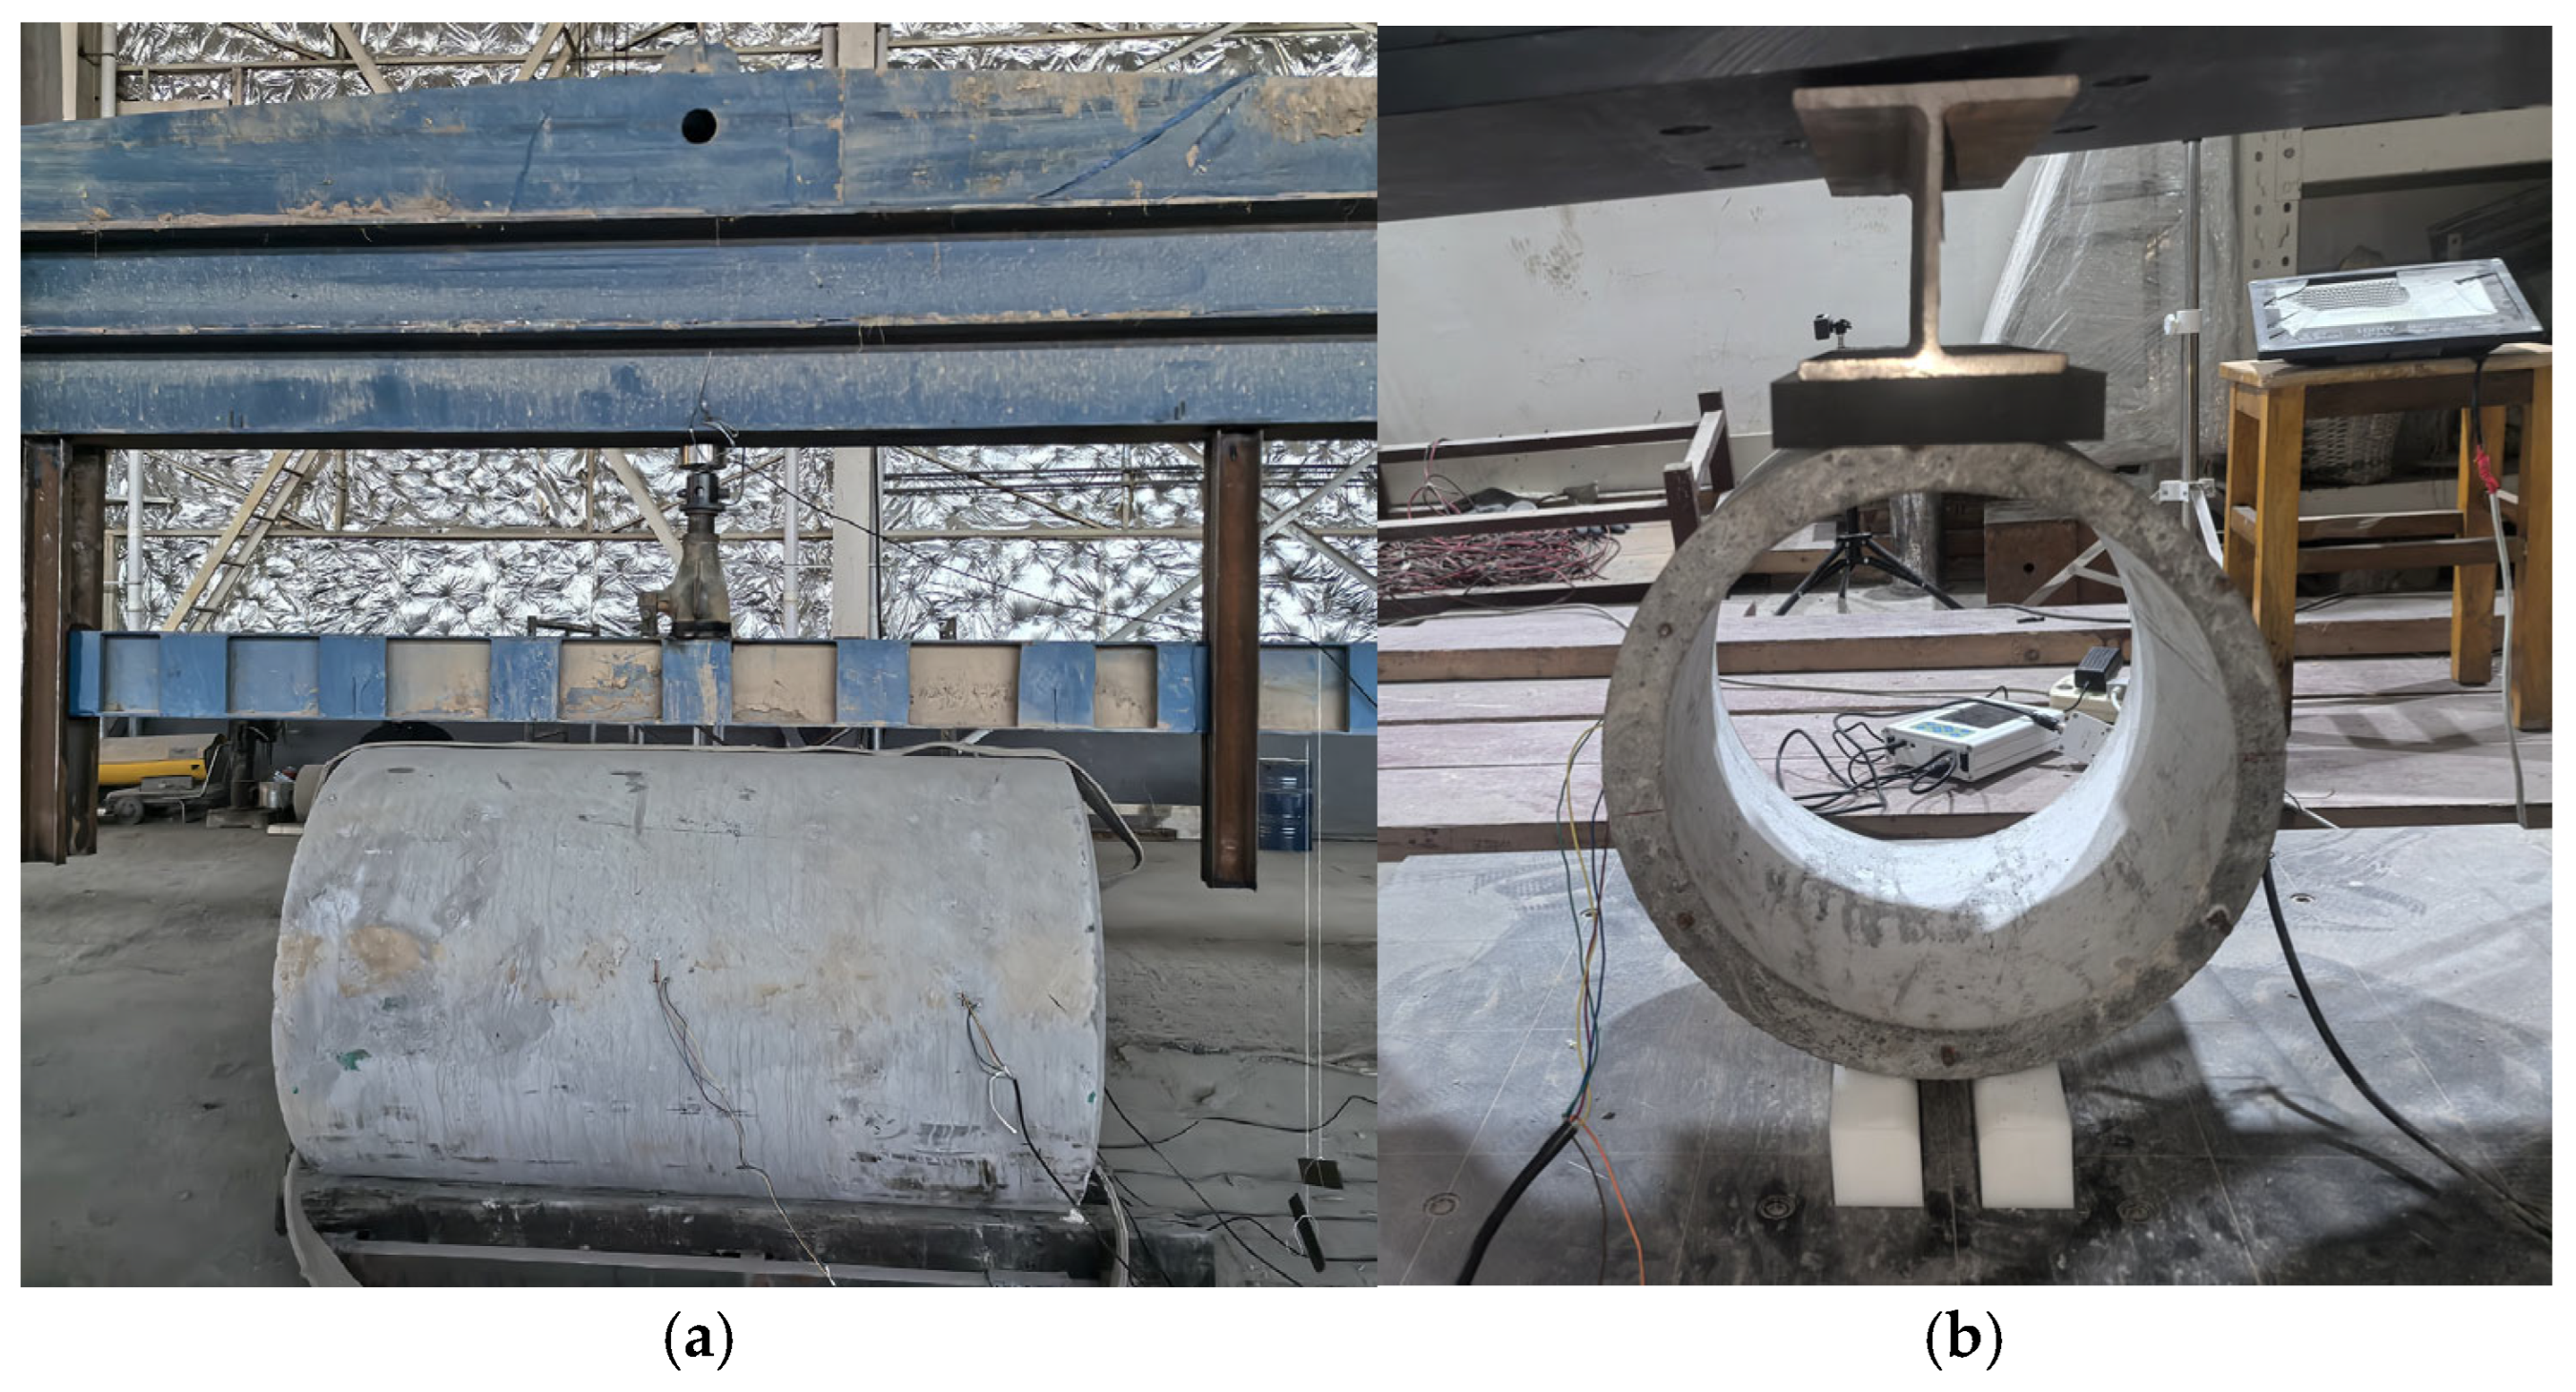
The TEB loading device compliant with GB/T 11836 was used, as shown in
Figure 7a. For the large-diameter pipes (Series D1), the loading system consisted of a 60-ton hydraulic jack, a high-precision load sensor, a data acquisition system, and a rigid distribution beam. A 10 mm thick natural rubber pad was placed between the loading beam and the specimen crown to simulate a compliant bedding layer in practice and to avoid stress concentration. The two bottom support beams were 150 mm × 150 mm timber blocks with leveled surfaces, and their lateral positions were restrained using steel limit frames to prevent rolling or sliding.
For the small-diameter pipes (Series D2), a loading setup geometrically similar to that used for Series D1 was adopted, as shown in
Figure 7b. The load was applied and measured using an electronic universal testing machine. A 10 mm thick natural rubber pad was also placed at the crown contact. The two bottom support beams were replaced with engineering plastic blocks to facilitate direct drilling and fixation to the base of the testing machine, while restraining both axial and radial displacements.
3.3. Theoretical Estimation of Loading Levels and Loading Protocol
To ensure test safety and accurately capture the key performance indicators, namely the cracking load and the ultimate load, a strategy combining theoretical estimation with staged loading was adopted. First, based on the theoretical model presented in
Section 1, the cracking moment and ultimate moment of each specimen were calculated and then converted into the corresponding theoretical cracking load and theoretical ultimate load using the geometric relationship of the TEB test, in which the moment is linearly related to the applied load.
The loading protocol consisted of two stages:
The load was first increased at a constant rate to 80% of the theoretical cracking load and held for 1 min to inspect the specimen for cracks. A handheld crack-width gauge was used to determine whether the crack width exceeded the allowable limit. The load was then increased in increments of 10% of the cracking load up to the theoretical cracking load, during which crack initiation was observed and the corresponding crack widths were measured and recorded. Thereafter, loading continued in increments of 5% of the cracking load until the crack width exceeded the allowable limit, and the crack width at each load level was measured and recorded. The allowable crack widths are listed in
Table 2.
- 2.
Ultimate load determination:
The load was first increased at a constant rate to 80% of the theoretical ultimate load and held for 1 min to verify whether failure had occurred. The load was then increased in increments of 10% of the theoretical ultimate load up to the predicted ultimate load, while the specimen response was continuously monitored. Subsequently, loading continued in increments of 5% of the theoretical ultimate load until the peak load was reached. Loading was maintained briefly after the peak load to confirm that no higher load could be attained. Therefore, the failure load reported in this study was defined as the peak load.
The entire loading process strictly followed the principle of “slow loading, stepwise increments, observation, and recording” to ensure data reliability and test repeatability.
4. Experimental Investigation of Pipe Load-Carrying Capacity
4.1. Analysis of Experimental Observations
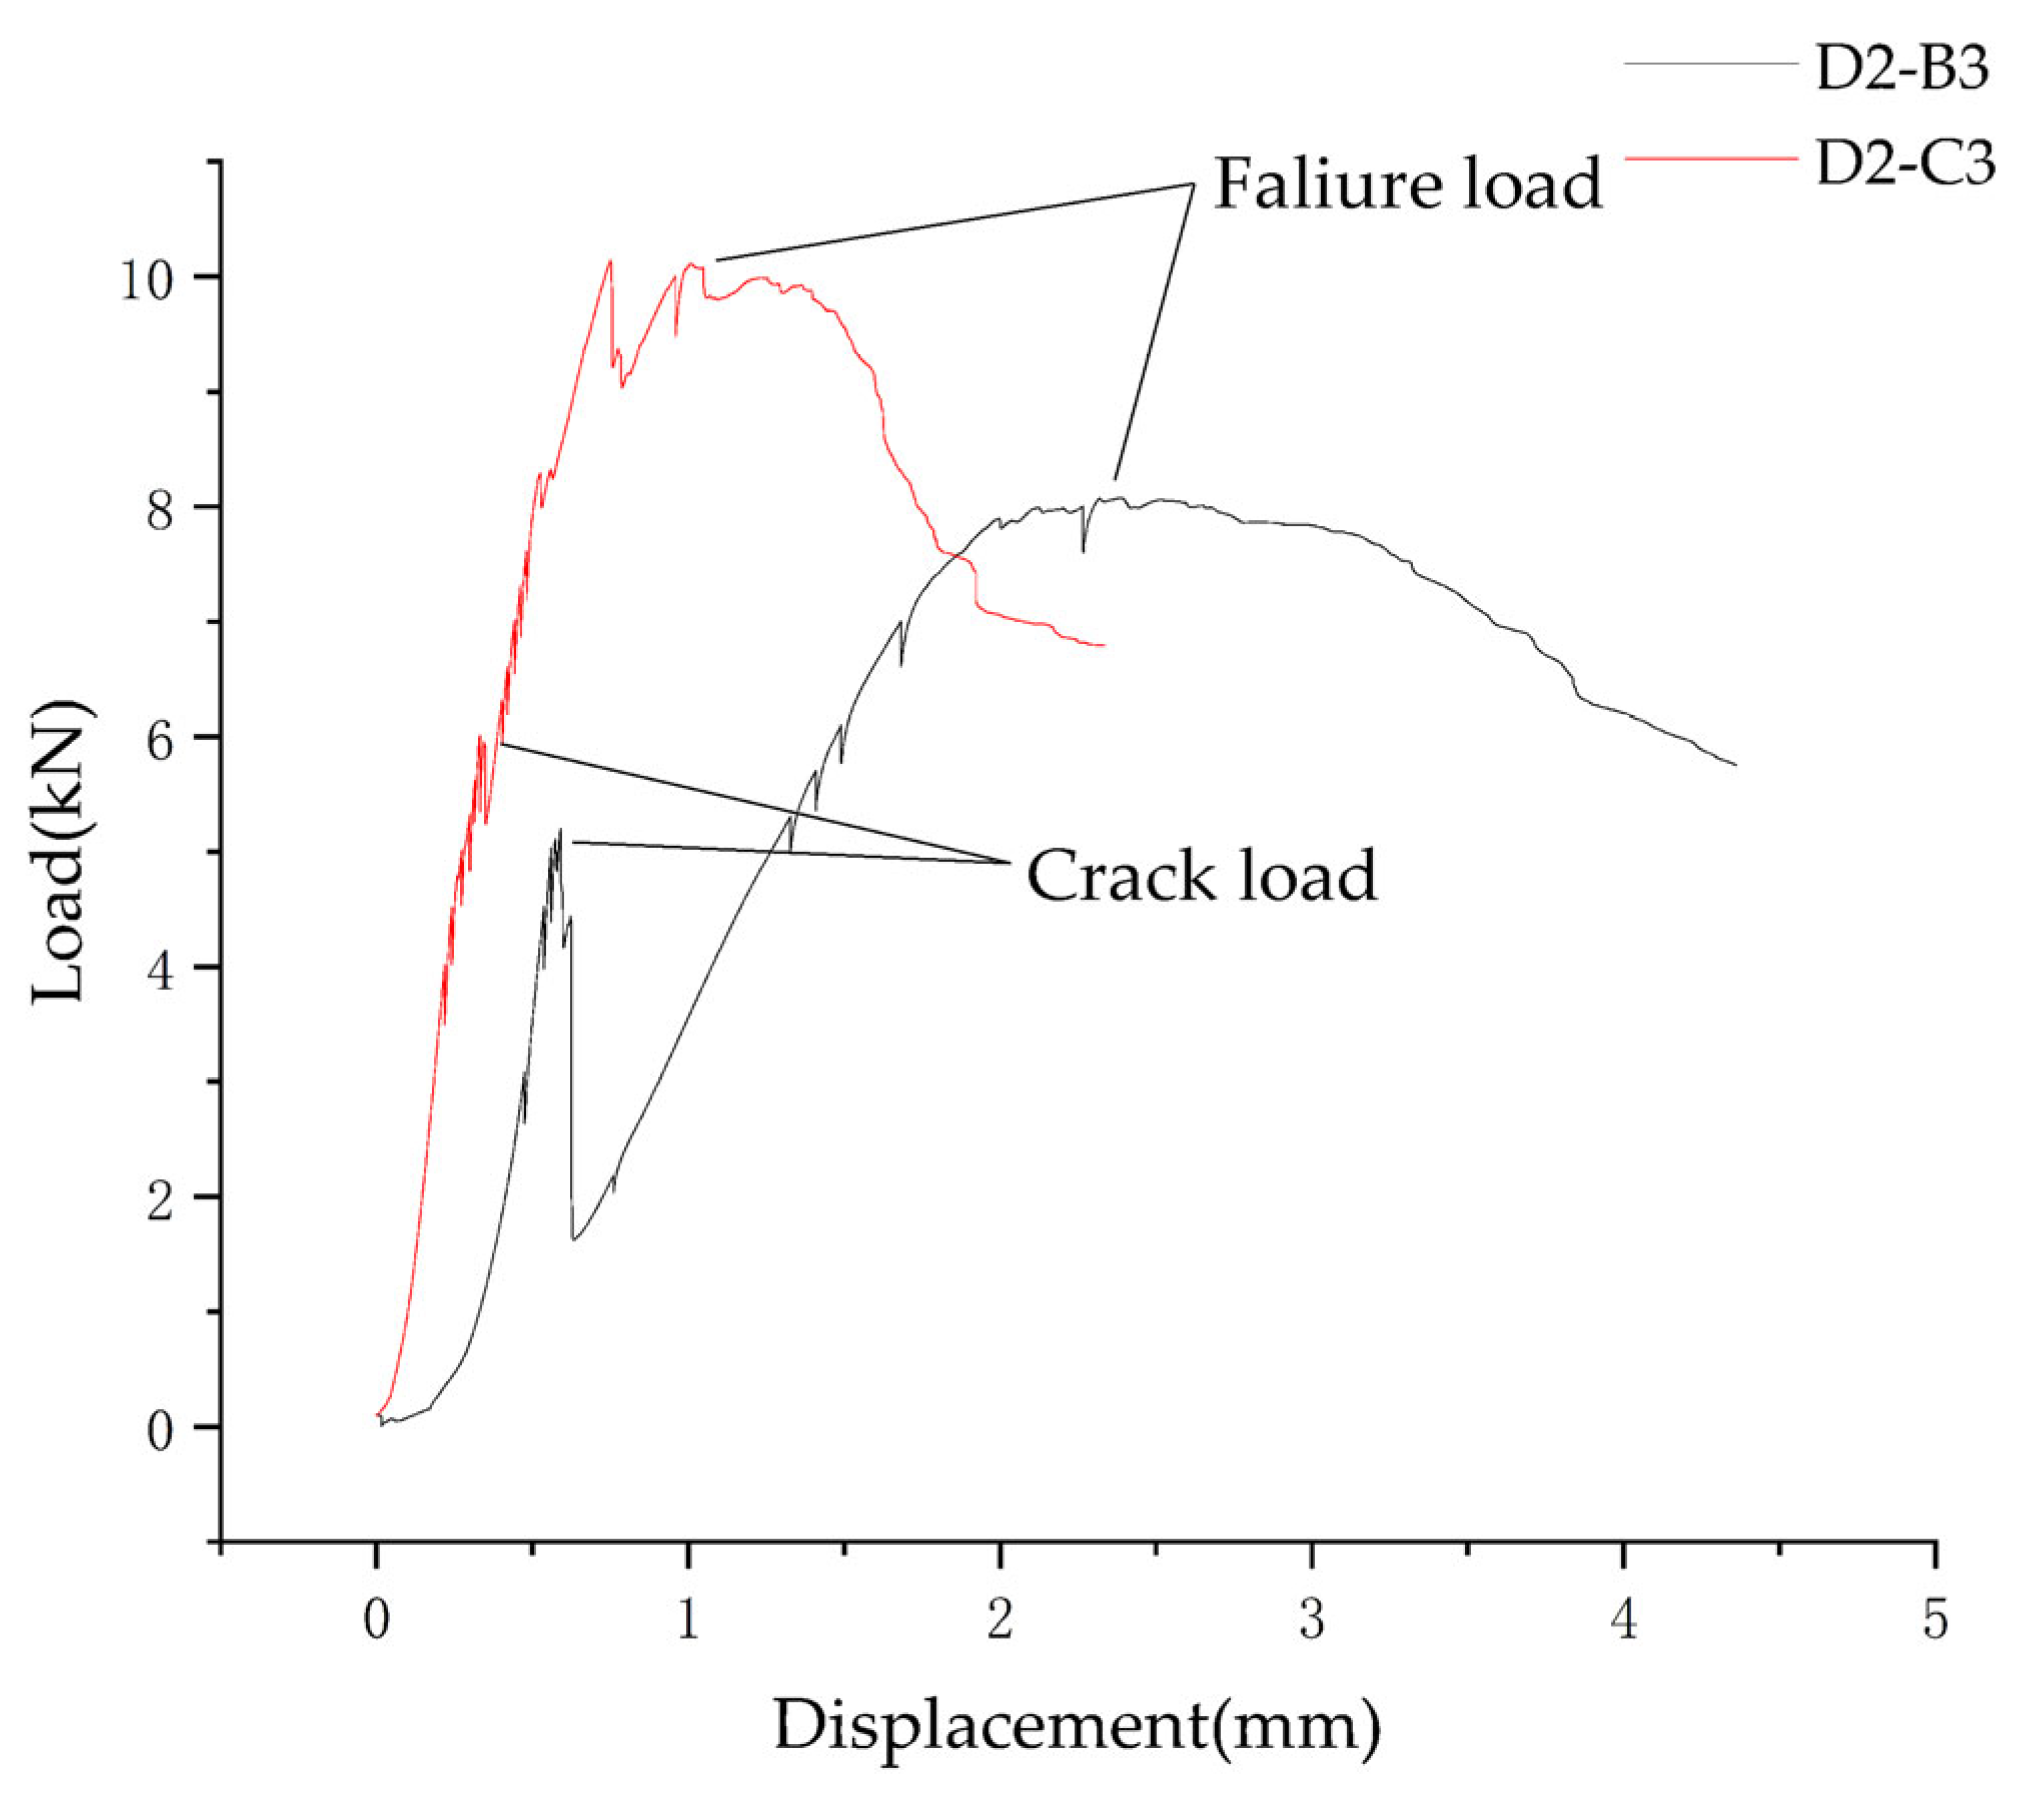
Under TEB external-pressure loading, the response of all concrete pipe specimens exhibited a typical three-stage behavior, as shown in
Figure 8: elastic stage, stable crack propagation stage, failure stage.
In the elastic stage (load < cracking load), the structure remained in a linearly elastic state, and no visible cracks were detected either by visual inspection or by measurement instruments. During this stage, the tensile stress was primarily carried by the concrete matrix, while the GFRP bars or steel bars were not yet significantly engaged.
When the load approached the theoretical cracking load, the tensile strength of the concrete at the invert was exceeded, and the first axial microcrack initiated on the inner surface of the invert, with a width typically smaller than 0.05 mm. This event marks the onset of cracking and indicates that the structure has entered a cracked service state. Notably, the specimens containing rGFRP short fibers (D1-B28-1 and D1-C28-1) generally exhibited higher crack-initiation loads as well as finer and denser initial cracks, indicating that the fibers effectively inhibited the rapid coalescence of microcracks.
After entering the crack-propagation stage, as the load continued to increase, existing cracks gradually extended along the pipe-wall thickness and induced new cracks in adjacent regions. The number of cracks continuously increased, and the maximum crack width also developed gradually. In the initial part of this stage, the tensile resistance of the member was still mainly carried by the concrete. However, when the load increased to a certain level, the concrete could no longer effectively resist tension, and the tensile force was transferred to the reinforcement. Because the tests were conducted under displacement-controlled loading, this transition in the load-carrying mechanism was reflected in the load–displacement curve as an instantaneous drop in load. By comparison, since the elastic modulus of GFRP bars is only about one quarter of that of steel bars, the GFRP-bar specimens (Series C) exhibited a more pronounced load drop during this transition.
In the final failure stage, that is, between the cracking load and the failure load, the load-carrying capacity of the specimens generally showed a trend of first increasing and then gradually stabilizing, with a pronounced plateau stage, as shown in
Figure 9.
This plateau stage could persist for a certain period even after the failure load was reached, after which the load-carrying capacity gradually decreased, exhibiting a softening response. By comparison, reinforced concrete pipes showed a faster post-failure softening process and a more pronounced decline in load-carrying capacity, whereas GFRP-reinforced concrete pipes were able to retain their subsequent load-carrying capacity to a greater extent.
Finally, the specimen exhibited evident cracking, and its load-carrying capacity decreased significantly, as shown in
Figure 10.
Overall, the incorporation of rGFRP short fibers effectively delayed crack development and improved the structural ductility. Although GFRP bars provide superior corrosion resistance, their relatively low elastic modulus results in larger deformation, wider cracks, and a more brittle failure mode. Therefore, their use should be approached with caution in applications with stringent deformation-control requirements.
4.2. Test Results
To verify the validity of the proposed model, the calculated cracking load
and calculated ultimate load
, obtained using the above method, are compared with the experimentally measured values
and
. The error is calculated as shown in Equation (12):
As summarized in
Table 3, the predicted cracking and ultimate loads agree well with the experimental results overall, with an average absolute error of 14.37%. This indicates that the proposed model can reasonably predict the cracking and ultimate load levels within an engineeringly acceptable range.
A comparison between the theoretical predictions and the experimental results shows that the errors for all specimens were within ±30%, and that the majority were within ±20%, confirming the good predictive capability of the model for most loading cases. Nevertheless, some unavoidable discrepancies remain, mainly because the theoretical model is based on a linear-elastic assumption in the internal-force analysis, together with several other assumptions and simplifications. These idealized treatments inevitably lead to a certain degree of deviation between the theoretical predictions and the experimental results.
It should also be emphasized that the present study is based on the standardized TEB loading condition and does not explicitly consider the interaction between the pipe and the surrounding ground. In actual buried service, soil stiffness, bedding support, backfill compaction, and nonuniform ground reactions may affect load redistribution and crack development, and may either alleviate or aggravate local stresses at the crown, invert, and support regions. Consequently, the cracking and ultimate loads obtained in the TEB test should be interpreted as standardized structural performance indicators under controlled boundary conditions, rather than direct in-situ capacities for all burial environments.
To quantitatively describe crack development in concrete pipes after cracking, typical specimens (D1-B28-0-1, D1-B28-1-2, D1-C28-0-2, D1-C28-1-2) were selected to analyze the relationship between the maximum crack width
and the load
recorded during external pressure loading, as shown in
Figure 11. The maximum crack width was defined as the maximum value among all crack-gauge readings at the same load level, representing the most unfavorable crack-control state. Overall, the crack width remained essentially zero before the first crack appeared. Once the initial crack formed, the crack width increased rapidly, and the specimen entered a stable crack-propagation stage, during which the crack width continued to increase with the external-pressure load.
It can be seen from
Figure 11 that the relationship between the post-cracking load-maximum crack width exhibits an approximately linear characteristic within the selected load range. Therefore, a linear model is adopted for fitting:
where
can be interpreted as the crack propagation rate, namely the increment in maximum crack width caused by a 1-kN increase in load, and
is related to the cracking threshold, the nonlinear effects in the initial crack propagation stage, and other influencing factors.
Figure 11 presents the load–maximum crack width curves of the typical specimens. It can be seen that all curves increase approximately linearly after cracking, indicating that, within the service load range, the crack width exhibits a good linear relationship with the external load. This characteristic makes it possible to back-calculate the load level from the crack width.
Least-squares linear regression of the four representative specimens produced high goodness-of-fit values of 0.98, 0.96, 0.93, and 0.96, respectively. These results indicate that, during the stable post-cracking stage, the maximum crack width is strongly linearly correlated with the external pressure load, and that a simplified linear relationship can therefore be used for engineering description and comparative evaluation of crack development.
Further comparisons indicate the following:
The reinforcement type has a pronounced influence on crack control. In general, steel bars have a higher elastic modulus, enabling the post-cracking section to better maintain stiffness in the tension zone and thereby resulting in a relatively moderate increase in crack width. In contrast, GFRP bars have a lower elastic modulus, leading to more pronounced post-cracking stiffness degradation. Under the same load increment, larger tensile strains and crack openings are therefore more likely to occur. As a result, the GFRP-reinforced specimens tend to exhibit a larger fitted parameter, indicating a higher sensitivity of crack development to the applied load.
The addition of short fibers inhibits post-cracking crack propagation. Short fibers share part of the tensile stress through bridging, delay crack-tip propagation, and enhance crack-growth resistance, thereby promoting a transition from “rapid propagation” to “stable propagation.” This effect helps reduce the crack-propagation rate and improves the stability of crack control. The fiber-reinforced specimens shown in
Figure 11 also exhibit good linearity, indicating that the fibers primarily modify the post-cracking crack-growth slope and load-carrying interval, rather than the linear evolution characteristic during the stable propagation stage.
In summary, during the stable post-cracking stage under external pressure, the evolution of the maximum crack width can be well characterized by a linear fitting relationship, with high fitting accuracy for all specimens (all ). The linear fitting parameter can therefore be used as a key index for evaluating the crack-control performance of different reinforcement types and fiber contents: the smaller its value, the slower the crack propagation and the stronger the crack-control capacity.