Abstract
Within the scope of this article is the presentation of a modelling and measurement approach for the effects of roof greenings and the application of the approach to evaluate the influence of roof greenings upon the thermal conditions inside a typical residential building. It is shown that overheating in summer can be reduced, and thermal comfort for inhabitants can be increased. The cooling is caused by the transpiration of plants and by the evaporation of water from the substrate. Other relevant physical effects are the shading of plants and the increase in the heat capacity of the building. In state-of-the-art buildings, a layer with a high insulating effect is incorporated into the envelope. This leads to the effect that a huge fraction of the cooling power is taken from the outside of the building and only a smaller part is taken from the inside. In order to mitigate this decoupling, a hydraulic connection between the greening and the interior of the building is introduced. To evaluate the effect of the inside cooling, the difference in the number of yearly hours with overheating in residential buildings is estimated. In addition, the reduction in energy demand for the climatisation of a typical residential building is calculated. The used methods are as follows: (1) Performance of laboratory and free field measurements. (2) Simulation of a typical residential building, using a validated approach. In summary, it can be said that green roofs, in particular with hydraulic connections, can significantly increase the interior thermal comfort and potentially reduce the energy required for air conditioning.
1. Introduction
In Germany, private households need about 28.9% of the end energy. Only 0.2% of this end energy is used for climatisation (see [1]). Here, major changes have to be expected. With climate change proceeding, the demand for room climatisation will increase. From 1990 to 2016, the world energy demand for room climatisation (residential and office buildings) increased by 232%, from 608 TWh to 2021 TWh (see [2]). This is in hard contradiction to the goals of the UN climate conference from Paris 2015, where the goal was defined to be climate neutral by 2050.
In this article, we will describe the option to work against this tendency by the use of green roofs. The greening of roofs can help to increase the thermal comfort for the inhabitants during summer and can reduce the energy demand needed for climatisation [3,4]. This cooling effect inside the building is achieved primarily through shading and the evaporation of water, preferably rainwater. In addition to their cooling effect, green roofs also have a positive impact on air quality, biodiversity, and the sewer and surface water systems by reducing peak runoff rates [5].
The cooling effect of green roofs has already been investigated in many different countries, both by measurement and simulation. The results of these investigations vary greatly. For example, a study conducted in Germany found that the interior temperature in a greened building drops by an average of 0.5–1.0 °C [6]. A similar study conducted in France resulted in a cooling effect of 1.4–2.6 °C [7], and a study conducted in China reported a temperature reduction of 1.5 °C [8]. These brief examples support the hypothesis put forward by Jamei et al. that the cooling effect of green roofs depends heavily on climatic conditions and building characteristics, which in turn makes it extremely difficult to quantify the cooling effect in general terms [9].
However, other research has previously shown that under some circumstances, green roofs also have the potential of raising the cooling and heating loads of buildings due to an increased thermal capacity [10]. Additionally, in countries such as Germany, there is another problem with regard to the cooling effect of green roofs. According to current building characteristics, the green roof is thermodynamically decoupled from the interior of the building by a heavily insulated building envelope. This significantly weakens the cooling effect felt inside the building. To avoid this thermal separation, new concepts that can bypass the thermal insulation in summer without significantly impairing the desired insulating effect in winter should be developed.
One such concept was developed by La Roche et al. In their investigations, they installed a layer of air between the insulation and the green roof structure. When cooling is required, fans blow air from the interior through the air gap above the insulation layer so that the air can cool down. However, when heating is required, the fans remain closed so that the enclosed layer of air acts as an additional insulation layer [11].
Based on this concept, thermal separation can also be circumvented by establishing a hydraulic connection between the interior of the building and the substrate of the green roof. To achieve this, heat exchangers need to be installed in the interior of the building and in the substrate of the green roof, between which heat can then be transferred. A hydraulic connection based on the same principle has already been investigated in test cells by La Roche et al. and Yeom et al. [12,13]. However, as mentioned above, the results of studies on green roofs depend heavily on climatic conditions, and since previously conducted studies have been performed in California, the results are not directly applicable to Germany. This article, therefore, takes a closer look at the potential use of this innovative approach in countries with climatic conditions similar to those in Germany. Furthermore, an attempt is made to estimate the effect of the hydraulic connection on real buildings.
In order to examine this effect more closely while at the same time ensuring comparability with a normal green roof, this article develops a complex evaluation approach that can be applied equally to both normal green roofs and green roofs with hydraulic connections.
2. Methods
This section presents the developed assessment approach for the effect of green roofs on residential buildings, which combines free field measurements, laboratory measurements, and building simulations. The approach is applied to one typical residential building in Section 8. The approach can be generalised to consider various real buildings.
The following steps describe the procedure:
- The heat capacity c of the greening device (substrate) has to be estimated.
- In a laboratory measurement, the transmission coefficients for visible light and for infrared light of the plants of the greening have to be measured.
- The convection coefficient of the plants has to be determined.
- In a laboratory measurement, the cooling power of a roof greening has to be measured.
- A CFD model can be used to estimate the fraction of the cooling power, which is taken from the interior of the building.
Typical values for the parameters of points (1) to (5) can be taken from this article (Section 3, Section 4, Section 5, Section 6 and Section 7).
- 6.
- The estimated interior cooling power, and the transmission and convection coefficients, as well as the heat capacity, can be implemented in a TRNSYS building model to calculate the interior temperature profile for one year, as well as the yearly energy demand for climatisation.
- 7.
- The temperature profiles without and with roof greening can be compared.
- 8.
- The comparison of the temperature profiles can be used to evaluate the reduction in overheating hours of the building in summer.
- 9.
- The reduction in energy demand for climatisation for different variations in greenings can be evaluated.
In Figure 1, the procedure is visualised in a flow chart.
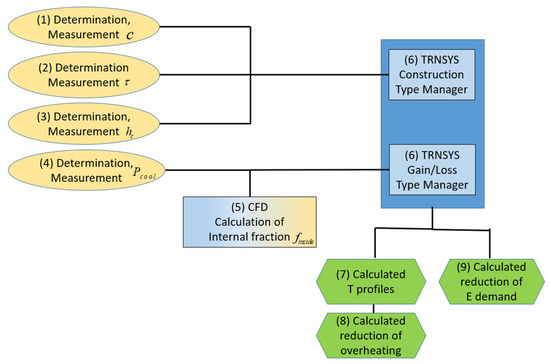
Figure 1.
Flow chart for the procedure for the evaluation of the influence of a greening on the interior of a residential building.
3. Description of the Roof Greening Device, the Free Field Measurements, and the Hydraulic Connection with Measurement Results
An extensive roof greening element is examined. The thermodynamic examination consists of a substrate layer with a thickness of 150 mm. The plant Sedum is used because this plant does not need maintenance and irrigation in summer. Therefore, Sedum is used frequently for extensive roof greenings.
In a free field measurement located at the site of HSWT in Triesdorf, Germany, several strongly simplified test buildings (test boxes) are examined. The schematic construction is shown in Figure 2. Photos of the established test boxes can be seen in Figure 3. The test boxes have the outer dimensions of 1 m × 1 m × 1 m. The outer shell is made of wood multiplex plates with a thickness of 18 mm. Inside a thermal insulation of 100 mm of polystyrene is placed in order to obtain an approximation of the thermal insulation of a real building. The outer surface is painted black to provide a defined absorption of solar radiation. Here, three variations are considered. Test box I has no greening device on top. Test box II has a greening device on top consisting of a 150 mm substrate and a layer of plants, which are Sedum. Test box III has the same greening device on top. Additionally, a hydraulic connection between the greening device (substrate) and the interior of the box is mounted. The details of the constructions are provided in Table 1, and the material properties in Table 2.
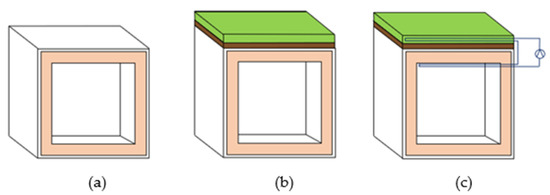
Figure 2.
Schematic representation of the simplified test buildings (test boxes). On the left test box I without greening (a), in the middle test box II with greening (b), and on the right test box III with greening and hydraulic connection between greening and interior (c).
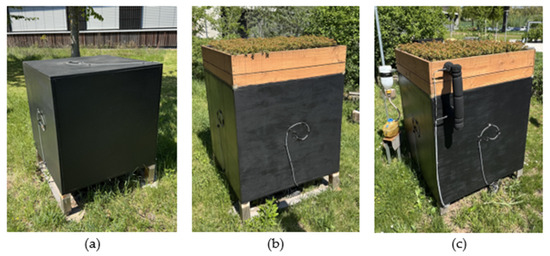
Figure 3.
Photos of the established test boxes. On the left test box I without greening (a), in the middle test box II with greening (b), and on the right test box III with greening and hydraulic connection between greening and interior (c).

Table 1.
Construction of the test boxes.

Table 2.
Material properties of the test box materials (references [14,15,16,17]).
In the free-field measurements in summer 2024, a multitude of quantities are measured as one-minute averages. The following variables are important for the considerations in this article: the interior air temperatures Tai for all test boxes, the ambient temperature Ta, and the solar global radiation intensity in the horizontal plane Gh, as well as in vertical planes to the south, west, north and east (Gs, Gw, Gn, and Ge), the wind speed vwind, and the amount of precipitation Vrain.
The hydraulic connection is of relevance because thermal insulation is integrated into the wall structure of modern residential buildings. This leads to a decoupling between the cooling effect of the green roof and the interior of the building. Therefore, the cooling energy is mainly taken from the direct environment of the place where the water evaporates and not from the interior of the building. The hydraulic connection, which is examined in this article, is intended to circumvent this decoupling in order to lead to a relevant cooling effect inside the building. The examined hydraulic connection is realised by two heat exchangers, one in the substrate of the greening and one under the ceiling inside the test box. The construction is shown in Figure 4. The heat exchangers consist of EPDM pipes. For 1 m of width, 13 tubes (small pipes) are placed. The tubes have an outer diameter of 10 mm and an inner diameter of 6 mm, while the two larger collection pipes have an outer diameter of 20 mm and an inner diameter of 16 mm. The two separate heat exchangers are connected by a flexible pipe that matches the dimensions of the tubes. As heat exchanger fluid, a water–glycol mixture is used. This fluid is circulated by a pump directly between the external and internal heat exchangers. The volume flow corresponds to 25 L per hour per covered substrate area. The volume flow was selected based on common volume flows of thermal solar systems.
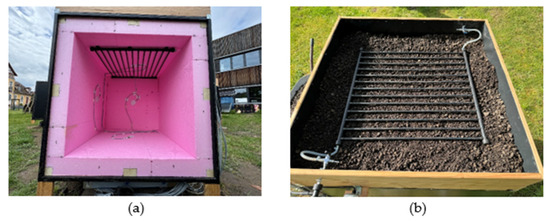
Figure 4.
Construction of the hydraulic connection between the greening device and the interior of the test box III. On the left is the heat exchanger inside the test box (a), and on the right is the heat exchanger within the substrate (b).
The measurement data from July 2024 show that both the greening and the additional hydraulic connection have a strong effect on the internal temperature of the test buildings. Figure 5 shows a comparison of the temperature profiles of boxes I, II, and III.
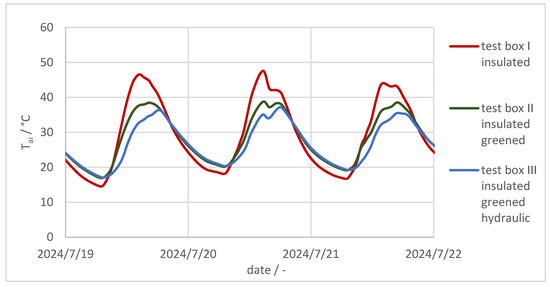
Figure 5.
Comparison of interior air temperatures for boxes I, II, and III for 3 days in July 2024.
For July 2024, the average interior temperatures are reduced by 0.8 K for greening and by 2.0 K for greening with hydraulic connection. The average reduction in the interior air temperature seems quite low. This can be explained by the fact that the increased temperatures in the greened boxes II and III during the night-time mitigate the average reduction. The increased temperatures during the night are caused by the higher heat capacity due to the extra thermal mass of the substrate.
For this reason, the maximum interior temperatures might be better to evaluate the cooling effect of the greening and the hydraulic connection. The reduction in the maximum is shown in Figure 6.
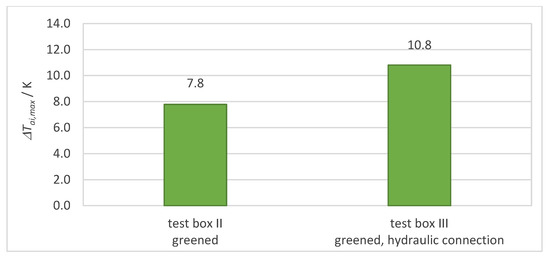
Figure 6.
Reduction in maximum temperatures in test boxes II and III due to greening and hydraulic connection, measured in July 2024.
It can be seen that the temperature maximum for July 2024 is significantly reduced by 7.8 K due to the greening and by 10.8 K due to the greening with hydraulic connection.
Unfortunately, it cannot be assumed that a real residential building will show the same behaviour because the heat capacity of a real building will be higher than that of the test boxes, the solar absorbance of the surface will differ, and the real building will have windows, as well as internal heat gains from inhabitants and electric devices. Furthermore, the relation between the area of the greening and the ground area of the building will differ. For this reason, a deeper analysis is needed to obtain a valid estimation of the effects of roof greenings and hydraulic connections for real residential buildings.
Obtaining this evaluation by direct measurement is almost impossible because it would be necessary to establish several identical buildings (same geometry, same location with the same weather conditions, same behaviour of the inhabitants, …) that differ only in the greening and hydraulic connection.
Therefore, in the following, a hybrid approach is chosen. It combines the measurements on the test boxes (to validate a building model), laboratory measurements, and CFD simulations (performed to obtain parameters for the greening device) with the setup of a TRNSYS building model for a typical residential building. The implementation of the effects of the greening into the TRNSYS building model is validated by a comparison between data measured at the test boxes with TRNSYS simulation results for the test boxes. After validation, the TRNSYS building model is set up for a typical residential building by using the parameters obtained from laboratory measurements and CFD simulations. Afterwards, the TRNSYS model can be used to evaluate the effects of the greening and the hydraulic connection on a typical residential building. The described procedure can be generalised to make predictions for different buildings with different greenings, with and without hydraulic connections. The necessary steps are described in the following.
4. Cooling Power of Roof Greenings
In a laboratory measurement, the cooling power of the plants in a roof greening can be determined by a method introduced by the authors.
The cooling power of a greening device depends on the following parameters:
- Kind of plants;
- Leaf area index (LAI);
- Ambient temperature;
- Air humidity;
- Wind speed;
- Radiation intensity;
- Water saturation of the substrate.
In the first laboratory measurement, the cooling power for three different kinds of plants and the substrate of the greening (without any plants) is determined under defined conditions. The examined plants are Sedum, Carex, and Alchemilla; the substrate is a mixture of expanded shale, expanded clay, lava, pumice stone, brick chippings, porlith, and green waste compost. The plants are shown in Figure 7. The plants differ in the size of their leaves and their ability to withstand dry seasons. The necessity of irrigation decreases from Alchemilla over Carex to Sedum, which needs no irrigation even under summer conditions.

Figure 7.
Examined plants from left to right: Alchemilla (a), Carex (b), and Sedum (c) (see [18]).
For the measurement, the substrate and the plants are placed in a box (see Figure 7, right). The setup is weighed and placed in a climate chamber (see Figure 8) for 24 h under defined conditions. Afterwards, the setup is weighed again, and the difference in mass ∆m is determined. From ∆m and the duration of the measurement ∆t, the cooling power Pcool can be determined by Equation (2) using the evaporation enthalpy of water hev, which depends on the temperature and is estimated by Equation (1) (see [18,19]):
with
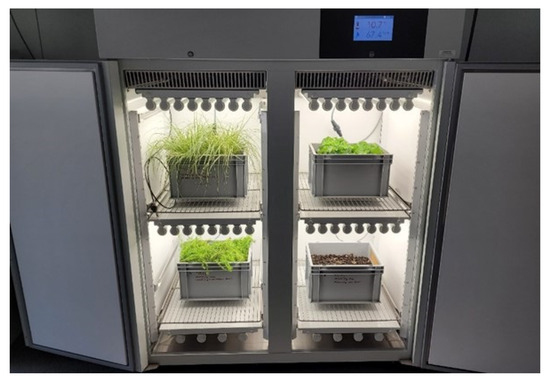
Figure 8.
Climate chamber used for the measurement of the cooling power.
- : molar evaporation enthalpy;
- : evaporation enthalpy;
- : molar mass of water.
This leads to the following:
and
The measurements are performed for a light intensity of 102 W/m2 (which is the maximum for the lights in the climate chamber), a humidity of the substrate of about 23% mass (this is a typical value with which the commercial substrate is delivered by the producer), different temperatures, and air humidities of 60%, 70% and 80%. The plants were in a typical condition, and the dependency upon the LAI and upon the water saturation of the substrate will be the subject of later studies. The results of the different air humidities at a constant temperature are averaged. The resulting cooling powers are shown in Figure 9 as a function of the temperature.
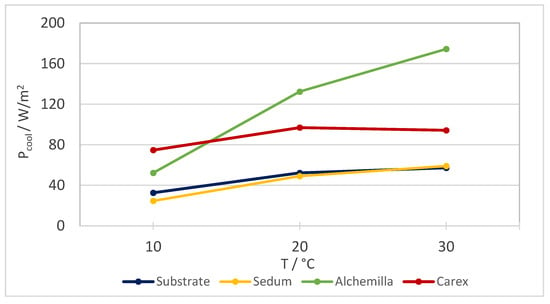
Figure 9.
Measurement results for cooling powers of different plants in dependency on the temperature (reference [18]).
The accuracy of the used scale is 0.2 g, which leads to a maximal error in the determined cooling power of about 0.26%.
The measurements at the described conditions result in a cooling power for Sedum of 50 W/m2 at a temperature slightly above 20 °C. This cooling power is used later on as an input parameter for the building simulations.
5. Shading Effect and Transmission Coefficient of Plants
In order to describe the shading effect of the plants in a greening device, the transmission coefficient τ of the plants is measured. For these measurements, two spectrometers, OceanOptics HR2000+ and NIRQuest, are used. The spectra of light can be measured in the visible range between the wavelengths of 250 nm and 950 nm and in the IR range from 1100 nm to 2400 nm.
Mountings for a light source and the plants, and the measurement probe of the spectrometer are constructed (see Figure 10).
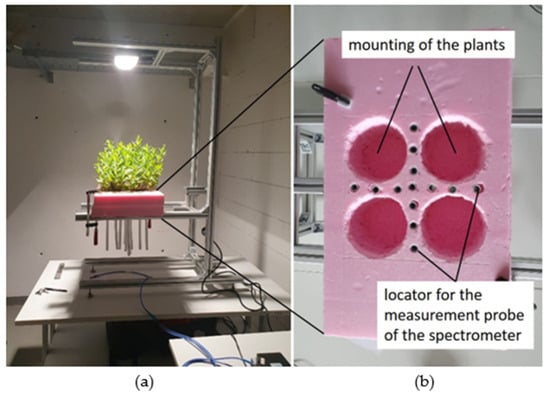
Figure 10.
Set up for the measurement of the transmission coefficient of plants. On the left, the mounting for the light source, the plants, and the locators for the measurement probe of the spectrometer (a) (white tubes under the pink placement of the plants). On the right, a zoom of the mounting of the plants and the locators for the measurement probe of the spectrometer (b). (reference [20]).
To determine the transmission coefficient of the plants, the visible and IR spectra of the light source are measured at 13 positions without plants and stored as reference spectra. Afterwards, the plants are placed in the mounting, and the measurements are repeated. By dividing the spectrum of the measurement by the reference spectrum, the spectral transmission coefficient τ of each position is obtained. The resulting 13 spectra of the transmission coefficients are averaged to obtain one overall spectrum for τ. This is conducted because the leaves are randomly distributed, and therefore, τ is strongly dependent on the location of the measurement.
For use in the TRNSYS building simulation tool, single values for the transmission coefficients for the visible range of light τvis and the IR range of light τir are needed. Spectra cannot be applied in TRNSYS.
For this reason, the values of the spectra are averaged, weighted by the solar spectrum of light Gsol (λi). This is evaluated by Equations (3) and (4).
is the wavelength of the i-th band of the spectrum. counts all bands of the spectra in the visible range of light, and counts all bands in the IR range of light.
For simplification, in reference to the Leaf Area Index LAI, here, the Leaf Mass Index LMI is used to describe the influence of the amount of leaf that is in the path of light. For this application, the LMI is introduced by the authors and is defined by Equation (5).
with
: Leaf mass of the greening;
: Base area of the greening.
For example, in Figure 11, it can be seen that for an LMI of 1.95, about 60% of the visible light can pass through the plants of the greening.
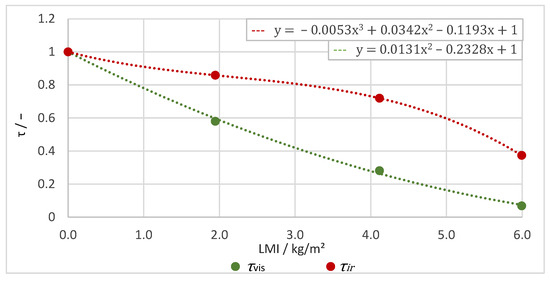
Figure 11.
Transmission coefficients of sedum for the visible and IR ranges of light as a function of the leaf mass index (see [20]).
The results shown in Figure 11 are used later to represent the shading effect of the Sedum for different LMI’s in the building simulations.
6. Estimation of the Cooling Power Fraction, Taken from Inside the Building
As already mentioned, the thermal insulation of a building leads to a decoupling of the cooling effect of the greening from the interior of the building. A major fraction of the cooling power is taken from outside the building and only a small fraction from the inside. This section deals with the determination of the fraction, which can be taken from inside the building.
For this reason, Computational Fluid Dynamics (CFD) models for the test boxes, described in Section 3, are developed. Here, the greened test box II and the greened test box III with hydraulic connection are considered. The model covers the internal air volume, the wall structures of the boxes, the substrate layer of the greening, and an enclosure of ambient air with an extent of 1 m at the top and on every side, as well as 0.2 m below the test box. The geometry and the material properties used are provided in Table 1 and Table 2 in Section 3. ANSYS 2019 R2 CFX is used for modelling and simulation. The model of the greened test box without hydraulic connection delivers reliable results if it consists of 5,435,715 elements and 2,774,587 nodes. The boundary conditions are provided in Table 3. The boundary conditions represent the situation at the free field test side with the test boxes described in Section 3. The cooling power of the plants is integrated as a heat flux taken from the top of the substrate of the greening.

Table 3.
Boundary conditions for the CFD simulation.
Figure 12 shows the geometry of the model with calculation results for the heat flux through the inner surface of the top of the box. The ambient air has a temperature of 25 °C and a wind speed of 0 m/s. For orientation, the surface of the substrate, on which the cooling power of the greening is applied, is coloured brown.
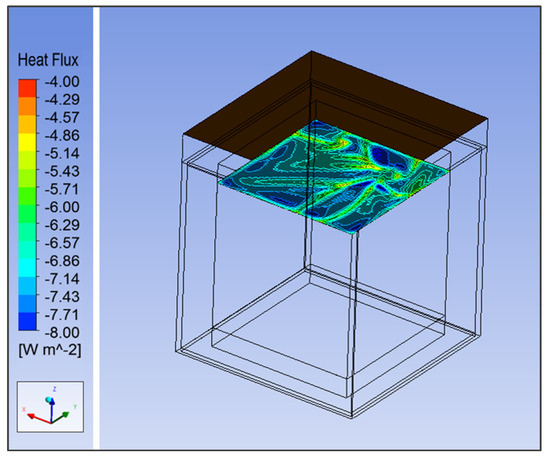
Figure 12.
Result of the CFD calculation for the heat flux through the inner surface of the top under ambient conditions of 0 km/h wind speed and 25 °C outside air temperature. Seen from diagonally below. The enclosure of ambient air is not shown in this illustration but included in the CFD model.
One result of the CFD simulation is the average heat flux through the inner surface of the top of the box. The heat flux , generated by the evapotranspiration of the greening device and taken from the top of the substrate, is a boundary condition of the model (see Table 3). The fraction of the cooling power taken from inside can be calculated from those results by Equation (6).
with
: Cooling power taken from inside;
: Cooling power of the plants;
: Surface area of the inner top side of the box;
: Surface area of the outer top side of the box.
For the greened test boxes, with and without hydraulic connection, CFD calculations are performed for different wind speeds and different outside air temperatures . The results for the fraction are shown in Table 4 and Table 5.

Table 4.
Results of the CFD calculation without hydraulic connection for .

Table 5.
Results of the CFD calculation with hydraulic connection for .
These results are used later in the TRNSYS building models to obtain the cooling power, which is taken from inside the building due to the cooling of the greening device. For example, in Section 7, for and , a value of is used for the validation of the TRNSYS model of the greened test box.
7. Implementation of the Effects of a Roof Greening in a TRNSYS Model and Validation
The 3D geometry of the ungreened test box I is generated in accordance with Figure 1 and Table 1 from Section 3, using the SketchUp 8.0.3117 Software. Figure 13 shows the 3D geometry. This geometry can be imported into a TRNSYS 3D building model (it is shown in Appendix A in Figure A1). For the simulation of the test boxes and, later on for the residential building TRNSYS 18.05.001 is used. The TRNSYS Type 56 is used to model the building, which here is only the test box, for the validation of the modelling approach of the greening.
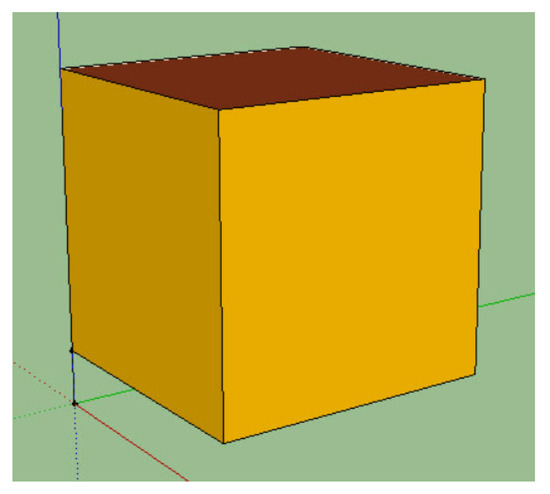
Figure 13.
The 3D geometry of the test box, imported into the TRNSYS building model.
In the TRNSYS tool TRNbuild, the structure and the associated material data of the wall construction of the ungreened test box I and the greened test box II have to be defined. For this, the Construction Type Manager is used (see Figure 14). This is conducted in accordance with the data in Table 1 and Table 2 from Section 3. Special attention is paid to the implementation of the physical effects of the greening.
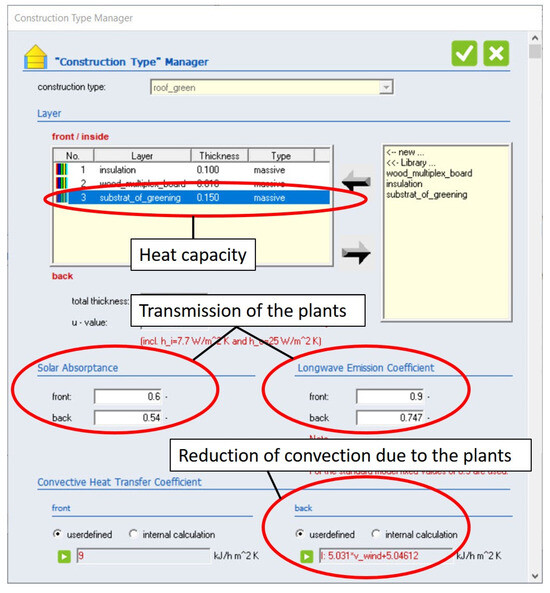
Figure 14.
Implementation of the heat capacity, the shading effect, and the reduced convection coefficient of the greening into the TRNSYS building model using the “Construction Type Manager” of TRNbuild for the building model of the test box.
The heat capacity of the greening can be considered by integrating an additional layer, with the geometry and the material properties of the substrate of the greening, into the wall construction of the roof (see Figure 14).
The shading effect of the plants can be integrated using the parameter “Solar Absorptance” and “Longwave Emission Coefficient”. Using the option “Convective Heat Transfer Coefficient”, the influence of the plants on the convection can be implemented. The different effects of the greening are considered as follows:
The parameters of the greening of test box II are obtained as described in Section 4, Section 5 and Section 6. Table 6 summarises the parameters used in the corresponding TRNSYS model, used for the validation.

The heat capacity of the greening can be entered directly by using a thickness of 150 mm of the substrate of the greening and the material data from Table 6. The shading effect of the plants of the greening is implemented indirectly by modifying the “Solar Absorptance” and the “Longwave Emission Coefficient” , of the outside surface of the greened roof. This is conducted in accordance with Equations (7) and (8). and are used in Figure 14.
with
: The “Solar Absorptance” used in TRNSYS for the outside surface of the greened roof;
The physical absorption coefficient of the outside surface of the substrate of the greened roof (which is assumed to be 0.9);
The transmission coefficient of the greening in the visible range of light (taken from the measurements described in Section 5).
with
: “Longwave Emission Coefficient” used in TRNSYS for the outside surface of the greened roof;
The physical emission coefficient of the outside surface of the substrate of the greened roof of the test box;
The transmission coefficient of the greening in the IR range of light.
For the description of the reduced convection due to the plants of the greening, Equation (9) is used to calculate the convection coefficient (in TRNSYS, a power has to be entered in the unit kJ/h), . This is taken from former measurements at HSWT, which were performed at a surface covered with a 15 cm layer of plants (see [21]).
with
wind speed.
The convection coefficient for the inside surfaces of the walls with 2.5 W/m2 is taken from [22].
The cooling power of the plants and the substrate due to evapotranspiration cannot be implemented in the wall construction; TRNSYS does not offer a suitable tool. For this reason, the “Cooling Type Manager” or the “Gain/Loss Type Manager” of TRNBuild can be used. There, a certain power can be defined, which is taken from the inside of a zone of a building. In Section 4, for Sedum at about 20 °C, a cooling power of = 50 W/m2 is obtained. This power is taken from the location of the plants and the surface of the substrate. Because TRNSYS does not offer the opportunity to apply directly at this location, the CFD calculation of Section 6 is performed to calculate the fraction of the cooling power, which is taken from inside the building. For a thermal insulation of 10 cm of polystyrene, = 0.07 is obtained. Using Equation (10), the cooling power , which has to be entered in the “Cooling Type Manager” or the “Gain/loss Type Manager”, can be calculated with the results from Section 4 and Section 6.
For Sedum and a thermal insulation of the test box of 10 cm polystyrene, is obtained. This cooling power is applied in the simulation for day times. It is assumed that evapotranspiration does not take place during night times.
The TRNSYS model of the test box, with the implementation of the described approaches for the integration of the greening, together with measured weather data, for July 2024 from the test side, is used to perform simulations in 10 min time steps, which deliver the interior temperature of the test box . The simulation results are compared with the measured inside temperatures of the test box for the validation of the simulation approach.
Figure 15 shows a comparison of simulated and measured interior temperatures for the greened test box II for July 2024. For the simulation, physical parameters were used, which means the model is not optimised by a variation in the parameters in an unphysical way. It can be seen that the model delivers temperatures that are too low at the night minima; also, the model shows a delay in the rising shoulder before midday. The delay could be caused by an overestimated heat capacity in the model of the greened test box.
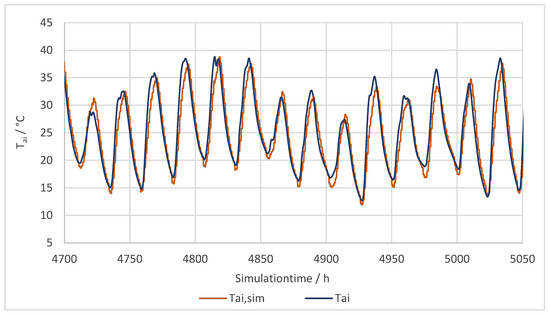
Figure 15.
Comparison of simulated and measured inside temperatures for the test box II (greened) for July 2024. The illustrated simulation time runs from 16 July 2024 00:00 to 31 July 2024 24:00.
The daily maxima of the temperatures inside a building are more relevant for the comfort of the inhabitants, and the maxima can be simulated with better accuracy as the complete timeline of the temperature. For this reason, in Figure 16, the daily simulated and measured maxima and minima of the interior temperature are shown. It can be seen that the model delivers mainly slightly too low maxima and minima.
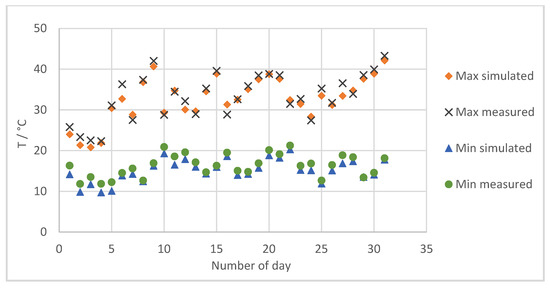
Figure 16.
Comparison of simulated and measured maxima and minima of the inside temperatures for the test box II (greened) for July 2024. The simulation time runs from 1 July 2024 00:00 to 31 July 2024 24:00.
To quantify the accuracy of the model, different indices were considered. The indices for the accuracy of the model are shown in Table 7.

Table 7.
Indices for the accuracy of the simulation approach for the test box I (without) and the test box II (with greening).
The first two lines of Table 7 show indices for the accuracy of the model. The average deviation between modelled and measured interior temperatures is shown. Therefore, values of −0.75 K for the simulation of the ungreened box and −0.61 K for the greened box are obtained. From the calculation of the average deviation, positive and negative deviations compensate partly. For this reason, the consideration of RMS values is more adequate. The RMS value for the ungreened test box is 3.78 K and for the greened test box is 2.33 K. This means the temperatures inside the greened test box can be simulated with a higher accuracy than for the ungreened test box. The daily maxima of the greened test box can be simulated with an average deviation of −0.65 K. The maxima are slightly underestimated.
Lines three and four show the effect of the greening upon the interior temperatures. In the third line, the measured influence and in the fourth line, the simulated effect of the greening are indicated. The measurements show an average reduction of 5.67 K and a simulation of 5.00 K for the daily maxima (marked green in Table 7), which is in good agreement. The reduction in the temperature maxima is underestimated by the model by about 12%. The reduction in the temperature average is underestimated by the model by about 20%.
In lines five to eight, the influence of the different physical effects of the greening is quantified. Here, the influence on the daily maximum can also be considered. If only the additional heat capacity of the greening is applied in the model, the daily maxima are reduced by 3.16 K (marked blue in Table 7), the shading leads to a reduction of 1.15 K, and the evaporation of 1.40 K. The reduced convection leads to an increase in the maxima of 0.39 K.
This means that for the thermally insulated test boxes, the heat capacity has a bigger influence on the temperature reduction than the shading effect and the cooling due to evapotranspiration.
The main result of this validation is that although the interior temperature of the greened test box can be simulated with an RMS value between simulation and measurement of 2.33 K, the results of measurement and simulation regarding the temperature reduction in the greening differ only slightly by 0.67 K for the daily maxima.
8. Setup of a Model for a Typical Residential Building and Description of the Considered Variations
It is difficult to obtain information on the cooling effect of greenings for real buildings by direct measurements. For this reason, a simulation approach is chosen. The validated simulation methods for the implementation of the different physical effects of a greening are transferred from the TRNSYS model of the test box to a TRNSYS model of a real residential building.
The physical effects of the greening are considered in the following ways: The heat capacity, the shading effect, and the reduced convection coefficient are implemented in the wall construction for the greened surface of the building using the “Construction Type Manager” of TRNSYS. The cooling by evapotranspiration is implemented using the “Gain/loss Type Manager”, which means that the cooling power is taken directly from inside the building.
The geometry of an existing residential building is used. Table 8 shows the relevant geometric data of the building.

Table 8.
Geometry data of the considered residential building.
With SketchUp, the 3D geometry of the building is created and imported into TRNSYS. Figure 17 shows the 3D geometry of the building.
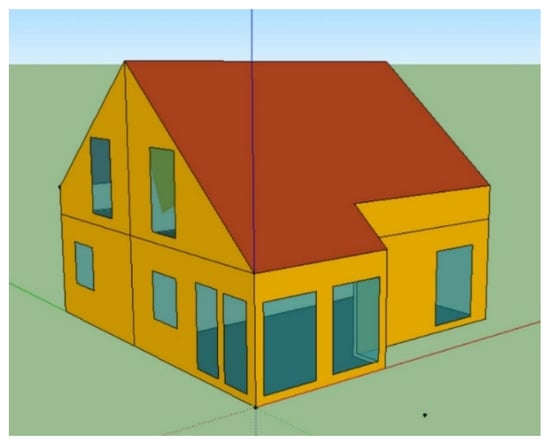
Figure 17.
The 3D geometry of the considered residential building.
The building consists of four rooms (thermal zones in TRNSYS). These thermal zones are named as follows:
1st floor south side: 1S;
1st floor north side: 1N;
2nd floor south side:2S;
2nd floor north side:2N.
The construction and the parameters of the different surfaces of the building are shown in Table 9. Table 10 contains the material properties used for the simulation (taken from [21]). The considered windows have heat-insulating glazing with two planes.

Table 9.
TRNSYS wall construction of the residential building. Values for absorptance taken from [22], for convection coefficients from [21,23].

Table 10.
Material properties used for the simulation [17,22].
Other parameters used for the simulation are the air exchange rate n, which describes the ventilation and infiltration of the building, as well as the internal energy gains generated by the occupants and the electric devices. The used values for those parameters are shown in Table 11.

Table 11.
Parameter for infiltration, ventilation and gains due to inhabitants and electric devices.
Weather input data for the simulation and the test reference year for the location of the free field test side, Triesdorf, Germany, is used. The simulation time is one year, and the simulation is performed in 10 min time steps.
Different greening configurations are considered. Table 12 shows an overview of the variations, and Table 13 shows the parameters of the considered plants.

Table 12.
Overview of the considered variations in greening.
9. Results for the Possible Reductions in Overheating Hours and Energy Demand for Climatisation in Summer Due to Greening and Hydraulic Connections for a Typical Residential Building
The TRNSYS model of the residential building provides the interior air temperature as a time series with 10 min average values for a year with typical weather conditions for each room of the building. The following two different conditions are taken into account:
- Consideration A: heating and cooling are turned off, so the interior air temperature depends only on the building construction and the weather conditions.
- Consideration B: Heating and cooling are turned on.
From Consideration A, the daily temperature maxima (normally between midday and afternoon) and minima (after midnight) can be evaluated. Results for some variants are shown in Figure 18, Figure 19 and Figure 20. Figure 18 shows the daily temperature maxima and minima for room 2S (second floor, south side) for the ungreened building (var 0) and the building with the whole roof greened with the Sedum (var 2). It can be seen that the maxima are reduced moderately by about 2.2 K (see also Appendix A, Table A2). In room 2S, the greening leads to the biggest reduction in the maximum temperatures. For room 1N (first floor, north side), the simulated daily maxima and minima for var 0 and 2 are shown in Figure 19. Here, the difference between the greened and the ungreened roof is only about 0.5 K (see also Appendix A, Table A3). The temperature reductions due to the greening differ strongly from room to room.
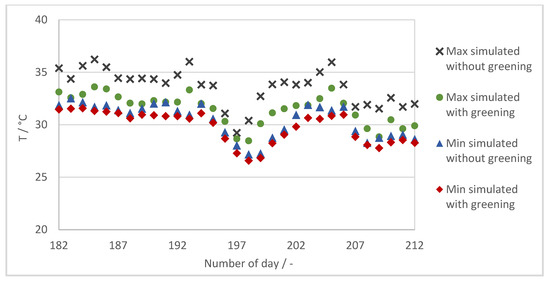
Figure 18.
Simulated temperature peaks for the reference (ungreened) and variation 2 (roof completely greened with Sedum) for room 2S for July.
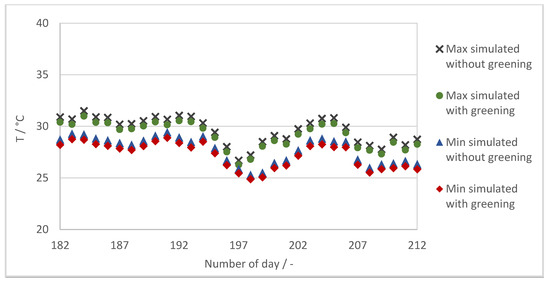
Figure 19.
Simulated temperature peaks for the reference (ungreened) and variation 2 (roof completely greened with Sedum) for room 1N for July.
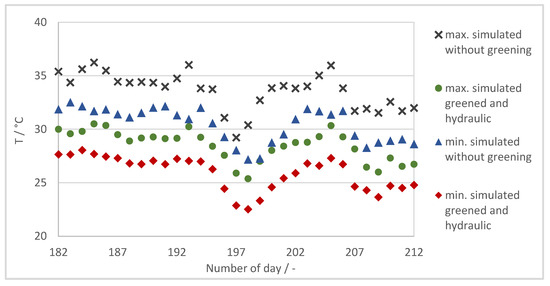
Figure 20.
Simulated temperature peaks for the reference (ungreened) and variation 4 (roof completely greened with Sedum and hydraulic connection) for room 2S for July.
The greening of the whole roof in combination with the hydraulic connection leads to the results for room 2S, shown in Figure 20. The maxima of the temperatures are reduced by about 5.2 K (see also Appendix A, Table A2).
To obtain an overview, the temperature reductions by the different greening variations are averaged over the four rooms of the building. In Table 14, the values, averaged for summertime and for the four rooms of the building, are provided for each considered variant.

Table 14.
Simulation results for the residential building for summer (averaged for the 4 rooms).
The results shown in Table 14 are discussed briefly in the following. The simulation of the residential building leads to the average room temperatures shown in the first column of Table 14. In the building without greening, an average temperature of about 27.9 °C occurs. This temperature can be reduced by greening the complete roof with Sedum to 26.9 °C. The average reduction in the temperature (column 6 of Table 14) is about 1.0 K; the corresponding RMS value in column 7 is about the same, which means there are nearly no increases that could have compensated for the decreases in the calculation of the average. In the two last columns, the influence of the different greenings upon the daily maxima of the greening can be seen. Here, the average reduction is also about the same as the RMS values of the reduction.
The main results are as follows:
- The greening with Sedum reduces the average room temperature by about 1.0 K and the daily maxima by 1.3 K.
- An additionally applied hydraulic connection between greening and interior leads to a reduction in the average room temperature by 3.3 K, and the daily maxima are reduced by about 3.4 K.
- Plants with a higher Leaf Mass Index (LMI) could lead to higher average reductions of 3.0 K without an additional hydraulic connection.
- With higher LMI and an additional hydraulic connection, average reductions of about 7.7 K are possible.
Also, from Consideration A, the overheating hours, the number of hours per year in which the interior air temperature rises above a certain threshold, can be evaluated. Here, 25 °C is chosen as the threshold. The results for the overheating hours are shown in Table 14 (columns 3 to 5) and Figure 21.
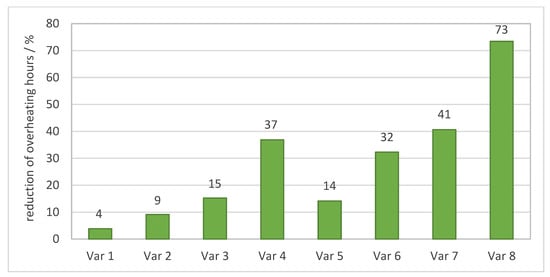
Figure 21.
Potential reduction in yearly overheating hours due to the different variations in the greening, averaged for the 4 rooms of the resident building.
It can be seen that the overheating hours can be reduced significantly by the greening of the residential building. The greening of the complete roof with Sedum (var 2) reduces the overheating hours by 9%. If an additional hydraulic connection is applied (var 4), the overheating hours are reduced by 37%. The implementation of plants with higher cooling power (for example, Carex, see Section 4) leads to a reduction in the overheating hours by 32%, and an additional application of the hydraulic connection results in a reduction of 73%.
With Consideration B, when heating and cooling are turned on in the simulation, the yearly electric energy demand for climatisation can be calculated. The results for the energy savings are shown in Figure 22. It is assumed that a heat pump with a cop of 3.5 is used for cooling, and the assumed set temperature for climatisation is 25 °C.
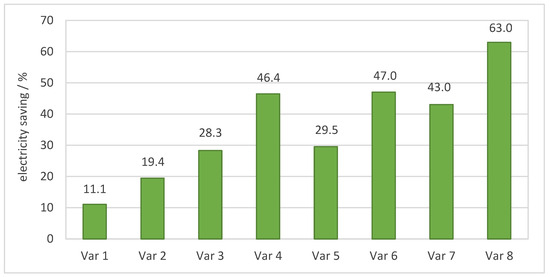
Figure 22.
Potential electricity savings when operating a heat pump for cooling due to the different variations in the greening.
A greening of the complete roof with Sedum (variant 2) leads to a reduction in the yearly electric energy for climatisation of about 19%. The reduction can be increased up to about 46% by the hydraulic connection (variant 4).
10. Weak Points
The validation in Section 7 shows an underestimation of the temperature effects of the greening by the model. The reduction in the daily peaks is underestimated by the model by about 12%.
There might be several reasons for the underestimation. Two reasons are the measurement procedures for the transmission coefficient and for the cooling power of the plants.
The transmission coefficient is measured for light that hits the plant layer perpendicularly. Under real conditions, light will very rarely penetrate vertically through the plant layer. So, under real conditions, the path of light through the plants will be longer, as it was in the measurement. This will lead to an overestimation of the transmission coefficient by the measurement. The shading effect is underestimated.
A similar effect can be observed when measuring the cooling power. The mass of the evaporated water is measured in a climate chamber under a low radiation intensity of only about 102 W/m2. Under real weather conditions, higher radiation intensities will be found. This will lead to higher cooling powers. So, the cooling power is underestimated in the introduced approach.
The underestimation of the shading effect and of the cooling power results in an underestimation of the temperature reduction by the model. So, the introduced modelling approach can be considered to be conservative.
In the TRNSYS models used in Section 7 and Section 8, the temperature dependency of the material properties of the substrate, as well as the dependency of the cooling power from the water saturation of the substrate, is not considered. Here, values of 20 °C and a water content of 23% mass are used. These dependencies will be the subject of further investigations.
Other sophisticated effects can be found. The fraction of cooling power, taken from inside the building, depends, among other things, on the outside and inside air temperatures. This effect cannot be implemented completely in the described procedure. For this reason, an integrated model of exterior air, roof greening, building envelope, and interior air will be developed in the future.
In the described modelling approach, the cooling power due to evapotranspiration cannot be taken from the location where it occurs (plants and surface of substrate) because TRNSYS does not offer a suitable functionality for that. Instead, the corrected cooling power is taken directly from inside the building. In this way, the inside air temperature of the building can be calculated, but it is not possible to calculate the correct wall temperatures by this approach (described in Section 7). It has to be examined whether more precise models can be developed.
The RMS value between measured interior temperatures and simulated interior temperatures is about 2.3 K (see Section 7). This has to be considered if absolute values for interior temperatures of greened buildings shall be calculated. For the comparison of reductions in interior air temperatures for different greening versions, the described approach is valid. In Table 7, the simulated temperature reduction in the greening (RMS value 3.27 K) has about the same value as the measured one (RMS value 3.28 K).
11. Conclusions and Outlook
The introduced approach, which combines measurements and modelling, is applicable for the evaluation of the interior cooling effect of green roofs on residential buildings.
Nevertheless, in addition to the performed validation at the test buildings, a validation at real buildings could help to emphasise the results presented.
It can be seen that a green roof can lead to a reduction in the interior temperature in residential buildings in summer. Therefore, overheating in buildings can be reduced moderately. The cooling effect in real buildings is strongly limited by the thermal insulation of modern buildings, which leads to a decoupling of the location of the cooling and the interior of the building.
This decoupling can be mitigated by the application of a hydraulic connection between the greening and the interior of the building. With the hydraulic connection, the interior cooling can be improved significantly. The greening of the roof of a typical residential building reduces the interior room temperature between 1.0 K and 3.0 K; the additional application of a hydraulic connection increases the reduction by an additional 2.3 K to 4.7 K. Overheating hours can be reduced by up to 73% when a hydraulic connection is applied.
The demand for annual electric energy for the operation of a heat pump for cooling in the considered residential building can potentially be reduced between 11% and 63%. The included saving of electric energy due to the hydraulic connection is in the range of 20% (27% for Sedum and 16% for plants with higher cooling power).
As described in Section 9, the greening of roofs leads to a decrease in the interior air temperature. Under summer conditions, this effect is desirable and leads to a decrease in the energy needed for air conditioning. Under winter conditions, this effect is undesirable and could lead to an increase in heating energy demand. It has to be evaluated whether the plants and the substrate show a relevant cooling effect due to evapotranspiration under winter conditions. To prevent this possible negative effect, it would make sense to favour plants that lose their leaves in winter. A further advantage of such plants would be the elimination of the shading effect in winter, as this is also undesirable during the heating period.
A roof greening with a strongly transpiring kind of plant in combination with a hydraulic connection could lead to a higher temperature decrease in the room directly under the greening, as wanted. In further studies, complex regulation systems for the hydraulic connection have to be considered in order to optimise the cooling.
Author Contributions
Conceptualization, A.R.; methodology, A.R. and M.W.; software, A.R.; validation, A.R.; formal analysis, A.R. and M.W.; investigation, A.R., W.E., and M.W.; data curation, A.R.; writing—original draft preparation, A.R.; writing—review and editing, A.R., W.E., and M.W.; visualization, A.R. and M.W.; supervision, A.R. and W.E.; project administration, A.R.; funding acquisition, A.R. All authors have read and agreed to the published version of the manuscript.
Funding
The project is funded by the German Federal Ministry of Economic Affairs and Climate Protection (BMWK) based on a resolution of the German Bundestag, and supervised by AiF, the working group of industrial research associations (grant number: KK5517001 LU2). The APC was also funded by German Federal Ministry of Economic Affairs and Climate Protection (BMWK).
Data Availability Statement
The measurement data used are currently the subject of further publications. For this reason, the data are currently unavailable.
Acknowledgments
The authors would like to express their gratitude to eft-system GmbH for providing the heat exchanger tube elements.
Conflicts of Interest
The authors declare no conflict of interest.
Appendix A
The TRNSYS Model of the test box.
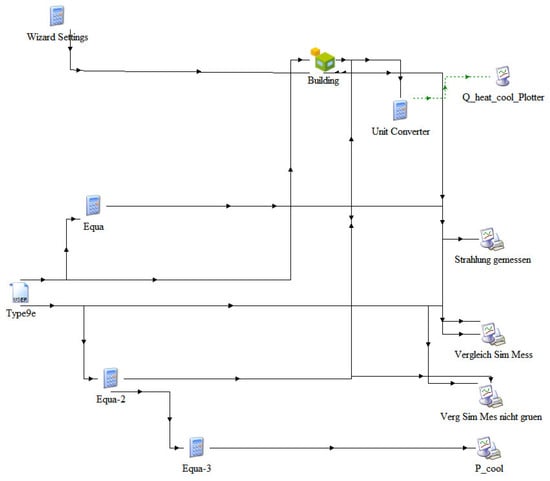
Figure A1.
TRNSYS model of the test box.
Results of the TRNSYS simulation for the different rooms of the residential building.

Table A1.
Simulation results for room 1S of the residential building.
Table A1.
Simulation results for room 1S of the residential building.
| Variant | For the Entire Year | For Summer (1st of May to 15th of September) | ||||||||
|---|---|---|---|---|---|---|---|---|---|---|
| Average Summer-Roomtemp. | Over-Heating Hours | Reduction of Over-Heating Hours | Reduction of Over-Heating Hours | Average Deviation | RMS | Maximum Deviation | Average Deviation of Peaks | RMS of Peaks | ||
| /°C | /h | /h | /% | /K | /K | /K | /K | /K | ||
| V0 | ungreened | 29.56 | 2931 | - | - | - | - | - | - | - |
| V1 | south roof greened, sedum | 29.18 | 2840 | 91 | 3.10 | 0.37 | 0.37 | 0.50 | 0.36 | 0.37 |
| V2 | whole roof greened, sedum | 29.09 | 2822 | 109 | 3.72 | 0.47 | 0.46 | 0.60 | 0.45 | 0.46 |
| V3 | hydraulic, south roof greened, sedum | 28.29 | 2614 | 317 | 10.82 | 1.27 | 1.26 | 1.41 | 1.25 | 1.25 |
| V4 | hydraulic, whole roof greened, sedum | 27.98 | 2548 | 383 | 13.07 | 1.57 | 1.57 | 1.72 | 1.55 | 1.56 |
| V5 | south roof greened, fictive plants | 28.29 | 2635 | 296 | 10.10 | 1.27 | 1.27 | 1.51 | 1.25 | 1.26 |
| V6 | whole roof greened, fictive plants | 28.02 | 2581 | 350 | 11.94 | 1.53 | 1.54 | 1.82 | 1.52 | 1.53 |
| V7 | hydraulic, south roof greened, fictive plants | 26.48 | 2172 | 759 | 25.90 | 3.07 | 3.07 | 3.32 | 3.05 | 3.06 |
| V8 | hydraulic, whole roof greened, fictive plants | 25.78 | 2004 | 927 | 31.63 | 3.77 | 3.77 | 4.07 | 3.75 | 3.76 |

Table A2.
Simulation results for room 2S of the residential building.
Table A2.
Simulation results for room 2S of the residential building.
| Variant | For the Entire Year | For Summer (1st of May to 15th of September) | ||||||||
|---|---|---|---|---|---|---|---|---|---|---|
| Average Summer-Roomtemp. | Over-Heating Hours | Reduction of Over-Heating Hours | Reduction of Over-Heating Hours | Average Deviation | RMS | Maximum Deviation | Average Deviation of Peaks | RMS of Peaks | ||
| /°C | /h | /h | /% | /K | /K | /K | /K | /K | ||
| V0 | ungreened | 29.10 | 2699 | - | - | - | - | - | - | - |
| V1 | south roof greened, sedum | 27.84 | 2471 | 228 | 8.45 | 1.27 | 1.45 | 3.44 | 1.95 | 2.04 |
| V2 | whole roof greened, sedum | 27.65 | 2448 | 251 | 9.30 | 1.45 | 1.62 | 3.65 | 2.15 | 2.24 |
| V3 | hydraulic, south roof greened, sedum | 24.77 | 1730 | 969 | 35.90 | 4.33 | 4.51 | 7.38 | 4.55 | 4.61 |
| V4 | hydraulic, whole roof greened, sedum | 24.15 | 1537 | 1162 | 43.05 | 4.95 | 5.12 | 8.03 | 5.19 | 5.24 |
| V5 | south roof greened, fictive plants | 25.00 | 1803 | 896 | 33.20 | 4.10 | 4.21 | 6.97 | 4.69 | 4.76 |
| V6 | whole roof greened, fictive plants | 24.46 | 1621 | 1078 | 39.94 | 4.65 | 4.74 | 7.63 | 5.25 | 5.31 |
| V7 | hydraulic, south roof greened, fictive plants | 18.84 | 61 | 2638 | 97.74 | 10.26 | 10.49 | 14.93 | 9.74 | 9.80 |
| V8 | hydraulic, whole roof greened, fictive plants | 17.41 | 1 | 2698 | 99.96 | 11.69 | 11.90 | 16.50 | 11.17 | 11.22 |

Table A3.
Simulation results for room 1N of the residential building.
Table A3.
Simulation results for room 1N of the residential building.
| Variant | For the Entire Year | For Summer (1st of May to 15th of September) | ||||||||
|---|---|---|---|---|---|---|---|---|---|---|
| Average Summer-Roomtemp. | Over-Heating Hours | Reduction of Over-Heating Hours | Reduction of Over-Heating Hours | Average Deviation | RMS | Maximum Deviation | Average Deviation of Peaks | RMS of Peaks | ||
| /°C | /h | /h | /% | /K | /K | /K | /K | /K | ||
| V0 | ungreened | 25.90 | 2175 | - | - | - | - | - | - | - |
| V1 | south roof greened, sedum | 25.80 | 2145 | 30 | 1.38 | 0.10 | 0.10 | 0.12 | 0.10 | 0.10 |
| V2 | whole roof greened, sedum | 25.39 | 1994 | 181 | 8.32 | 0.51 | 0.51 | 0.61 | 0.50 | 0.51 |
| V3 | hydraulic, south roof greened, sedum | 25.55 | 2061 | 114 | 5.24 | 0.35 | 0.34 | 0.36 | 0.34 | 0.35 |
| V4 | hydraulic, whole roof greened, sedum | 24.19 | 1542 | 633 | 29.10 | 1.71 | 1.70 | 1.82 | 1.69 | 1.70 |
| V5 | south roof greened, fictive plants | 25.55 | 2067 | 108 | 4.97 | 0.35 | 0.34 | 0.39 | 0.34 | 0.35 |
| V6 | whole roof greened, fictive plants | 24.37 | 1606 | 569 | 26.16 | 1.53 | 1.53 | 1.84 | 1.52 | 1.53 |
| V7 | hydraulic, south roof greened, fictive plants | 25.06 | 1868 | 307 | 14.11 | 0.84 | 0.83 | 0.88 | 0.83 | 0.84 |
| V8 | hydraulic, whole roof greened, fictive plants | 21.96 | 701 | 1474 | 67.77 | 3.94 | 3.93 | 4.26 | 3.92 | 3.93 |

Table A4.
Simulation results for room 2N of the residential building.
Table A4.
Simulation results for room 2N of the residential building.
| Variant | For the Entire Year | For Summer (1st of May to 15th of September) | ||||||||
|---|---|---|---|---|---|---|---|---|---|---|
| Average Summer-Roomtemp. | Over-Heating Hours | Reduction of Over-Heating Hours | Reduction of Over-Heating Hours | Average Deviation | RMS | Maximum Deviation | Average Deviation of Peaks | RMS of Peaks | ||
| /°C | /h | /h | /% | /K | /K | /K | /K | /K | ||
| V0 | ungreened | 26.96 | 2380 | - | - | - | - | - | - | - |
| V1 | south roof greened, sedum | 26.76 | 2340 | 40 | 1.68 | 0.20 | 0.19 | 0.27 | 0.21 | 0.22 |
| V2 | whole roof greened, sedum | 25.48 | 1991 | 389 | 16.34 | 1.48 | 1.57 | 2.86 | 1.93 | 1.97 |
| V3 | hydraulic, south roof greened, sedum | 26.29 | 2230 | 150 | 6.30 | 0.66 | 0.66 | 0.75 | 0.69 | 0.69 |
| V4 | hydraulic, whole roof greened, sedum | 21.98 | 801 | 1579 | 66.34 | 4.98 | 5.10 | 7.25 | 4.98 | 5.01 |
| V5 | south roof greened, fictive plants | 26.29 | 2237 | 143 | 6.01 | 0.66 | 0.66 | 0.80 | 0.68 | 0.69 |
| V6 | whole roof greened, fictive plants | 22.70 | 1088 | 1292 | 54.29 | 4.26 | 4.33 | 6.53 | 4.59 | 4.63 |
| V7 | hydraulic, south roof greened, fictive plants | 25.35 | 1947 | 433 | 18.19 | 1.61 | 1.60 | 1.77 | 1.64 | 1.65 |
| V8 | hydraulic, whole roof greened, fictive plants | 15.66 | 0 | 2380 | 100.00 | 11.30 | 11.48 | 15.37 | 10.55 | 10.58 |
References
- Deutsches Bundesministerium für Wirtschaft und Klima. Energiedaten. 20 January 2022. Available online: https://www.bmwk.de/Redaktion/DE/Artikel/Energie/energiedaten-gesamtausgabe.html (accessed on 13 September 2023).
- Janson, M. Kühle Luft (Digital Picture). Statista. 18 July 2019. Available online: https://de.statista.com/infografik/18722/energieverbrauch-von-klimaanlagen/ (accessed on 11 October 2022).
- Niachou, A.; Papakonstantinou, K.; Santamouris, M.; Tsangrassoulis, A.; Mihalakakou, G. Analysis of the green roof thermal properties and investigation of its energy performance. Energy Build. 2001, 33, 719–729. [Google Scholar] [CrossRef]
- Morakinyo, T.; Dahanayake, K.; Ng, E.; Chow, C. Temperature and cooling demand reduction by green-roof types in different climates and urban densities: A co-simulation parametric study. Energy Build. 2017, 145, 226–237. [Google Scholar] [CrossRef]
- Mihalakakou, G.; Souliotis, M.; Papadaki, M.; Menounou, P.; Dimopoulos; Kolokotsa, D.; Paravantis, J.; Tsangrassoulis, A.; Panaras, G.; Giannakopoulos, E.; et al. Green roofs as a nature-based solution for improving urban sustainability: Progress and perspectives. Renew. Sustain. Energy Rev. 2023, 180, 113306. [Google Scholar] [CrossRef]
- von Tils, R. Einfluss von Gebäudebegrünung auf das Innenraumklima—Simulationen mit Einem Mikroskaligen Modell; Gottfried Wilhelm Leibniz Universität Hannover: Hannover, Germany, 2020. [Google Scholar]
- Jaffal, I.; Ouldboukhitine, S.; Belarbi, R. A comprehensive study of the impact of green roofs on building energy performance. Renew Energy 2012, 43, 157–164. [Google Scholar] [CrossRef]
- Jiandong, R.; Mingfang, T. Effect of Green Roofs Combined with Ventilation on Indoor Cooling and Energy Consumption. Energy Procedia 2017, 141, 260–266. [Google Scholar] [CrossRef]
- Jamei, E.; Chau, H.; Seyedmahmoudian, M.; Stojcevski, A. Review on the cooling potential of green roofs in different climates. Sci. Total Environ. 2021, 791, 148407. [Google Scholar] [CrossRef] [PubMed]
- Berardi, U.; GhaffarianHoseini, A.; GhaffarianHoseini, A. State-of-the-art analysis of the environmental benefits of green roofs. Appl. Energy 2014, 115, 411–428. [Google Scholar] [CrossRef]
- La Roche, P.; Berardi, U. Comfort and energy savings with active green roofs. Energy Build. 2014, 82, 492–504. [Google Scholar] [CrossRef]
- La Roche, P.; Yeom, D.; Ponce, A. Passive cooling with a hybrid green roof for extreme climates. Energy Build. 2020, 224, 110243. [Google Scholar] [CrossRef]
- Yeom, D.; La Roche, P. Investigation on the cooling performance of a green roof with a radiant cooling system. Energy Build. 2017, 149, 26–37. [Google Scholar] [CrossRef]
- Austrotherm Dämmstoffe. Austrotherm XPS TOP P GK—Data Sheet. Available online: https://www.austrotherm.de/produkte/austrotherm-xps/austrotherm-xps-top-p-gk (accessed on 29 May 2024).
- ANSYS, Inc. Products 2019 R2. ANSYS CFX Material Data Base; ANSYS, Inc.: Canonsburg, PA, USA, 2019. [Google Scholar]
- Gesellschaft Verfahrenstechnik und Chemieingenieurwesen. VDI-Wärmeatlas, 11th ed.; Springer Vieweg: Berlin/Heidelberg, Germany, 2009; p. 704. [Google Scholar]
- Wörlein, M. “Betrachtung von Modellgebäuden mit Hilfe von CFD” (Consideration of Test Buildings Using CFD). Master’s Thesis, HSWT, Weidenbach, Germany, 2024. [Google Scholar]
- Kutzner, D. “Bestimmung der Kühlleistung von Begrünungen durch Evapotranspiration” (Determination of Cooling Power of Greenings due to Evapo-Transpiration). Bachelor’s Thesis, HSWT, Weidenbach, Germany, 2024. [Google Scholar]
- Steuber, D.; Haschek, S. “Verdunstung von Wasser” (Evaporation of Water). University Gratz. 2013. Available online: https://imsc.uni-graz.at/keeling/modI_ss13/projekten/HaschekSteuberBericht.pdf (accessed on 5 March 2024).
- Wörlein, M.; Vollmar, C.; Gerbl, J.; Delaloye, G. “Aufbau und Inbetriebnahme eines Versuchsstandes zur Messung des Transmissionskoeffizienten von Gebäudebegrünung” (Establishment and Initial Operation of a Test Side for Transmission Coefficients of Greenings); Project Report; HSWT: Weidenbach, Germany, 2023. [Google Scholar]
- Ratka, A.; Schneider, K.; Ernst, W. “Verbesserung der Wärmedämmung an Gebäuden durch Fassadenbegrünung” (Improvement of Heat Insulation of Buildings due to Facade Greening); Fachforum Green Buildings: Frankfurt am Main, Germany, 2016. [Google Scholar]
- Transsolar. Material Database of the Software TRNSYS 18.05.001. c 2009–2021. Available online: http://www.transsolar.com (accessed on 31 October 2025).
- DIN EN ISO 6946; Bauteile—Wärmedurchlasswiderstand und Wärmedurchgangskoeffizient—Berechnungsverfahren (Building Components and Building Elements—Thermal Resistance and Thermal Transmittance—Calculation Methods). German Industry Standard: Berlin, Germany, 2018.
Disclaimer/Publisher’s Note: The statements, opinions and data contained in all publications are solely those of the individual author(s) and contributor(s) and not of MDPI and/or the editor(s). MDPI and/or the editor(s) disclaim responsibility for any injury to people or property resulting from any ideas, methods, instructions or products referred to in the content. |
© 2025 by the authors. Licensee MDPI, Basel, Switzerland. This article is an open access article distributed under the terms and conditions of the Creative Commons Attribution (CC BY) license (https://creativecommons.org/licenses/by/4.0/).