Abstract
Recycled asphalt pavement (RAP) can support traffic loads comparable to those of roads constructed with conventional materials. The structural evaluation of RAP is performed through the deflection generated by vehicles via recoverable deflection in the pavement layers. The deflection record is translated into a curve that geometrically interprets the behavior of the layers that make up the pavement. In this study, a falling weight deflectometer (FWD) was used to emulate transit loads and measure deflection in two models. Both contained 30% RAP, and one of them had fiberglass geogrid in the center of the asphalt layer. Through normalized maximum deflection (limit value based on constant stress), the structural index (SI), and the dynamic stiffness modulus (DSM), the structural behavior of the models under different load levels was evaluated. The pavement structure exhibited similarities in strength for both models subjected to impact. The presence of the geogrid reinforcement (Z1) showed structural index values ranging between 0.17 and 0.54, while the layer without geogrid (Z2) presented structural index values in a range of 0.23 to 0.78. In addition, the dynamic stiffness modulus presented a difference of 10 kN/mm between the maximums of the models in favor of reinforcement with glass fiber geogrid. Therefore, low structural index values are associated with the interaction between RAP and geogrid, highlighting this combination as an innovative and functional system for road surfaces, while the dynamic stiffness modulus indicates the stability and structural integrity of sustainable pavement, which has the potential to extend its lifespan.
Keywords:
pavement; deflection; structure; RAP; layers; measure; lifespan; endurance; normalized; evaluation; recovery 1. Introduction
Roads constructed with recycled asphalt pavement (RAP) enhance the sustainability of roadway infrastructure [1]. They save construction costs and reduce the negative impact on the environment [2]. The incorporation of RAP into new asphalt mixtures is a common practice in road construction [3]. However, the presence of RAP in asphalt mixtures increases their rigidity, allowing prediction of their vulnerability under different load levels [4]. Furthermore, due to its nature, RAP exhibits a reduction in the efficiency of its components, which diminishes the lifespan of the mixtures that contain it [5]. Maximizing the lifespan of pavements is a priority for transportation agencies seeking safety and comfort for road users [6]. Geogrids are reinforcing geosynthetic materials that extend the lifespan of pavements [7,8]. The incorporation of fiberglass geogrids into asphalt surface layers delays the propagation of cracks, thereby enhancing their service condition for an extended period [9]. Nevertheless, a functional pavement, as a predominant technical criterion, primarily considers user comfort without assessing the condition of its structure [10]. Therefore, the importance of achieving a sustainable pavement lifespan is increasingly critical in the effective interaction between components to evaluate their quality through structural performance.
Currently, geosynthetic reinforcement in flexible pavements not only aids in deformation control but can also extend the lifespan of pavements by increasing the traffic benefit-to-cost ratio [11]. The most suitable geosynthetic material for controlling deflections in pavements may vary according to the specific conditions of each project; however, geotextiles, geogrids, and geocells are commonly utilized due to their reinforcement and soil stabilization properties [12]. Geogrids interact with the soil, restricting the lateral movement of the material. They are applied in the rehabilitation of asphalt pavements with reinforcement configurations to extend the lifespan of these structures [9]. Reinforcement with geogrids in the base layer of the pavement reduces permanent deformation, thereby increasing its longevity thanks to the increased support capacity [13]. Perforated and stretched polypropylene geogrids reduce the thickness of the pavement base layer and stabilize the soil [11]. Geogrid reinforcement increases resistance to fatigue damage of the pavement structure [14]. The use of geogrids depends on the type of material, the direction of response, the configuration of its spaces, and the melting point. It enhances the load-bearing capacity of the pavement, consequently reducing rut deformation [15]. Correspondingly, the reinforcement of asphalt mixtures through the application of various types of geogrids reduces the occurrence of cracking [16]. Conversely, RAP (recycled asphalt pavement) aggregate is applied in the surface layers for the asphalt cement, which allows mixtures with higher strength to be produced [17]. However, 100% replacement by RAP in situ has not proven successful due to data censored by maintenance and inspection activities [18]. An excessive replacement by RAP leads to reduced bonding between RAP aggregates and virgin asphalt [19]. A 20% RAP content in asphalt mixtures demonstrates the best Marshall stability response [20]. Nevertheless, RAP content can be increased without exceeding 30% replacement to avoid compromising the performance of the mixture [21]. Therefore, geogrids and the tread layer containing RAP can interact as a composite that contributes distinct characteristics that positively impact the structural performance of the pavement.
However, an appropriate design of the structure and the selection of compatible materials optimize the system composed of reclaimed asphalt pavement (RAP) and geogrid [22]. The fiberglass geogrid offers a high melting point, preserving geometry and mechanical characteristics when interacting with asphalt [23]. Additionally, the effectiveness of fiberglass geogrids in rehabilitating structures while reducing maintenance periods has been demonstrated [24]. The use of RAP combined with geogrids influences the shear strength at the interface between asphalt layers [25]. Furthermore, the combination of recycled asphalt pavement and geogrids can significantly reduce maintenance and rehabilitation needs for roadways [26]. The configuration of a geotextile within the wearing course and a geogrid below the base course reduces vertical static stresses by up to 66% and improves rutting resistance with a minimum ratio (RRR) of 0.74 [27]. In this context, the strength and stiffness of the entire pavement structure serve to evaluate its lifespan [28]. Both are measurable responses of the pavement and provide a starting point for assessing its structural integrity [29]. Deflection is an important index that reflects the overall load-bearing capacity of the subgrade and pavement, influenced by the density of the compacted material and its stiffness [30]. Unfortunately, pavement prioritization projects for reconstruction or rehabilitation primarily rely on visual identification of deterioration and functional condition studies. Therefore, the application of sustainable pavement composed of RAP and fiberglass geogrid is limited, necessitating further research into its structural behavior to establish the quality of the pavement and its component layers.
This study evaluates an innovative structural system for flexible pavement utilizing a falling weight deflectometer. The system is designed to extend the lifespan of recycled asphalt layers by incorporating an asphalt mix that contains 30% reclaimed asphalt pavement (RAP) and a fiberglass geogrid positioned at the center of the layer. The design is founded on the physical interaction between geosynthetics and other pavement layers where they are typically integrated. The RAP–geogrid system [31] displayed superior performance compared to unreinforced structures, with deflections in its homogeneous zone. It also showed a higher maximum deflection relationship with the normalized area while providing extensive data for quality analysis of pavement conditions with structural indices (SIs) for the model. It should be noted that the combination of the RAP mixture and the fiberglass geogrid reduces the dependence on conventional aggregates, effectively resisting static loads, making it a viable and efficient rehabilitation system for light traffic roads.
2. Materials and Methods
The study was conducted in the experimental area of the postgraduate building at the Faculty of Construction and Habitat Engineering of Veracruz University. Two variants of the RAP–geogrid system, referred to as Z1 and Z2, were implemented [Scheme 1]. Full-scale tests allowed for finite element analysis of the effect of rolling loads on small slabs of the same applied mix [32]. Each variant was constructed using a standardized test structure with a surface area of one square meter, which covers physical access and guarantees the rolling of both tires of the vehicle axles that enter. The Z1 structure featured a 12 cm thick layer of AC-20 hot mix asphalt pavement containing 30% recycled asphalt pavement (RAP) and a fiberglass geogrid with a 5 mm by 5 mm configuration positioned at the center of the layer (a). In contrast, the Z2 structure consisted of a 12 cm thick AC-20 hot mix asphalt pavement layer that also contained 30% RAP, identified as AC-20/30R, but without any geogrid reinforcement (b). Both structures were placed on a layer of well-graded gravel with a maximum nominal size of 0.75 mm, forming an 8 cm thick hydraulic base that was compacted to 95% ASTM D1883-21 [33] and situated on pre-consolidated soil throughout the duration of the paver’s service before low-speed traffic usage.

Scheme 1.
Model footprints for deflection testing: (a) RAP binder structure with geogrid; (b) RAP folder structure without geogrid.
2.1. Materials
Conventional coarse aggregate exhibited a maximum size of 1 inch and a granulometric distribution with 60% of particles falling within the range of 4.75 to 12.50 mm. The relative density of the gravel was 2.90, whereas for the sand it was 2.50, with an average loss of 14% due to wear. Additionally, 12% of the particles were elongated and flat, while the crushed particles with one and two or more faces accounted for 98% and 95%, respectively. The aggregate complied with N∙ CMT∙ 4∙ 04∙ 17 of the Secretariat of Infrastructure, Communications, and Transportation’s “Stone Materials for Asphalt Mixtures”, 2017.
The asphalt binder AC-20 exhibited a maximum penetration of 72 tenths of a millimeter (0.1 mm) at 25 °C. Its viscosity at 60 °C was measured at 2100 Poises, and it had a Cleveland open cup flash point of 250 °C. Additionally, the softening point was recorded at 51.9 °C [34]. No regenerating or fluxing additive was used for the mix.
The RAP material collected from the bank adjacent to the Nautla–Palma Sola segment at 150 kilometers, Veracruz, Mexico [Figure 1a], was utilized as a replacement aggregate after being separated from 1.5% of the aged asphalt using a centrifuge [Figure 1b].
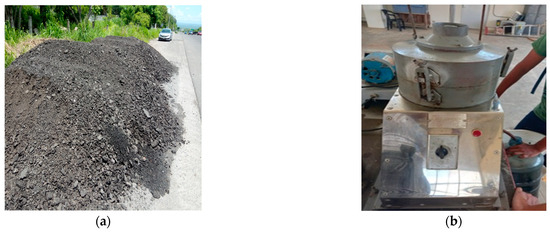
Figure 1.
Recycled asphalt material: (a) RAP bank, (b) centrifuge machine to separate asphalt from the stone aggregate.
This material exhibited a maximum size of ¾ inch and a gradation featuring 60% of particles within the range of 4.75 to 9.50 mm [Figure 2]. The relative density of the gravel was 2.47, whereas the sand had a relative density of 2.41, with an average loss of 18.2% due to abrasion. Additionally, 17% of the particles were classified as elongated and flat, while the crushed particles with one and two or more faces accounted for 98% and 93%, respectively [35].
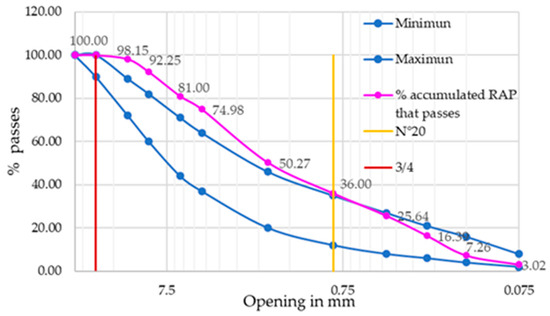
Figure 2.
Granulometric distribution of RAP.
The uncoated fiberglass geogrid [Figure 3] was a commercially acquired product from the Ecomex group, Santa Catarina, Nuevo León exhibiting a tensile strength of up to 0.0002 MPa, a weight of 100 g/m2, and a square configuration of 5 mm by 5 mm, which facilitated uniform load distribution. According to the manufacturer, the geogrid is designed to achieve a service life of over 15 years in aggressive environments, with a 30 MPa tensile modulus and 90% efficiency.
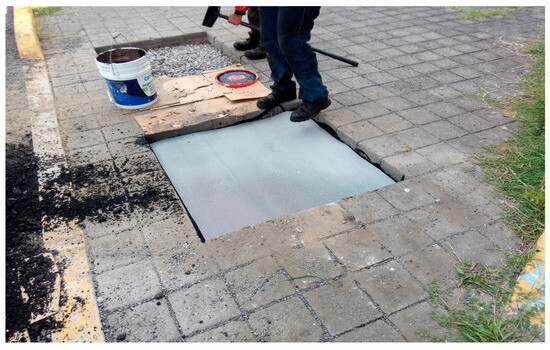
Figure 3.
Fiberglass geogrid laid on the asphalt pavement.
The FWD 8002-403 deflectometer by Dynatest, Gainesville, FL, USA used in this study was provided by YUTAVE Engineering, José Cardel, Mexico [Figure 4]. A type of falling weight deflectometer, it is a non-destructive device used to determine the stress–strain parameters of pavements [36].
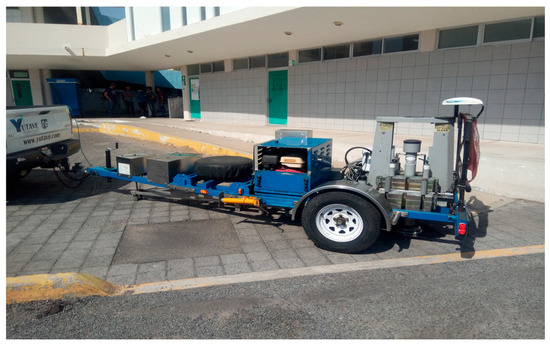
Figure 4.
Falling weight deflectometer.
Furthermore, the application of FWD allows the elastic modules of the pavement layers to be obtained [37]. This equipment records up to 60 test points per hour with a typical 4-step loading sequence, with a load range of 1500 to 27,000 lb∙f.
The deflectometer is equipped with seven effective sensors [Scheme 2] located at distances of 0, 300, 450, 600, 900, 1200, and 1800 mm from the loading plate and is linked to the HDM-4 TRL software v2.0 Wokingham, UK for deflection logging.
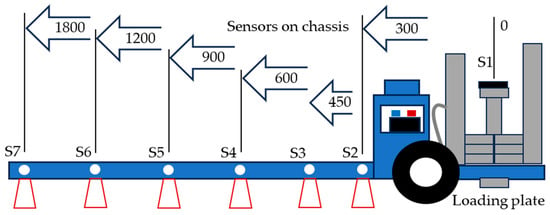
Scheme 2.
Sensor distribution from the loading plate in millimeters.
2.2. Methods
The design of the asphalt mixture was determined using the Marshall method for dense gradation, targeting an expected traffic volume of less than one million equivalent single axle loads (ESALs) of 8.2 tons and viscosity of 0.3 Pa s according to M· MMP·4·05·034/23 [38]. Thus, the compaction stress was equal to 630 kPa, equivalent to a cohesive structure. Sample preparation involved homogenized aggregates with an asphalt content of 3.5% by weight, plus an additional 1.5% provided by the RAP. The test temperature was 60 °C for workability, up to 25 °C when mounted on the loading ring. This approach allowed for the incorporation of reclaimed asphalt pavement (RAP) as a dry-processed aggregate in the mixture formulation, with replacement fractions of 20%, 30%, and 40% and a control mixture with 0% RAP [Table 1].

Table 1.
Control mixture and mixtures with different contents of RAP 1.
The apparent specific gravity of the compacted mixture (Gmb) showed a progressive decrease from 2.40 g/cm3 at 0% to 2.34 g/cm3 at 40%. This reduction indicates that, as the addition percentage increases, the density of the sample decreases slightly; this is related to the greater porosity of the aggregates. On the other hand, the percentage of air voids by volume (Pa) increased linearly from 4.00% to 7.50%. Therefore, as the proportion of the added component increases, the mixture retains more air, which can negatively affect the durability and resistance of the structure. In addition, the void content in the mineral aggregate (VMA) decreased from 16.00% to 14.50% with the increase in RAP, indicating better compaction in the internal voids structure with a discrete trend. The volume of absorbed binder (Vba) increased from 2.00% to 3.50%; therefore, the higher the proportion of RAP added, the greater the binder absorption.
The stability and flow of these mixtures were evaluated against a control mixture composed solely of conventional aggregate. A higher RAP content revealed improved mix stiffness up to a level of 4% asphalt cement. Afterward, the stiffness decreased, and even the mix with 0% RAP achieved better values. This inconsistency indicates the influence of the aging binder, which adds to the asphalt cement content but fails to provide additional adhesion. The color of each line indicates a specific percentage of RAP contained in the mixture. Regarding the stability of the mixture, it was observed that an increase in the percentage of RAP led to improved stiffness Note for a 4.75% asphalt content indicated by the arrow, the mixture with 30% RAP shows greater stability in the circle than the mixture with 20% RAP [Figure 5].
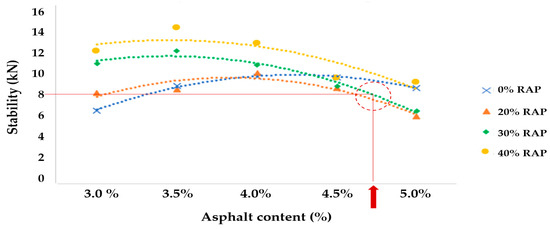
Figure 5.
Marshall stability for different RAP contents.
The deformation also increased as the replacement content of recycled asphalt pavement (RAP) in the mixture increased; however, the deformation should not exceed 4 mm according to ASTM D6927-15 [40]. It is observed at the intersection highlighted within the circle, which shows the 4.75% asphalt content indicated by the arrow, along with the millimeters of flow reached by the mixture with 30% RAP. This limit is intended to ensure that the asphalt mixture has adequate stiffness and resistance to permanent deformation under load. The specification prevents excessive deformation, which could indicate an unsuitable mixture for use in pavements. Therefore, this parameter defines the optimal RAP content as 30% for an AC-20 asphalt content of 4.75%, with a stability of 8.0 kN and a flow of 3.8 mm [Figure 6].
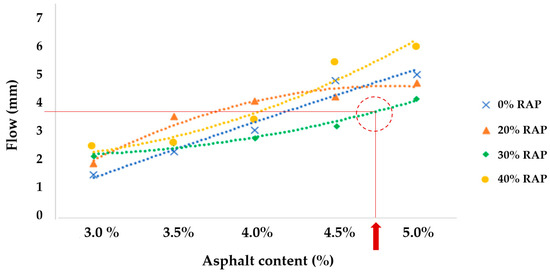
Figure 6.
Marshall flow for different RAP contents.
The color of each line indicates a specific percentage of RAP contained in the mixture. The measurements were conducted on test tracks Z1 and Z2 at three strategic points: the right, center, and left of the built area [Figure 7]. Two tests were performed at each location with a series of 8 impacts applied at four load levels: 400, 700, 900, and 1100 kPa. Additionally, a settlement level was recorded at the beginning of each test according to N·CSV·CAR·1·03·010/17 [41].
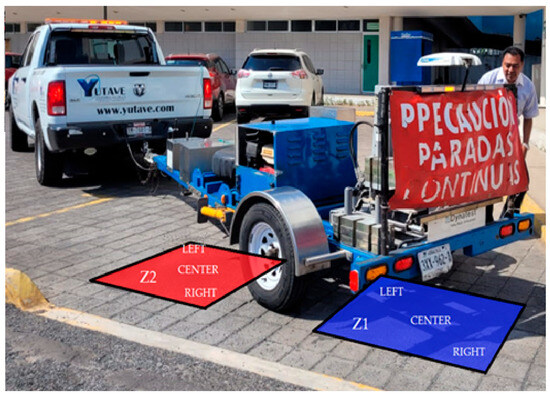
Figure 7.
Deflectometer over checkpoints.
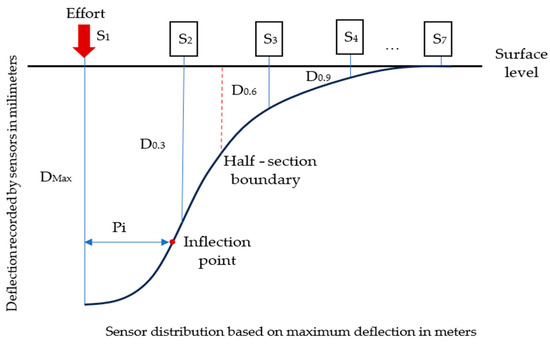
For each test, the distance from the origin was recorded using the readings from the distance measuring instrument (DMI) device installed in the falling weight deflectometer (FWD) equipment. This data was simultaneously linked to its geographical and Universal Transverse Mercator (UTM) coordinates. Following this, the air and pavement surface temperatures were documented, and the firmness and stability of the measured surface were assessed. The loading plate and sensors S1, S2, S3, S4, S5, S6, and S7 were then lowered until they were in contact with the pavement. Upon applying the load, measurements from each sensor were used to create a diagram of the deflection basin [Scheme 3] resulting from the applied load. Additionally, in the diagram, the chaining and magnitude of the load imposed at each reading station are indicated.
Scheme 3.
Recoverable deflection basin.
The structural evaluation of the pavement was performed based on the deflection recorded by the sensor and the distance with respect to the load plate S1 (0), S2 (300), S3 (450), S4 (600), S5 (900), S6 (1200), and S7 (1800), and the homogeneous zones were detected according toAASHTO 1993 design methodology, Cumulative Differences of the Main Body [42].
3. Results
The deflections caused by impact on the bearing layer of pavement made with conventional hot mix asphalt containing 30% recycled asphalt pavement (RAP) were measured according to the recoverable deflection effect. The maximum deflections obtained were 1885 mm for Z1 and 2363 mm for Z2, with the measurements taken for the control point located on the right in both footprints. This data allowed for an assessment of the structural defects based on the following criteria.
3.1. Homogeneous Zones
3.1.1. Deflection Normalization
For registration in the HDM-4 TRL software v2.0 Wokingham, UK (pavement management system), it is essential that the pavement’s response, as measured by deflection, is referenced to a constant stress of 700 kPa according to M·MMP·4·07·020/17. The 700 kPa load represents an average traffic load that pavements support under normal conditions, allowing measurement of how the surface responds to that load. This is necessary to ensure that the equivalence of the response has a fixed reference indicator. However, the pavement’s response is influenced by various factors, such as longitudinal and transverse slopes, which hinder the achievement of this condition. Therefore, it is imperative to perform either interpolation or extrapolation, depending on whether the deflection produced by a stress of 700 kPa is lower or higher [Scheme 4].

Scheme 4.
Normalized deflection: (a) extrapolation process; (b) interpolation process.
Interpolation marked with a dashed red line pointing inward within the figure that completes the proportionality indicated by a green line of deflection under the stresses. is used to estimate values at intermediate locations, minimizing errors greater than 3% and preserving model fidelity. Extrapolation marked with a flashing red line outward from the figure that completes the proportionality indicated by a green line of deflection under the stresses, on the other hand, is used to predict values outside the experimental range, always considering a difference of less than 3%, to assess the uncertainty inherent in these estimates. This contributes to more accurate and reliable deflection normalization, facilitating subsequent comparisons and analyses with greater technical rigor.
This study focused on the evaluation of deflection at various control points under controlled stress conditions, which included seven sensor locations where normalization was performed for four levels of load across all deflection tests, depending on whether interpolation or extrapolation was applied [Table 2]. The data obtained reveals a clear pattern in the relationship between stress normalization (kPa) and the resulting deflection (mm) at the recorded checkpoints.

Table 2.
Normalized deflection in millimeters 2.
3.1.2. Temperature Correction
Pavement deflection is influenced by discontinuities in the pavement structure as well as variations in the temperature of the asphalt layers [43]. To normalize the deflections to a temperature of 20 °C, a correction factor is applied, derived from the graph for pavements with hydraulic bases or stabilized with asphalt, as indicated in the manual M·MMP·4·07·020/17 [44]. In this study, the correction factor was determined from the graph [Figure 8] at the intersection of temperature and total thickness of the tread layers of the Z1 and Z2 tracks of the experimental area designated for this study.
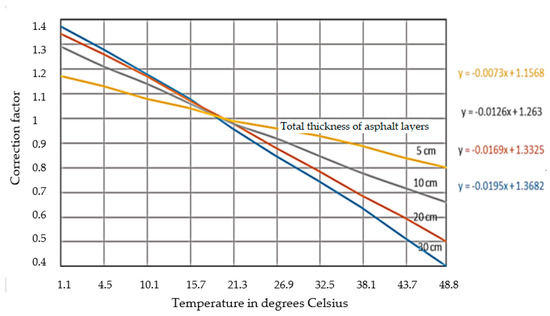
Figure 8.
Homogeneous areas of the test footprints. Adapted from M·MMP·4·07·020/17.
This allowed for the adjustment of measured deflections to a standardized value corresponding to 20 °C by multiplying the originally recorded deflection by the correction factor. This adjustment is essential to ensure that the test results are comparable.
This adjustment allowed homogeneous zones to be identified by focusing solely on the deflections measured from the load plate, as this area experiences the greatest recoverable deflection, thereby representing the maximum deflection (D max), which was specifically observed on the rolling surface of the experimental area [Figure 9].
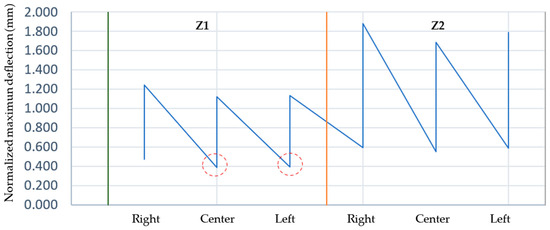
Figure 9.
Homogeneous areas of the test footprints.
The broken blue polygon shows the normalized deflection for both footprints of the model, separated by the orange line, with circles indicating the control points that present a homogeneous zone.Deflection indicator:
- Acceptable range: deflection less than or equal to 0.40 mm;
- Unacceptable range: deflection greater than 0.40 mm.
Referring to N∙CSV∙ CAR∙1∙03∙010/17 [41], which is related to the determination of the deflection of an SICT pavement, the values for Z1-LEFT and Z1-CENTER were determined for a normalized load level equal to 400 kPa and homogeneous zones with a deflection of less than 0.40 mm.
3.2. Derived Indicators from the Deflection Test
The magnitude and shape of the vertical displacements recorded during the deflection tests are closely related to the resistance, rigidity characteristics, and thickness of the layers. Specifically, deflections in the middle part of the basin reflect the relative stiffness of the intermediate layers, while deflections further away from the load axis are associated with the stiffness of the lower layers [45].
3.2.1. Normalized Area (NA0.9)
To calculate the normalized area (NA), the deflection measured by each sensor was divided by Dmax, which corresponds to the deflection recorded directly under the load plate [46]. In this study, the first four sensors of the diffractometer were spaced at equal intervals of 0.3 m, allowing for evaluation of the basin up to 0.9 m from the load axis. Equation (1) proposed by Hoffman and Thompson in 1982 is used to determine the normalized area (NA0.9):
- NA0.9: normalized area in millimeters;
- D: deflection in meters.
The normalized area represents half of a section of the deflection basin, extending from the axis that passes through the point of impact to a vertical line located 900 mm from this point [Scheme 3]. Together with the maximum deflection, this area serves as an indicator of the pavement and subgrade’s resistance [47]. Consequently, the structural condition of the pavement in both models, identified as Z1 and Z2, was assessed by correlating the maximum deflection with the normalized area [Figure 10].
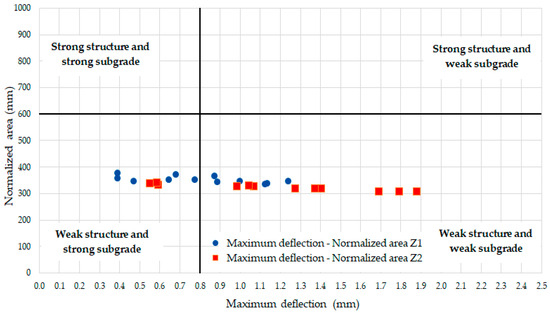
Figure 10.
Normalized area vs. maximum deflection.
Both model footprints were situated on the same type of soil: poorly graded sand classified as SP according to ASTM D2487 [48], with an identical compaction energy of 36.7 J/m2. However, the control points for footprint Z1 exhibited a greater presence in the third quadrant (C3) of the classification matrix compared to those of Z2.
3.2.2. Structural Index (SI)
This is a measure that reflects the capacity of a pavement to support loads and resist deformations under traffic conditions. As this index decreases, the pavement exhibits better load distribution and greater resistance to deformation, which translates into higher quality of the pavement layers. This is crucial because a low structural index suggests that the layers are properly designed and constructed to provide durability, stability, and reduced maintenance over time, resulting in improved performance and safety of the roads. However, the index can be sensitive to pavement heterogeneity, as measurements taken at different sections may reflect variations in structural strength that do not necessarily represent the overall condition of the pavement. Another important limitation is that the structural index does not incorporate variables related to material aging, which can lead to an incomplete assessment of the pavement’s actual condition. Therefore, the structural index is a tool that must be interpreted with more than one recording point.
The evaluation of pavements is based on the inflection point of the deflection basin, as illustrated in Scheme 3. The ratio of the maximum deflection (Dmax) to the horizontal distance from the inflection point (Pi) generated for a load level allows the calculation of the structural index (SI). Variations in these parameters create different conditions within the layers of the pavement structure, leading to various potential solutions for rehabilitating the pavement [49].
Equation (2) used to determine the structural index [49]:
- SI: structural index;
- Dmax: maximum deflection, millimeters;
- Pi: inflection points distance, millimeters.
Therefore, the structural index (SI) calculated for each homogeneous zone at their respective control points reflects the quality of the pavement under various load levels. The dispersion of the structural index for the traces of the models under study allows for a more detailed analysis of Z1 in comparison to Z2 [Figure 11].
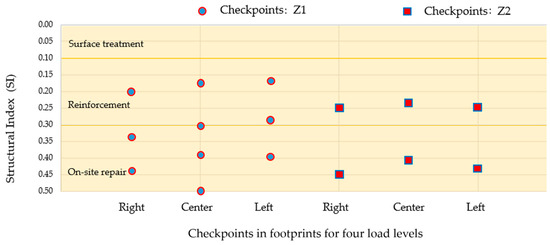
Figure 11.
Structural index at control points of each footprint for 4 load levels.
The three control points of Z2 subjected to the normalized loads of 900 kN and 1100 kN generated considerable maximum deflections in Z2-RIGHT, Z2-CENTER, and Z2-LEFT, with the calculated structural indices ranging from 0.53 to 0.78 [Table 3]. These values fall outside the acceptable range for considering appropriate treatment due to the structural condition of the sustainable pavement layers. In contrast, only the control points Z1-RIGHT and Z1-LEFT exhibited structural indices of 0.54 and 0.51, respectively, under the 1100 kN load, attributed to their maximum deflections exceeding 1 mm of deformation.

Table 3.
Variability of the structural index results 3.
3.2.3. Dynamic Stiffness Modulus (DSM)
The dynamic stiffness modulus is the relationship between the applied effort and the maximum deflection recorded. This modulus is crucial for determining the load-bearing capacity of the pavement, its durability, and its resistance to fatigue. The importance of DSM lies in its ability to predict the structural response of pavement to recurrent loads, facilitating maintenance and rehabilitation and optimizing pavement life by anticipating potential structural failures caused by loss of rigidity.
Equation (3) is used to determine the dynamic stiffness modules:
- DSM: dynamic stiffness modules, kN/mm;
- FD: effort, kN;
- DMAX: maximum deflection, millimeters.
The correlation between maximum deflection and dynamic stiffness modulus under the four existing load levels allows for the determination of the overall pavement resistance, considering three performance levels for the layers that comprise it [Figure 12].
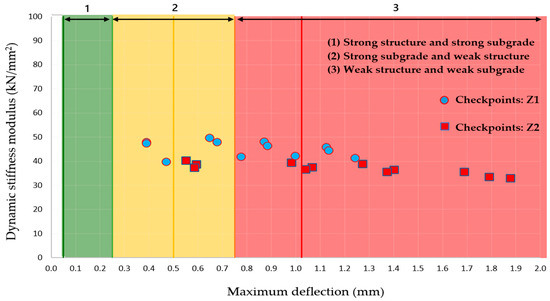
Figure 12.
Dynamic stiffness modulus—maximum deflection.
The dispersion illustrates all values from both control points for Z1 and Z2, and it is again noted that a higher number of values from the Z1 footprint are observed at performance level 2 of the pavement compared to the values from the Z2 footprint. It is evident that the structure, even when classified as weak, creates a gap between control points and, in turn, between the model footprints. The deflections for Z1 tend to be lower in comparison to Z2, despite some stiff values being similar. This suggests that Z1 is more structurally efficient in resisting loads compared to Z2.
4. Discussion
The deformation resistance of a physical interaction system when the layers are subjected to four loading levels allows the recording of recoverable deflections to obtain the structural index (SI) and the dynamic stiffness modulus (DSM). The significance of deflection as a primary metric lies in its ability to indicate structural defects; however, it is important to note that it does not allow for the identification of their specific location [50]. This suggests that while deflection is a crucial indicator, it should be considered alongside other diagnostic methods for a more comprehensive assessment of the pavement.
The lower structural index in Z1 indicates a better response to stresses due to the efficiency of the geogrid reinforcement. This improves the strength and stability of the structural system. The inclusion of fiberglass geogrids in the reinforcement layers significantly increases the load-bearing capacity and ductility of the material, resulting in lower and more favorable structural index values [9]. The incorporation of fiberglass geogrid into the bearing layers acts as a mechanical reinforcement that redistributes loads, minimizing the formation of cracks and plastic deformation under repeated loads, in addition to improving structural stability under fatigue conditions.
The analysis of the homogeneous zones Z1 and Z2 reveals significant differences in the structural response of the pavement. The acceptable deviation observed in Z1 suggests that this zone may present resistance to permanent deformation and a higher load-bearing capacity compared to Z2. This finding is critical, as it indicates that pavement conditions can vary considerably even in adjacent areas, underscoring the importance of conducting detailed analyses in different pavement sections.
The correlation between the measured deflections and the relative stiffness of the upper pavement layers, as highlighted in the literature [51], provides a solid theoretical framework for interpreting the obtained data. The low load-bearing capacity observed in both zones allows for the definition of a structure that depends on the subbase to counteract permanent deformation. The fiberglass geogrid reinforcement acts as a layer of wear and interacts seamlessly with the asphalt concrete, as the measured deflections showed no inconsistencies in the recording.
The structural index (SI) highlights the favorable behavior of Z1 in comparison with Z2, reinforcing the notion that variability in pavement performance can be significant. This type of analysis allows for the prioritization of interventions in areas exhibiting a lower structural index, thereby optimizing the resources allocated for pavement maintenance.
On the other hand, the dynamic stiffness modulus, as an indicator of the in-service response to cyclic and vibration loads, reflects the greater capacity of the Z1 geogrid-reinforced system to absorb and dissipate energy, thereby reducing deformation and improving structural stability. The incorporation of fiberglass geogrids not only increases ultimate strength but also improves the system’s dynamic response, achieving greater stiffness and less deformation under repetitive loading conditions [22].
The difference in the dynamic stiffness modulus between tracks constructed with reclaimed asphalt pavement (RAP) as a replacement aggregate indicates an improved ability of the geogrid system to withstand recurrent dynamic loads, reducing long-term deformation and deterioration. Its use can extend pavement life, reduce maintenance frequency and costs, and optimize design processes by allowing for a more accurate assessment of structural response to dynamic loads and opens a new field of discussion regarding the use of recycled materials in pavement construction. This finding suggests that while the use of RAP may be a sustainable practice, it is essential to evaluate its impact on the structural integrity of the pavement. Future research should focus on studying how the variability of recycled materials influences the long-term mechanical behavior of the pavement.
5. Conclusions
This research demonstrates that the selection of reinforcement or rehabilitation treatment, based on the structural index, depends on the support of the base layer and the tread layer in the homogeneous areas analyzed [52]. In addition to the fact that the structural index obtained for footprint Z1, which incorporated a fiberglass geogrid, was lower compared to Z2 (which does not have reinforcement), the dynamic stiffness modulus (DSM) revealed a favorable trend in Z1. This suggests that the incorporation of the geogrid contributes to improving the pavement’s structural response, particularly its strength and resilience under cyclic loads.
The interaction between the asphalt layer composed of 30% RAP and the fiberglass geogrid proved effective, functioning as an integral system that enhanced the pavement’s structural capacity. This encourages future research into reinforcement materials that can reduce the need for additional treatments and extend pavement life.
From an analytical perspective, the normalized deflection and basin area allow the structure to be classified as weak on a resilient subgrade at the first loading level (400 kPa). However, at higher loading levels, the structure remains within the threshold of being considered weak, with values below 50 kN/mm2. The application of vehicle axle loads to both structures, controlled by diagonal reference points in 1 m2 areas, ensured comparable results.
The validation of the deflections by measuring the reproducibility of recoverable values at each control point under different loading levels was rigorous to ensure the reliability of the results. This allowed for a thorough statistical analysis that supports the validity of the results. The observed dispersion in the values of the tested models suggests a favorable trend in the structural performance of the reinforced layer, maintaining its original thickness, thus highlighting the feasibility of incorporating fiberglass geogrid in practical applications.
Therefore, the integration of the fiberglass geogrid into the pavement structure presented benefits, with a lower structural index in Z1 compared to Z2. The more favorable trend in the dynamic stiffness modulus in Z1 indicates that the reinforcement contributes to improved response to cyclic loading, strengthening the structural system. The experimental methodology developed in this study, in addition to defining pavement quality, contributes to advancing knowledge of sustainable aggregates for pavements [53]. This work paves the way for future research focused on the long-term durability of reinforced systems, including the mechanical interaction between geogrids and recycled materials in various geotechnical contexts and their performance in rehabilitation scenarios on pavements with varying degrees of deterioration and the presence of contaminants or excessive moisture.
Author Contributions
Conceptualization, J.R.R.-V. and S.A.Z.-C.; methodology, D.P.-M.; validation, A.L.H.-M. and R.M.-S.; formal analysis, J.R.R.-V. and L.C.S.H.; supervision, S.A.Z.-C. All authors have read and agreed to the published version of the manuscript.
Funding
This research received no external funding.
Institutional Review Board Statement
Not applicable.
Informed Consent Statement
Not applicable.
Data Availability Statement
Data derived from public domain resources.
Acknowledgments
I would like to express my gratitude to the Doctoral Program in Applied Engineering at Veracruz University (DIA) for their support in publishing this article. I also extend my appreciation to YUTAVE Ingeniería for their assistance and provision of equipment for this publication.
Conflicts of Interest
Domingo Pérez-Madrigal is from YUTAVE Engineering S.A. de C.V. The other authors declare no conflict of interest.
References
- Mariyappan, R.; Palammal, J.S.; Balu, S. Sustainable use of reclaimed asphalt pavement (RAP) in pavement applications—A review. Environ. Sci. Pollut. Res. 2023, 30, 45587–45606. [Google Scholar] [CrossRef] [PubMed]
- Zhao, Y.; Goulias, D.; Peterson, D. Recycled Asphalt Pavement Materials in Transport Pavement Infrastructure: Sustainability Analysis & Metrics. Sustainability 2021, 13, 8071. [Google Scholar] [CrossRef]
- Guduru, G.; Kuna, K.K. Allowable limits for Reclaimed Asphalt Pavement (RAP) content in hot mix asphalt using simple indicative tests. Mater. Struct. 2023, 56, 27. [Google Scholar] [CrossRef]
- Bazoobandi, P.; Karimi, H.R.; Mousavi, S.R.; Karimi, F.; Aliha, M.R.M. Full range of mode I and II cracking performance of asphalt mixtures containing low to high reclaimed asphalt pavement (RAP) contents; modified by recycling agent and substituting of a softer binder. Case Stud. Constr. Mater. 2023, 19, e02487. [Google Scholar] [CrossRef]
- Si, W.; Zhang, B.; Zhang, X.; Xia, W.; Cheng, X.; Luo, X.; Hu, Y. Maximizing the circularity of asphalt pavements by improving the RAP content in recycled asphalt mixtures. Constr. Build. Mater. 2024, 438, 137316. [Google Scholar] [CrossRef]
- Fawzy, M.M.; Shrakawy, A.S.E.; Hassan, A.A.; Khalifa, Y.A. Enhancing sustainability for pavement maintenance decision-making through image processing-based distress detection. Innov. Infrastruct. Solut. 2024, 9, 58. [Google Scholar] [CrossRef]
- Alimohammadi, H.; Zheng, J.; Schaefer, V.R.; Siekmeier, J.; Velasquez, R. Evaluation of geogrid reinforcement of flexible pavement performance: A review of large-scale laboratory studies. Transp. Geotech. 2021, 27, 100471. [Google Scholar] [CrossRef]
- Qadir, A.; Gazder, U.; Choudhary, K.-N. Statistical analysis for comparing and predicting rutting resistance of asphalt pavements with rigid and flexible geogrid layers. Constr. Build. Mater. 2021, 302, 124136. [Google Scholar] [CrossRef]
- Freire, R.A.; Di Benedetto, H.; Sauzéat, C.; Pouget, S.; Lesueur, D. Crack propagation analysis in bituminous mixtures reinforced by different types of geogrids using digital image correlation. Constr. Build. Mater. 2021, 303, 124522. [Google Scholar] [CrossRef]
- Xiao, M.; Luo, R.; Yu, X. Assessment of asphalt pavement overall performance condition using functional indexes and FWD deflection basin parameters. Constr. Build. Mater. 2022, 341, 127872. [Google Scholar] [CrossRef]
- Sharbaf, M.; Ghafoori, N. Laboratory evaluation of geogrid-reinforced flexible pavements. Transp. Eng. 2021, 4, 100070. [Google Scholar] [CrossRef]
- AlShareedah, O.; Nassiri, S. Pervious concrete mixture optimization, physical, and mechanical properties and pavement design: A review. J. Clean. Prod. 2021, 288, 125095. [Google Scholar] [CrossRef]
- Markiewicz, A.; Koda, E.; Kawalec, J. Geosynthetics for Filtration and Stabilisation: A Review. Polymers 2022, 14, 5492. [Google Scholar] [CrossRef] [PubMed]
- Liu, L.; Wang, S.; Chen, X.; Cheng, H.; Quan, L.; Jiang, S.; Sun, L. Multilayered elastic medium reinforced with interfacial thin film: A theoretical model for geogrid reinforced HIR asphalt pavement. Eng. Anal. Bound. Elem. 2024, 158, 224–238. [Google Scholar] [CrossRef]
- Baadiga, R.; Balunaini, U.; Saride, S.; Madhav, M.R. Influence of Geogrid Properties on Rutting and Stress Distribution in Reinforced Flexible Pavements under Repetitive Wheel Loading. J. Mater. Civ. Eng. 2021, 33, 04021338. [Google Scholar] [CrossRef]
- Solatiyan, E.; Bueche, N.; Carter, A. Laboratory evaluation of interfacial mechanical properties in geogrid-reinforced bituminous layers. Geotext. Geomembr. 2021, 49, 895–909. [Google Scholar] [CrossRef]
- Abdel-Jaber, M.; Al-shamayleh, R.A.; Ibrahim, R.; Alkhrissat, T.; Alqatamin, A. Mechanical properties evaluation of asphalt mixtures with variable contents of reclaimed asphalt pavement (RAP). Results Eng. 2022, 14, 100463. [Google Scholar] [CrossRef]
- Pan, Y.; Liu, G.; Li, Z.; Zhao, Y. Survival analysis of rutting failures in hot in-place recycling maintained asphalt pavements using field data. Case Stud. Constr. Mater. 2024, 20, e02762. [Google Scholar] [CrossRef]
- Choudhary, L.; Bansal, S.; Kalra, M.; Dagar, L. Mechanical evaluation of recycled aggregate mixes and its application in reclaimed asphalt pavement (RAP) stretch. Beni-Suef Univ. J. Basic Appl. Sci. 2022, 11, 127. [Google Scholar] [CrossRef]
- Kumar Pradhan, S.; Das, U.; Ranjan Patra, A. Utilization of reclaimed asphalt pavement (RAP) materials in HMA mixtures for flexible pavement construction. Mater. Today Proc. 2023, S2214785323023908. [Google Scholar] [CrossRef]
- Pradhan, S.K.; Sahoo, U.C. Influence of softer binder and rejuvenator on bituminous mixtures containing reclaimed asphalt pavement (RAP) material. Int. J. Transp. Sci. Technol. 2022, 11, 46–59. [Google Scholar] [CrossRef]
- Li, W.; Han, S.; Han, X.; Yao, Y. Experimental and numerical analysis of mechanical properties of geocell reinforced reclaimed construction waste composite base layer. Constr. Build. Mater. 2021, 304, 124587. [Google Scholar] [CrossRef]
- Szafranko, E. Problem of selection of suitable geosynthetics for the strengthening of subgrade in road construction, selection of assessment criteria. ACTA Sci. Pol.-Archit. Bud. 2021, 20, 93–101. [Google Scholar] [CrossRef]
- Yoo, C. Geosynthetics in Sustainable Transportation Infrastructure Construction. E3S Web Conf. 2023, 368, 01004. [Google Scholar] [CrossRef]
- Correia, N.S.; Mugayar, A.N. Effect of binder rates and geogrid characteristics on the shear bond strength of reinforced asphalt interfaces. Constr. Build. Mater. 2021, 269, 121292. [Google Scholar] [CrossRef]
- Han, J.; Thakur, J.K. Sustainable roadway construction using recycled aggregates with geosynthetics. Sustain. Cities Soc. 2015, 14, 342–350. [Google Scholar] [CrossRef]
- Imjai, T.; Pilakoutas, K.; Guadagnini, M. Performance of geosynthetic-reinforced flexible pavements in full-scale field trials. Geotext. Geomembr. 2019, 47, 217–229. [Google Scholar] [CrossRef]
- Huang, W.; Liang, S.; Wei, Y. Surface deflection-based reliability analysis of asphalt pavement design. Sci. China Technol. Sci. 2020, 63, 1824–1836. [Google Scholar] [CrossRef]
- Camacho-Garita, E.; Puello-Bolaño, R.; Laurent-Matamoros, P.; Aguiar-Moya, J.P.; Loria-Salazar, L. Structural Analysis for APT Sections Based on Deflection Parameters. Transp. Res. Rec. J. Transp. Res. Board 2019, 2673, 313–322. [Google Scholar] [CrossRef]
- Liao, J.; Lin, H.; Li, Q.; Zhang, D. A Correction Model for the Continuous Deflection Measurement of Pavements Under Dynamic Loads. IEEE Access 2019, 7, 154770–154785. [Google Scholar] [CrossRef]
- Vargas, J.R.R.; Castro, S.A.Z.; Estrada, R.S. Evaluación del Sistema RAP-Geomalla en Carpetas de Pavimento Flexible Para Suprimir la Fisuración Refleja. In Proceedings of the Congreso Academia Journals Hidalgo 2023, Hidalgo, Mexico, 18–20 October 2023; pp. 279–284. [Google Scholar]
- Imjai, T.; Garcia, R.; Rassameekobkul, W.; Sofri, L.A.; Wicaksono, A. Service Performance of Porous Asphalt Mixtures in Thailand: Laboratory and Full-Scale Field Tests. Int. J. Pavement Res. Technol. 2024, 1–18. [Google Scholar] [CrossRef]
- ASTM D1883-21; Standard Test Method for California Bearing Ratio (CBR) of Laboratory-Compacted Solis. American Society for Testing and Materials—ASTM: West Conshohocken, PA, USA, 2021. [CrossRef]
- Secretaría de Infraestructura, Comunicaciones y Transportes, “Calidad de Materiales Asfálticos”. SICT, 2022. Available online: https://normas.imt.mx/storage/normativa/N-CMT-4-05-001-22.pdf (accessed on 27 March 2025).
- Secretaría de Infraestructura, Comunicaciones y Transportes, “Materiales Pétreos Para Mezclas Asfálticas”. SICT, 2017. Available online: https://normas.imt.mx/storage/normativa/N-CMT-4-04-17.pdf (accessed on 27 March 2025).
- Mabrouk, G.M.; Elbagalati, O.S.; Dessouky, S.; Fuentes, L.; Walubita, L.F. 3D-finite element pavement structural model for using with traffic speed deflectometers. Int. J. Pavement Eng. 2022, 23, 4065–4079. [Google Scholar] [CrossRef]
- Sawangsuriya, A.; Imjai, T.; Malaikrisanachalee, S. Structural Responses of Flexible Pavement Subjected to Different Axle Group Loads. Walailak J. Sci. Tech. 2020, 17, 1356–1366. [Google Scholar] [CrossRef]
- Secretaría de Infraestructura Comunicaciones y Transportes, “Método Marshall Para Mezclas Asfálticas de Granulometría Densa”. SICT, 2023. Available online: https://normas.imt.mx/storage/normativa/M-MMP-4-05-034-23.pdf (accessed on 27 March 2025).
- Secretaría de Infraestructura, Comunicaciones y Transportes, “Calidad de Cementos Asfálticos Según su Grado de Desempeño (PG)”. SICT, 2018. Available online: https://normas.imt.mx/storage/normativa/N-CMT-4-05-004-18.pdf (accessed on 27 March 2025).
- ASTM D6927-22; Standard Test Method for Marshall Stability an Flow of Asphalt Mixtures. American Society for Testing and Materials—ASTM: West Conshohocken, PA, USA, 2022. [CrossRef]
- Secretaría de Infraestructura, Comunicaciones y Transportes, “Determinación de las Deflexiones de un Pavimento(DEF)”. SICT, 2017. Available online: https://normas.imt.mx/storage/normativa/N-CSV-CAR-1-03-010-17.pdf (accessed on 12 February 2025).
- American Association of State Highway and Transportation Officials. AASHTO Guide for Design of Pavement Structures; AASHTO: Washington, DC, USA, 1993.
- Pais, J.; Santos, C.; Pereira, P.; Kaloush, K. The adjustment of pavement deflections due to temperature variations. Int. J. Pavement Eng. 2020, 21, 1585–1594. [Google Scholar] [CrossRef]
- Secretaría de Infraestructura, Comunicaciones y Transportes, “Determinación de las Deflexiones Con Equipo de Impacto en Pavimentos Flexibles.” 2017. Available online: https://normas.imt.mx/storage/normativa/M-MMP-4-07-020-17.pdf (accessed on 13 February 2025).
- Yang, S.; Ceylan, H.; Gopalakrishnan, K.; Kim, S.; Taylor, P.C.; Alhasan, A. Characterization of environmental loads related concrete pavement deflection behavior using Light Detection and Ranging technology. Int. J. Pavement Res. Technol. 2018, 11, 470–480. [Google Scholar] [CrossRef]
- Vyas, V.; Singh, A.P.; Srivastava, A. Prediction of asphalt pavement condition using FWD deflection basin parameters and artificial neural networks. Road Mater. Pavement Des. 2021, 22, 2748–2766. [Google Scholar] [CrossRef]
- Rabbi, M.F.; Mishra, D. Using FWD deflection basin parameters for network-level assessment of flexible pavements. Int. J. Pavement Eng. 2021, 22, 147–161. [Google Scholar] [CrossRef]
- ASTM D2487-17; Standard Practice for Classification of Soils for Engineering Purposes (Unified Soil Classification System). American Society for Testing and Materials—ASTM: West Conshohocken, PA, USA, 2017. [CrossRef]
- Orozco Santoyo Raúl Vicente, “Evaluacion de Pavimentos Flexibles Con Metodos No Destructivos”, Universidad Nacional Autónoma de México, México, 2005. Available online: https://repositorio.unam.mx/contenidos/97684 (accessed on 24 May 2024).
- Xue, W.; Flintsch, G.W.; Diefenderfer, B.K. Measuring Pavement Permanent Deformation in Accelerated Pavement Testing. Transp. Res. Rec. J. Transp. Res. Board 2020, 2674, 340–348. [Google Scholar] [CrossRef]
- Goktepe, A.B.; Agar, E.; Lav, A.H. Advances in backcalculating the mechanical properties of flexible pavements. Adv. Eng. Softw. 2006, 37, 421–431. [Google Scholar] [CrossRef]
- Inés, B.C.G. Evaluación Estructural De Pavimentos Flexibles Con Métodos De Inteligencia Artificial Y Auscultación No Destructiva. Ph.D. Thesis, Universidad Nacional Autónoma de México, Mexico City, Mexico, 2012. Available online: http://www.ptolomeo.unam.mx:8080/xmlui/bitstream/handle/132.248.52.100/5145/Tesis.pdf?sequence=1 (accessed on 24 May 2024).
- Ramírez-Vargas, J.R.; Zamora-Castro, S.A.; Herrera-May, A.L.; Sandoval-Herazo, L.C.; Salgado-Estrada, R.; Diaz-Vega, M.E. A Review of Sustainable Pavement Aggregates. Appl. Sci. 2024, 14, 7113. [Google Scholar] [CrossRef]
Disclaimer/Publisher’s Note: The statements, opinions and data contained in all publications are solely those of the individual author(s) and contributor(s) and not of MDPI and/or the editor(s). MDPI and/or the editor(s) disclaim responsibility for any injury to people or property resulting from any ideas, methods, instructions or products referred to in the content. |
© 2025 by the authors. Licensee MDPI, Basel, Switzerland. This article is an open access article distributed under the terms and conditions of the Creative Commons Attribution (CC BY) license (https://creativecommons.org/licenses/by/4.0/).