


Monetizing Environmental Impacts into Environmental Costs During Prefabricated Building Construction: A 5D BIM-Enabled Analysis


Abstract
1. Introduction
- Monetizing environmental impacts into environmental costs: By introducing environmental economics theories, environmental impacts are quantified as monetary environmental costs. This monetization approach standardizes environmental impacts by a unified measure, which offers an intuitive indicator for stakeholders.
- Introducing 5D BIM technology for environmental cost analysis: This study extends the application of 5D BIM from conventional economic costs to environmental costs. This new tool also presents spatial and temporal changes in terms of environmental costs.
2. Literature Review
2.1. Environmental Impacts of Prefabricated Buildings

| Focus | Environmental Indicator | Building Type | Region | Ref. |
|---|---|---|---|---|
| Comparing prefabricated and non-prefabricated technology | Materials weight, PED, CCP, ET, HT, material intensity, WRD, solid waste, recycled material, recyclable material | Prefabricated school building | Catalonia, Spain | [10] |
| Scenario analysis | EcoIndicator99, CCP | Prefabricated commercial building | San Francisco, California, USA | [22] |
| Comparing modular and conventional building | CCP, AP, carcinogens HT, non-cancer HT, criteria pollutants, EP, ET, POF, WRD, ODP | Modular homes | The United States | [11] |
| Sensitivity of input parameters | CCP, PED | Prefabricated industrial buildings | Italian | [23] |
| Input and output flows on factory level | CCP, ODP, AP, EP, PMF, ADP, renewable PED, non-renewable PED | Prefabricated timber houses | Germany | [25] |
| Energy performances by non-steady state simulation | CCP, ODP, AP, EP, POF, ADP, PED | Prefabricated simply temporary housing | Messina, Italy | [15] |
| Comparing modular and conventional methods by analytic hierarchy process | CCP, AP, human health, EP, PFM, ODP, PED, ET | Modular homes | Okanagan, British Columbia, Canada | [12] |
| Comparing concrete and steel prefabricated prefinished volumetric construction | CCP, non-renewable PED, PMF, LO, ADP | Prefabricated residential building | Malaysia | [16] |
| Automated building information modeling approach | ADP, AP, EP, freshwater ET, CCP, HT, marine ET, ODP, POF, terrestrial ET, renewable PED, non-renewable PED | Modular high-rise buildings | Hong Kong, China | [7] |
| Comparing different prefabricated rates | CCP, ODP, IR, ODP, human health, PFM, ODP, terrestrial ecosystems, terrestrial AP, freshwater EP, marine EP, terrestrial ET, freshwater ET, marine ET, carcinogenic ET, non-carcinogenic ET, LO, ADP, PED, WRD | Prefabricated residential building | Stockholm royal seaport, Sweden | [14] |
| Comparing different geographical contexts in absolute measures | CCP, ODP, EP, PDF, freshwater ET | Modular buildings | Australia and Denmark | [5] |
| Cradle-to-cradle for recyclability plan | Human health, ecosystem, CCP, resources | Modular residential building | Changsha, China | [20] |
| Comparing prefabricated and conventional construction | CCP, terrestrial AP, freshwater EP, marine EP, PMF, HT, freshwater ET, marine ET, PED | Prefabricated office building | Sri Lanka | [13] |
| Circular economy strategies | CCP, terrestrial AP, freshwater EP, HT, POF, PMF, terrestrial ET, freshwater ET, marine ET, agricultural LO, ADP, PED | Modular infectious disease building | Sri Lankan | [24] |
| Comparing prefabricated volumetric modular buildings with seismic-resistant | Agricultural LO, CCP, PED, freshwater ET, freshwater EP, HT, IR, marine ET, marine EP, ADP, natural soil transformation, ODP, PMF, POF, terrestrial AP, terrestrial ET, urban LO, WRD | Outpatient hospital building | Quito, Ecuador | [6] |
2.2. From 5D BIM to nD BIM
3. Method and Materials
3.1. Boundary Definition
3.2. Inventory Acquisition
- Structural model creation: The YJK structural design software (YJK-A) [51] was used to build an accurate structural BIM model. When setting material parameters, key attributes such as concrete strength grade (e.g., C30/C35) and steel bar type (e.g., HRB400) were included.
- Architectural model supplementation: The YJK model was imported into Autodesk Revit 2018 [52] to supplement the architectural information of buildings.
- Detailed design model development: BeePC V4.2 [53] was used to add details of prefabricated components and their connection nodes (such as grouting sleeves and embedded parts).
- Resource inventory acquisition: BeePC software [53] can automatically collect and summarize resource data according to preset programs and rules, and then export the resource inventory for construction projects.
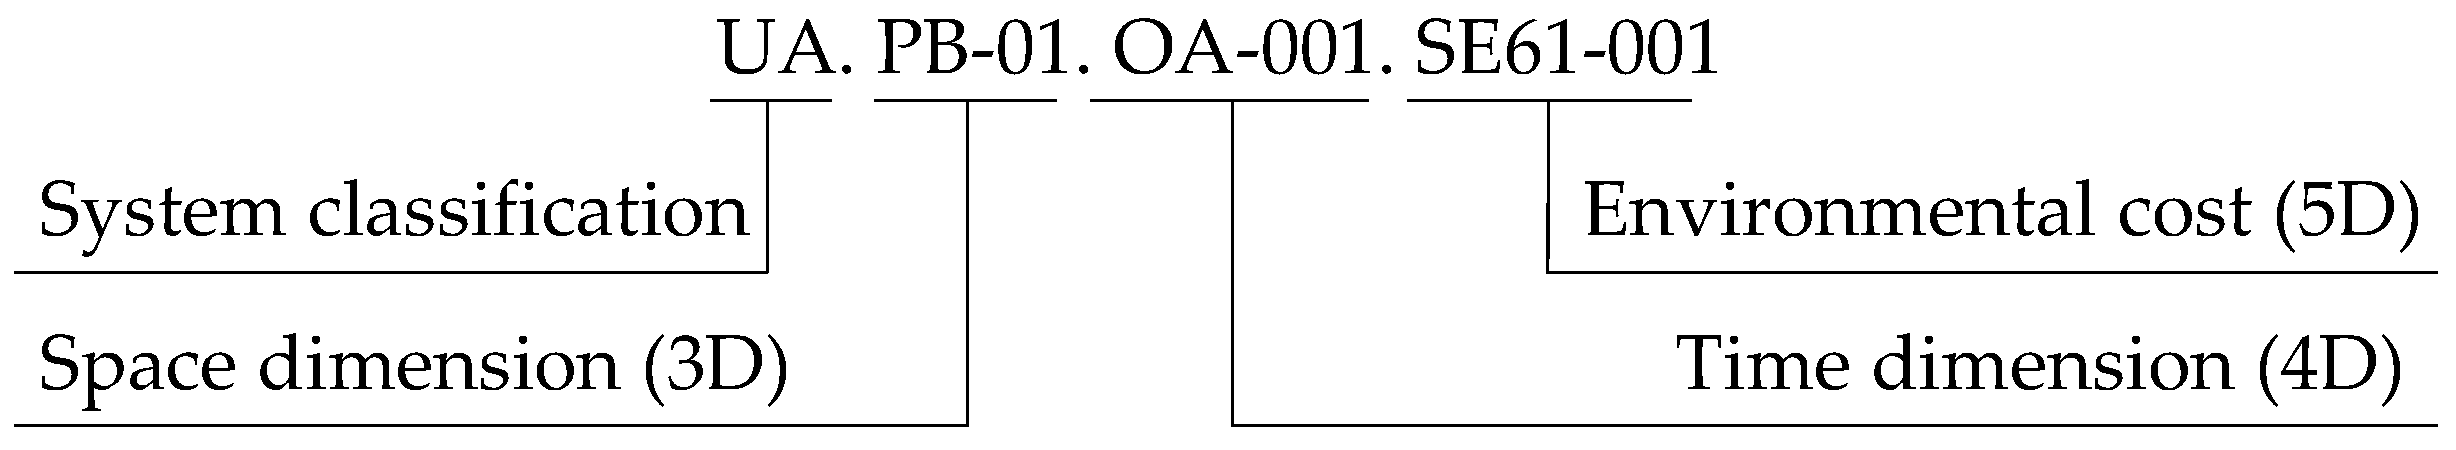
- System classification code: The first-level code inherits the building structure system from GB/T 51061-2014 [54], which enables the identification of power grid projects. In this standard, “U” represents the building part of the power grid system, and “UA” denotes the civil engineering part of substations.
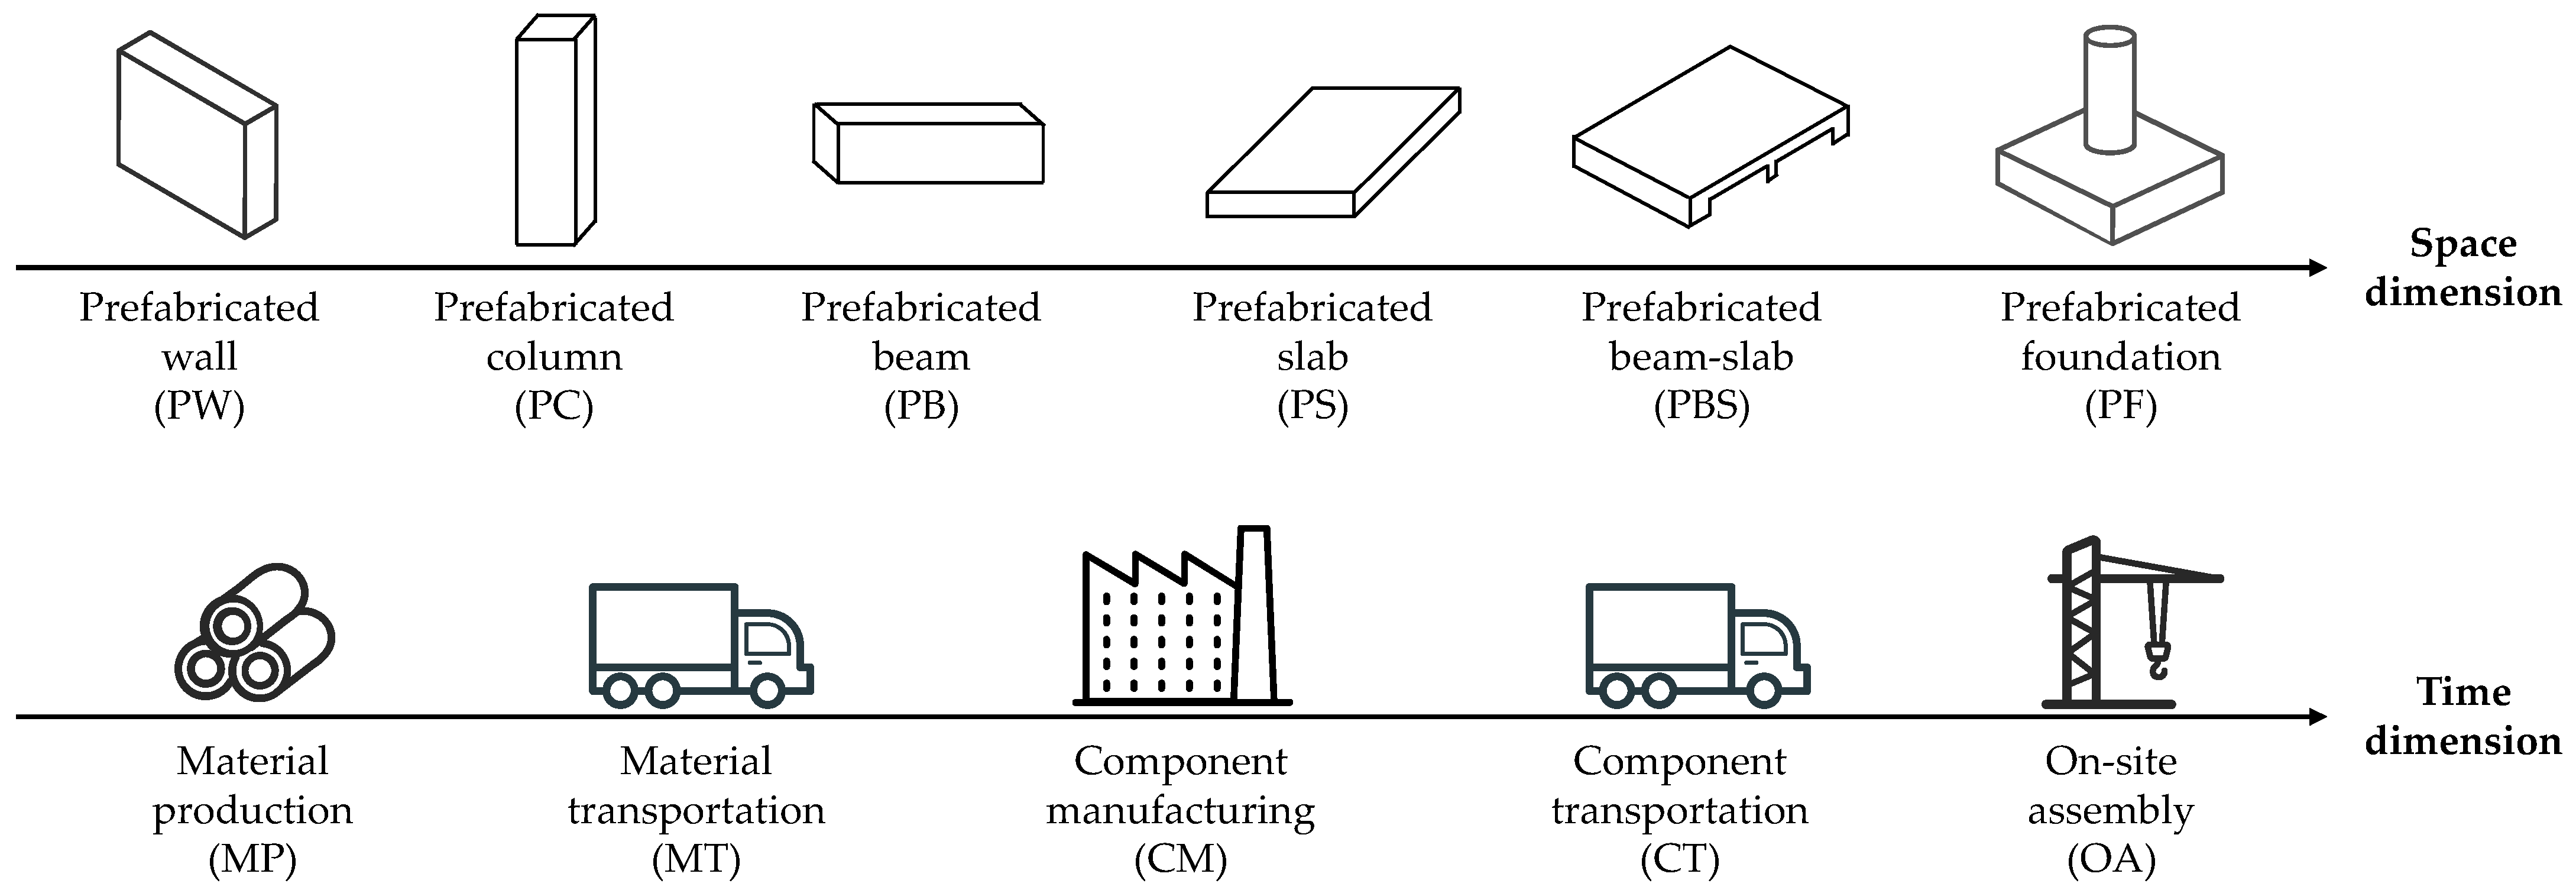
- Space dimension (3D) code: The second-level code inherits the IFC standard of buildingSmart [55]. This code represents the 3D information in the BIM model, namely the solid geometric information of components, which demonstrates the spatial dimension of the construction project, as shown in Table 3. Notably, Table 3 only shows the six types of prefabricated components involved in this study. Other entities, such as IfcChimney, IfcStairFlight, and IfcRoof, can be supplemented according to actual needs.
- 3.
- Time dimension (4D) code: The third-level code is divided according to the construction stages. Based on the stage code, a serial number can be assigned sequentially to represent the construction sequence of components. As shown in Table 4, this code demonstrates the time dimension.
- 4.
- Environmental cost (5D) code: The fourth-level code inherits the requirements of DL/T 5341-2021 [56]. As presented in Table 5, this four-digit code serves as a quota code initially employed for quantity surveying in power transformer projects. This quota code mainly emphasizes the resource consumption of prefabricated components. Specifically, it not only records the characteristics of resources but also provides the resource quantity of each unit component. By applying the corresponding quota, the resource inventory of components can be obtained, thus providing a basis for calculating environmental impacts and environmental costs.
3.3. Environmental Impact Assessment
3.4. Environmental Cost Assessment
3.5. Case Study
4. Environmental Impact Results
4.1. Space Dimension Analysis of Environmental Impacts
4.2. Time Dimension Analysis of Environmental Impacts
5. Environmental Cost Results
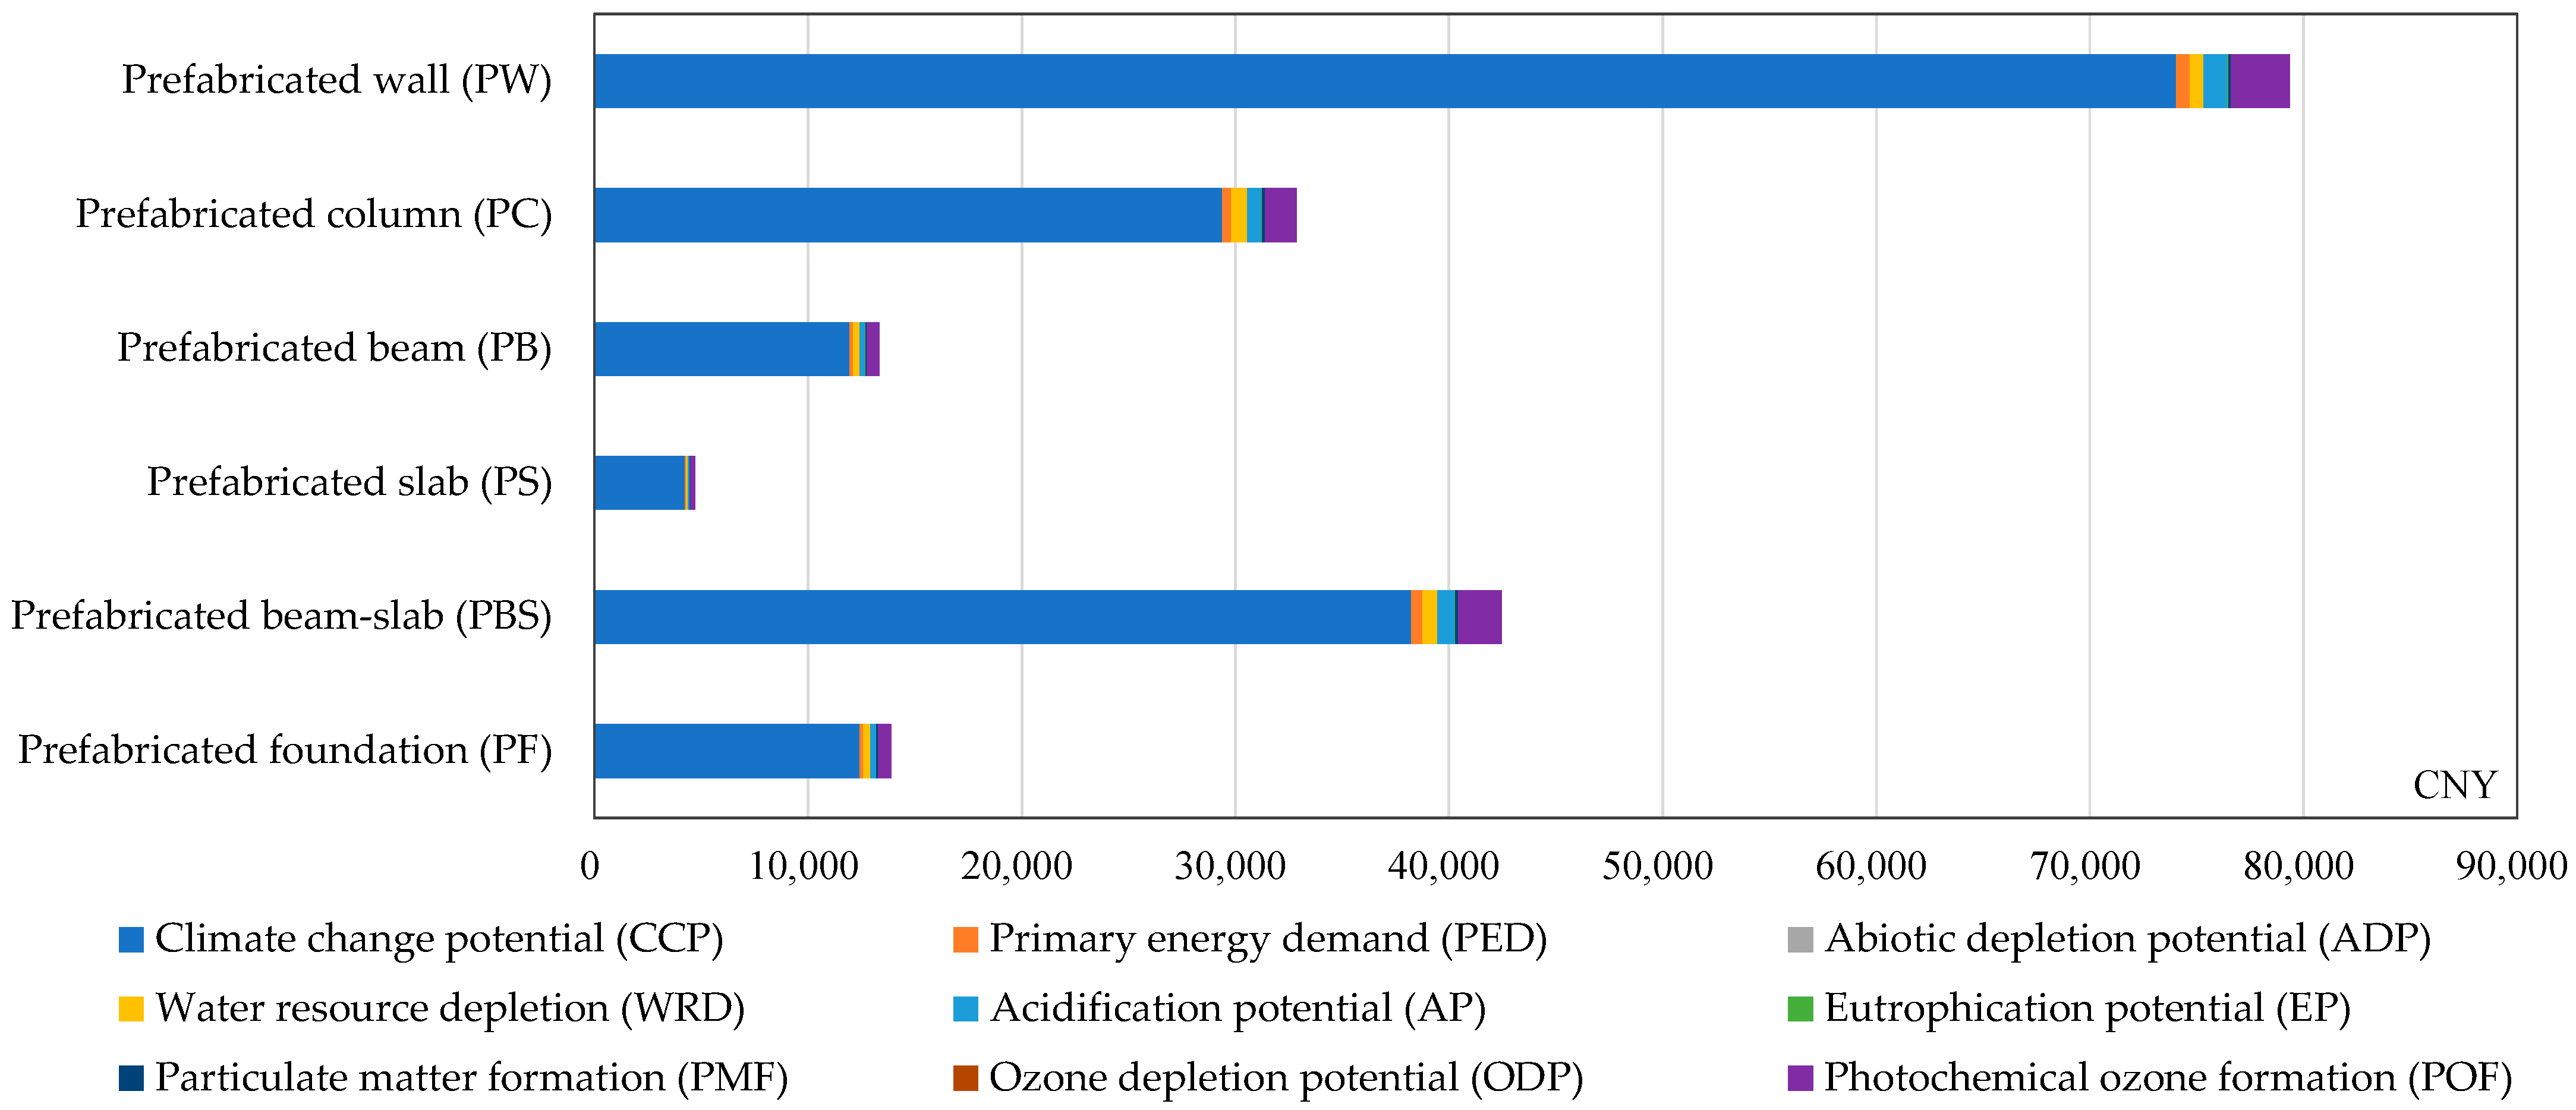
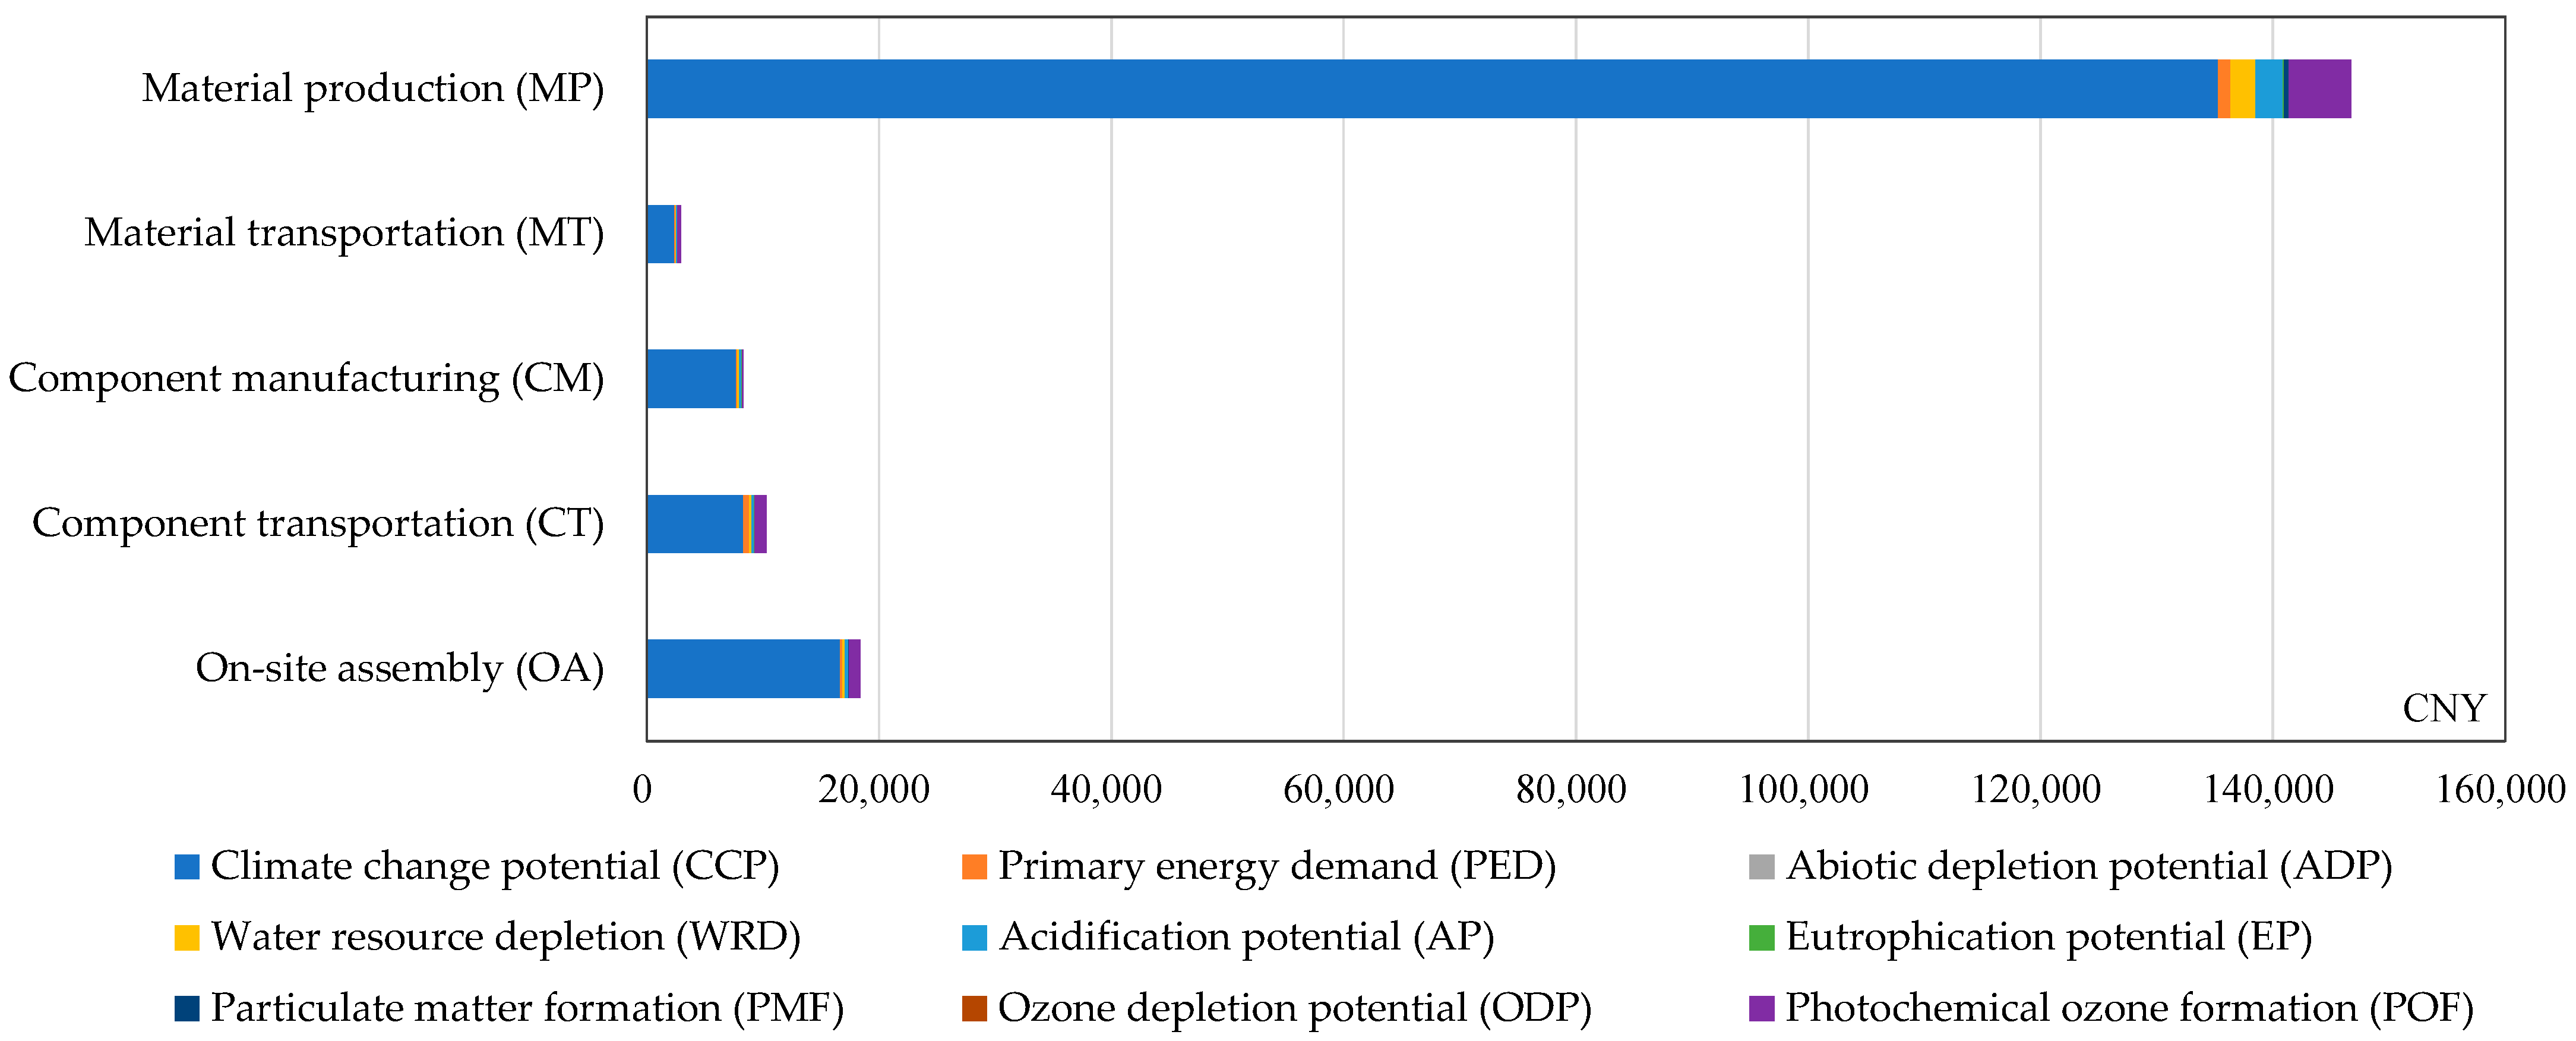
5.1. Space Dimension Analysis of Environmental Costs
5.2. Time Dimension Analysis of Environmental Costs
6. Discussion
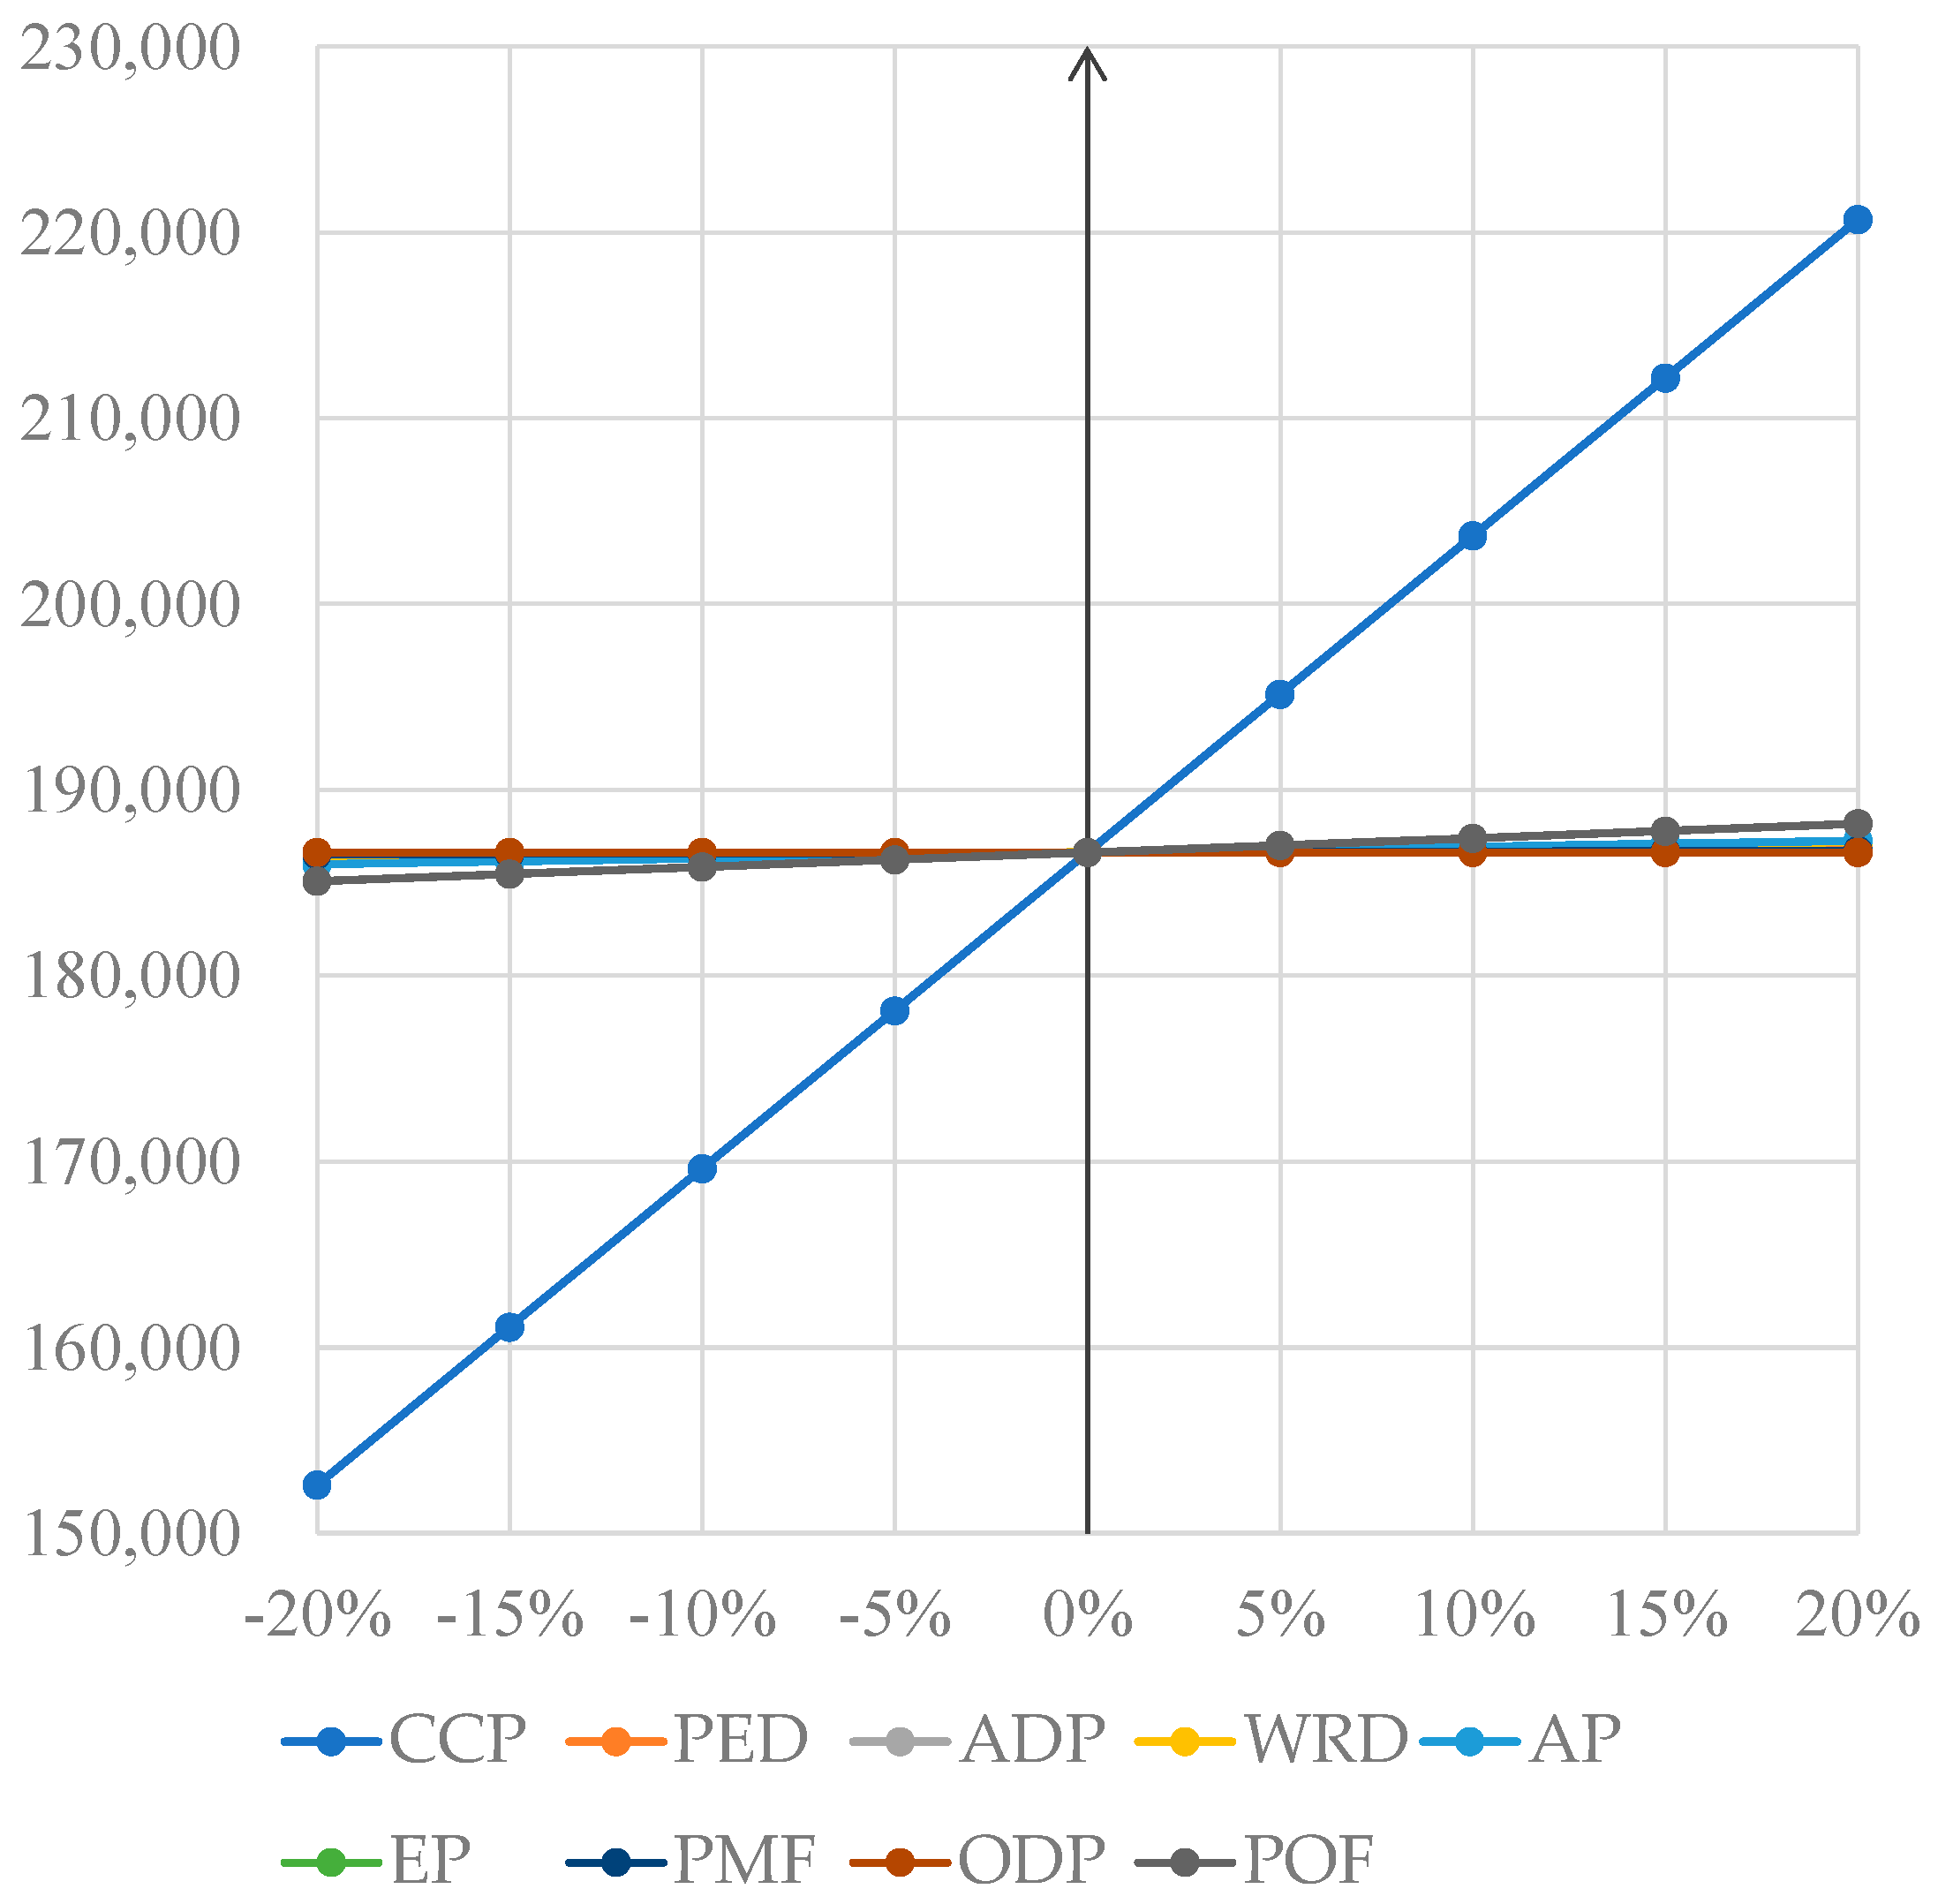
6.1. Sensitivity Analysis
6.2. Benefit of Monetizing Environmental Impacts
6.3. Benefit of 5D BIM
6.4. Limitations and Future Research
7. Conclusions
Author Contributions
Funding
Data Availability Statement
Acknowledgments
Conflicts of Interest
Abbreviations
| CCP | Climate change potential |
| PED | Primary energy demand |
| ADP | Abiotic depletion potential |
| WRD | Water resource depletion |
| AP | Acidification potential |
| EP | Eutrophication potential |
| PMF | Particulate matter formation |
| ODP | Ozone depletion potential |
| POF | Photochemical ozone formation |
| ET | Environment toxicity |
| HT | Human toxicity |
| LO | Land occupation |
| IR | Ionizing radiation |
| BIM | Building information modeling |
| LCA | Life cycle assessment |
| WTP | Willingness-to-pay |
| CLCD | China life cycle database |
| EIF | Environmental impact factor |
| PW | Prefabricated wall |
| PC | Prefabricated column |
| PB | Prefabricated beam |
| PS | Prefabricated slab |
| PBS | Prefabricated beam-slab |
| PF | Prefabricated foundation |
| MP | Material production |
| MT | Material transportation |
| CM | Component manufacturing |
| CT | Component transportation |
| OA | On-site assembly |
| CNY | Chinese Yuan |
Appendix A
Appendix A.1. Environmental Impacts
| Stage | Resource | Unit | Quantity | CCP | PED | ADP | WRD | AP | EP | PMF | ODP | POF |
|---|---|---|---|---|---|---|---|---|---|---|---|---|
| kgCO2eq | MJ | kgSbeq | kg | kgSO2eq | kgPO43−eq | kgPM2.5eq | kgCFC-11eq | kgNMVOCeq | ||||
| MP | Concrete C40 | m3 | 226.608 | 82,075.69 | 574,649.05 | 0.05 | 161,695.56 | 214.17 | 27.90 | 80.49 | 0.001 | 127.33 |
| Foamed ceramics | m3 | 216.192 | 141,605.76 | 309,262.66 | 0.76 | 120,527.04 | 246.24 | 31.46 | 40.27 | 0.000 | 94.87 | |
| MT | Diesel for transporting Concrete | t | 3.724 | 2941.59 | 175,006.26 | 0.06 | 15,142.39 | 14.27 | 2.15 | 2.25 | 0.002 | 11.54 |
| Diesel for transporting foamed ceramics | t | 1.671 | 1319.88 | 78,524.39 | 0.03 | 6794.31 | 6.40 | 0.96 | 1.01 | 0.001 | 5.18 | |
| CM | Electricity | kWh | 19,925.978 | 14,725.30 | 207,230.17 | 0.01 | 55,394.22 | 77.91 | 5.04 | 22.91 | 0.000 | 6.00 |
| Binding wire | t | 0.155 | 358.48 | 5202.97 | 0.00 | 2508.58 | 1.47 | 0.14 | 0.90 | 0.000 | 0.56 | |
| CT | Diesel for component transportation | t | 18.519 | 14,630.31 | 870,411.08 | 0.31 | 75,312.16 | 70.99 | 10.68 | 11.17 | 0.008 | 57.41 |
| OA | Dry-mixed mortar DMM20 | m3 | 3.542 | 1141.57 | 8131.76 | 0.00 | 2369.16 | 3.08 | 0.40 | 1.14 | 0.000 | 1.78 |
| Shimming iron parts | t | 0.909 | 2145.38 | 26,362.74 | 0.00 | 10,508.73 | 7.45 | 0.74 | 6.95 | 0.000 | 2.89 | |
| Grouting material for C40 | m3 | 7.289 | 2639.98 | 18,483.71 | 0.00 | 5200.97 | 6.89 | 0.90 | 2.59 | 0.000 | 4.10 | |
| Diesel for construction machinery | t | 1.039 | 820.97 | 48,842.27 | 0.02 | 4226.07 | 3.98 | 0.60 | 0.63 | 0.000 | 3.22 | |
| Total | 264,404.92 | 2,322,107.06 | 1.25 | 459,679.18 | 652.87 | 80.97 | 170.30 | 0.012 | 314.88 |
| Stage | Resource | Unit | Quantity | CCP | PED | ADP | WRD | AP | EP | PMF | ODP | POF |
|---|---|---|---|---|---|---|---|---|---|---|---|---|
| kgCO2eq | MJ | kgSbeq | kg | kgSO2eq | kgPO43−eq | kgPM2.5eq | kgCFC-11eq | kgNMVOCeq | ||||
| MP | Concrete C40 | m3 | 90.41 | 32,745.52 | 229,266.22 | 0.02 | 64,511.25 | 85.45 | 11.13 | 32.11 | 0.000 | 50.80 |
| Reinforcing steel bars | t | 23.11 | 60,930.92 | 903,458.54 | 0.67 | 420,213.27 | 252.39 | 23.72 | 151.01 | 0.001 | 89.82 | |
| MT | Diesel for transporting Concrete | t | 1.49 | 1173.60 | 69,821.79 | 0.02 | 6041.32 | 5.69 | 0.86 | 0.90 | 0.001 | 4.61 |
| Diesel for transporting reinforcing steel bars | t | 0.13 | 105.82 | 6295.91 | 0.00 | 544.75 | 0.51 | 0.08 | 0.08 | 0.000 | 0.42 | |
| CM | Electricity | kWh | 4520.45 | 3340.61 | 47,012.68 | 0.00 | 12,566.85 | 17.67 | 1.14 | 5.20 | 0.000 | 1.36 |
| Binding wires | t | 0.23112 | 535.04 | 7765.63 | 0.01 | 3744.14 | 2.20 | 0.21 | 1.34 | 0.000 | 0.84 | |
| CT | Diesel for component transportation | t | 5.86 | 4632.37 | 275,596.50 | 0.10 | 23,845.94 | 22.48 | 3.38 | 3.54 | 0.002 | 18.18 |
| OA | Dry-mixed mortar DMM20 | m3 | 0.72 | 233.08 | 1660.31 | 0.00 | 483.72 | 0.63 | 0.08 | 0.23 | 0.000 | 0.36 |
| Shimming iron parts | t | 0.19 | 438.04 | 5382.68 | 0.00 | 2145.65 | 1.52 | 0.15 | 1.42 | 0.000 | 0.59 | |
| Grouting material for C40 | m3 | 1.49 | 539.02 | 3773.93 | 0.00 | 1061.91 | 1.41 | 0.18 | 0.53 | 0.000 | 0.84 | |
| Diesel for construction machinery | t | 0.33 | 260.55 | 15,501.17 | 0.01 | 1341.24 | 1.26 | 0.19 | 0.20 | 0.000 | 1.02 | |
| Total | 104,934.59 | 1,565,535.35 | 0.83 | 536,500.05 | 391.22 | 41.13 | 196.56 | 0.004 | 168.83 |
| Stage | Resource | Unit | Quantity | CCP | PED | ADP | WRD | AP | EP | PMF | ODP | POF |
|---|---|---|---|---|---|---|---|---|---|---|---|---|
| kgCO2eq | MJ | kgSbeq | kg | kgSO2eq | kgPO43−eq | kgPM2.5eq | kgCFC-11eq | kgNMVOCeq | ||||
| MP | Concrete C40 | m3 | 41.26 | 14,945.68 | 104,641.50 | 0.01 | 29,444.17 | 39.00 | 5.08 | 14.66 | 0.000 | 23.19 |
| Reinforcing steel bars | t | 8.52 | 22,458.81 | 333,009.98 | 0.25 | 154,888.36 | 93.03 | 8.74 | 55.66 | 0.000 | 33.11 | |
| MT | Diesel for transporting Concrete | t | 0.68 | 535.65 | 31,868.00 | 0.01 | 2757.37 | 2.60 | 0.39 | 0.41 | 0.000 | 2.10 |
| Diesel for transporting reinforcing steel bars | t | 0.05 | 39.01 | 2320.64 | 0.00 | 200.79 | 0.19 | 0.03 | 0.03 | 0.000 | 0.15 | |
| CM | Electricity | kWh | 2475.86 | 1829.66 | 25,748.99 | 0.00 | 6882.90 | 9.68 | 0.63 | 2.85 | 0.000 | 0.75 |
| Binding wires | t | 0.09 | 197.21 | 2862.38 | 0.00 | 1380.08 | 0.81 | 0.08 | 0.49 | 0.000 | 0.31 | |
| CT | Diesel for component transportation | t | 2.63 | 2075.58 | 123,483.62 | 0.04 | 10,684.40 | 10.07 | 1.52 | 1.59 | 0.001 | 8.14 |
| OA | Shimming iron parts | t | 0.05 | 129.23 | 1587.98 | 0.00 | 633.00 | 0.45 | 0.04 | 0.42 | 0.000 | 0.17 |
| Grouting material for C40 | m3 | 0.75 | 270.62 | 1894.74 | 0.00 | 533.15 | 0.71 | 0.09 | 0.27 | 0.000 | 0.42 | |
| Diesel for construction machinery | t | 0.22 | 177.18 | 10,540.79 | 0.00 | 912.04 | 0.86 | 0.13 | 0.14 | 0.000 | 0.70 | |
| Total | 42,658.64 | 637,958.63 | 0.32 | 208,316.27 | 157.39 | 16.73 | 76.50 | 0.002 | 69.04 |
| Stage | Resource | Unit | Quantity | CCP | PED | ADP | WRD | AP | EP | PMF | ODP | POF |
|---|---|---|---|---|---|---|---|---|---|---|---|---|
| kgCO2eq | MJ | kgSbeq | kg | kgSO2eq | kgPO43−eq | kgPM2.5eq | kgCFC-11eq | kgNMVOCeq | ||||
| MP | Concrete C40 | m3 | 11.6422 | 4216.73 | 29,523.20 | 0.00 | 8307.28 | 11.00 | 1.43 | 4.14 | 0.000 | 6.54 |
| Reinforcing steel bars | t | 1.84 | 4841.23 | 71,783.81 | 0.05 | 33,387.82 | 20.05 | 1.88 | 12.00 | 0.000 | 7.14 | |
| MT | Diesel for transporting Concrete | t | 0.19 | 151.13 | 8991.13 | 0.00 | 777.96 | 0.73 | 0.11 | 0.12 | 0.000 | 0.59 |
| Diesel for transporting reinforcing steel bars | t | 0.01 | 8.41 | 500.24 | 0.00 | 43.28 | 0.04 | 0.01 | 0.01 | 0.000 | 0.03 | |
| CM | Electricity | kWh | 523.90 | 387.16 | 5448.55 | 0.00 | 1456.44 | 2.05 | 0.13 | 0.60 | 0.000 | 0.16 |
| Binding wires | t | 0.02 | 42.50 | 616.90 | 0.00 | 297.43 | 0.17 | 0.02 | 0.11 | 0.000 | 0.07 | |
| CT | Diesel for component transportation | t | 0.73 | 574.78 | 34,195.51 | 0.01 | 2958.76 | 2.79 | 0.42 | 0.44 | 0.000 | 2.26 |
| OA | Post-cast Concrete C40 | m3 | 11.293 | 4090.22 | 28,637.51 | 0.00 | 8058.06 | 10.67 | 1.39 | 4.01 | 0.000 | 6.35 |
| Shimming iron parts | t | 0.101 | 237.39 | 2917.07 | 0.00 | 1162.80 | 0.82 | 0.08 | 0.77 | 0.000 | 0.32 | |
| Grouting material for C40 | m3 | 0.24 | 86.76 | 607.47 | 0.00 | 170.93 | 0.23 | 0.03 | 0.09 | 0.000 | 0.13 | |
| Diesel for construction machinery | t | 0.61 | 480.93 | 28,612.22 | 0.01 | 2475.67 | 2.33 | 0.35 | 0.37 | 0.000 | 1.89 | |
| Total | 15,117.24 | 211,833.61 | 0.09 | 59,096.43 | 50.90 | 5.86 | 22.64 | 0.001 | 25.47 |
| Stage | Resource | Unit | Quantity | CCP | PED | ADP | WRD | AP | EP | PMF | ODP | POF |
|---|---|---|---|---|---|---|---|---|---|---|---|---|
| kgCO2eq | MJ | kgSbeq | kg | kgSO2eq | kgPO43−eq | kgPM2.5eq | kgCFC-11eq | kgNMVOCeq | ||||
| MP | Concrete C40 | m3 | 114.02 | 41,295.56 | 289,128.93 | 0.03 | 81,355.50 | 107.76 | 14.04 | 40.50 | 0.000 | 64.06 |
| Reinforcing steel bars | t | 14.77 | 38,944.52 | 577,453.25 | 0.43 | 268,582.91 | 161.32 | 15.16 | 96.52 | 0.000 | 57.41 | |
| MT | Diesel for transporting Concrete | t | 1.87 | 1480.03 | 88,052.65 | 0.03 | 7618.74 | 7.18 | 1.08 | 1.13 | 0.001 | 5.81 |
| Diesel for transporting reinforcing steel bars | t | 0.09 | 67.64 | 4024.09 | 0.00 | 348.18 | 0.33 | 0.05 | 0.05 | 0.000 | 0.27 | |
| CM | Electricity | kWh | 5130.69 | 3791.58 | 53,359.16 | 0.00 | 14,263.31 | 20.06 | 1.30 | 5.90 | 0.000 | 1.54 |
| Binding wires | t | 0.15 | 341.97 | 4963.39 | 0.00 | 2393.06 | 1.40 | 0.14 | 0.86 | 0.000 | 0.54 | |
| CT | Diesel for component transportation | t | 7.05 | 5567.66 | 331,240.78 | 0.12 | 28,660.55 | 27.02 | 4.06 | 4.25 | 0.003 | 21.85 |
| OA | Post-cast Concrete C40 | m3 | 102.61 | 37,166.01 | 260,216.04 | 0.02 | 73,219.95 | 96.98 | 12.64 | 36.45 | 0.000 | 57.66 |
| Shimming iron parts | t | 0.99 | 2324.82 | 28,567.67 | 0.00 | 11,387.67 | 8.08 | 0.80 | 7.53 | 0.000 | 3.13 | |
| Grouting material C40 | m3 | 2.35 | 849.70 | 5949.15 | 0.00 | 1673.98 | 2.22 | 0.29 | 0.83 | 0.000 | 1.32 | |
| Diesel for construction machinery | t | 5.96 | 4709.87 | 280,207.42 | 0.10 | 24,244.90 | 22.85 | 3.44 | 3.60 | 0.003 | 18.48 | |
| Total | 136,539.37 | 1,923,162.54 | 0.74 | 513,748.76 | 455.20 | 52.99 | 197.62 | 0.008 | 232.07 |
| Stage | Resource | Unit | Quantity | CCP | PED | ADP | WRD | AP | EP | PMF | ODP | POF |
|---|---|---|---|---|---|---|---|---|---|---|---|---|
| kgCO2eq | MJ | kgSbeq | kg | kgSO2eq | kgPO43−eq | kgPM2.5eq | kgCFC-11eq | kgNMVOCeq | ||||
| MP | Concrete C30 | m3 | 43.8120 | 14,148.13 | 100,616.19 | 0.01 | 29,305.69 | 38.10 | 5.00 | 14.13 | 0.000 | 21.98 |
| Reinforcing steel bars | t | 9.46 | 24,929.14 | 369,638.95 | 0.27 | 171,925.09 | 103.26 | 9.70 | 61.79 | 0.000 | 36.75 | |
| MT | Diesel for transporting Concrete | t | 0.71 | 557.02 | 33,139.28 | 0.01 | 2867.37 | 2.70 | 0.41 | 0.43 | 0.000 | 2.19 |
| Diesel for transporting reinforcing steel bars | t | 0.05 | 43.30 | 2575.90 | 0.00 | 222.88 | 0.21 | 0.03 | 0.03 | 0.000 | 0.17 | |
| CM | Electricity | kWh | 2190.60 | 1618.85 | 22,782.24 | 0.00 | 6089.87 | 8.57 | 0.55 | 2.52 | 0.000 | 0.66 |
| Binding wires | t | 0.09 | 218.91 | 3177.22 | 0.00 | 1531.87 | 0.90 | 0.09 | 0.55 | 0.000 | 0.34 | |
| CT | Diesel for component transportation | t | 2.75 | 2169.77 | 129,087.47 | 0.05 | 11,169.27 | 10.53 | 1.58 | 1.66 | 0.001 | 8.51 |
| OA | Shimming iron parts | t | 0.09 | 212.27 | 2608.44 | 0.00 | 1039.78 | 0.74 | 0.07 | 0.69 | 0.000 | 0.29 |
| Grouting material C30 | m3 | 0.74 | 237.78 | 1691.03 | 0.00 | 492.53 | 0.64 | 0.08 | 0.24 | 0.000 | 0.37 | |
| Diesel for construction machinery | t | 0.23 | 184.18 | 10,957.39 | 0.00 | 948.09 | 0.89 | 0.13 | 0.14 | 0.000 | 0.72 | |
| Total | 44,319.35 | 676,274.08 | 0.35 | 225,592.43 | 166.54 | 17.66 | 82.17 | 0.002 | 71.98 |
Appendix A.2. Environmental Costs
| Stage | Resource | Unit | Quantity | CCP | PED | ADP | WRD | AP | EP | PMF | ODP | POF |
|---|---|---|---|---|---|---|---|---|---|---|---|---|
| CNY | CNY | CNY | CNY | CNY | CNY | CNY | CNY | CNY | ||||
| MP | Concrete—C40 | m3 | 226.608 | 22,981.19 | 158.60 | 0.00 | 224.76 | 366.23 | 20.37 | 55.54 | 0.01 | 1114.13 |
| Foamed ceramics | m3 | 216.192 | 39,649.61 | 85.36 | 0.01 | 167.53 | 421.07 | 22.96 | 27.78 | 0.00 | 830.07 | |
| MT | Diesel for transporting Concrete | t | 3.724 | 823.65 | 48.30 | 0.00 | 21.05 | 24.41 | 1.57 | 1.55 | 0.03 | 101.00 |
| Diesel for transporting foamed ceramics | t | 1.671 | 369.57 | 21.67 | 0.00 | 9.44 | 10.95 | 0.70 | 0.70 | 0.01 | 45.32 | |
| CM | Electricity | kWh | 19,925.978 | 4123.08 | 57.20 | 0.00 | 77.00 | 133.23 | 3.68 | 15.81 | 0.00 | 52.48 |
| Binding wire | t | 0.155 | 100.37 | 1.44 | 0.00 | 3.49 | 2.52 | 0.10 | 0.62 | 0.00 | 4.92 | |
| CT | Diesel for component transportation | t | 18.519 | 4096.49 | 240.23 | 0.01 | 104.68 | 121.39 | 7.80 | 7.71 | 0.13 | 502.34 |
| OA | Dry-mixed mortar DMM20 | m3 | 3.542 | 319.64 | 2.24 | 0.00 | 3.29 | 5.27 | 0.29 | 0.79 | 0.00 | 15.60 |
| Shimming iron parts | t | 0.909 | 600.71 | 7.28 | 0.00 | 14.61 | 12.75 | 0.54 | 4.79 | 0.00 | 25.29 | |
| Concrete grouting material—C40 | m3 | 7.289 | 739.20 | 5.10 | 0.00 | 7.23 | 11.78 | 0.66 | 1.79 | 0.00 | 35.84 | |
| Diesel for construction machinery | t | 1.039 | 229.87 | 13.48 | 0.00 | 5.87 | 6.81 | 0.44 | 0.43 | 0.01 | 28.19 | |
| Total | 74,033.38 | 640.90 | 0.02 | 638.95 | 1116.41 | 59.11 | 117.51 | 0.19 | 2755.17 |
| Stage | Resource | Unit | Quantity | CCP | PED | ADP | WRD | AP | EP | PMF | ODP | POF |
|---|---|---|---|---|---|---|---|---|---|---|---|---|
| CNY | CNY | CNY | CNY | CNY | CNY | CNY | CNY | CNY | ||||
| MP | Concrete C40 | m3 | 90.41 | 9168.75 | 63.28 | 0.00 | 89.67 | 146.11 | 8.13 | 22.16 | 0.01 | 444.50 |
| Reinforcing steel bars | t | 23.11 | 17,060.66 | 249.35 | 0.01 | 584.10 | 431.59 | 17.31 | 104.20 | 0.01 | 785.93 | |
| MT | Diesel for the transportation of Concrete | t | 1.49 | 328.61 | 19.27 | 0.00 | 8.40 | 9.74 | 0.63 | 0.62 | 0.01 | 40.30 |
| Diesel for the transportation of reinforcing steel bars | t | 0.13 | 29.63 | 1.74 | 0.00 | 0.76 | 0.88 | 0.06 | 0.06 | 0.00 | 3.63 | |
| CM | Electricity | kWh | 4520.45 | 935.37 | 12.98 | 0.00 | 17.47 | 30.22 | 0.83 | 3.59 | 0.00 | 11.91 |
| Timber spacers | t | 0.23112 | 149.81 | 2.14 | 0.00 | 5.20 | 3.75 | 0.16 | 0.92 | 0.00 | 7.34 | |
| CT | Diesel for component transportation | t | 5.86 | 1297.06 | 76.06 | 0.00 | 33.15 | 38.44 | 2.47 | 2.44 | 0.04 | 159.05 |
| OA | Dry-mixed mortar DMM20 | m3 | 0.72 | 65.26 | 0.46 | 0.00 | 0.67 | 1.08 | 0.06 | 0.16 | 0.00 | 3.18 |
| Shimming iron parts | t | 0.19 | 122.65 | 1.49 | 0.00 | 2.98 | 2.60 | 0.11 | 0.98 | 0.00 | 5.16 | |
| Grouting material—C40 | m3 | 1.49 | 150.93 | 1.04 | 0.00 | 1.48 | 2.41 | 0.13 | 0.36 | 0.00 | 7.32 | |
| Diesel for construction machinery | t | 0.33 | 72.95 | 4.28 | 0.00 | 1.86 | 2.16 | 0.14 | 0.14 | 0.00 | 8.95 | |
| Total | 29,381.68 | 432.09 | 0.02 | 745.74 | 668.98 | 30.02 | 135.63 | 0.07 | 1477.28 |
| Stage | Resource | Unit | Quantity | CCP | PED | ADP | WRD | AP | EP | PMF | ODP | POF |
|---|---|---|---|---|---|---|---|---|---|---|---|---|
| CNY | CNY | CNY | CNY | CNY | CNY | CNY | CNY | CNY | ||||
| MP | Concrete C40 | m3 | 41.26 | 4184.79 | 28.88 | 0.00 | 40.93 | 66.69 | 3.71 | 10.11 | 0.00 | 202.88 |
| Reinforcing steel bars | t | 8.52 | 6288.47 | 91.91 | 0.00 | 215.29 | 159.08 | 6.38 | 38.41 | 0.00 | 289.69 | |
| MT | Diesel for transporting Concrete | t | 0.68 | 149.98 | 8.80 | 0.00 | 3.83 | 4.44 | 0.29 | 0.28 | 0.00 | 18.39 |
| Diesel for transporting reinforcing steel bars | t | 0.05 | 10.92 | 0.64 | 0.00 | 0.28 | 0.32 | 0.02 | 0.02 | 0.00 | 1.34 | |
| CM | Electricity | kWh | 2475.86 | 512.31 | 7.11 | 0.00 | 9.57 | 16.55 | 0.46 | 1.96 | 0.00 | 6.52 |
| Binding wires | t | 0.09 | 55.22 | 0.79 | 0.00 | 1.92 | 1.38 | 0.06 | 0.34 | 0.00 | 2.71 | |
| CT | Diesel for component transportation | t | 2.63 | 581.16 | 34.08 | 0.00 | 14.85 | 17.22 | 1.11 | 1.09 | 0.02 | 71.27 |
| OA | Shimming iron parts | t | 0.05 | 36.18 | 0.44 | 0.00 | 0.88 | 0.77 | 0.03 | 0.29 | 0.00 | 1.52 |
| Grouting material—C40 | m3 | 0.75 | 75.77 | 0.52 | 0.00 | 0.74 | 1.21 | 0.07 | 0.18 | 0.00 | 3.67 | |
| Diesel for construction machinery | t | 0.22 | 49.61 | 2.91 | 0.00 | 1.27 | 1.47 | 0.09 | 0.09 | 0.00 | 6.08 | |
| Total | 11,944.42 | 176.08 | 0.01 | 289.56 | 269.14 | 12.21 | 52.79 | 0.03 | 604.07 |
| Stage | Resource | Unit | Quantity | CCP | PED | ADP | WRD | AP | EP | PMF | ODP | POF |
|---|---|---|---|---|---|---|---|---|---|---|---|---|
| CNY | CNY | CNY | CNY | CNY | CNY | CNY | CNY | CNY | ||||
| MP | Concrete C40 | m3 | 11.6422 | 1180.68 | 8.15 | 0.00 | 11.55 | 18.82 | 1.05 | 2.85 | 0.00 | 57.24 |
| Reinforcing steel bars | t | 1.84 | 1355.55 | 19.81 | 0.00 | 46.41 | 34.29 | 1.38 | 8.28 | 0.00 | 62.45 | |
| MT | Diesel for transporting Concrete | t | 0.19 | 42.32 | 2.48 | 0.00 | 1.08 | 1.25 | 0.08 | 0.08 | 0.00 | 5.19 |
| Diesel for transporting reinforcing steel bars | t | 0.01 | 2.35 | 0.14 | 0.00 | 0.06 | 0.07 | 0.00 | 0.00 | 0.00 | 0.29 | |
| CM | Electricity | kWh | 523.90 | 108.41 | 1.50 | 0.00 | 2.02 | 3.50 | 0.10 | 0.42 | 0.00 | 1.38 |
| Binding wires | t | 0.02 | 11.90 | 0.17 | 0.00 | 0.41 | 0.30 | 0.01 | 0.07 | 0.00 | 0.58 | |
| CT | Diesel for component transportation | t | 0.73 | 160.94 | 9.44 | 0.00 | 4.11 | 4.77 | 0.31 | 0.30 | 0.00 | 19.74 |
| OA | Post-cast Concrete C40 | m3 | 11.293 | 1145.26 | 7.90 | 0.00 | 11.20 | 18.25 | 1.02 | 2.77 | 0.00 | 55.52 |
| Shimming iron parts | t | 0.101 | 66.47 | 0.81 | 0.00 | 1.62 | 1.41 | 0.06 | 0.53 | 0.00 | 2.80 | |
| Grouting material—C40 | m3 | 0.24 | 24.29 | 0.17 | 0.00 | 0.24 | 0.39 | 0.02 | 0.06 | 0.00 | 1.18 | |
| Diesel for construction machinery | t | 0.68 | 134.66 | 7.90 | 0.00 | 3.44 | 3.99 | 0.26 | 0.25 | 0.00 | 16.51 | |
| Total | 4232.83 | 58.47 | 0.00 | 82.14 | 87.04 | 4.27 | 15.62 | 0.01 | 222.87 |
| Stage | Resource | Unit | Quantity | CCP | PED | ADP | WRD | AP | EP | PMF | ODP | POF |
|---|---|---|---|---|---|---|---|---|---|---|---|---|
| CNY | CNY | CNY | CNY | CNY | CNY | CNY | CNY | CNY | ||||
| MP | Concrete C40 | m3 | 114.02 | 11,562.76 | 79.80 | 0.00 | 113.08 | 184.26 | 10.25 | 27.94 | 0.01 | 560.56 |
| Reinforcing steel bars | t | 14.77 | 10,904.47 | 159.38 | 0.01 | 373.33 | 275.85 | 11.07 | 66.60 | 0.01 | 502.33 | |
| MT | Diesel for transporting Concrete | t | 1.87 | 414.41 | 24.30 | 0.00 | 10.59 | 12.28 | 0.79 | 0.78 | 0.01 | 50.82 |
| Diesel for transporting reinforcing steel bars | t | 0.09 | 18.94 | 1.11 | 0.00 | 0.48 | 0.56 | 0.04 | 0.04 | 0.00 | 2.32 | |
| CM | Electricity | kWh | 5130.69 | 1061.64 | 14.73 | 0.00 | 19.83 | 34.30 | 0.95 | 4.07 | 0.00 | 13.51 |
| Binding wires | t | 0.15 | 95.75 | 1.37 | 0.00 | 3.33 | 2.40 | 0.10 | 0.59 | 0.00 | 4.69 | |
| CT | Diesel for component transportation | t | 7.05 | 1558.95 | 91.42 | 0.00 | 39.84 | 46.20 | 2.97 | 2.93 | 0.05 | 191.17 |
| OA | Post-cast Concrete C40 | m3 | 102.61 | 10,406.48 | 71.82 | 0.00 | 101.78 | 165.84 | 9.22 | 25.15 | 0.01 | 504.51 |
| Shimming iron parts | t | 0.99 | 650.95 | 7.88 | 0.00 | 15.83 | 13.81 | 0.58 | 5.19 | 0.00 | 27.41 | |
| Grouting material C40 | m3 | 2.35 | 237.92 | 1.64 | 0.00 | 2.33 | 3.79 | 0.21 | 0.57 | 0.00 | 11.53 | |
| Diesel for construction machinery | t | 6.62 | 1318.76 | 77.34 | 0.00 | 33.70 | 39.08 | 2.51 | 2.48 | 0.04 | 161.72 | |
| Total | 38,231.02 | 530.79 | 0.01 | 714.11 | 778.38 | 38.68 | 136.36 | 0.12 | 2030.58 |
| Stage | Resource | Unit | Quantity | CCP | PED | ADP | WRD | AP | EP | PMF | ODP | POF |
|---|---|---|---|---|---|---|---|---|---|---|---|---|
| CNY | CNY | CNY | CNY | CNY | CNY | CNY | CNY | CNY | ||||
| MP | Concrete C30 | m3 | 43.8120 | 3961.48 | 27.77 | 0.00 | 40.73 | 65.15 | 3.65 | 9.75 | 0.00 | 192.32 |
| Reinforcing steel bars | t | 9.46 | 6980.16 | 102.02 | 0.01 | 238.98 | 176.58 | 7.08 | 42.63 | 0.00 | 321.55 | |
| MT | Diesel for transporting Concrete | t | 0.71 | 155.97 | 9.15 | 0.00 | 3.99 | 4.62 | 0.30 | 0.29 | 0.00 | 19.13 |
| Diesel for transporting reinforcing steel bars | t | 0.05 | 12.12 | 0.71 | 0.00 | 0.31 | 0.36 | 0.02 | 0.02 | 0.00 | 1.49 | |
| CM | Electricity | kWh | 2190.60 | 453.28 | 6.29 | 0.00 | 8.46 | 14.65 | 0.40 | 1.74 | 0.00 | 5.77 |
| Binding wires | t | 0.09 | 61.29 | 0.88 | 0.00 | 2.13 | 1.54 | 0.06 | 0.38 | 0.00 | 3.00 | |
| CT | Diesel for component transportation | t | 2.75 | 607.54 | 35.63 | 0.00 | 15.53 | 18.00 | 1.16 | 1.14 | 0.02 | 74.50 |
| OA | Shimming iron parts | t | 0.09 | 59.44 | 0.72 | 0.00 | 1.45 | 1.26 | 0.05 | 0.47 | 0.00 | 2.50 |
| Grouting material C30 | m3 | 0.74 | 66.58 | 0.47 | 0.00 | 0.68 | 1.09 | 0.06 | 0.16 | 0.00 | 3.23 | |
| Diesel for construction machinery | t | 0.23 | 51.57 | 3.02 | 0.00 | 1.32 | 1.53 | 0.10 | 0.10 | 0.00 | 6.32 | |
| Total | 12,409.42 | 186.65 | 0.01 | 313.57 | 284.78 | 12.89 | 56.69 | 0.03 | 629.82 |
Appendix A.3. Sensitivity Analysis
| CNY | CCP | PED | ADP | WRD | AP | EP | PMF | ODP | POF |
|---|---|---|---|---|---|---|---|---|---|
| −20% | 152,592.1 | 186,233.6 | 186,638.6 | 186,081.8 | 185,997.7 | 186,607.2 | 186,535.7 | 186,638.5 | 185,094.7 |
| −15% | 161,103.7 | 186,334.9 | 186,638.6 | 186,221.0 | 186,157.9 | 186,615.1 | 186,561.4 | 186,638.6 | 185,480.7 |
| −10% | 169,615.4 | 186,436.1 | 186,638.6 | 186,360.2 | 186,318.2 | 186,622.9 | 186,587.2 | 186,638.6 | 185,866.7 |
| −5% | 178,127.0 | 186,537.4 | 186,638.6 | 186,499.4 | 186,478.4 | 186,630.8 | 186,612.9 | 186,638.6 | 186,252.6 |
| 0% | 186,638.6 | 186,638.6 | 186,638.6 | 186,638.6 | 186,638.6 | 186,638.6 | 186,638.6 | 186,638.6 | 186,638.6 |
| 5% | 195,150.3 | 186,739.9 | 186,638.6 | 186,777.8 | 186,798.9 | 186,646.5 | 186,664.4 | 186,638.7 | 187,024.6 |
| 10% | 203,661.9 | 186,841.1 | 186,638.6 | 186,917.0 | 186,959.1 | 186,654.4 | 186,690.1 | 186,638.7 | 187,410.6 |
| 15% | 212,173.5 | 186,942.4 | 186,638.6 | 187,056.2 | 187,119.3 | 186,662.2 | 186,715.8 | 186,638.7 | 187,796.6 |
| 20% | 220,685.2 | 187,043.6 | 186,638.6 | 187,195.4 | 187,279.6 | 186,670.1 | 186,741.5 | 186,638.7 | 188,182.6 |
| % | CCP | PED | ADP | WRD | AP | EP | PMF | ODP | POF |
|---|---|---|---|---|---|---|---|---|---|
| −20% | −18.24% | −0.22% | 0.00% | −0.30% | −0.34% | −0.02% | −0.06% | 0.00% | −0.83% |
| −15% | −13.68% | −0.16% | 0.00% | −0.22% | −0.26% | −0.01% | −0.04% | 0.00% | −0.62% |
| −10% | −9.12% | −0.11% | 0.00% | −0.15% | −0.17% | −0.01% | −0.03% | 0.00% | −0.41% |
| −5% | −4.56% | −0.05% | 0.00% | −0.07% | −0.09% | 0.00% | −0.01% | 0.00% | −0.21% |
| 0% | 0.00% | 0.00% | 0.00% | 0.00% | 0.00% | 0.00% | 0.00% | 0.00% | 0.00% |
| 5% | 4.56% | 0.05% | 0.00% | 0.07% | 0.09% | 0.00% | 0.01% | 0.00% | 0.21% |
| 10% | 9.12% | 0.11% | 0.00% | 0.15% | 0.17% | 0.01% | 0.03% | 0.00% | 0.41% |
| 15% | 13.68% | 0.16% | 0.00% | 0.22% | 0.26% | 0.01% | 0.04% | 0.00% | 0.62% |
| 20% | 18.24% | 0.22% | 0.00% | 0.30% | 0.34% | 0.02% | 0.06% | 0.00% | 0.83% |
References
- Cheng, B.; Lu, K.; Li, J.; Chen, H.; Luo, X.; Shafique, M. Comprehensive assessment of embodied environmental impacts of buildings using normalized environmental impact factors. J. Clean. Prod. 2022, 334, 130083. [Google Scholar] [CrossRef]
- Tavares, V.; Soares, N.; Raposo, N.; Marques, P.; Freire, F. Prefabricated versus conventional construction: Comparing life-cycle impacts of alternative structural materials. J. Build. Eng. 2021, 41, 102705. [Google Scholar] [CrossRef]
- Han, Q.; Chang, J.; Liu, G.; Zhang, H. The carbon emission assessment of a building with different prefabrication rates in the construction stage. Int. J. Environ. Res. Public Health 2022, 19, 2366. [Google Scholar] [CrossRef] [PubMed]
- Navaratnam, S.; Ngo, T.; Gunawardena, T.; Henderson, D. Performance review of prefabricated building systems and future research in Australia. Buildings 2019, 9, 38. [Google Scholar] [CrossRef]
- Andersen, S.C.; Sohn, J.; Oldfield, P.; Birkved, M. Evaluating the environmental impacts of conventional and modular buildings in absolute measures: A case study across different geographical contexts. Build. Environ. 2022, 223, 109509. [Google Scholar] [CrossRef]
- Guaygua, B.; Sánchez-Garrido, A.J.; Yepes, V. Life cycle assessment of seismic resistant prefabricated modular buildings. Heliyon 2024, 10, e39458. [Google Scholar] [CrossRef]
- Ansah, M.K.; Chen, X.; Yang, H.; Lu, L.; Lam, P.T.I. Developing an automated BIM-based life cycle assessment approach for modularly designed high-rise buildings. Environ. Impact Assess. Rev. 2021, 90, 106618. [Google Scholar] [CrossRef]
- Lu, K.; Deng, X. OpenBIM-based assessment for social cost of carbon through building life cycle. Sustain. Cities Soc. 2023, 99, 104871. [Google Scholar] [CrossRef]
- Lu, K.; Deng, X. Comprehensive carbon cost of building projects: Optimization and relationship. Build. Environ. 2025, 280, 113157. [Google Scholar] [CrossRef]
- Pons, O.; Wadel, G. Environmental impacts of prefabricated school buildings in Catalonia. Habitat Int. 2011, 35, 553–563. [Google Scholar] [CrossRef]
- Quale, J.; Eckelman, M.J.; Williams, K.W.; Sloditskie, G.; Zimmerman, J.B. Construction Matters: Comparing Environmental Impacts of Building Modular and Conventional Homes in the United States. J. Ind. Ecol. 2012, 16, 243–253. [Google Scholar] [CrossRef]
- Kamali, M.; Hewage, K.; Sadiq, R. Conventional versus modular construction methods: A comparative cradle-to-gate LCA for residential buildings. Energy Build. 2019, 204, 109479. [Google Scholar] [CrossRef]
- Jayawardana, J.; Sandanayake, M.; Jayasinghe, J.A.S.C.; Kulatunga, A.K.; Zhang, G. A comparative life cycle assessment of prefabricated and traditional construction—A case of a developing country. J. Build. Eng. 2023, 72, 106550. [Google Scholar] [CrossRef]
- Wang, S.; Sinha, R. Life cycle assessment of different prefabricated rates for building construction. Buildings 2021, 11, 552. [Google Scholar] [CrossRef]
- Tumminia, G.; Guarino, F.; Longo, S.; Ferraro, M.; Cellura, M.; Antonucci, V. Life cycle energy performances and environmental impacts of a prefabricated building module. Renew. Sustain. Energy Rev. 2018, 92, 272–283. [Google Scholar] [CrossRef]
- Balasbaneh, A.T.; Ramli, M.Z. A comparative life cycle assessment (LCA) of concrete and steel-prefabricated prefinished volumetric construction structures in Malaysia. Environ. Sci. Pollut. Res. 2020, 27, 43186–43201. [Google Scholar] [CrossRef]
- Baldrich Aragó, A.; Roig Hernando, J.; Llovera Saez, F.J.; Coll Bertran, J. Quantity surveying and BIM 5D. Its implementation and analysis based on a case study approach in Spain. J. Build. Eng. 2021, 44, 103234. [Google Scholar] [CrossRef]
- Banihashemi, S.; Khalili, S.; Sheikhkhoshkar, M.; Fazeli, A. Machine learning-integrated 5D BIM informatics: Building materials costs data classification and prototype development. Innov. Infrastruct. Solut. 2022, 7, 215. [Google Scholar] [CrossRef]
- Hosamo, H.H.; Rolfsen, C.N.; Zeka, F.; Sandbeck, S.; Said, S.; Sætre, M.A. Navigating the Adoption of 5D Building Information Modeling: Insights from Norway. Infrastructures 2024, 9, 75. [Google Scholar] [CrossRef]
- Antwi-Afari, P.; Ng, S.T.; Chen, J.; Zheng, X.M. Determining the impacts and recovery potentials of a modular designed residential building using the novel LCA-C2C–PBSCI method. J. Clean. Prod. 2022, 378, 134575. [Google Scholar] [CrossRef]
- ISO 14040; Environmental Management—Life Cycle Assessment—Principles and Framework. International Organization for Standardization: Geneva, Switzerland, 2006; pp. 1–20. Available online: https://www.iso.org/standard/37456.html (accessed on 1 June 2025).
- Faludi, J.; Lepech, M.D.; Loisos, G. Using life cycle assessment methods to guide architectural decision-making for sustainable prefabricated modular buildings. J. Green Build. 2012, 7, 151–170. [Google Scholar] [CrossRef]
- Bonamente, E.; Cotana, F. Carbon and energy footprints of prefabricated industrial buildings: A systematic life cycle assessment analysis. Energies 2015, 8, 12685–12701. [Google Scholar] [CrossRef]
- Jayawardana, J.; Sandanayake, M.; Kulatunga, A.K.; Jayasinghe, J.A.S.C.; Zhang, G.; Osadith, S.A.U. Evaluating the Circular Economy Potential of Modular Construction in Developing Economies—A Life Cycle Assessment. Sustainability 2023, 15, 16336. [Google Scholar] [CrossRef]
- Achenbach, H.; Wenker, J.L.; Rüter, S. Life cycle assessment of product- and construction stage of prefabricated timber houses: A sector representative approach for Germany according to EN 15804, EN 15978 and EN 16485. Eur. J. Wood Wood Prod. 2018, 76, 711–729. [Google Scholar] [CrossRef]
- Lu, K.; Deng, X.; Jiang, X.; Cheng, B.; Tam, V.W.Y. A review on life cycle cost analysis of buildings based on building information modeling. J. Civ. Eng. Manag. 2023, 29, 268–288. [Google Scholar] [CrossRef]
- Lu, K.; Jiang, X.; Yu, J.; Tam, V.W.Y.; Skitmore, M. Integration of life cycle assessment and life cycle cost using building information modeling: A critical review. J. Clean. Prod. 2021, 285, 125438. [Google Scholar] [CrossRef]
- Xu, Z.; Zhang, L.; Li, H.; Lin, Y.H.; Yin, S. Combining IFC and 3D tiles to create 3D visualization for building information modeling. Autom. Constr. 2020, 109, 102995. [Google Scholar] [CrossRef]
- Cheng, J.C.P.; Tan, Y.; Song, Y.; Liu, X.; Wang, X. A semi-automated approach to generate 4D/5D BIM models for evaluating different offshore oil and gas platform decommissioning options. Vis. Eng. 2017, 5, 12. [Google Scholar] [CrossRef]
- Alrashed, I.; Kantamaneni, K. A 5D building information model (BIM) for potential cost-benefit housing: A case of Kingdom of Saudi Arabia (KSA). Infrastructures 2018, 3, 13. [Google Scholar] [CrossRef]
- Zhang, A.; Zhou, X.; Wang, F.; Yang, J. A multiobjective optimisation and display framework for time-cost-carbon emissions in building materialisation phase based on nD BIM concept. J. Build. Eng. 2025, 103, 111993. [Google Scholar] [CrossRef]
- Pishdad, P.; Onungwa, I.O. Analysis of 5D BIM for cost estimation, cost control, and payments. J. Inf. Technol. Constr. 2024, 29, 525–548. [Google Scholar] [CrossRef]
- Stanley, R.; Thurnell, D. The benefits of, and barriers to, implementation of 5D BIM for quantity surveying in New Zealand. Australas. J. Constr. Econ. Build. 2014, 14, 105–117. [Google Scholar] [CrossRef]
- Mayouf, M.; Gerges, M.; Cox, S. 5D BIM: An investigation into the integration of quantity surveyors within the BIM process. J. Eng. Des. Technol. 2019, 17, 537–553. [Google Scholar] [CrossRef]
- Kehily, D.; Underwood, J. Embedding life cycle costing in 5D BIM. J. Inf. Technol. Constr. 2017, 22, 145–167. [Google Scholar]
- Lu, Q.; Won, J.; Cheng, J.C.P. A financial decision making framework for construction projects based on 5D Building Information Modeling (BIM). Int. J. Proj. Manag. 2016, 34, 3–21. [Google Scholar] [CrossRef]
- Amin Ranjbar, A.; Ansari, R.; Taherkhani, R.; Hosseini, M.R. Developing a novel cash flow risk analysis framework for construction projects based on 5D BIM. J. Build. Eng. 2021, 44, 103341. [Google Scholar] [CrossRef]
- Ding, L.; Zhou, Y.; Akinci, B. Building Information Modeling (BIM) application framework: The process of expanding from 3D to computable nD. Autom. Constr. 2014, 46, 82–93. [Google Scholar] [CrossRef]
- Manzoor, B.; Charef, R.; Antwi-Afari, M.F.; Alotaibi, K.S.; Harirchian, E. Revolutionizing Construction Safety: Unveiling the Digital Potential of Building Information Modeling (BIM). Buildings 2025, 15, 828. [Google Scholar] [CrossRef]
- GhaffarianHoseini, A.; Zhang, T.; Nwadigo, O.; GhaffarianHoseini, A.; Naismith, N.; Tookey, J.; Raahemifar, K. Application of nD BIM Integrated Knowledge-based Building Management System (BIM-IKBMS) for inspecting post-construction energy efficiency. Renew. Sustain. Energy Rev. 2017, 72, 935–949. [Google Scholar] [CrossRef]
- GhaffarianHoseini, A.; Zhang, T.; Naismith, N.; GhaffarianHoseini, A.; Doan, D.T.; Rehman, A.U.; Nwadigo, O.; Tookey, J. ND BIM-integrated knowledge-based building management: Inspecting post-construction energy efficiency. Autom. Constr. 2019, 97, 13–28. [Google Scholar] [CrossRef]
- Manzoor, B.; Othman, I.; Gardezi, S.S.S.; Harirchian, E. Strategies for adopting building information modeling (BIM) in sustainable building projects—A case of Malaysia. Buildings 2021, 11, 249. [Google Scholar] [CrossRef]
- Lu, K.; Deng, X. OpenBIM driven marginal abatement cost of low-carbon measures in building design. Appl. Energy 2025, 377, 124477. [Google Scholar] [CrossRef]
- Deng, X.; Lu, K. Multi-level assessment for embodied carbon of buildings using multi-source industry foundation classes. J. Build. Eng. 2023, 72, 106705. [Google Scholar] [CrossRef]
- Lu, K.; Deng, X.; Zhai, X. OpenBIM-based simulation of building operational carbon under different information availability. Smart Sustain. Built Environ. 2024; ahead-of-print. [Google Scholar] [CrossRef]
- Whitlock, K.; Abanda, F.H.; Manjia, M.B.; Pettang, C.; Nkeng, G.E. 4D BIM for Construction Logistics Management. CivilEng 2021, 2, 325–348. [Google Scholar] [CrossRef]
- Umar, T. Challenges of BIM implementation in GCC construction industry. Eng. Constr. Archit. Manag. 2022, 29, 1139–1168. [Google Scholar] [CrossRef]
- ISO 14008:2019; Monetary Valuation of Environmental Impacts and Related Environmental Aspects. International Organization for Standardization: Geneva, Switzerland, 2019. Available online: https://www.iso.org/standard/43243.html (accessed on 1 June 2025).
- ISO 21931-1; Sustainability in Buildings and Civil Engineering Works—Framework for Methods of Assessment of the Environmental, Social and Economic Performance of Construction Works as a Basis for Sustainability Assessment—Part 1: Buildings. International Organization for Standardization: Geneva, Switzerland, 2022; pp. 1–57. Available online: https://www.iso.org/standard/71183.html (accessed on 1 June 2025).
- IKE Chinese Life Cycle Database (CLCD). Integrated Knowledge for Our Environment (IKE). 2025. Available online: https://www.weblca.net/database (accessed on 1 June 2025).
- YJK. YJK Building Structural Design Software (YJK-A); YJK Building Software: Beijing, China, 2024; Available online: https://www.yjk.cn/jgrj/ (accessed on 1 June 2025).
- Autodesk. Autodesk Revit 2018. 2024. Available online: https://www.autodesk.com.cn/products/revit/overview (accessed on 1 June 2025).
- BUZZ BeePC V4.2. BUZZ Technology. 2024. Available online: http://www.wengwengkeji.com/ (accessed on 1 June 2025).
- GB/T51061-2014; Code for Grid Identification System. Ministry of Housing and Urban-Rural Development of the People’s Republic of China: Beijing, China, 2014. Available online: https://ebook.chinabuilding.com.cn/zbooklib/bookpdf/probation?SiteID=1&bookID=59321 (accessed on 1 June 2025).
- BuildingSmart. Industry Foundation Classes (IFC). 2021. Available online: https://standards.buildingsmart.org/IFC/RELEASE/IFC4/FINAL/HTML/ (accessed on 15 March 2013).
- DL/T5341-2021; Standard Method of Measurement for Transformer Project. National Energy Administration of the People’s Republic of China: Beijing, China, 2021. Available online: https://ndls.org.cn/standard/detail/08312634449e1d215bd4ef2ff3342909 (accessed on 1 June 2025).
- Zhu, J.; Chen, X.; Wang, D.; Zuo, J. Quantitative analysis on the embodied environmental impact of buildings based on WTP. J. Civ. Archit. Environ. Eng. 2016, 38, 72–77. [Google Scholar] [CrossRef]
- Cao, X. Environmental Impact Assessment and Comparative Studies on Industrialized House and Traditional House Construction. Master’s Thesis, Tsinghua University, Beijing, China, 2012. Available online: https://newetds.lib.tsinghua.edu.cn/qh/paper/summary?dbCode=ETDQH&sysId=202306 (accessed on 1 June 2025).
- Li, X.D.; Wu, X.; Zhang, Z.H. Study on social WTP for environmental impacts based on the LCA theory. J. Harbin Inst. Technol. 2005, 37, 1507–1510. [Google Scholar]
- Chen, Y.; Zhou, Y.; Feng, W.; Fang, Y.; Feng, A. Factors that influence the quantification of the embodied carbon emission of prefabricated buildings: A systematic review, meta-analysis and the way forward. Buildings 2022, 12, 1265. [Google Scholar] [CrossRef]
- Demertzi, M.; Silvestre, J.; Garrido, M.; Correia, J.R.; Durão, V.; Proença, M. Life cycle assessment of alternative building floor rehabilitation systems. Structures 2020, 26, 237–246. [Google Scholar] [CrossRef]
- Trigaux, D.; Oosterbosch, B.; De Troyer, F.; Allacker, K. A design tool to assess the heating energy demand and the associated financial and environmental impact in neighbourhoods. Energy Build. 2017, 152, 516–523. [Google Scholar] [CrossRef]
- Nydahl, H.; Andersson, S.; Åstrand, A.P.; Olofsson, T. Extended building life cycle cost assessment with the inclusion of monetary evaluation of climate risk and opportunities. Sustain. Cities Soc. 2022, 76, 103451. [Google Scholar] [CrossRef]
- Lu, K.; Jiang, X.; Tam, V.W.Y.; Li, M.; Wang, H.; Xia, B.; Chen, Q. Development of a carbon emissions analysis framework using building information modeling and life cycle assessment for the construction of hospital projects. Sustainability 2019, 11, 6274. [Google Scholar] [CrossRef]
- Umar, T. Key factors influencing the implementation of three-dimensional printing in construction. Proc. Inst. Civ. Eng. Manag. Procure. Law 2020, 174, 104–114. [Google Scholar] [CrossRef]
- Elmousalami, H.H. Artificial intelligence and parametric construction cost estimate modeling: State-of-the-art review. J. Constr. Eng. Manag. 2020, 146, 03119008. [Google Scholar] [CrossRef]
- Zhang, P.-F.; Zhang, D.; Zhao, X.-L.; Zhao, X.; Iqbal, M.; Tuerxunmaimaiti, Y.; Zhao, Q. Natural language processing-based deep transfer learning model across diverse tabular datasets for bond strength prediction of composite bars in concrete. Comput. -Aided Civ. Infrastruct. Eng. 2025, 40, 917–939. [Google Scholar] [CrossRef]
- Zhang, P.F.; Zhao, X.L.; Zhang, D.; Iqbal, M.; Zhao, X.; Zhao, Q.; Tuerxunmaimaiti, Y.; Yu, C. Prediction of bond strength and failure mode of FRP bars embedded in UHPC or UHPSSC utilising extreme gradient boosting technique. Compos. Struct. 2024, 346, 118437. [Google Scholar] [CrossRef]
- Lu, K.; Deng, X.; Cheng, B.; Tam, V.W.Y. Commodity futures pricing of carbon policy costs in construction projects. Eng. Constr. Archit. Manag. 2025; ahead-of-print. [Google Scholar] [CrossRef]
- Nasab, T.J.; Monavari, S.M.; Jozi, S.A.; Majedi, H. Development of an environmental life cycle cost model for high-rise construction in Tehran. Int. J. Environ. Sci. Technol. 2022, 19, 9873–9882. [Google Scholar] [CrossRef]
- Ibn-Mohammed, T.; Greenough, R.; Taylor, S.; Ozawa-Meida, L.; Acquaye, A. Integrating economic considerations with operational and embodied emissions into a decision support system for the optimal ranking of building retrofit options. Build. Environ. 2014, 72, 82–101. [Google Scholar] [CrossRef]
- Schmidt, M.; Crawford, R.H.; Warren-Myers, G. Integrating life-cycle GHG emissions into a building’s economic evaluation. Build. Cities 2020, 1, 361–378. [Google Scholar] [CrossRef]
- Liu, H.; Zainul Abidin, N. A Review on Research of Prefabricated Building Costs: Exploring Collaborations, Intellectual Basis, and Research Trends. Sustainability 2024, 16, 9823. [Google Scholar] [CrossRef]


| Concept | Dimension | Application | Ref. |
|---|---|---|---|
| 3D | Geometry | Visualization | [28,29] |
| Clash detection | [30] | ||
| 4D | Time | Schedule simulation | [29,30,31] |
| Progress tracking | [32] | ||
| 5D | Cost | Quantity surveying | [17,18,19,30,31,33,34] |
| Life cycle costing | [35] | ||
| Financial decision making | [36,37] | ||
| Cost monitoring and payment | [19,32] | ||
| nD | Quality | Quality management | [38] |
| Safety | Safety management | [38,39] | |
| Energy | Energy efficiency | [40,41,42] | |
| Carbon emission | Carbon emission calculation | [31,38] |
| Coding | Name | IFC Entity |
|---|---|---|
| PW | Prefabricated wall | lfcWall |
| PC | Prefabricated column | lfcColumn |
| PB | Prefabricated beam | lfcBeam |
| PS | Prefabricated slab | lfcSlab |
| PBS | Prefabricated beam-slab | IfcBuildingElementProxy |
| PF | Prefabricated foundation | IfcFooting |
| Coding | Name | Meaning |
|---|---|---|
| MP | Material production | Extracting raw materials from nature and processing them into building materials. |
| MT | Material transportation | Transporting materials from the production site to the manufacturing factory. |
| CM | Component manufacturing | Processing materials into prefabricated components in the manufacturing factory. |
| CT | Component transportation | Transporting components from the manufacturing factory to the construction site. |
| OA | On-site assembly | Assembling and constructing components at the construction site. |
| Coding | Name | Characteristics | Unit |
|---|---|---|---|
| Partial precast concrete components in the main structure are designed as cast-in-place. | |||
| SE46 | Rectangular column | 1. Concrete strength grade; 2. Concrete type; 3. Transportation distance | m3 |
| SE47 | Structural bracket | m3 | |
| SE48 | Rectangular beam | m3 | |
| SE49 | Lintel beam | 1. Concrete strength grade; 2. Concrete type; 3. Production or purchase; 4. Transportation distance | m3 |
| SE50 | Crane beam | m3 | |
| SE51 | Thin-web beam | m3 | |
| SE52 | Light-aggregate concrete wall panel | m3 | |
| SE53 | Slab | 1. Concrete strength grade; 2. Concrete type; 3. Slab form; 4. Production or purchase; 5. Transportation distance | m3 |
| SE54 | Trench cover slab | 1. Concrete strength grade; 2. Concrete type; 3. Transportation distance | m3 |
| SE55 | Angle steel framed concrete cover slab | m3 | |
| SE56 | Small-sized component | 1. Component name; 2. Concrete strength grade; 3. Concrete type; 4. Transportation distance | m3 |
| SE57 | Prestressed concrete slab | 1. Concrete strength grade; 2. Concrete type; 3. Slab form; 4. Transportation distance | m3 |
| SE58 | Prestressed concrete crane beam | 1. Concrete strength grade; 2. Concrete type; 3. Transportation distance | m3 |
| Precast concrete components in the main structure are designed as monolithic prefabricated units | |||
| SE59 | Precast concrete foundation | 1. Component name; 2. Concrete strength grade | m3 |
| SE60 | Precast concrete column | m3 | |
| SE61 | Precast concrete beam | m3 | |
| SE62 | Precast concrete slab | m3 | |
| SE63 | Precast concrete air conditioning slab | m3 | |
| SE64 | Precast concrete wall panel | m3 | |
| SE65 | Precast concrete parapet wall | m3 | |
| SE66 | Precast concrete coping | m3 | |
| SE67 | Precast concrete column cap | m3 | |
| SE68 | Precast concrete cable trench | m3 | |
| SE69 | Precast concrete water tank | m3 | |
| SE70 | Precast concrete fence panel | m3 | |
| SE71 | Precast firewall | m3 | |
| SE72 | Steel truss composite floor slab | m2 | |
| SE73 | Precast cover plate | m2 | |
| SE74 | Fiberglass grille | 1. Material | m2 |
| SE75 | Aluminum-magnesium-manganese parapet coping | m | |
| Name | Unit | CCP | PED | ADP | WRD | AP | EP | PMF | ODP | POF |
|---|---|---|---|---|---|---|---|---|---|---|
| kgCO2eq | MJ | kgSbeq | kg | kgSO2eq | kgPO43−eq | kgPM2.5eq | kgCFC-11eq | kgNMVOCeq | ||
| Electricity | kWh | 7.4 × 10⁻¹ | 1.0 × 101 | 4.7 × 10⁻⁷ | 2.8 | 3.9 × 10⁻³ | 2.5 × 10⁻⁴ | 1.2 × 10⁻³ | 3.4 × 10⁻⁹ | 3.0 × 10⁻⁴ |
| Diesel | t | 7.9 × 10² | 4.7 × 10⁴ | 1.7 × 10⁻² | 4.1 × 10³ | 3.8 | 5.8 × 10⁻¹ | 6.0 × 10⁻¹ | 4.2 × 10⁻⁴ | 3.1 |
| Water | t | 1.9 × 10⁻¹ | 2.5 | 1.8 × 10⁻⁷ | 1.0 × 10³ | 1.0 × 10⁻³ | 1.0 × 10⁻⁴ | 3.1 × 10⁻⁴ | 4.2 × 10⁻¹⁰ | 7.6 × 10⁻⁵ |
| Hot-rolled steel bar | t | 2.6 × 10³ | 3.9 × 10⁴ | 2.9 × 10⁻² | 1.8 × 10⁴ | 1.1 × 101 | 1.0 | 6.5 | 2.4 × 10⁻⁵ | 3.9 |
| Ironware | t | 2.4 × 10³ | 2.9 × 10⁴ | 4.1 × 10⁻³ | 1.2 × 10⁴ | 8.2 | 8.1 × 10⁻¹ | 7.6 | 2.0 × 10⁻⁵ | 3.2 |
| Wire rope | t | 2.3 × 10³ | 3.4 × 10⁴ | 2.8 × 10⁻² | 1.6 × 10⁴ | 9.5 | 9.2 × 10⁻¹ | 5.8 | 2.3 × 10⁻⁵ | 3.6 |
| Embedded iron part | t | 2.4 × 10³ | 2.9 × 10⁴ | 4.1 × 10⁻³ | 1.2 × 10⁴ | 8.2 | 8.1 × 10⁻¹ | 7.7 | 2.0 × 10⁻⁵ | 3.2 |
| Cement | t | 5.7 × 10⁻² | 7.9 × 10⁻¹ | 2.5 × 10⁻⁶ | 1.2 | 2.1 × 10⁻⁴ | 1.2 × 10⁻⁴ | 6.8 × 10⁻⁵ | 1.1 × 10⁻⁹ | 5.5 × 10⁻⁵ |
| Concrete C30 | m3 | 3.2 × 10² | 2.3 × 10³ | 2.3 × 10⁻⁴ | 6.7 × 10² | 8.7 × 10⁻¹ | 1.1 × 10⁻¹ | 3.2 × 10⁻¹ | 3.8 × 10⁻⁶ | 5.0 × 10⁻¹ |
| Concrete C40 | m3 | 3.6 × 10² | 2.5 × 10³ | 2.4 × 10⁻⁴ | 7.1 × 10² | 9.5 × 10⁻¹ | 1.2 × 10⁻¹ | 3.6 × 10⁻¹ | 3.8 × 10⁻⁶ | 5.6 × 10⁻¹ |
| Concrete C50 | m3 | 4.0 × 10² | 2.8 × 10³ | 2.5 × 10⁻⁴ | 7.6 × 10² | 1.0 | 1.3 × 10⁻¹ | 3.9 × 10⁻¹ | 3.8 × 10⁻⁶ | 6.2 × 10⁻¹ |
| Dry-mixed mortar | m3 | 3.2 × 10² | 2.3 × 10³ | 2.3 × 10⁻⁴ | 6.7 × 10² | 8.7 × 10⁻¹ | 1.1 × 10⁻¹ | 3.2 × 10⁻¹ | 3.8 × 10⁻⁶ | 5.0 × 10⁻¹ |
| Foamed ceramic | m3 | 6.6 × 10² | 1.4 × 10³ | 3.5 × 10⁻³ | 5.6 × 10² | 1.1 | 1.5 × 10⁻¹ | 1.9 × 10⁻¹ | 4.2 × 10⁻⁷ | 4.4 × 10⁻¹ |
| Environmental Indicator | Abbreviation | Unit | Monetary Value | Ref. |
|---|---|---|---|---|
| Climate change potential | CCP | CNY/kgCO2eq | 0.28 | [57] |
| Primary energy demand | PED | CNY/MJ | 0.00028 | [58] |
| Abiotic depletion potential | ADP | CNY/kgSbeq | 0.0191 | [59] |
| Water resource depletion | WRD | CNY/kg | 0.00139 | [57] |
| Acidification potential | AP | CNY/kgSO2eq | 1.71 | [57] |
| Eutrophication potential | EP | CNY/kgPO43−eq | 0.73 | [58] |
| Particulate matter formation | PMF | CNY/kgPM2.5eq | 0.69 | [57] |
| Ozone depletion potential | ODP | CNY/kgCFC-11eq | 16.24 | [57] |
| Photochemical ozone formation | POF | CNY/kgNMVOCeq | 8.75 | [57] |
| Item | Content |
|---|---|
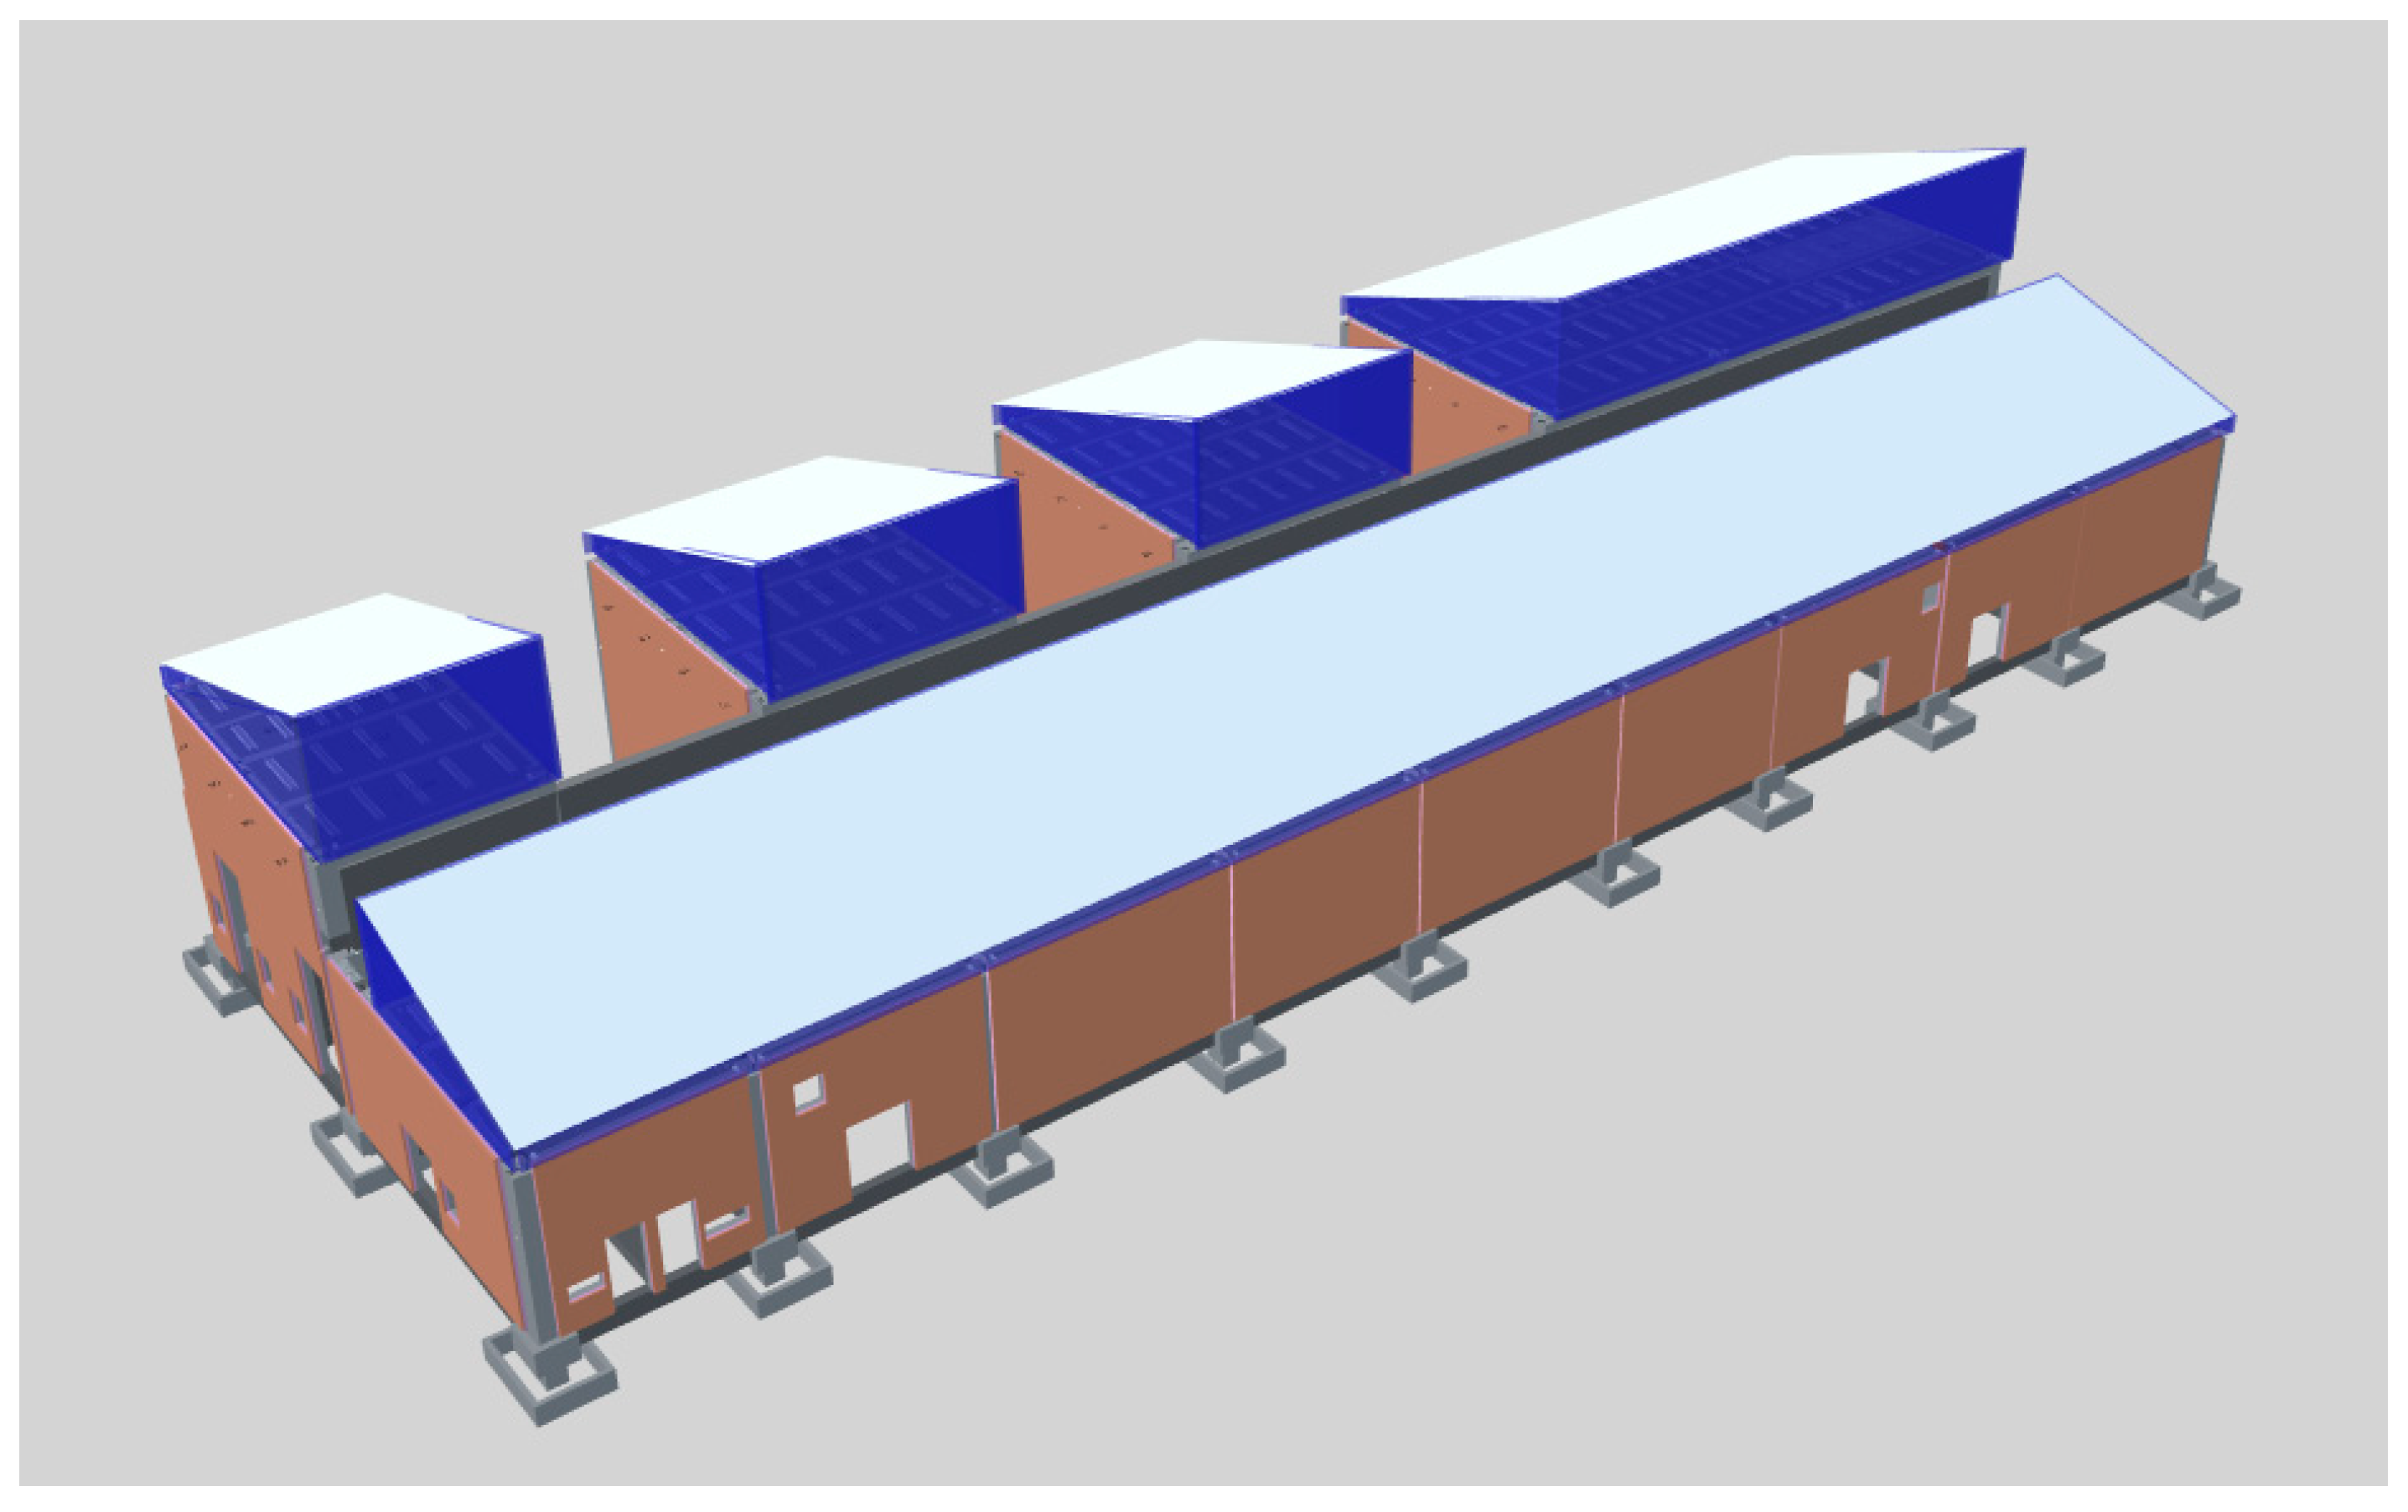
| Building type | 110 kV prefabricated substation |
| Building location | Xiamen, China |
| Construction company | State Grid Fujian Electric Power Co., Ltd. |
| Building area | 1080 m2 |
| Building floor | One floor |
| Building height | 12.55 m |
| Functional layout | 10 kV power distribution room, Main transformer room, Radiator room, 110 kV Gas Insulated Switchgear room, Secondary equipment room, Battery room, etc. |
| From concrete plant to prefabricated factory | 35 km |
| From steel plant to prefabricated factory | 30 km |
| From foam ceramic plant to prefabricated factory | 40 km |
| From prefabricated factory to construction site | 125 km |
Disclaimer/Publisher’s Note: The statements, opinions and data contained in all publications are solely those of the individual author(s) and contributor(s) and not of MDPI and/or the editor(s). MDPI and/or the editor(s) disclaim responsibility for any injury to people or property resulting from any ideas, methods, instructions or products referred to in the content. |
© 2025 by the authors. Licensee MDPI, Basel, Switzerland. This article is an open access article distributed under the terms and conditions of the Creative Commons Attribution (CC BY) license (https://creativecommons.org/licenses/by/4.0/).
Share and Cite
Gao, X.; Chen, X.; Lu, K.; Deng, X. Monetizing Environmental Impacts into Environmental Costs During Prefabricated Building Construction: A 5D BIM-Enabled Analysis. CivilEng 2025, 6, 36. https://doi.org/10.3390/civileng6030036
Gao X, Chen X, Lu K, Deng X. Monetizing Environmental Impacts into Environmental Costs During Prefabricated Building Construction: A 5D BIM-Enabled Analysis. CivilEng. 2025; 6(3):36. https://doi.org/10.3390/civileng6030036
Chicago/Turabian StyleGao, Xian, Xilong Chen, Kun Lu, and Xueyuan Deng. 2025. "Monetizing Environmental Impacts into Environmental Costs During Prefabricated Building Construction: A 5D BIM-Enabled Analysis" CivilEng 6, no. 3: 36. https://doi.org/10.3390/civileng6030036
APA StyleGao, X., Chen, X., Lu, K., & Deng, X. (2025). Monetizing Environmental Impacts into Environmental Costs During Prefabricated Building Construction: A 5D BIM-Enabled Analysis. CivilEng, 6(3), 36. https://doi.org/10.3390/civileng6030036