Article

Evaluating Water Infiltration and Runoff: Stretcher Bond vs. 45° Herringbone Patterns in Permeable Interlocking Concrete Pavements

by
Mohammed Al-Fatlawi
1,
Fatima Muslim Hadi
1,
Baneen M. H. Al-khafaji
1,
Sally Selan Hussein
1,
Tamar Maitham Al-Asedi
1,
Maryam M. Al-Aarajy
1,
Ashraf Anwar Al-Khazraji
1,
Tameem Mohammed Hashim
1,
Ali Shubbar
2,*,
Mohammed Salah Nasr
3 and
Thair J. Alfatlawi
4
1
Building and Construction Techniques Engineering Department, College of Engineering and Engineering Techniques, Al-Mustaqbal University, Babylon 51001, Iraq
2
School of Civil Engineering and Built Environment, Liverpool John Moores University, Liverpool L3 5UX, UK
3
Department of Architecture Engineering, College of Engineering, University of Babylon, Babylon 51002, Iraq
4
Department of Civil Engineering, College of Engineering, University of Babylon, Hillah 51001, Iraq
*
Author to whom correspondence should be addressed.
CivilEng 2025, 6(2), 24; https://doi.org/10.3390/civileng6020024
Submission received: 29 January 2025 / Revised: 7 April 2025 / Accepted: 3 May 2025 / Published: 6 May 2025

Abstract

:
Pavement deterioration is often the result of intense traffic and increased runoff from storms, floods, or other environmental factors. A practical solution to this challenge involves the use of permeable pavements, such as permeable interlocking concrete pavement (PICP), which are designed to effectively manage water runoff while supporting heavy traffic. This research investigates the effectiveness of PICP in two distinct surface patterns: stretcher bond and 45° herringbone, by assessing their performance in terms of water infiltration and runoff using two different methods. The first approach has been conducted experimentally using a laboratory apparatus designed to simulate rainfall. Various conditions were applied during the performance tests, including longitudinal (L-Slope) and transverse (T-Slope) slopes of (0, 2, and 4%) and rainfall intensities of (40 and 80 L/min). The second approach has been implemented theoretically using Surfer 2.0 software to simulate the distribution of infiltrated water underneath the layers of PICP. Moreover, the behavior of PICP has been analyzed statistically using artificial neural networks (ANNs). The results indicated that at a rainfall intensity of 40 L/min, equal infiltration was observed in both patterns on 0% and 4% T-Slope. However, the 45° herringbone PICP showed better infiltration on the 8% T-Slope. Additionally, at 80 L/min rainfall, equal infiltration was observed in both patterns on 0% L-Slope for 0% and 4% T-Slope. The 45° herringbone PICP also demonstrated higher water infiltration on the 8% T-Slope, and this trend continued as the L-Slope increased. PICP with a 45° herringbone surface pattern exhibited superiority in reducing runoff compared to the stretcher bond pattern. The statistical models for the stretcher bond and 45° herringbone patterns demonstrate high accuracy, as evidenced by their correlation coefficient (R2) values of 99.97% and 97.32%, respectively, which confirms their validity. Despite the variations between the two forms of PICP, both are strongly endorsed as excellent alternatives to conventional pavement.

1. Introduction

1.1. Research Background

Permeable interlocking concrete pavement (PICP) is built from solid concrete paving blocks with joints. Water may readily permeate the surface through permeable particles between the joints in flow rates up to 1000 in./h (2540 cm/h) [1]. The structure of PICP consists of paving units that lie on a permeable aggregate bedding layer, which in turn sits on an open-graded aggregate base and subbase. The base and subbase layers hold water, which permeates the subgrade soil temporarily [2]. Perforated underdrains are attached to base or subbase layers with the main duty to eliminate water that does not penetrate within 48 to 72 h. In automotive applications, concrete curbs are employed to hold pavers, bedding, and base layers in place [3].
Paving blocks used in a permeable interlocking concrete pavement (PICP) system are normally made of impervious material, such as concrete, usually (8–10 cm) in thickness, which aids with suitable permeable joints filled with an appropriate pea-sized (2–6 mm) aggregate (AASHTO No. 8, or 9), whereas surface water may permeate the pavement structure via these joints [4]. Below the paving surface lies the bedding layer, constructed from open-graded, small-sized aggregate (AASHTO No. 8), (4–5 cm) in thickness [4]. Controversially, a geotextile may isolate the bedding layer from the lower strata. A base and subbase layer of open-graded (12.5–63 mm) aggregate (AASHTO No. 57 over No. 2, 3, or 4) is placed under the bedding layer [5]. The base layer must be at least 10 cm thick, while the thickness of the subbase is determined by the hydraulic and structural design, although it must be at least 20 cm [6]. Using PICP has many benefits that are summarized in Figure 1.
Although the previous benefits of using the PICP are considerable, some limitations have been recorded as follows:
  • Needs to be swept with a vacuum regularly
  • Effective soil stabilization and erosion control measures are necessary to avoid clogging.
Regular vacuuming is necessary to maintain its permeability by preventing clogging from sediment and debris. Although maintenance (such as vacuuming) is needed for optimal performance, the long-term environmental and infrastructural benefits often outweigh this requirement [7]. In addition, effective soil stabilization and erosion control measures are crucial to preventing sediment infiltration and clogging of PICP, which can be implemented using different key strategies, including (proper site grading, vegetative buffers, geotextile layers, stabilized perimeter areas, and regular maintenance) [8].
PICP is considered the most effective permeable pavement compared to porous asphalt and pervious concrete [9]. Porous asphalt, made of open-graded coarse aggregate bound by bitumen, allows water to pass through large, interconnected voids [9]. Pervious concrete, formed from cement, water, coarse aggregate, and minimal fine aggregate, has high porosity that permits water infiltration to underlying layers [10]. Figure 2 shows the surface patterns of these three common permeable pavement types.
In this study, the adopted surface patterns of PICP are stretcher bond and 45° herringbone, as shown below in Figure 3.

1.2. Literature Review

Using a rainfall simulator test, Park DG. et al. [11] assessed PICP’s ability to infiltrate water, observing surface runoff, delay time, and outflows during rain events under 2 h. Similarly, the current study employed a rainfall simulator to measure infiltrating water and runoff across different slopes and rainfall intensities, enhancing the earlier work with new boundary conditions and service testing. Whilst, Nichols PW. et al. [12] examined the efficacy of two PICP surface infiltration rate measurement techniques in order to reduce some of the practical issues connected with the current approaches, such as higher infiltration rates owing to unreasonable pressure heads.
In their investigation on measuring water infiltration via permeable pavers, Smith D. et al. [13] proposed using optional graded containers to measure water volume and mass, eliminating the need for an on-site scale. Building on this, the current research introduces a more efficient method to quantify infiltrating water. Moreover, David R. Smith et al. [14] offered a succinct summary of the evolution of the ASTM C1701-compliant test designed to evaluate surface infiltration in permeable pavements. David emphasized that the infiltration rates of permeable pavements can decline, particularly if the surfaces are not regularly maintained and cleared of debris through vacuum sweeping. In addition, using a specialized flume, Leipard AR. et al. [2] developed a novel hydraulic construction method for permeable interlocking concrete pavement, using a layered hydraulic flume to simulate surface runoff, infiltration, and flow rates under varying conditions like block spacing, surface patterns, and slopes. The current research advances this by incorporating a specialized rainfall simulator and new techniques to enhance the prior work.
Many earlier studies have leveraged specialized mapping tools, such as ArcGIS, GRASS GIS, Equator, and Surfer, to simulate infiltrated water distribution beneath pavement layers. In this research, Surfer 2.0 was employed to convert the X and Y coordinates of a pavement sample within the simulator into an evenly spaced grid for enhanced analysis.
Various sorts of maps, such as contour, color relief, and 2D and 3D surface maps, may be generated using the grid [15]. With a wide range of gridding and mapping options, it is possible to create a map that accurately reflects the current data of this study.

1.3. Research Novelty

This study highlights its novelty by comparing the water infiltration and surface runoff of stretcher-bonded and 45° herringbone-patterned PICP with 10 mm block spacings, at various geometric surface slopes in both longitudinal and transverse directions, under different rainfall intensities. Additionally, the distribution of water beneath the PICP layers was modeled using Surfer 2.0 software, and the behavior of the two types of PICP was statistically analyzed using artificial neural networks (ANNs). Our study’s results can help identify the most environmentally friendly design for PICP, making it a viable alternative to traditional asphalt pavements in public spaces where durability, minimal maintenance, and high performance are crucial considerations.

1.4. Research Objectives

The main objective of this study is to investigate the impact of stretcher-bonded and 45° herringbone-patterned PICP on reducing surface runoff by altering the longitudinal and transverse slopes of the surface at 0%, 4%, and 8%. This was accomplished using a custom-made rainfall simulator, which was capable of generating rainfall at intensities of 40 and 80 L/min. Furthermore, the water distribution beneath the PICP layers was modeled using Surfer 2.0 software, and the statistical behavior of the two types of PICP was analyzed using artificial neural networks (ANNs).

1.5. Research Motivation

This study is motivated by the need to examine how stretcher bond and 45° herringbone PICP patterns influence runoff reduction under varying slopes and rainfall intensities. Using a custom rainfall simulator, it aims to contribute to improved stormwater management strategies in urban environments.

2. Experimental Work

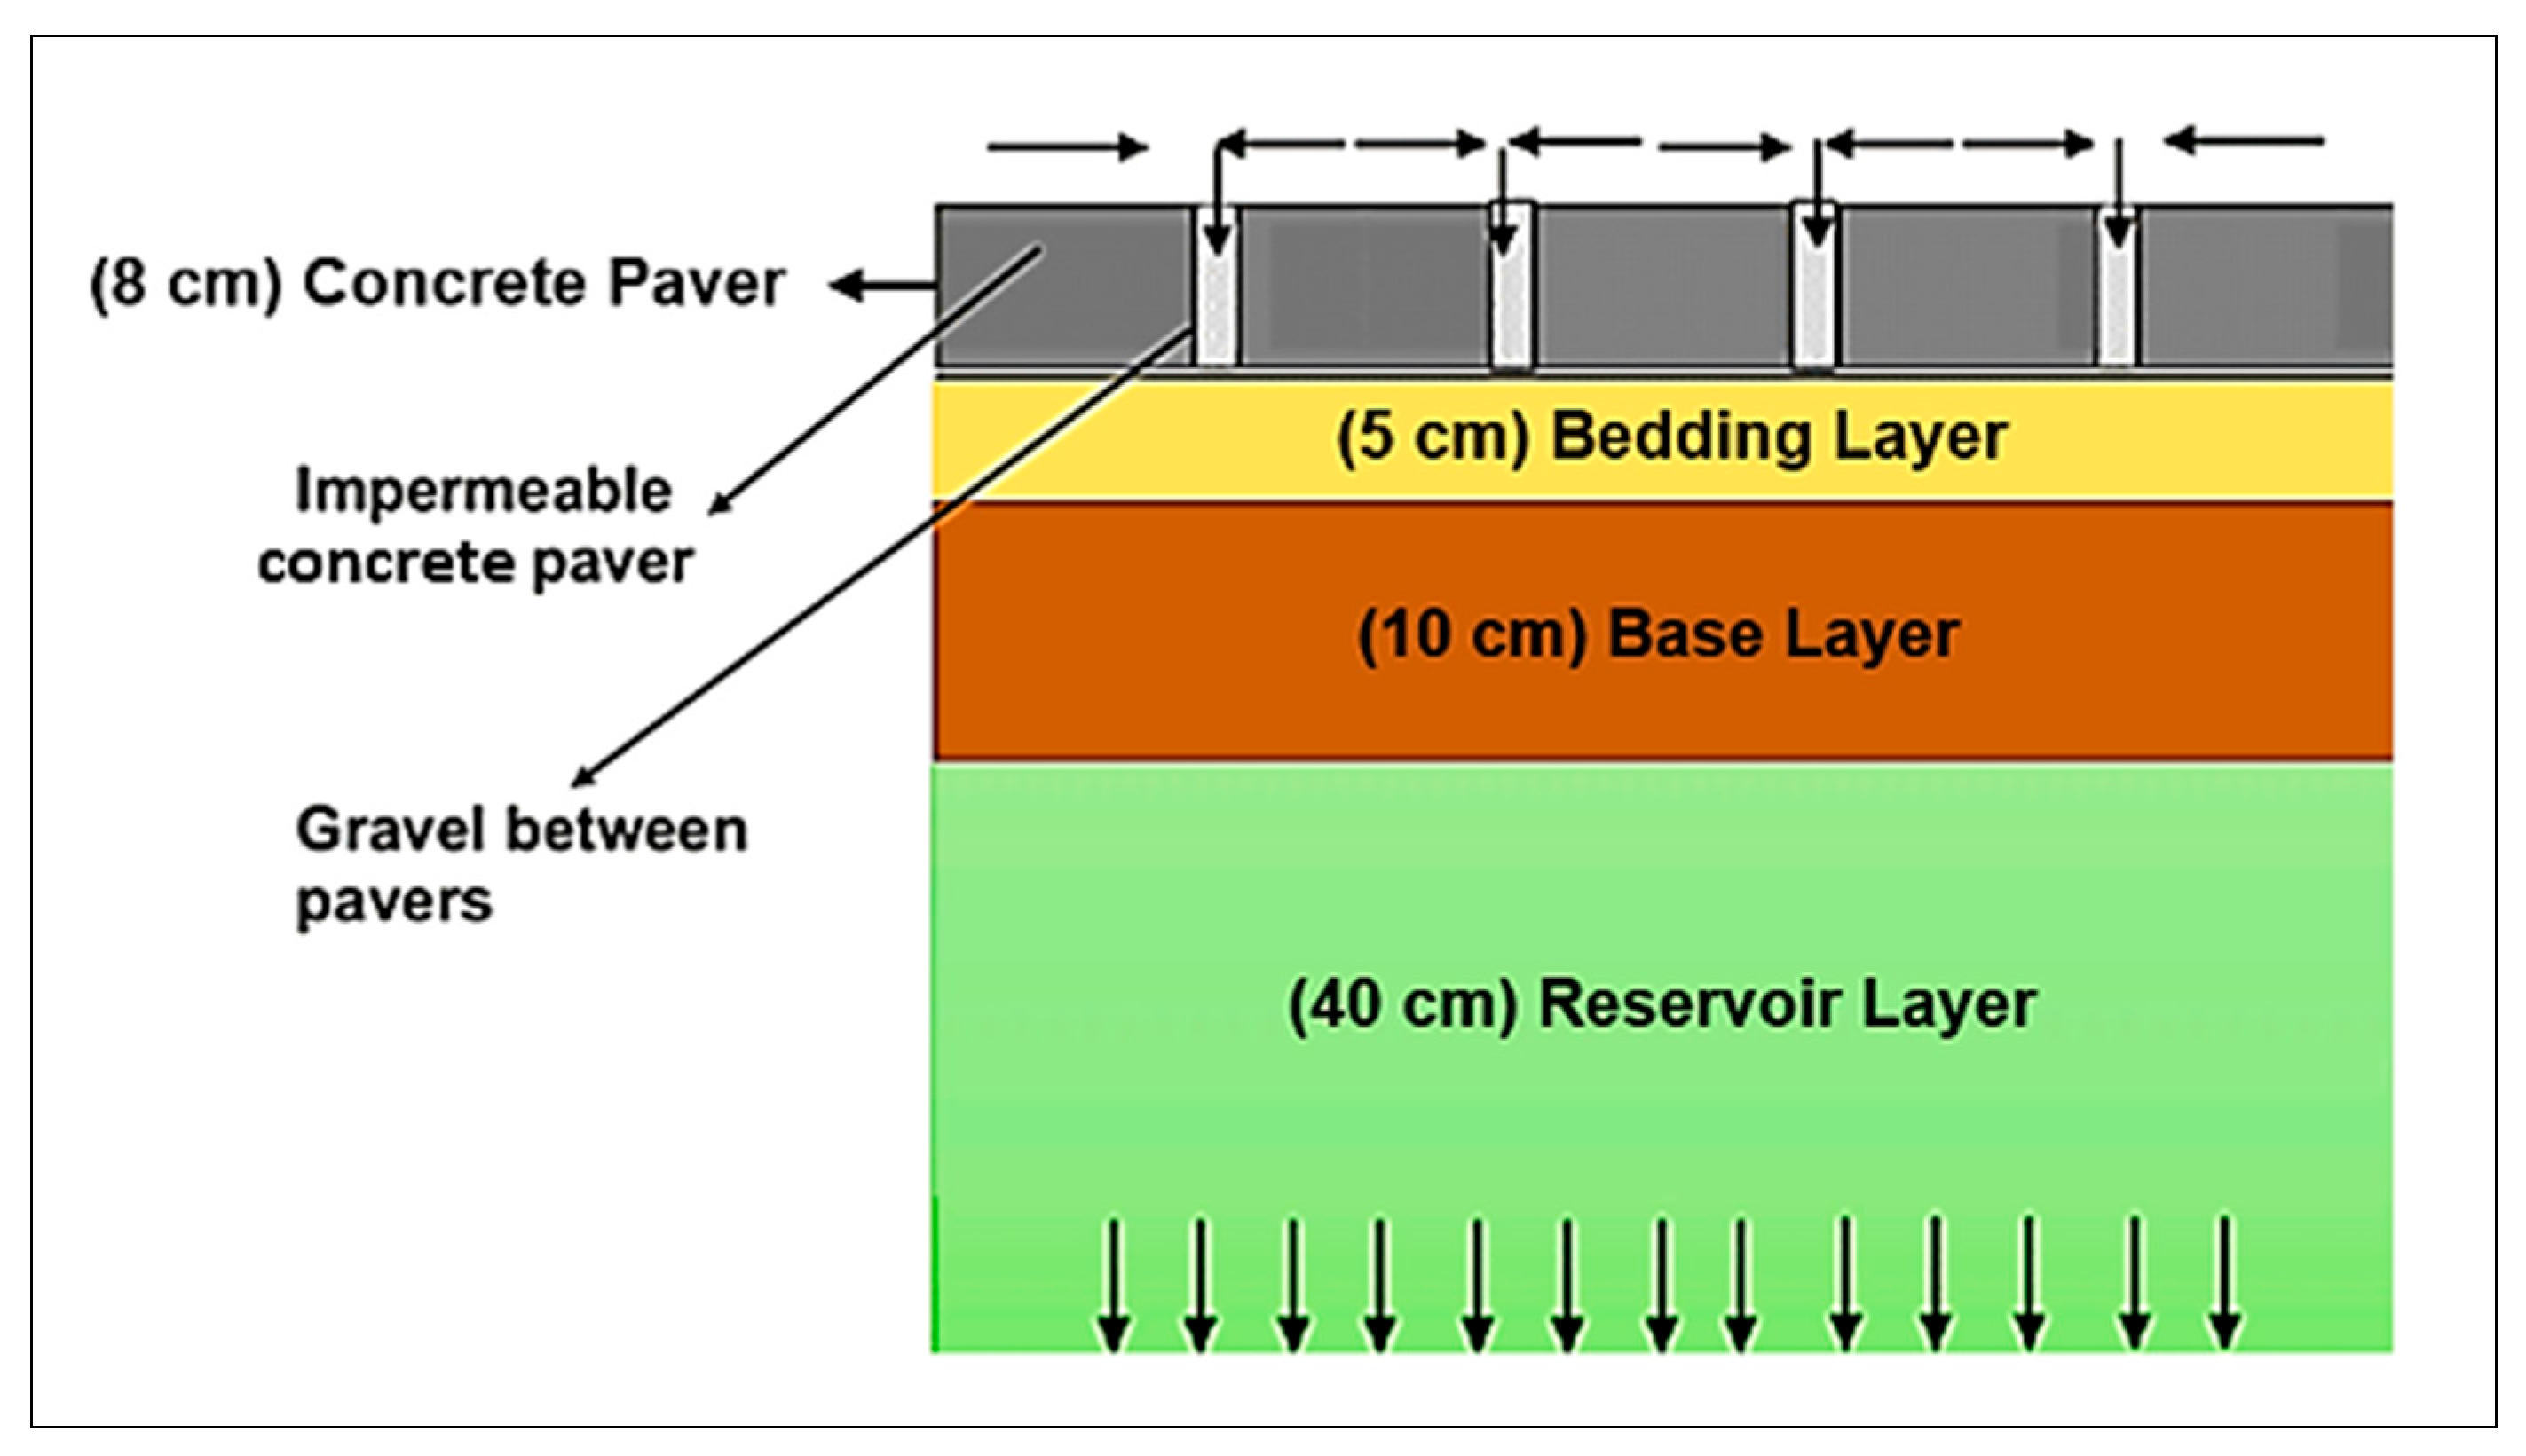
2.1. Designing the Principal PICP Cross-Sections

Designing permeable interlocking concrete pavement encompasses several key factors: the pavement’s permeability to allow water flow, the underlying layers’ ability to store water, the rate at which water infiltrates the pavement, and the system for directing water away from the pavement surface. The pavement surface allows water to permeate by using pavers with open joints, enabling water to pass through to the layers beneath [5]. The underlying layers achieve storage capacity through the use of an open-graded aggregate or gravel base. Factors like joint size and spacing, along with the porosity of the pavers and base layer, affect the rate at which water infiltrates. A drainage system, often comprising a drainage layer or a network of pipes, is employed to collect and channel water away from the pavement surface [6]. Three primary cross-sectional patterns need to be considered, as shown below in Figure 4.
The condition of the subgrade soil plays a crucial role in selecting a pavement type that provides adequate structural support for vehicular traffic while ensuring efficient water management [16]. Permeable interlocking concrete pavers (PICP) are commonly installed on various types of subgrades, not just limited to granular ones [14]. The hydraulic design employed in this research for the PICP layers is based on full water infiltration. PICP can function in subzero temperatures but may be impacted by freezing water, causing frost heave or clogging. With proper drainage and freeze-thaw durability, it can operate in temperatures as low as −20 °C to −40 °C [16]. Generally, the average annual temperature in Iraq is approximately 25–32 °C; therefore, the adopted design will perform perfectly regardless of the effect of the freeze-thaw process.

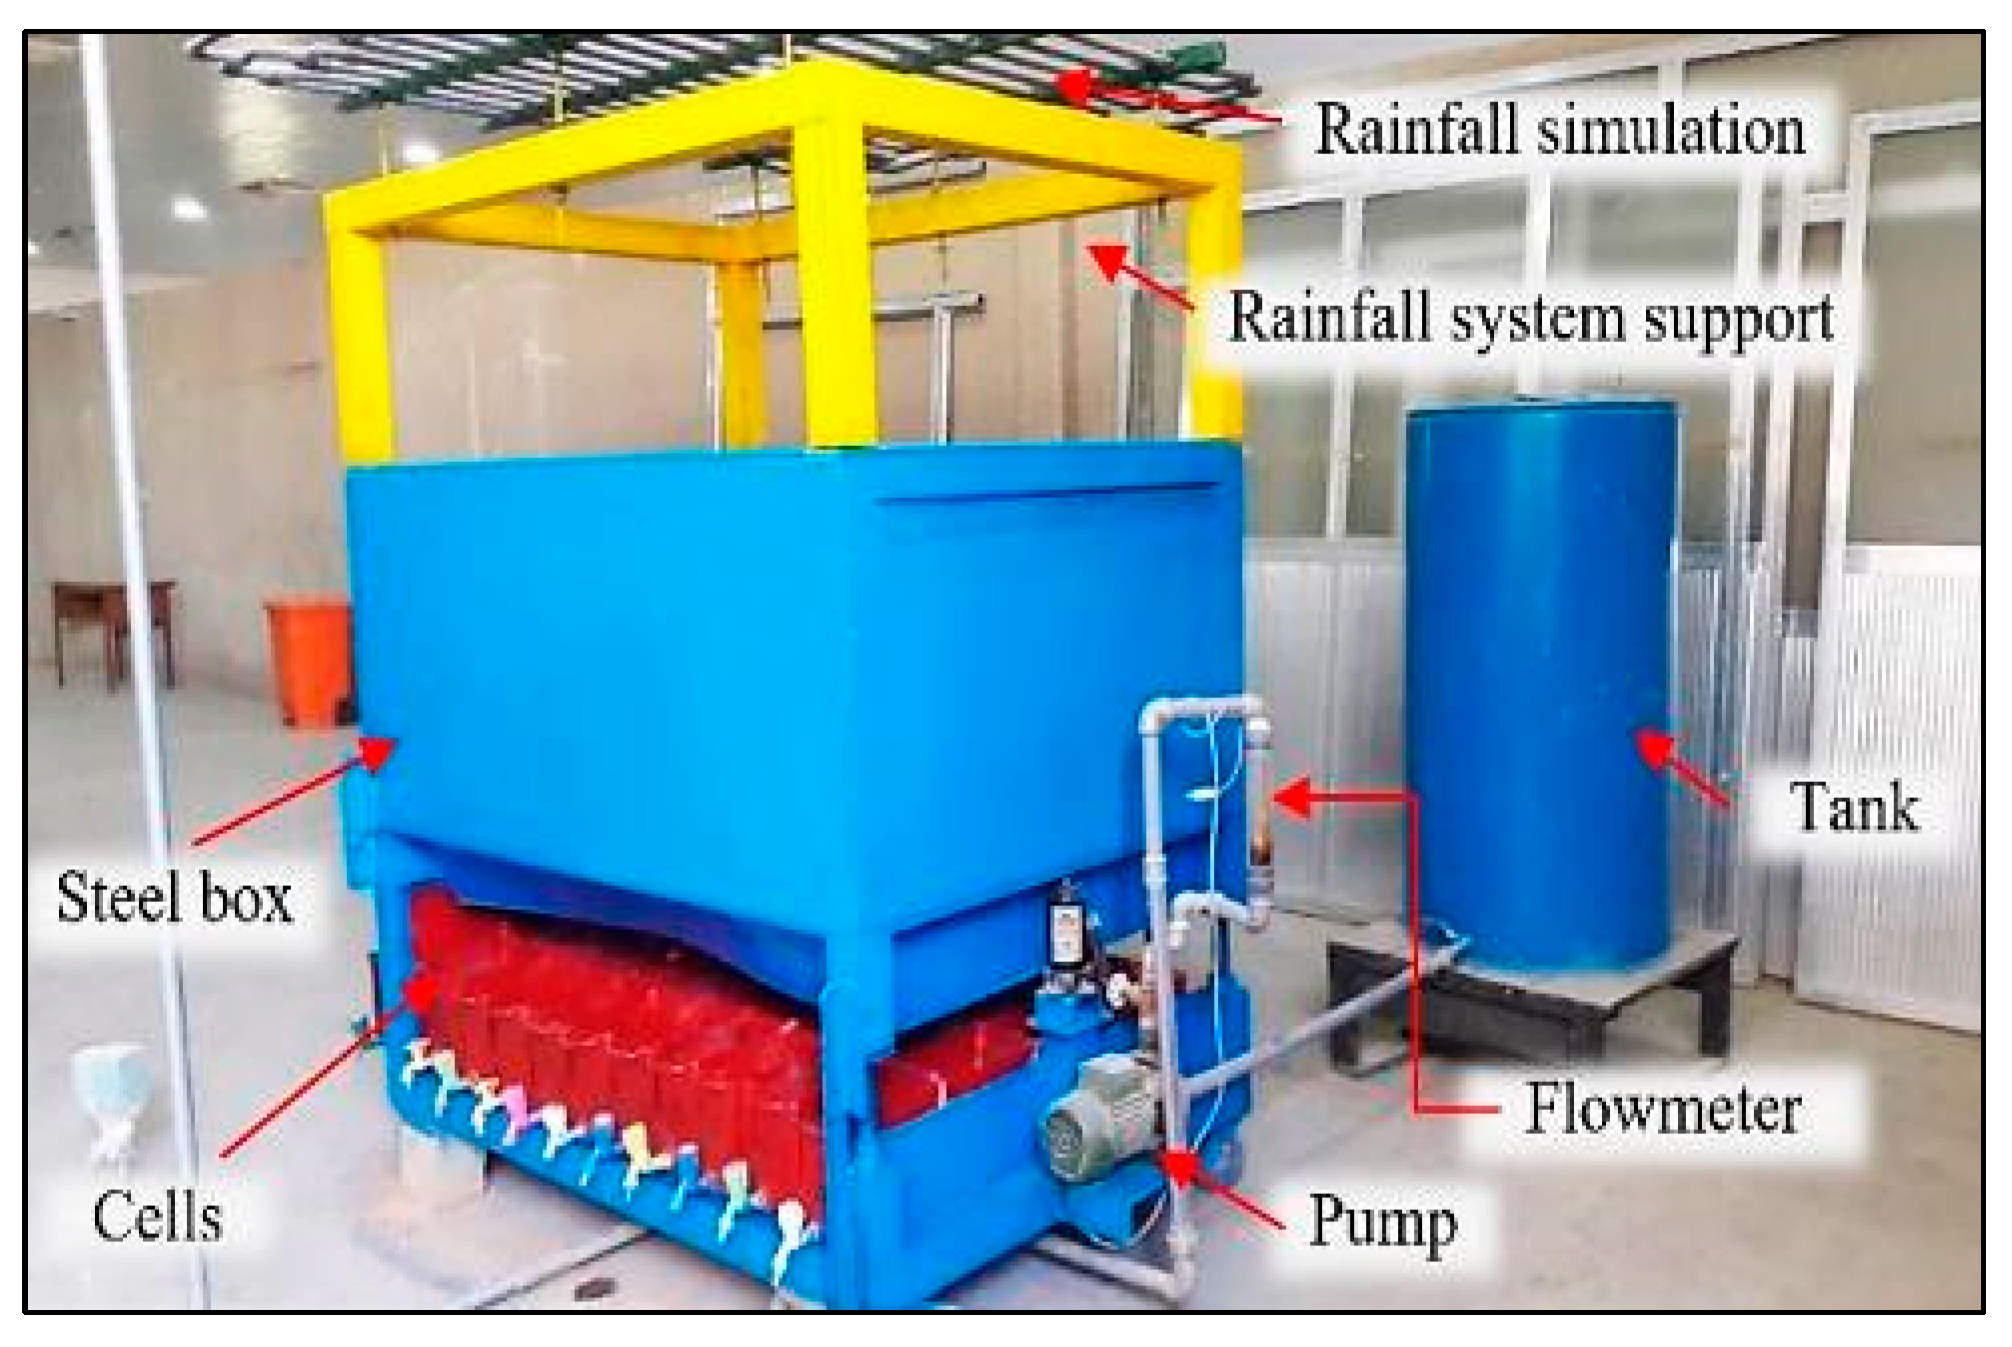
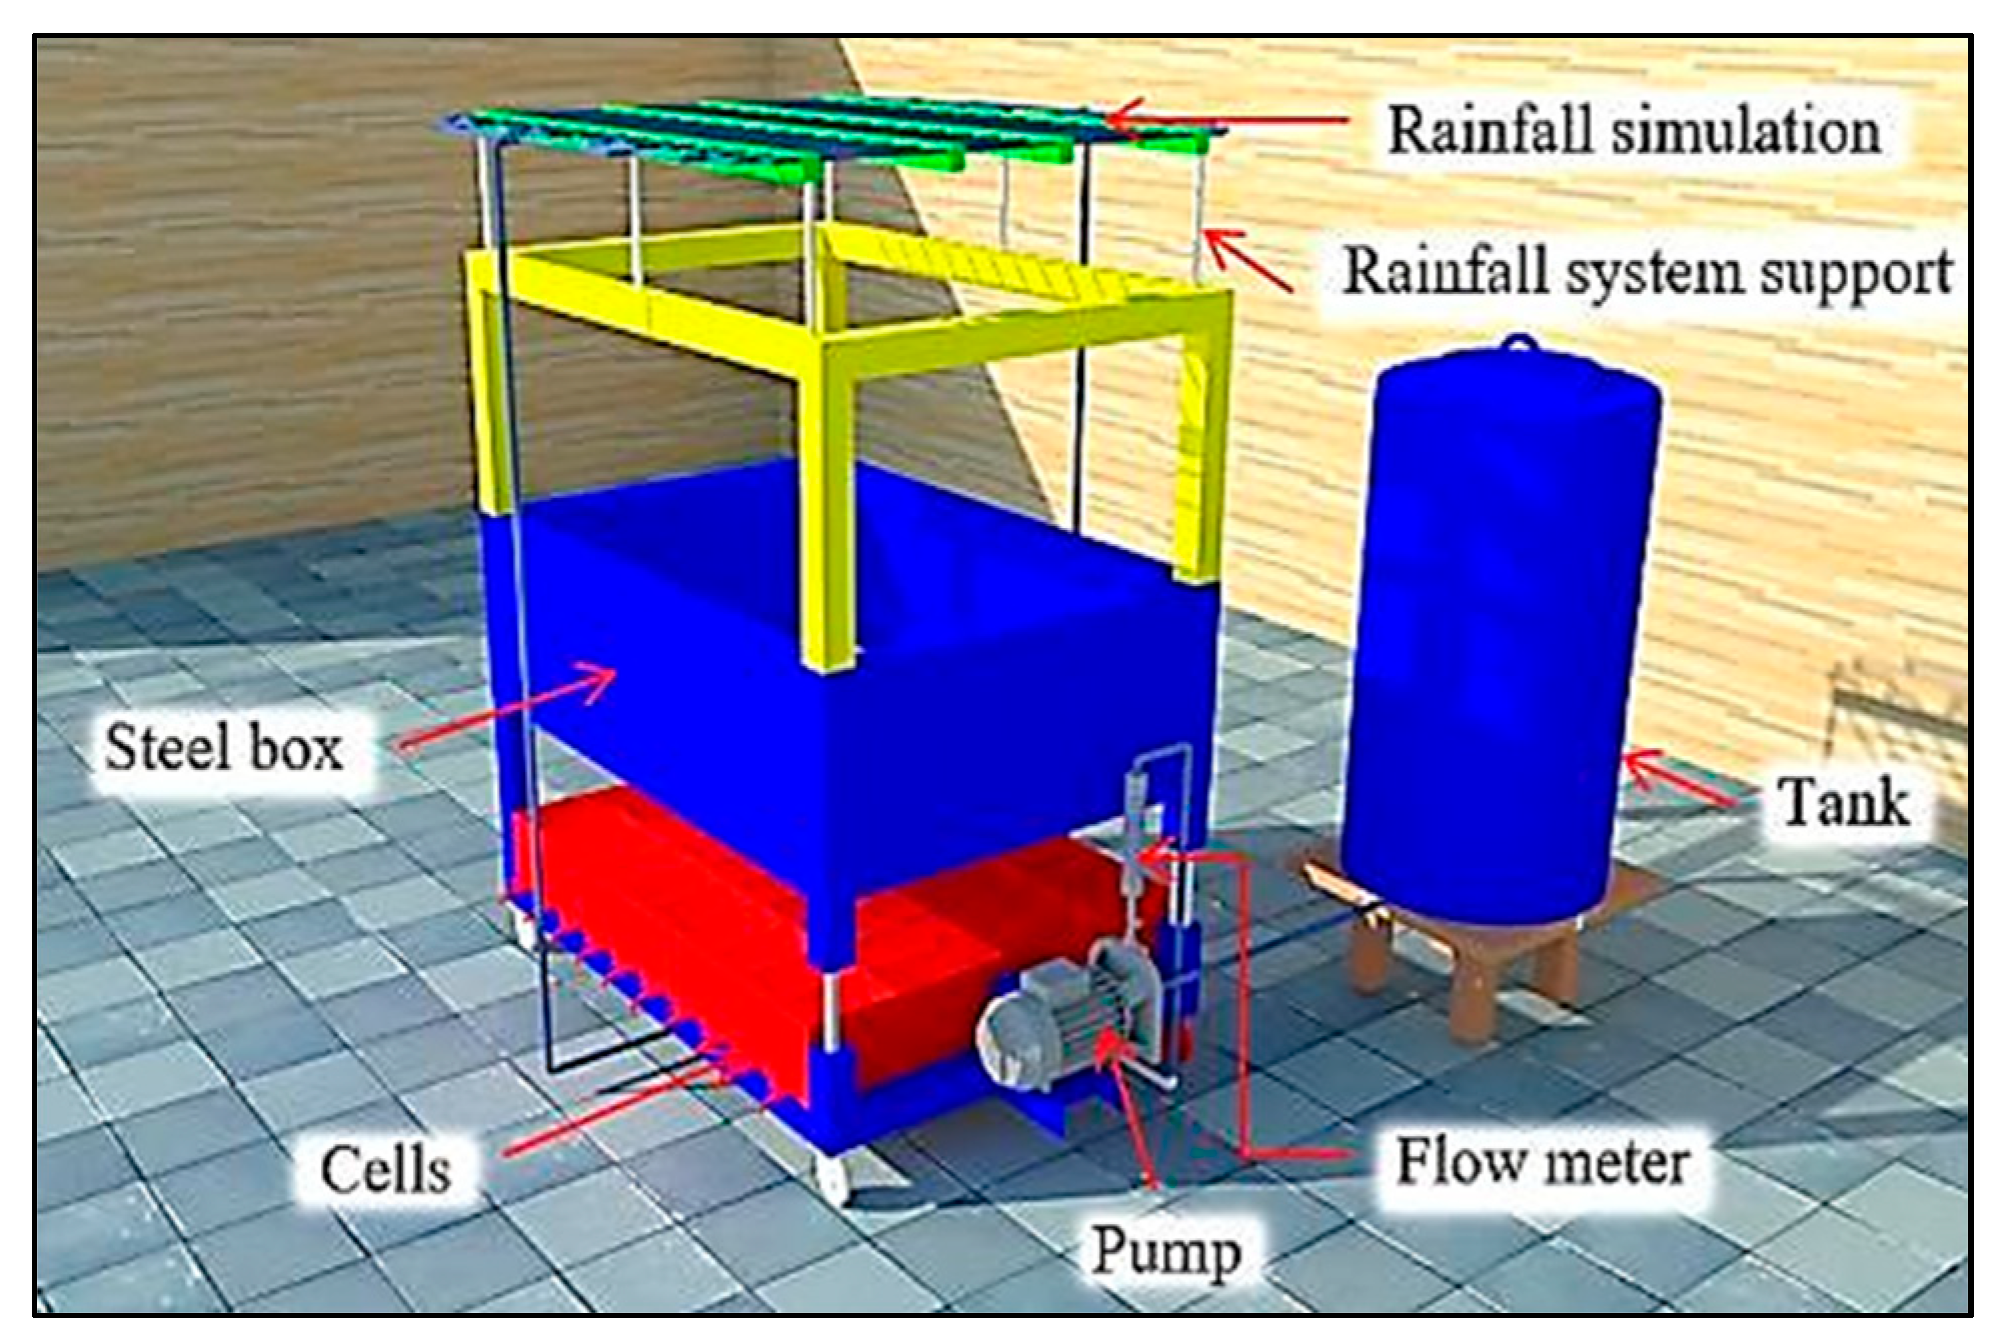
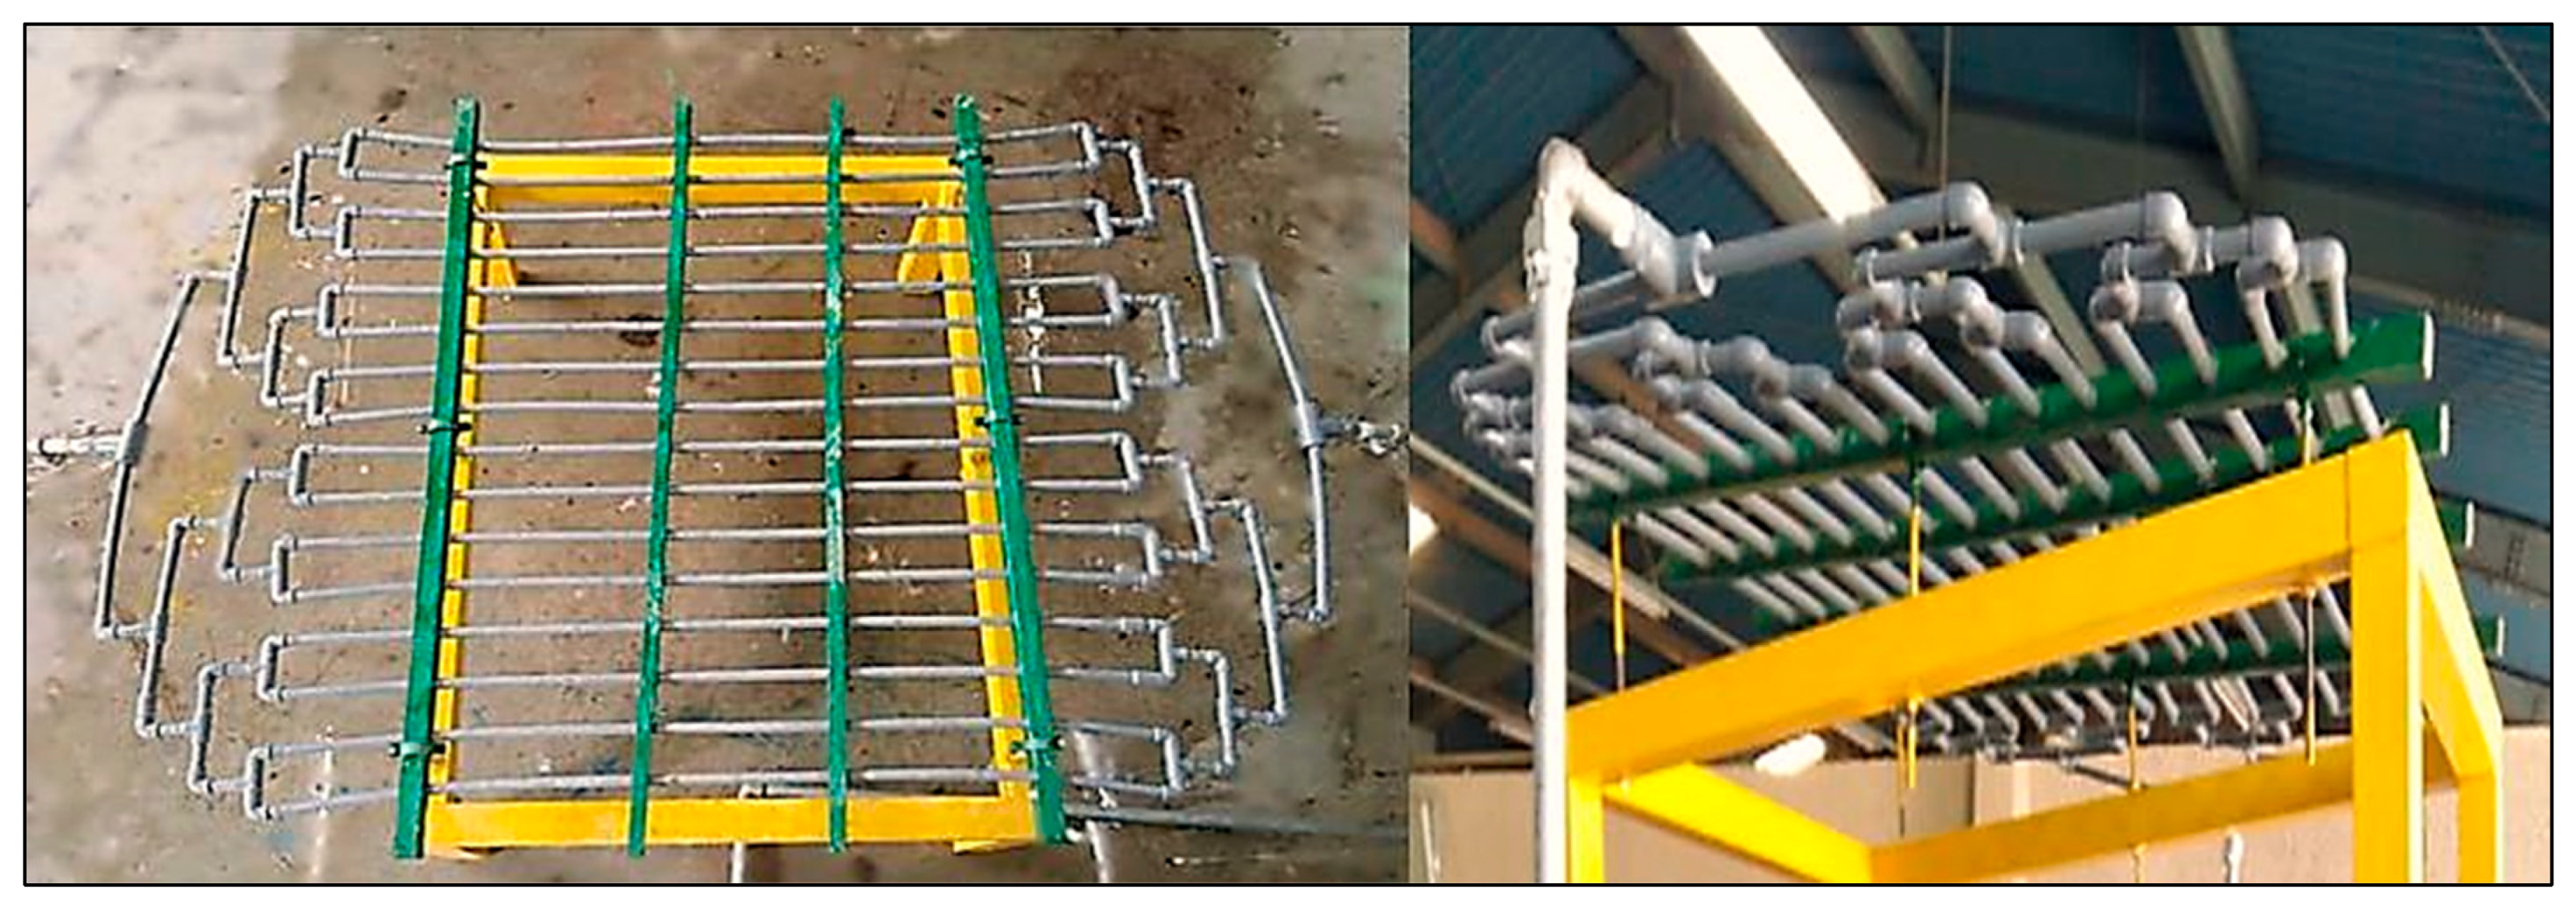
2.2. Constructing the Rainfall Simulator

As shown below in Figure 5 and Figure 6, the fabricated device is designed to function as a rainfall and permeable interlocking concrete pavement (PICP) simulator. Basically, it is composed of specific parts as shown below. Previous studies by Yusuf KO. et al. [17], Mendes TA. et al. [18], Alzamly SA. et al. [19], and Mhaske SN. et al. [20], were used to conduct the dimensions and activation period for the simulator.
First Part
The container is made of steel with precise dimensions (65 cm in height, 1.5 m in length, and 1.0 m in width) for holding PICP layers as in Figure 5 and Figure 6.
Second Part
The rain-dropping system consists of sixteen parallel PVC pipes with a constant distance of 9.75 cm between them. Each pipe is a half inch in diameter and has two-millimeter-wide holes spaced 11 cm apart, as in Figure 7.
Third Part
The rain simulator receives its supply of water from a steel tank fitted with an impeller pump capable of delivering up to 130 L per minute, as shown in Figure 8 and Figure 9.
Fourth Part
50 cm down in the vertical direction from the iron box is a mesh of 40 steel containers or cells (20 cm high, 25 cm long, 15 cm wide). These cells’ function is to accumulate PICP-layer permeate water, as shown in Figure 10.
Fifth Part
Towards the base of the manufactured simulator, a steel container (20 cm high, 100 cm long, and 15 cm wide) is placed to collect the leaking water of runoff, as shown in Figure 11.

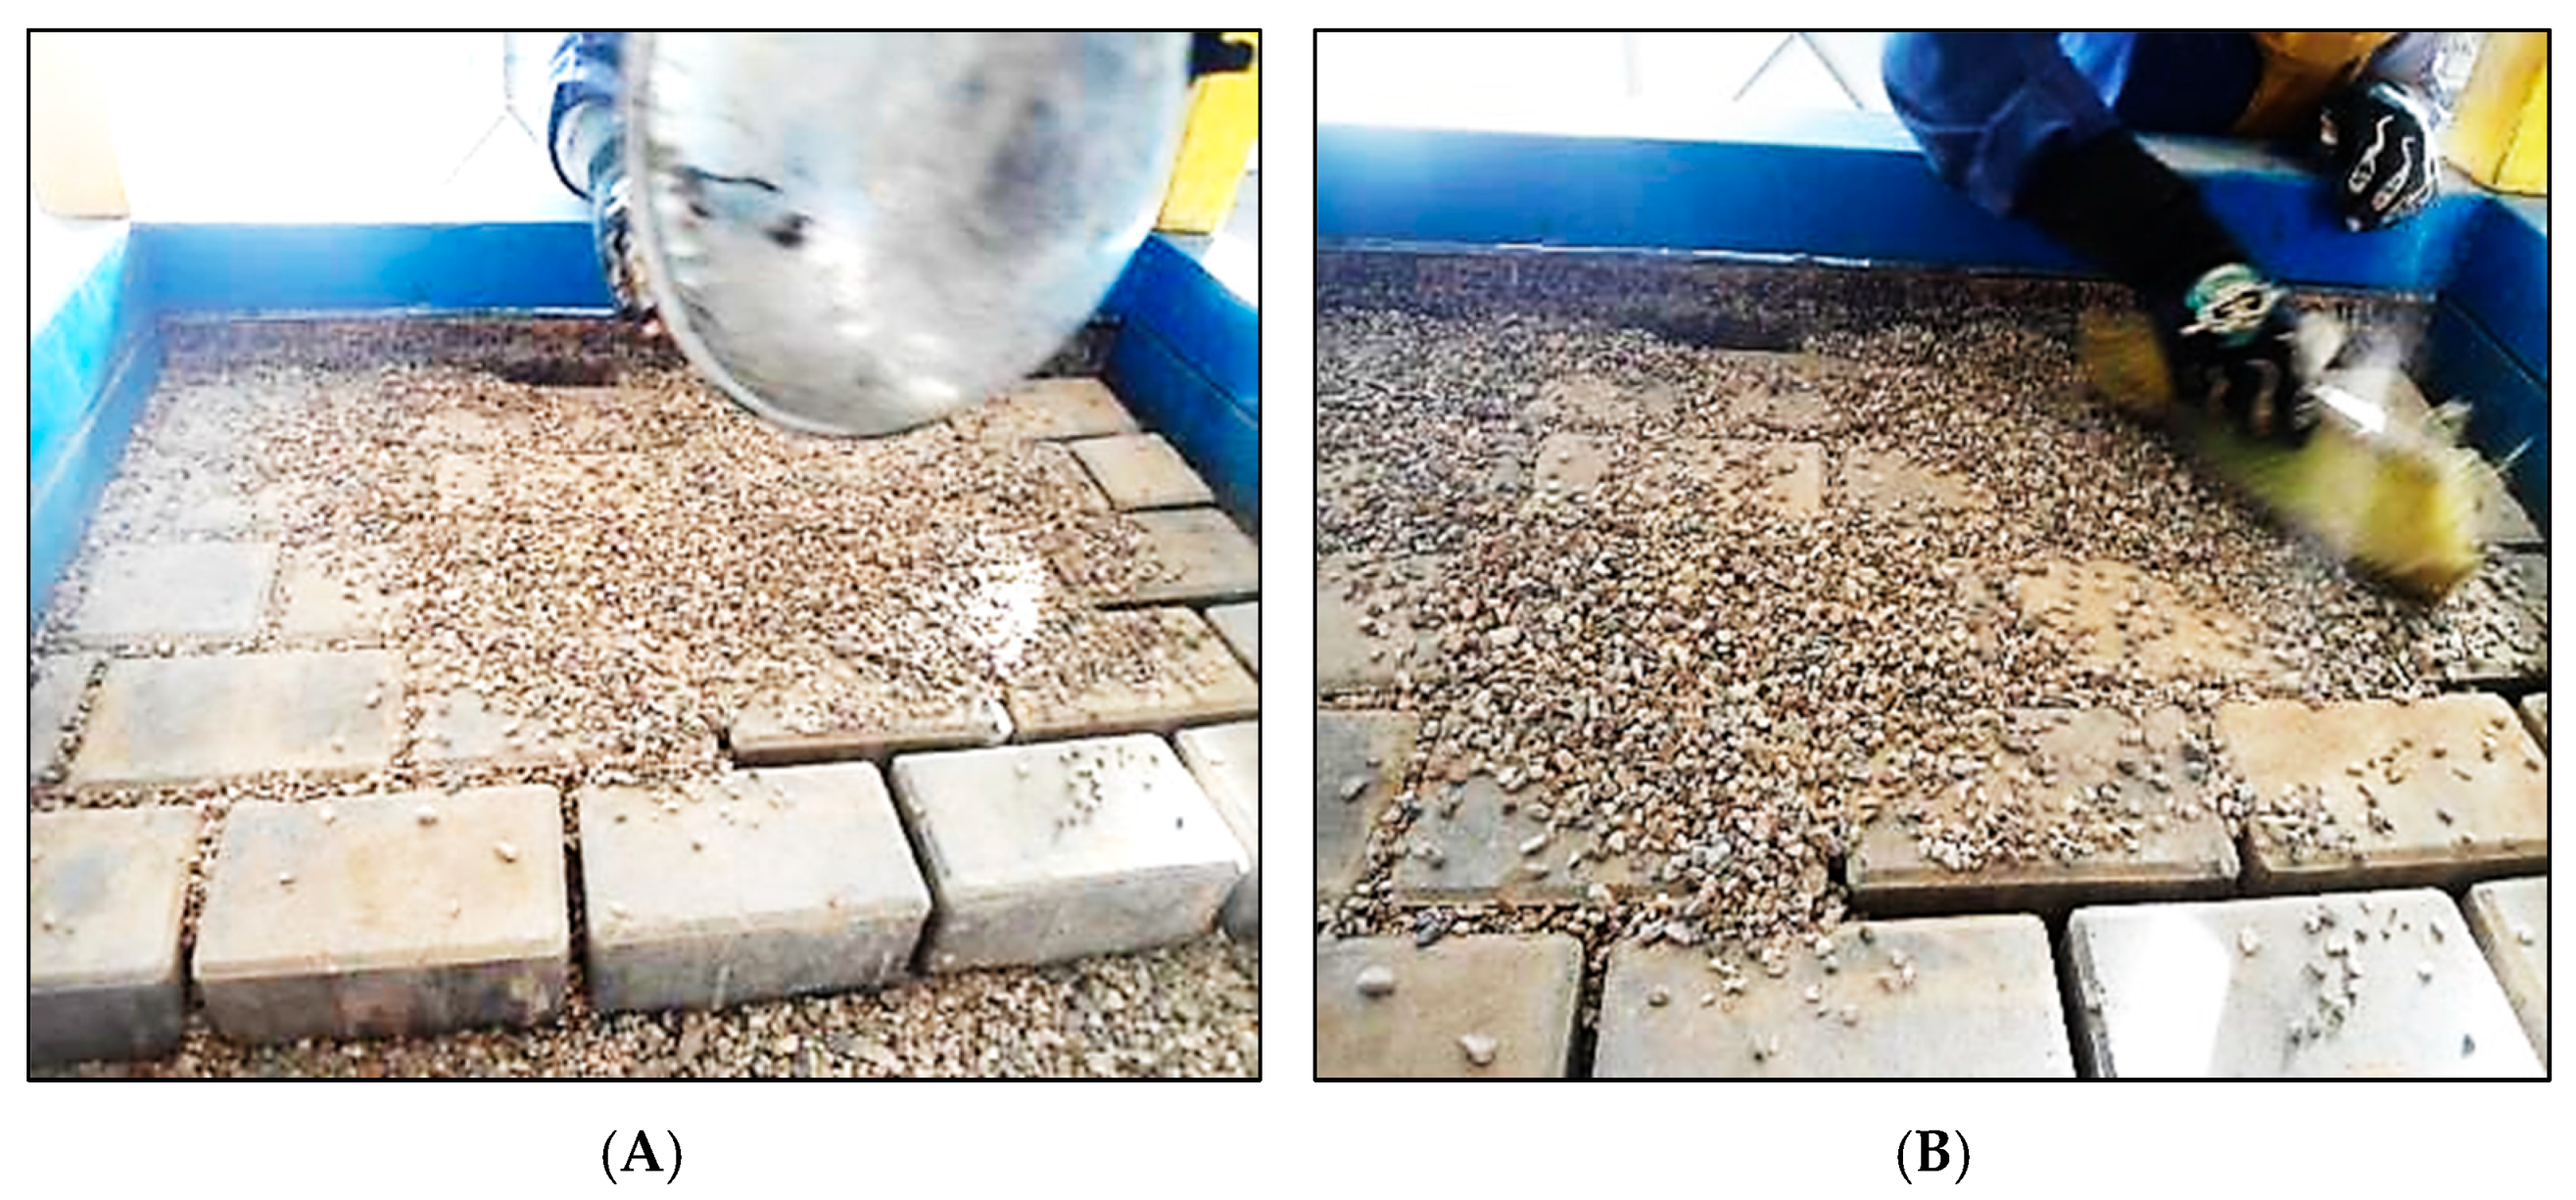
2.3. Constructing the PICP Layers

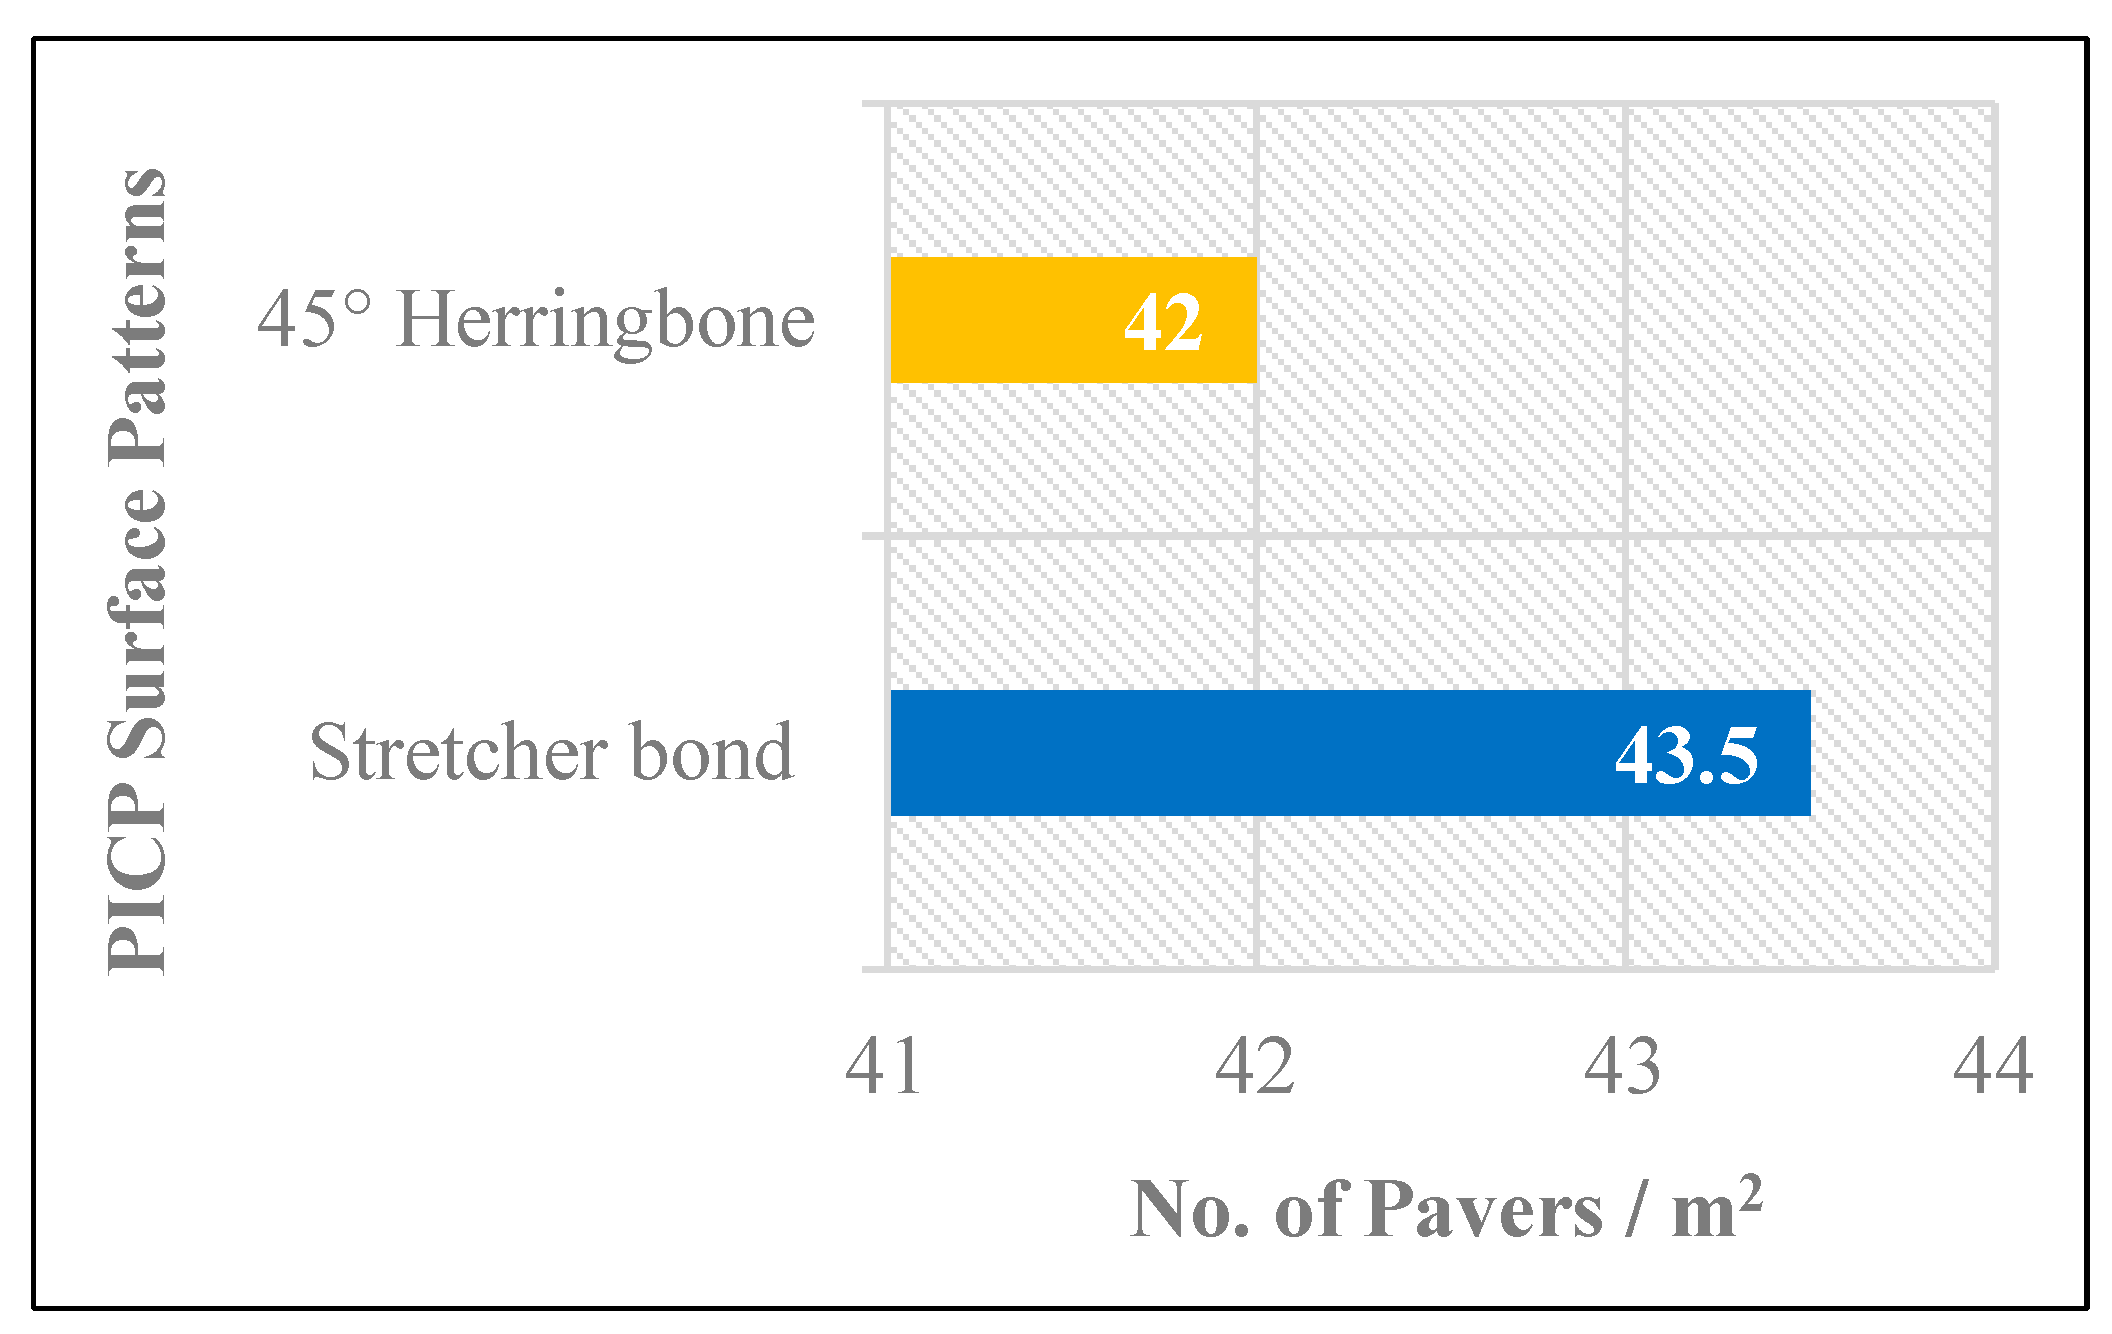
2.3.1. Paver Surface Layer

A permeable interlocking concrete pavement paver is a type of surface that allows water to seep through and into the ground, instead of flowing into stormwater systems. The permeability property refers to the joints between the concrete pavers rather than the pavers themselves. For pedestrian and vehicular zones, the paver thickness is set at 8 cm, while thicker blocks of 10 cm are used for heavy-duty applications. Fifty blocks, each weighing roughly 4.30 kg, comprise one square meter of concrete pavers. Figure 12 and Table 1 depict the dimensions and physical properties of the used concrete paver.

2.3.2. Surface Joint Filing

The gap between the pavers is set at 10 mm, as shown in Figure 13, which falls within the recommended range of 6–13 mm to ensure a minimum surface runoff infiltration rate of 2540 mm/h. To fill these gaps, a 6 mm-sized chipped, angular, and crushed aggregate is used, as shown in Figure 14, according to ASTM No. 8 and No. 9. This type of aggregate functions as a filter course to trap debris. Additionally, the aggregate between the joints enhances the bond strength between the concrete blocks.

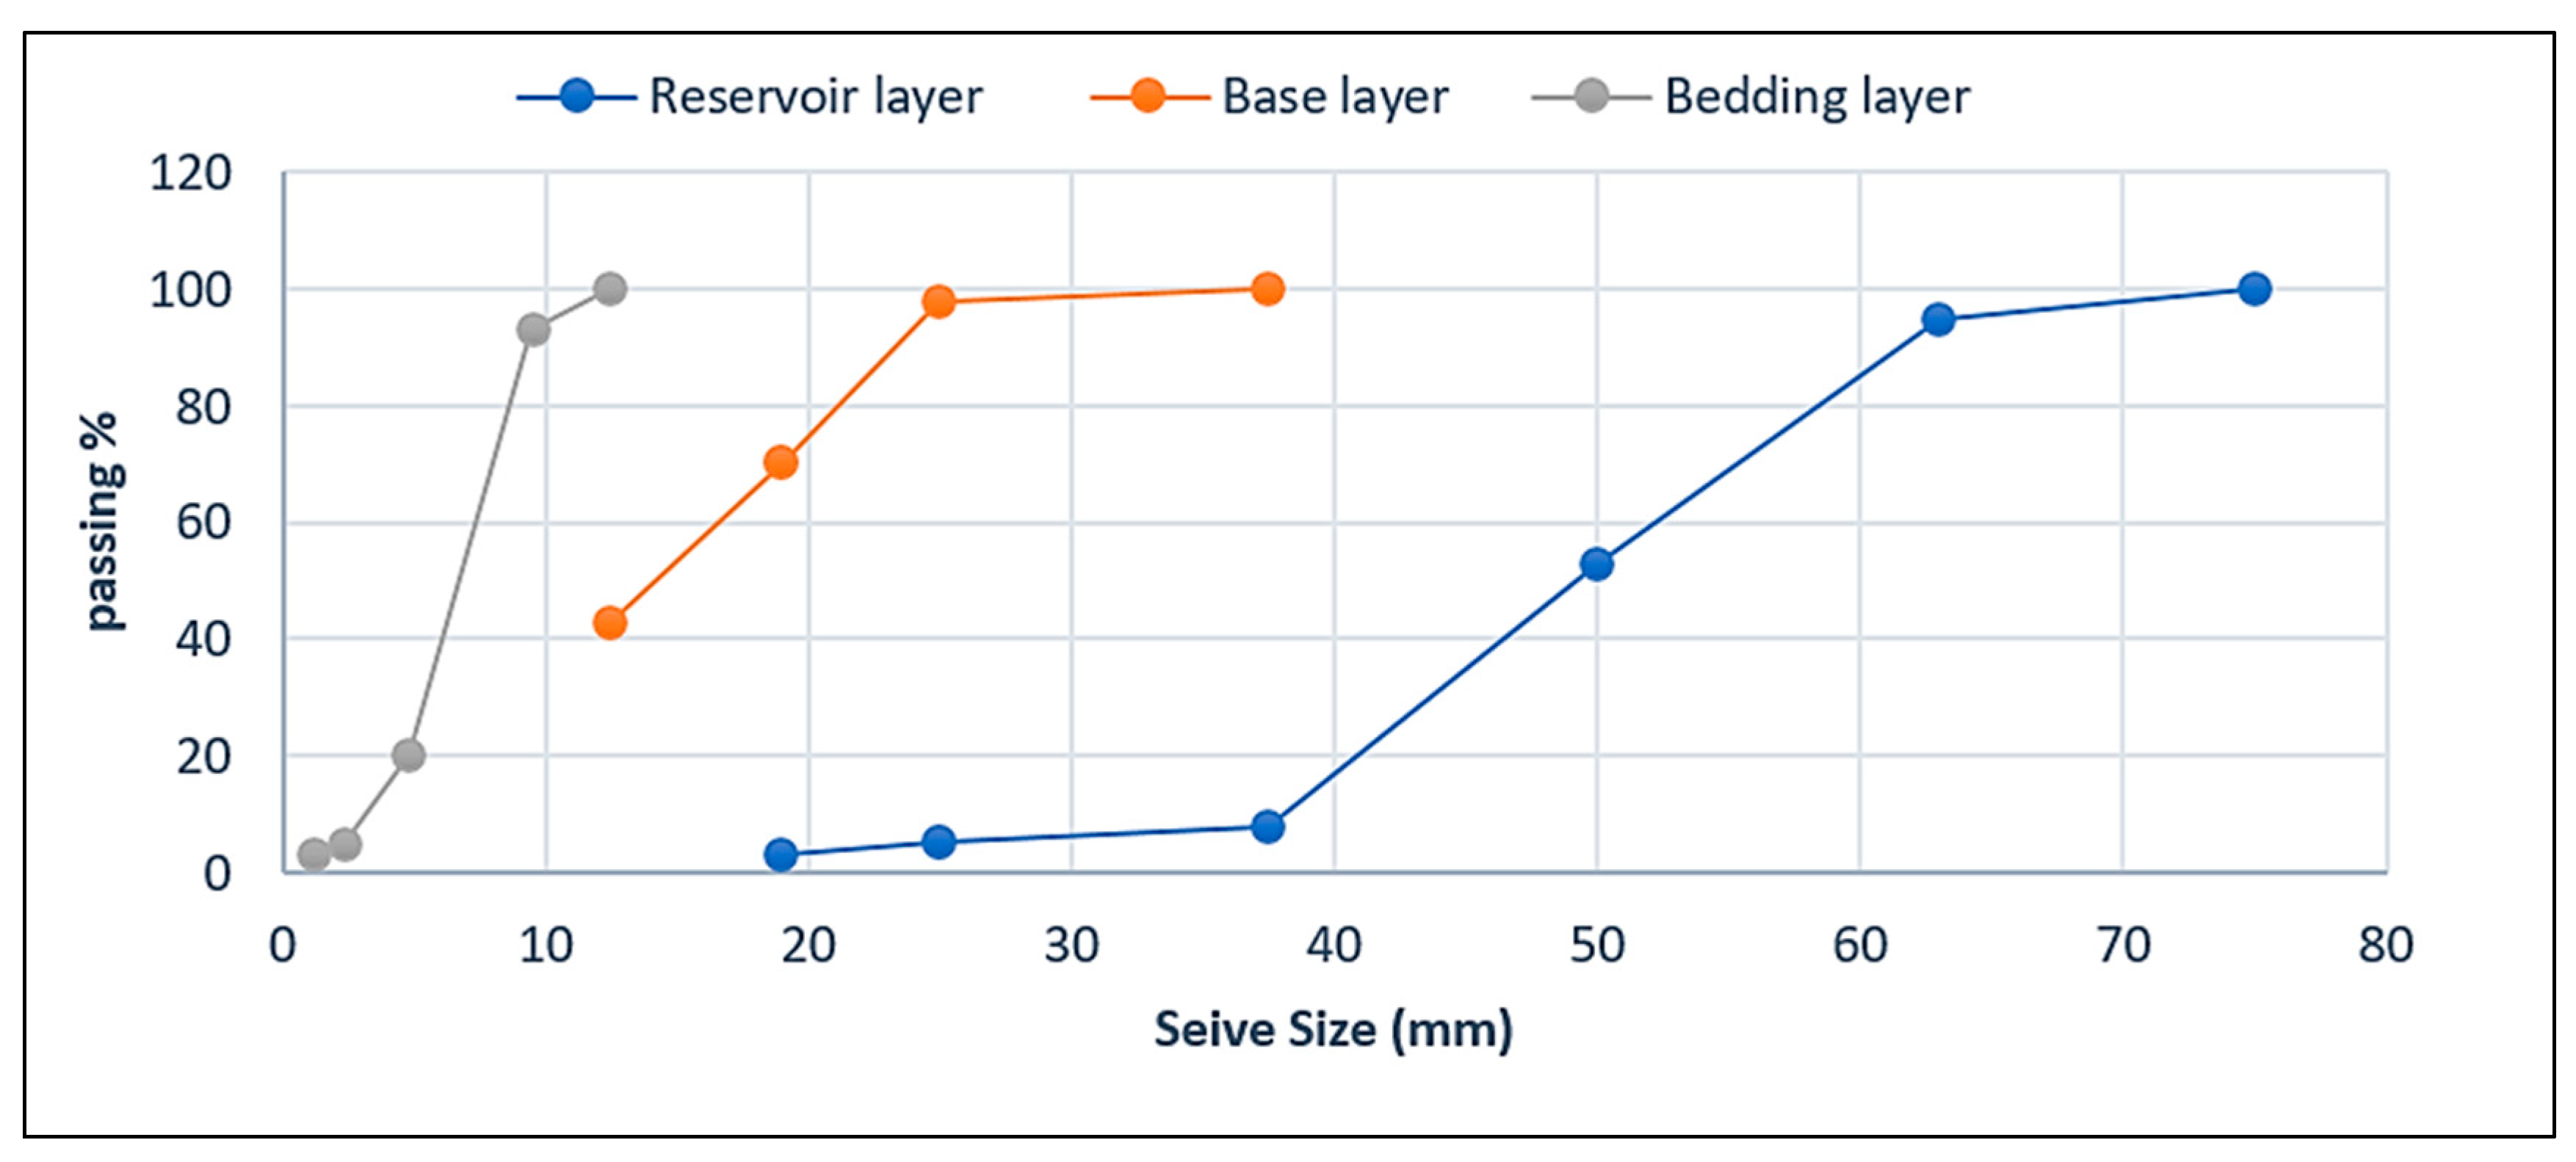
2.3.3. Bedding Layer

The bedding layer is a foundational layer placed under a permeable interlocking concrete pavement system to support it. The ASTM D448 standards provide guidelines for the thickness, compaction, and drainage of the bedding layer. This layer, which is 5 cm thick, ensures a stable base for the concrete pavers. It consists of small, angular, chipped stones with an open-graded structure, as shown in Figure 14. The aggregate is thoroughly washed and cleaned to enable water to rapidly infiltrate at a rate ranging from 1000 mm/h to 5000 mm/h.

2.3.4. Base Layer

In a permeable interlocking concrete pavement system, the base layer lies below the bedding layer. The ASTM No. 57 standard provides specifications for the coarse aggregate used in this layer, addressing its size, shape, gradation, and the allowable limit of fine particles. This layer typically consists of well-graded, crushed, angular particles ranging from 12.5 to 25 mm in size, with a minimum thickness of 10 cm, as shown in Figure 15, below. The base layer acts as a transitional zone between the two layers, resembling tree roots, and features an infiltration rate ranging from 1000 mm/h to 5000 mm/h.

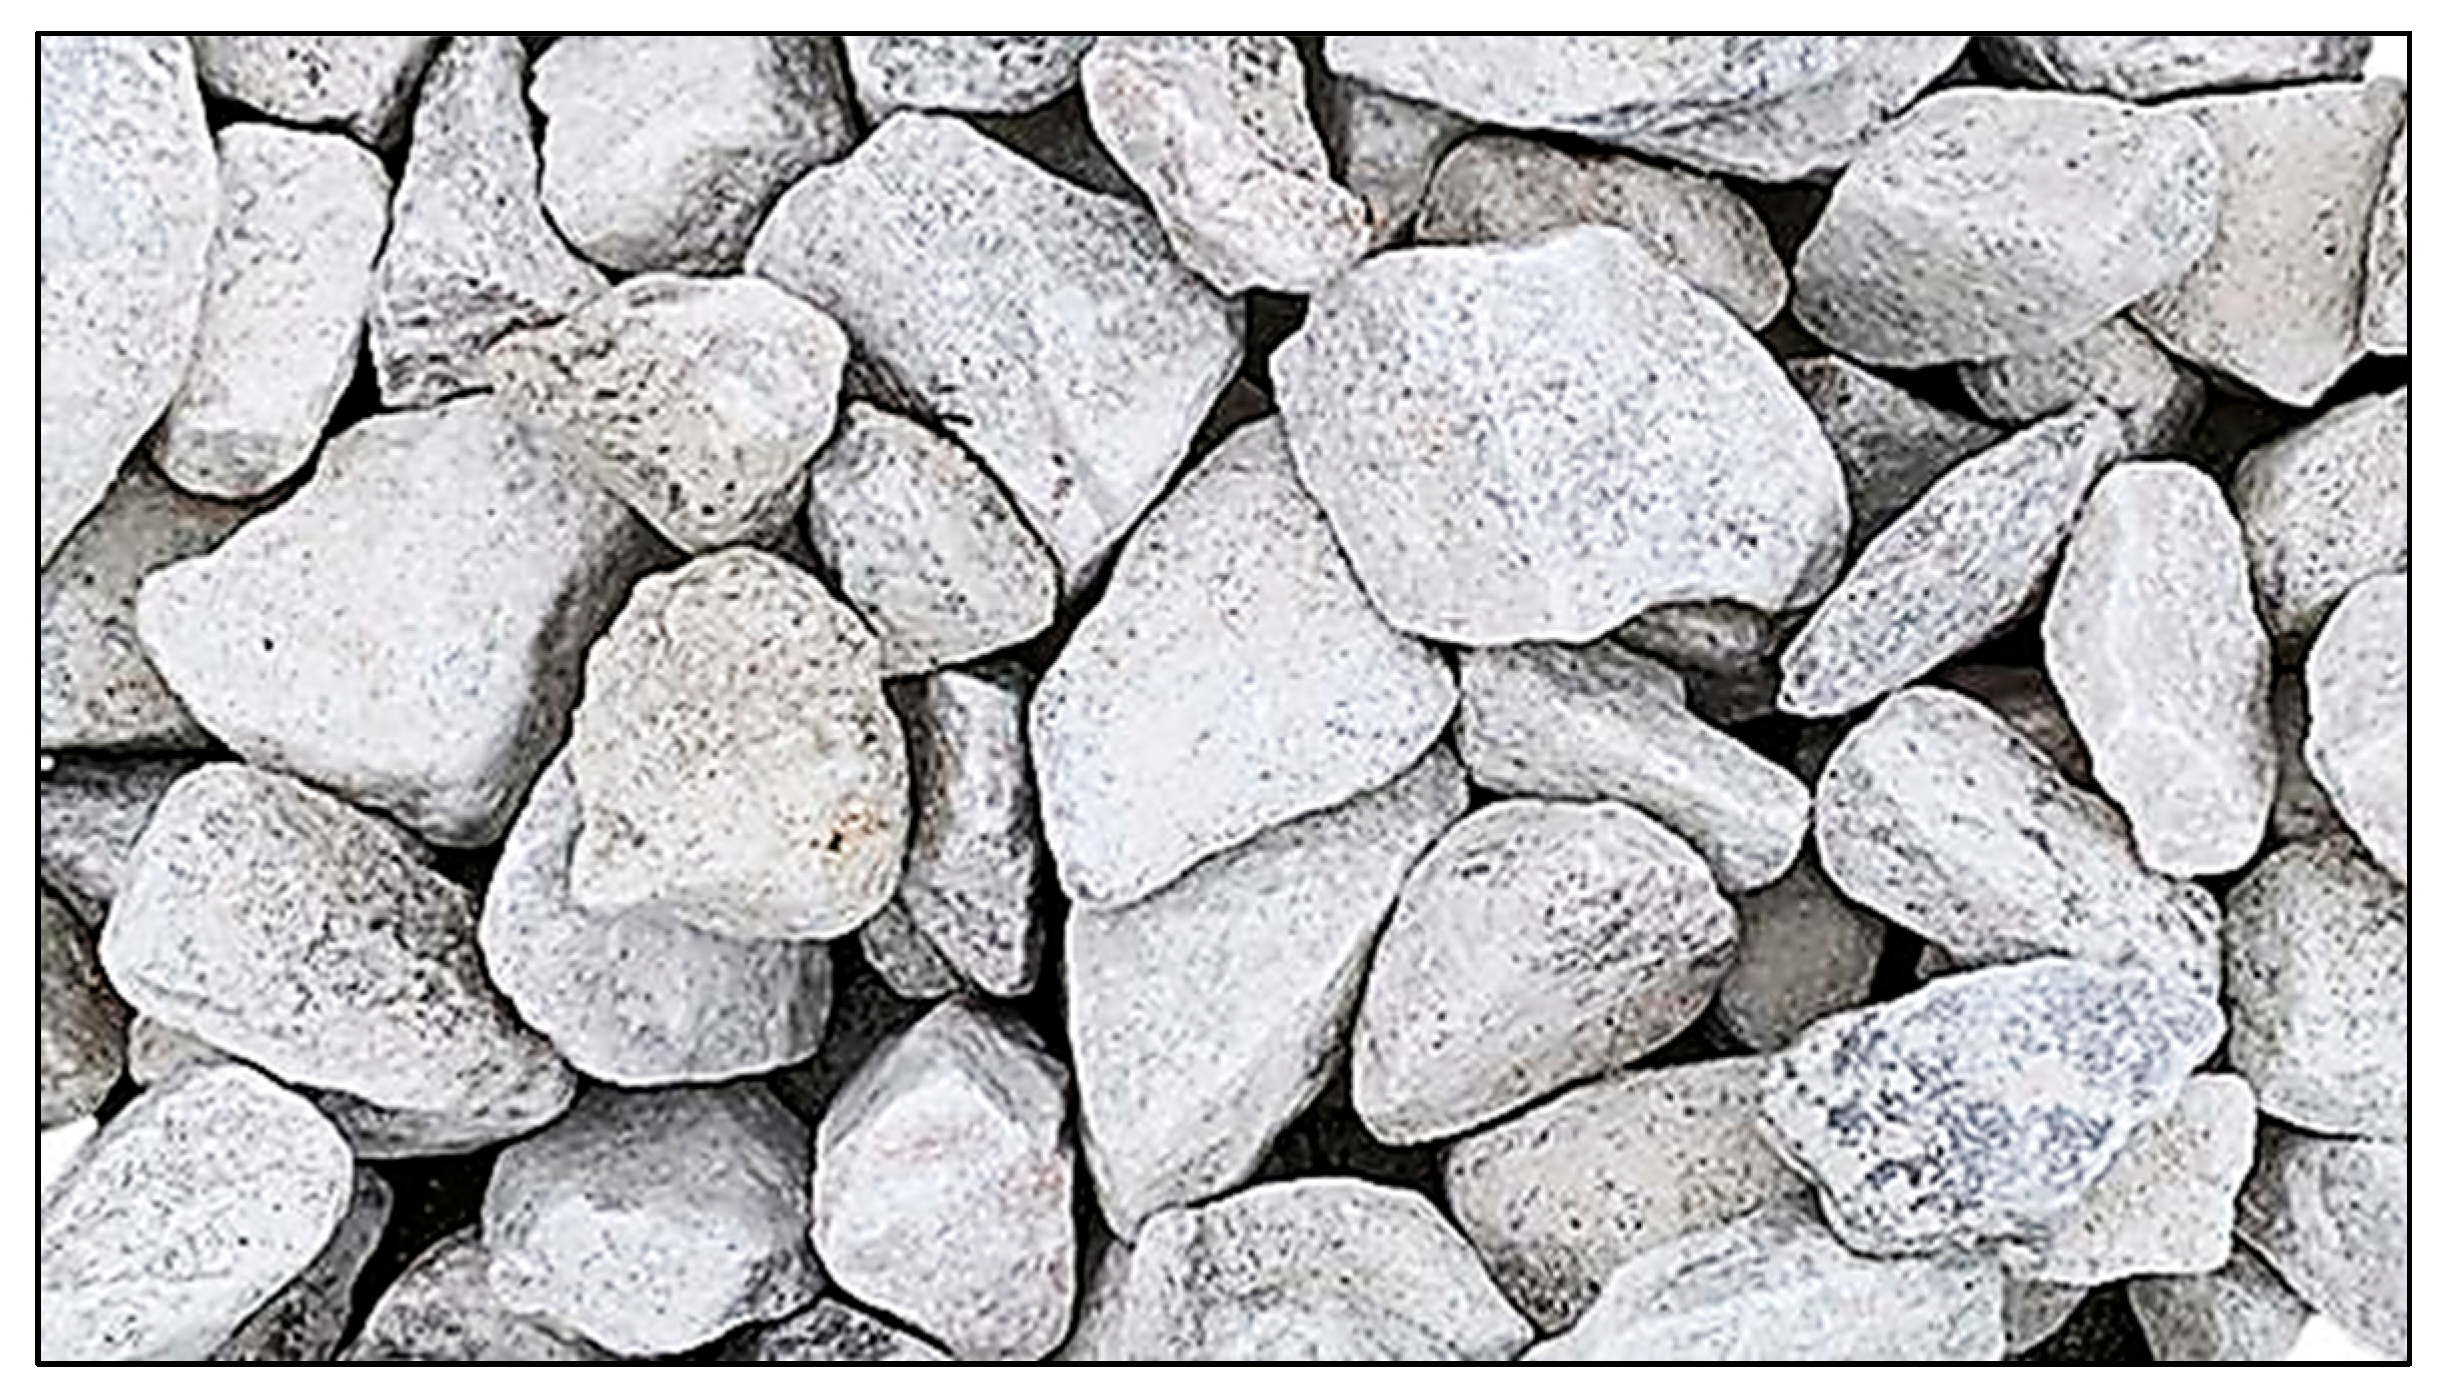
2.3.5. Subbase or Reservoir Layer

In a permeable interlocking concrete pavement system, the layer beneath the base layer is known as the reservoir or subbase layer. As per ASTM No. 2 specifications, the coarse aggregate used in this layer must adhere to specific criteria regarding size, shape, and gradation, with a restricted number of fine particles. Typically, it is built with a well-graded, crushed, angular aggregate with a size range of 50–63 mm, as shown in Figure 16, below. The thickness of this layer is dictated by structural and hydraulic design considerations to ensure optimal functionality. It offers robust support for weak soils, improving their stability, and achieves an infiltration ranging from 1000 mm/h to over 10,000 mm/h.
In Iraq, trusted quarries provide the specified types of aggregate, which are meticulously cleaned and double-washed to remove fine debris that might obstruct the interconnected pores. The aggregate grading for the PICP layers is chosen based on ASTM D448 standards [24], and is shown in Figure 17, below.

2.4. Estimating the Depth of the Reservoir

This study employed two design methodologies for structural and hydraulic planning, aiming to withstand expected traffic loads while temporarily retaining infiltrated water.

2.4.1. Using a Structural Approach to Design

The reservoir layer is generally composed of a porous material that facilitates water flow, with its depth playing a crucial role in the overall pavement system design. The structural design method takes into account various factors such as the type and volume of anticipated traffic loads, the properties of the materials used in the pavement, and the local soil conditions. By accurately calculating the depth of the reservoir layer, engineers can ensure that the permeable pavement system is able to effectively manage stormwater runoff and reduce the risk of flooding.
The AASHTO 93 [25] guidance on pavement structure design is commonly used in transportation design. The thickness of the layers in permeable pavement is determined by assessing the construction materials and evaluating their suitability for the design’s structural number (SN). The structural number (SN) is calculated using Equation (1) provided below.
R e s e r v o i r   ( S N ) = s u r f a c e   a n d   b e d d i n g   ( a 1 D 1 ) + b a s e   ( a 2 D 2 ) + r e s e r v i o r   ( a 3 D 3 )
The coefficients of the layers (a1, a2, a3) can be determined from Table 2, below in accordance with AASHTO 93.
The thickness of the paving layer is designated as D1, the base layer is designated as D2, and the thickness of the reservoir or subbase layer is designated as D3.

2.4.2. Using a Hydraulic Approach to Design

The reservoir layer of permeable pavement must be designed to handle the Stormwater Retention Volume (SWRv). This requires calculating the volume of water the pavement will store, considering both the amount absorbed into the ground and the portion drained through underdrains [26]. Equation (2) can be used to calculate the depth of the reservoir or subbase layer.
Reservoir   depth   d p   by   ( ft ) = ( Rv i   ×   P   ×   DA Ap ) ( i 2   ×   t f ) / η r
  • Rvi = The impermeability factor for runoff is 0.95
  • P = The depth of rain that falls during a storm and is retained in the Stormwater Retention Volume (SWRv) in (ft).
  • DA = The area in (ft2) of the permeable pavement surface or drainage system that contributes to the retention of water
  • Ap = The surface area of the permeable pavement, measured in (ft2)
  • tf = The time it takes to fill the container, approximately 2 h per day
  • i = The rate at which water infiltrates the subgrade soils in the field, measured in (ft) per day
  • ηr = The porosity of the reservoir, with a value of 0.4
The depth of the reservoir, calculated using this method, must be compared to the maximum depth using Equation (3).
Maximum   reservoir   depth   d pMax .   by   ft =   i 2   ×   t d / η r
td = Duration of reservoir drain down (48 h).
  • The calculated depths used in both structural and hydraulic engineering designs are presented in Table 3 below.
  • According to the structural design method, the chosen depth of the reservoir layer is 40 cm, which is the highest value for safety considerations, as shown in Figure 18, below

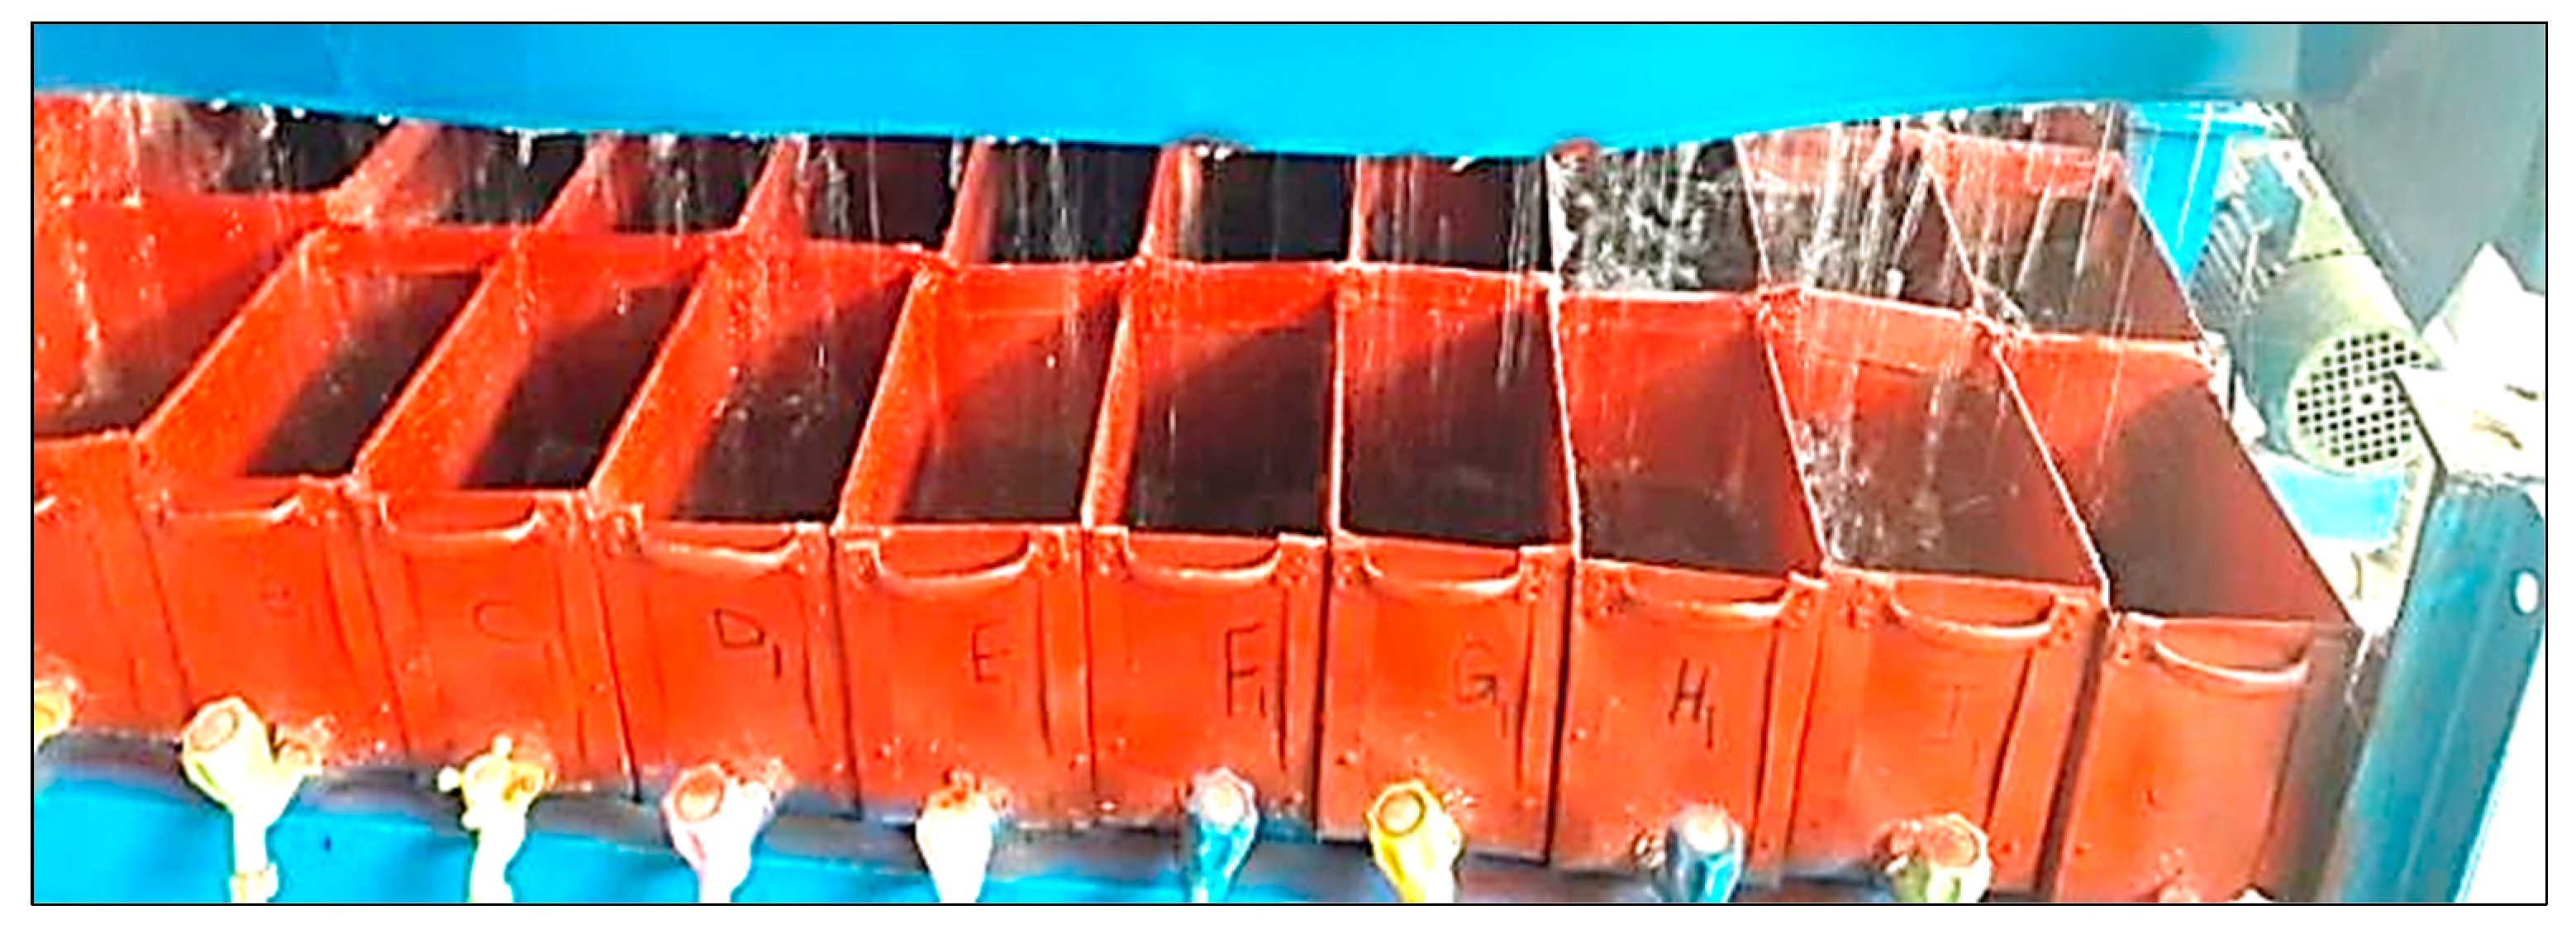
2.5. Placing the Layers of PICP Within the Steel Container

The iron box consists of layers of permeable interlocking concrete pavement (PICP). At its base, a fine mesh with small openings is positioned to prevent fine aggregates from escaping into the collection cells. The pavement layers within the iron box are methodically arranged as follows: a 40 cm thick subbase course (ASTM No. 2) forms the foundation, topped by a 10 cm thick base course (ASTM No. 57), and finished with a 5 cm thick bedding course (ASTM D448).
A handy compactor is used to compact the layers that have been laid. The materials are compressed to the required depth. The bedding layer is then covered with paving blocks, and the gaps between them are filled with the same material as the bedding layer, as depicted in Figure 19A. Afterwards, the pavers are swept and compacted to remove any surplus aggregate, as illustrated in Figure 19B. To complete the process, 40 cells are attached to the bottom of the iron box to collect water that infiltrates, and an additional container is employed to gather runoff.
In this study, the tests conducted on the adopted permeable interlocking concrete pavement (PICP) were carried out under two uniform rainfall intensities. The pattern for laying the stretcher bond on the surface is typically simple and straightforward to construct, as shown below in Figure 20A, while for the 45° herringbone pattern, the construction process requires adequacy and craftsmanship, as shown below in Figure 20B.
Basically, two types of parameters have been selected for the chosen permeable system. The first category pertains to the intensity of rainfall, with two intensities being used: 40 L/min and 80 L/min. The second category focuses on the geometry of the surface pattern, featuring 10 mm joint spacing between the pavers and incorporating slopes of 0%, 4%, and 8% in both the longitudinal and transverse directions. The rainfall simulator runs for a duration of 2 min, and the water that permeates the pavement is captured in 40 cells located beneath the pavement layers. The cells beneath the layers of PICP are numbered in a sequential manner, as depicted in Figure 21, starting with (A(a-1), B(b-1), C(c-1), D(d-1), E(e-1), FF-1, G(g-1), H(h-1), I(i-1), and J(j-1)) for the first raw, (A(a-2), B(b-2), C(c-2), D(d-2), E(e-2), F(f-2), G(g-2), H(h-2), I(i-2), and J(j-2)) for the second raw, (A(a-3), B(b-3), C(c-3), D(d-3), E(e-3), F(f-3), G(g-3), H(h-3), I(i-3), and J(j-3)) for the third raw, and finally (A(a-4), B(b-4), C(c-4), D(d-4), E(e-4), F(f-4), G(g-4), H(h-4), I(i-4), and J(j-4)) for the fourth raw. A designated container is utilized to gather runoff in the longitudinal direction of the simulator.
The simulation process was conducted for 120 s with specified parameters to replicate real-world conditions, assess the system’s performance under short, intense rainfall, and ensure the pavement can manage typical stormwater challenges, as shown in Figure 22.

3. Results and Discussions

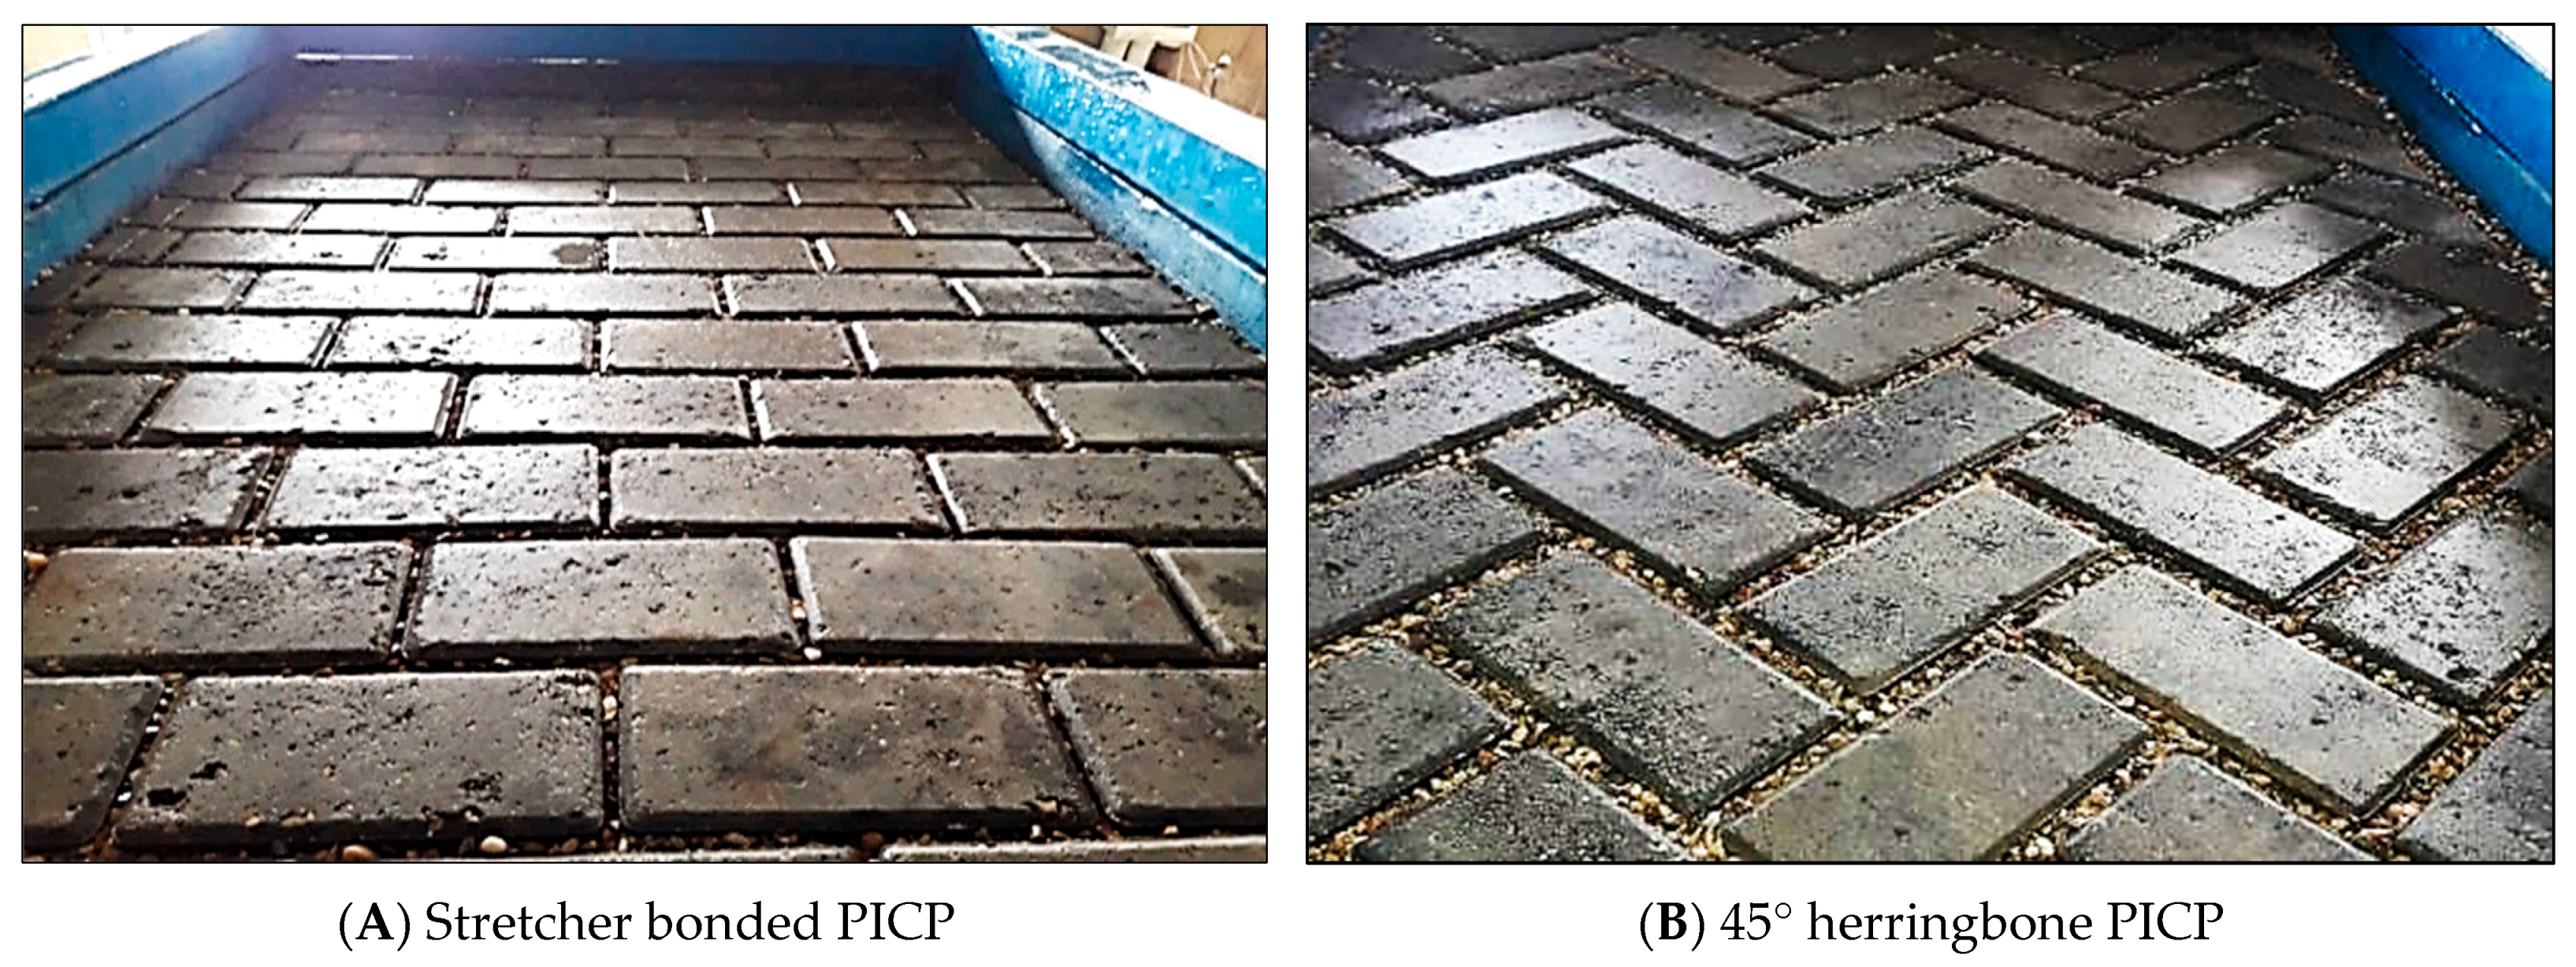
3.1. Examining the Infiltration of Water Through Surface Patterns with Stretcher Bond and 45° Herringbone Arrangements

The impact of the longitudinal and transverse slopes (L-Slope and T-Slope) of the surface paver on the volume of water infiltration at two different rainfall intensities over a period of 2 min was studied. Figure 23, Figure 24 and Figure 25 show how these patterns behave under different geometric and weathering conditions.
The way both patterns behave under varying slopes and rainfall intensities can be explained as follows:
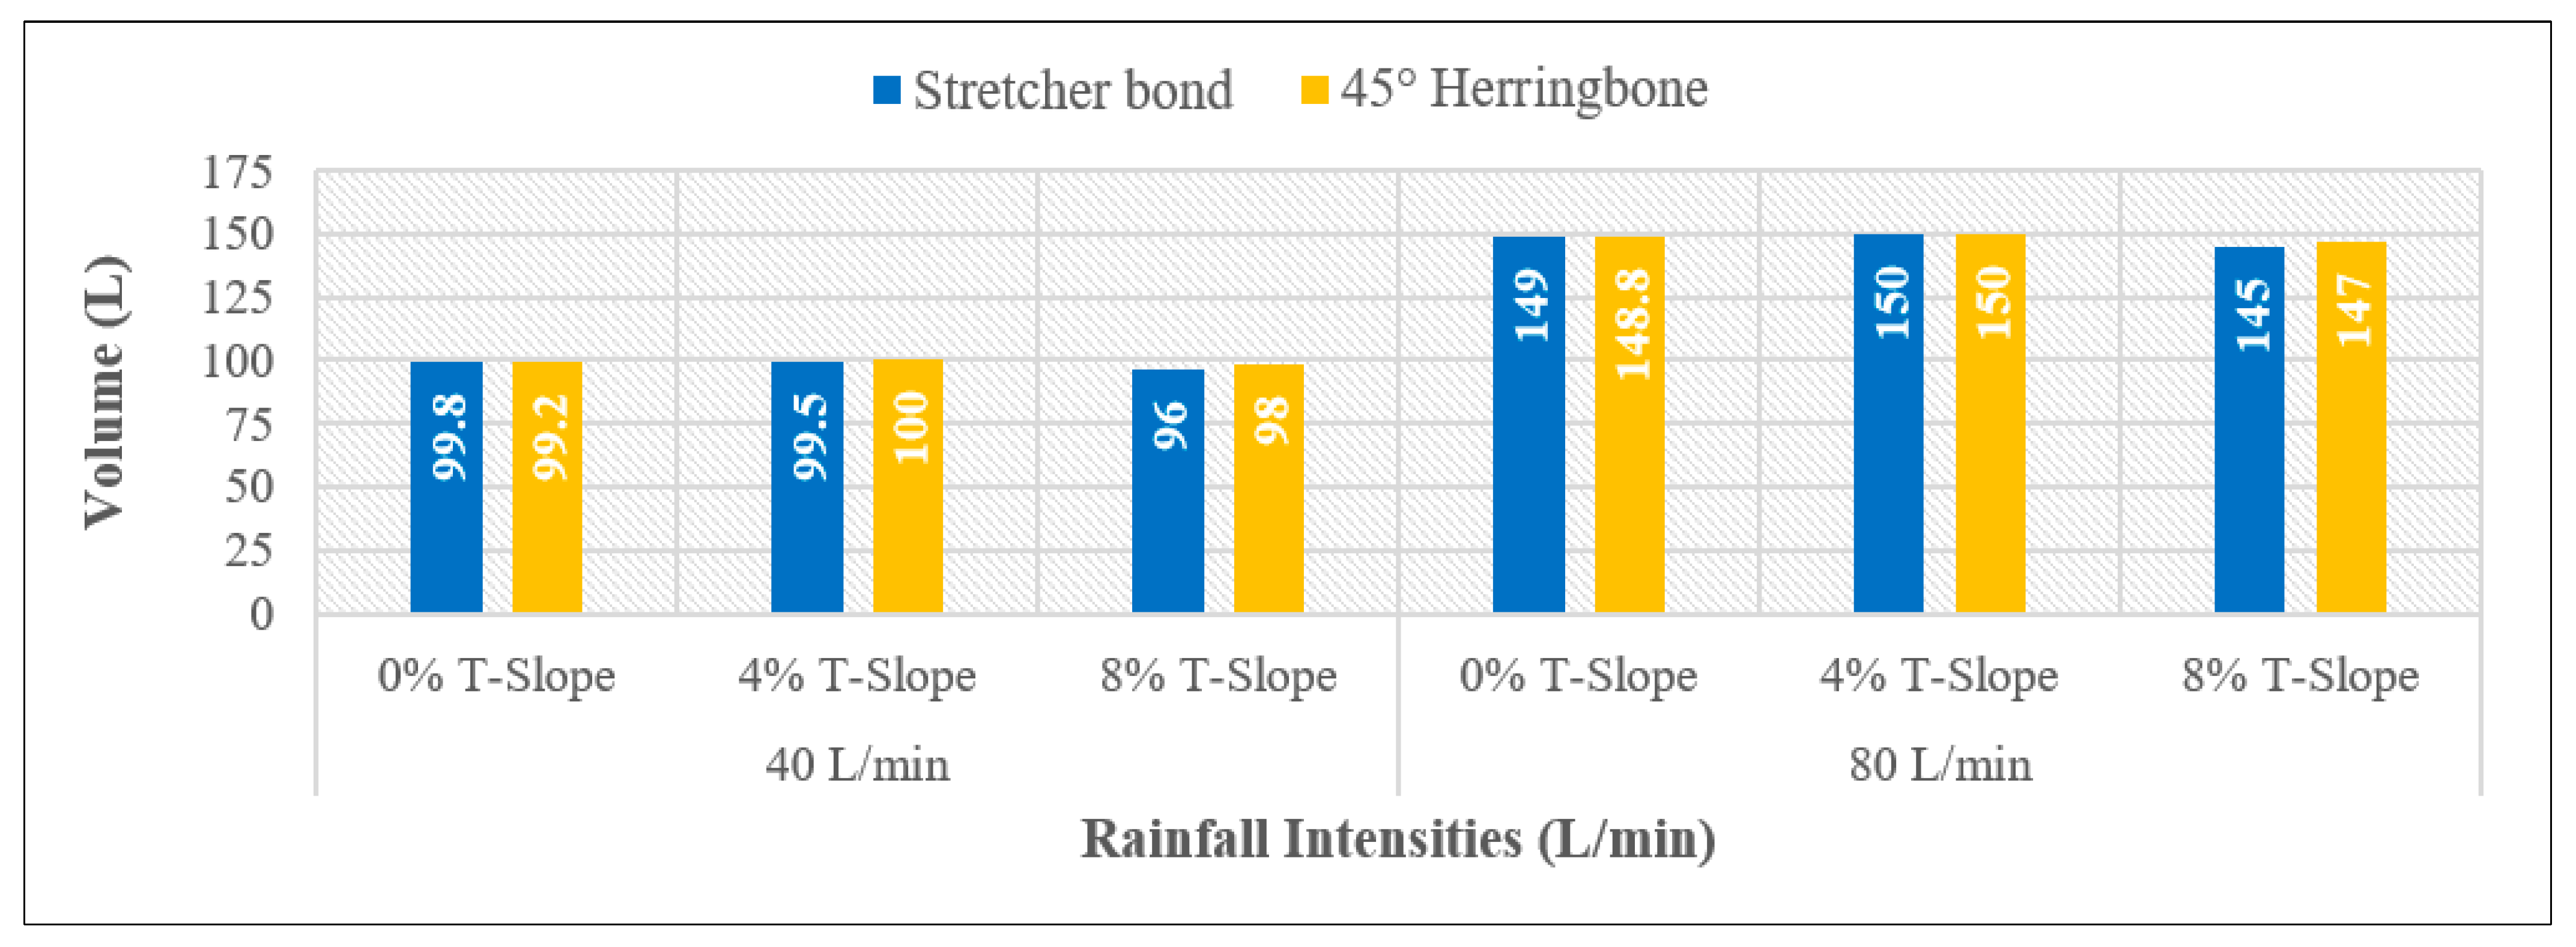
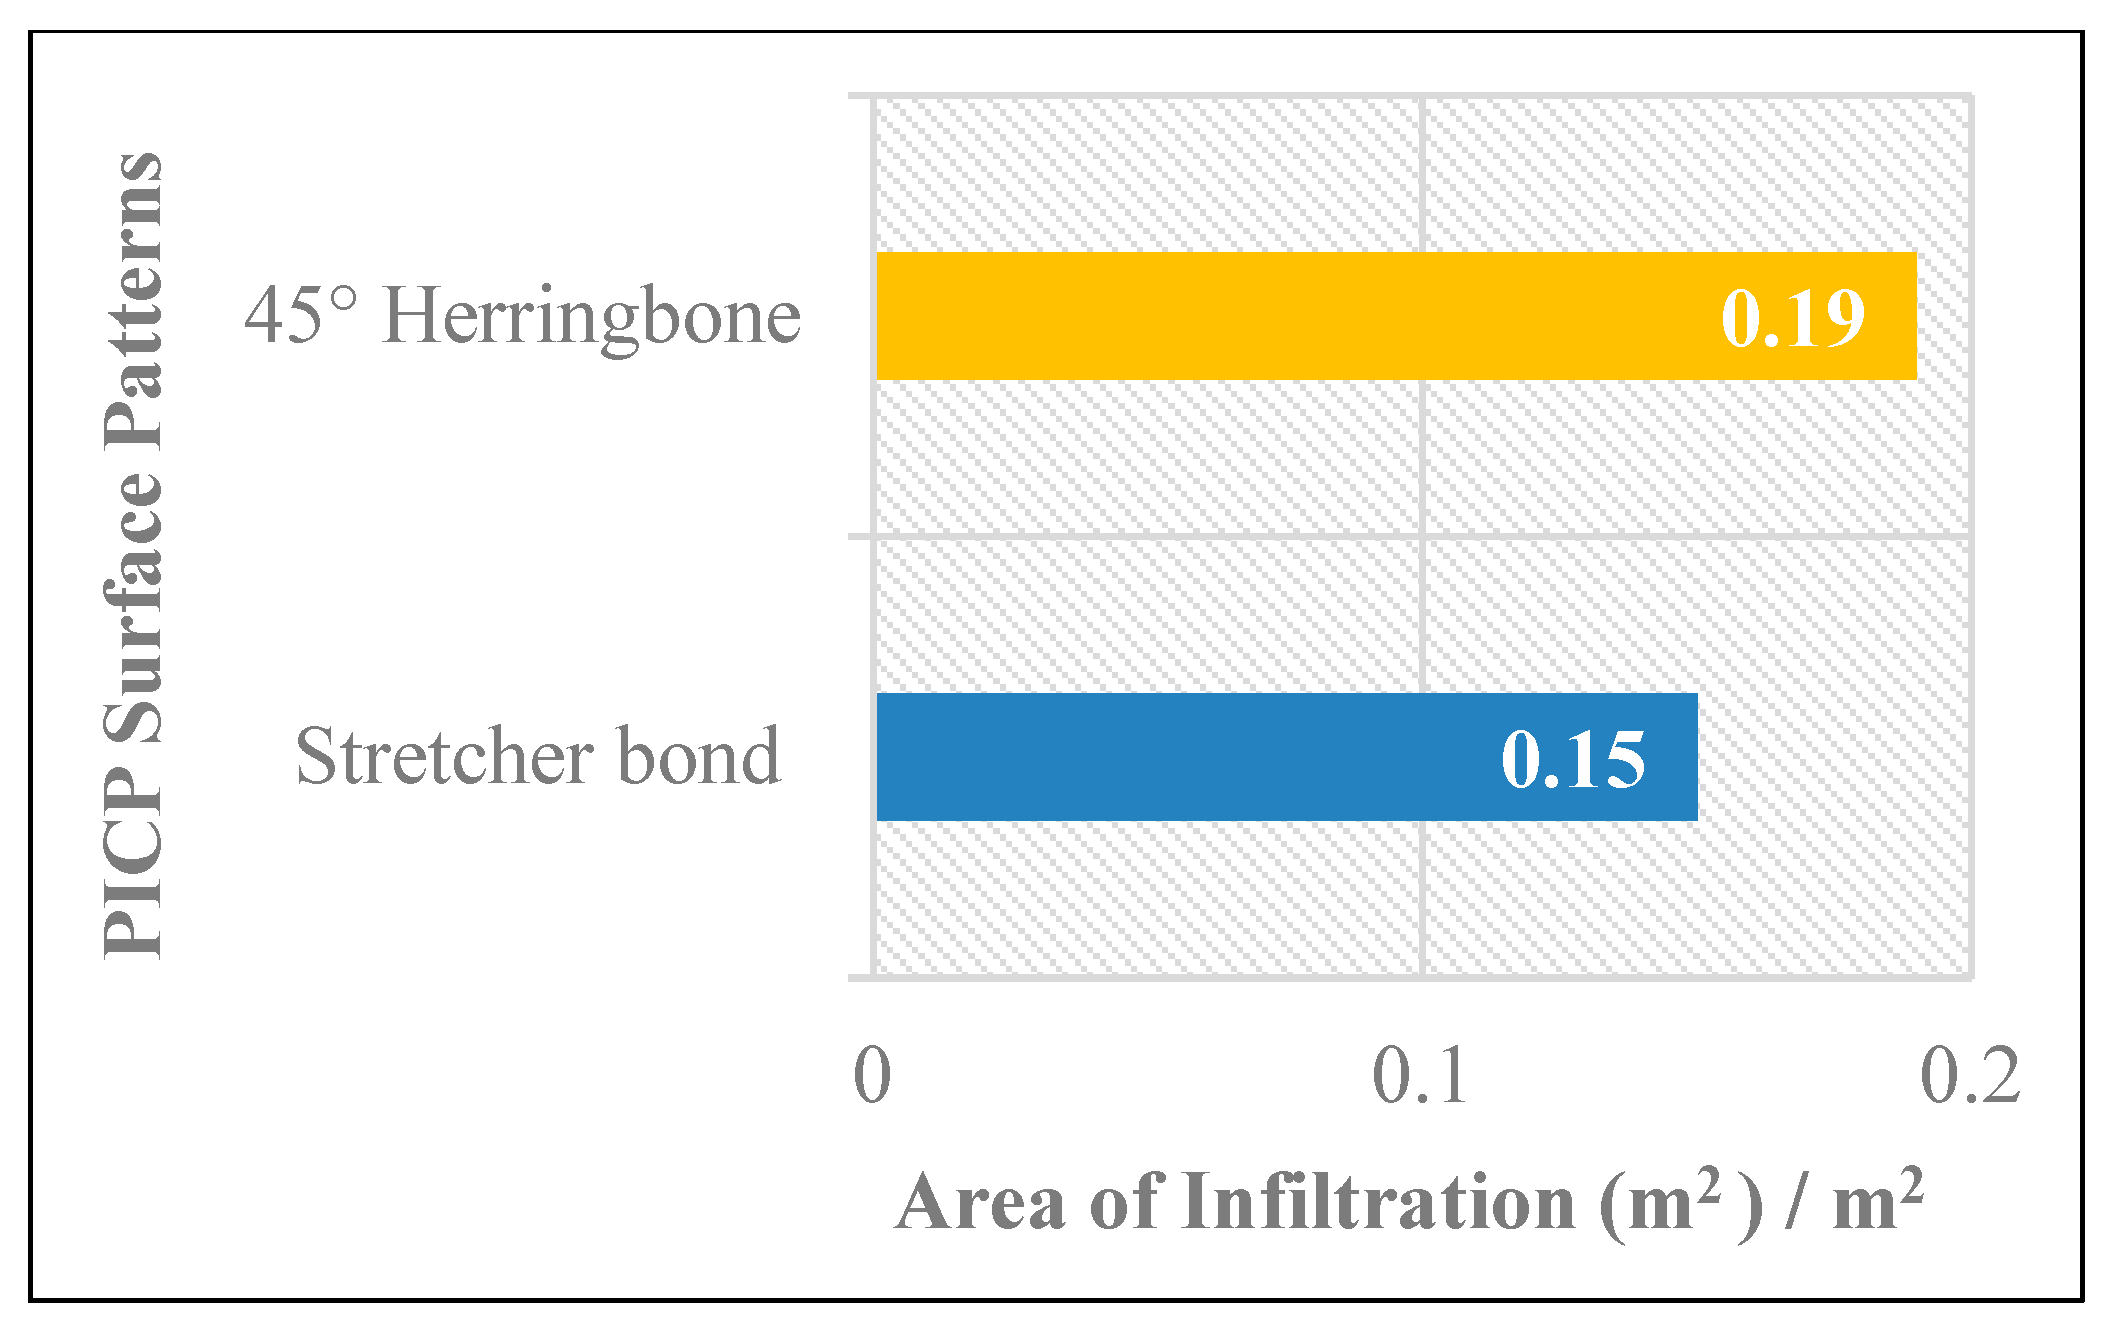
  • At 40 L/min rainfall intensity under all the adopted longitudinal slopes, approximately an equal level of water has infiltrated through both patterns at (0 and 4%) T-Slope, whereas the cause of such behavior is that the surface joints of both types effectively absorb all the surface water, regardless of the slope, due to their equal efficiency. At 8% T-Slope, the infiltration of 45° herringbone PICP is higher than the stretcher bond, owing to the laying pattern of the 45° herringbone, which tends to infiltrate water rather than runoff, especially at high slopes. In addition, a higher surface area of joints is occupied by the 45° herringbone PICP in comparison to the stretcher bond.
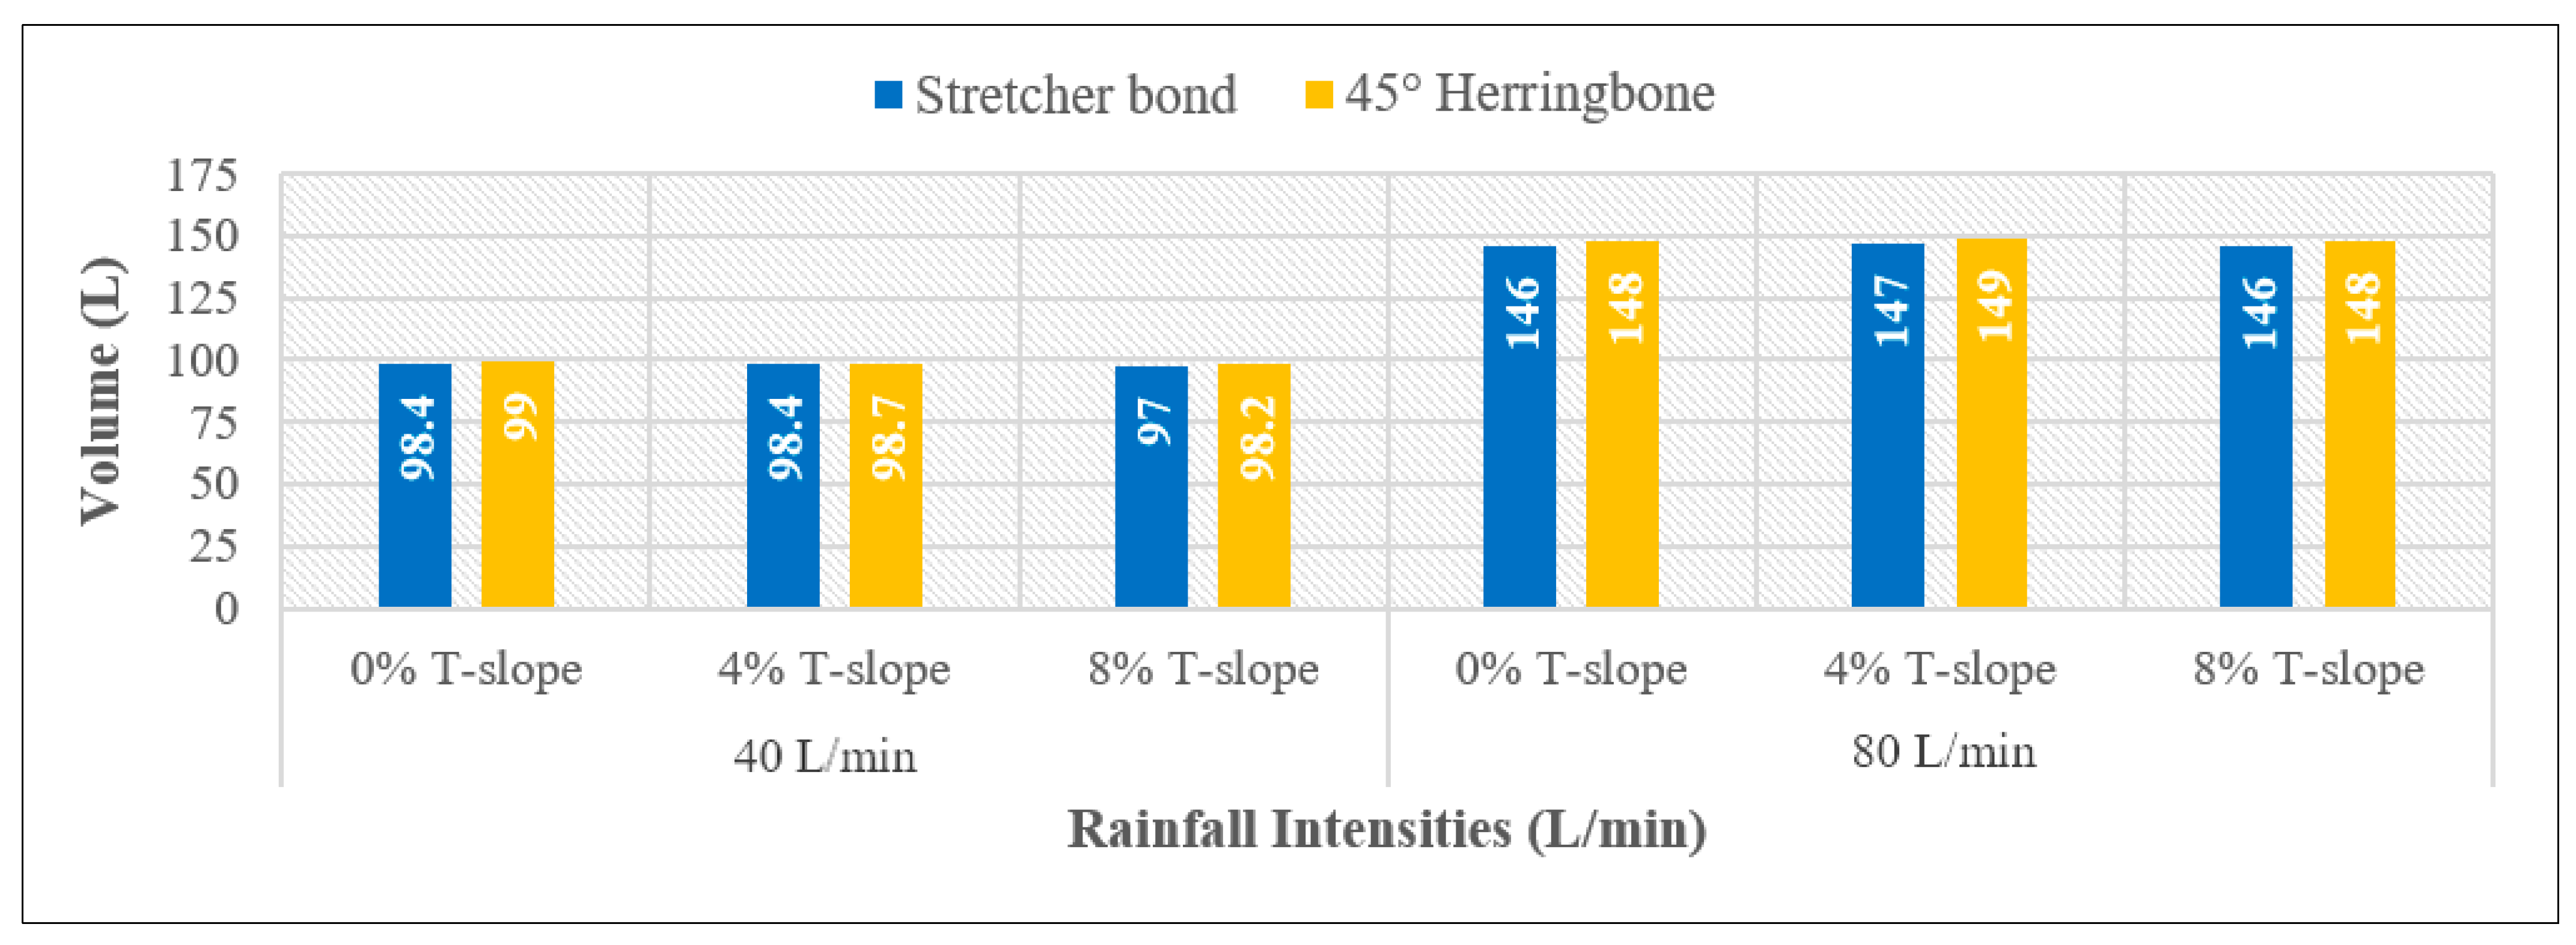
  • At 80% L/min rainfall intensity under 0% L-Slope, the level of water infiltration for both patterns is approximately equal for (0% and 4%) T-Slope, while at 8% T-Slope, the infiltration level for 45° herringbone PICP has become higher than the stretcher bond. By adjusting the longitudinal slope to (4% and 8%), the water infiltration for 45° herringbone PICP became higher than the stretcher bond for all the adopted transverse slopes. In addition, that behavior can be interpreted due to the higher surface area of the joints in the 45° herringbone pattern in comparison to the joints in the stretcher bond pattern, as depicted in Figure 26 and Figure 27. Consequently, the 45° herringbone pattern demonstrates a clear advantage, especially under high rainfall intensities (≥80 L/min). Put differently, the stretcher bond pattern exhibits greater runoff compared to the 45° herringbone pattern.

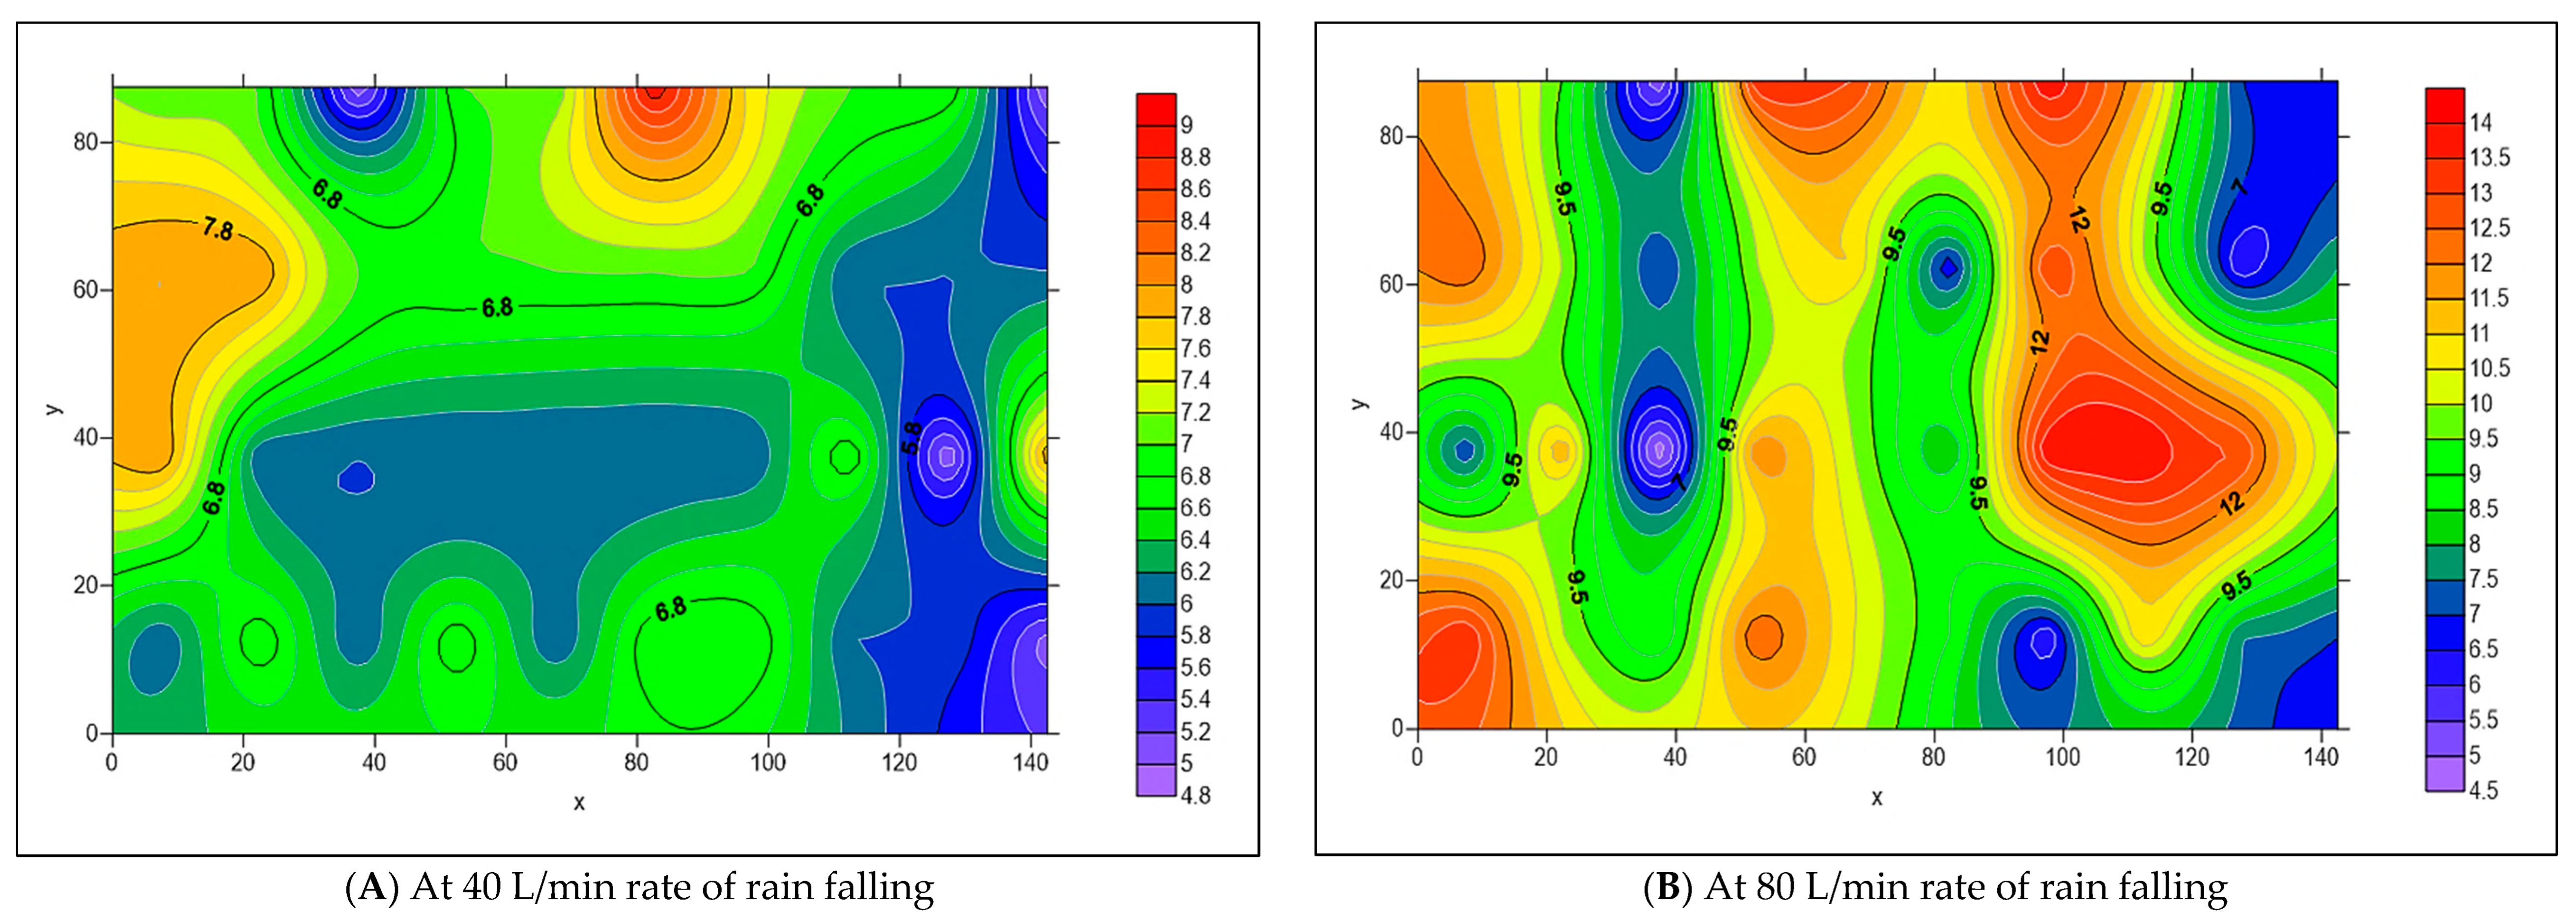
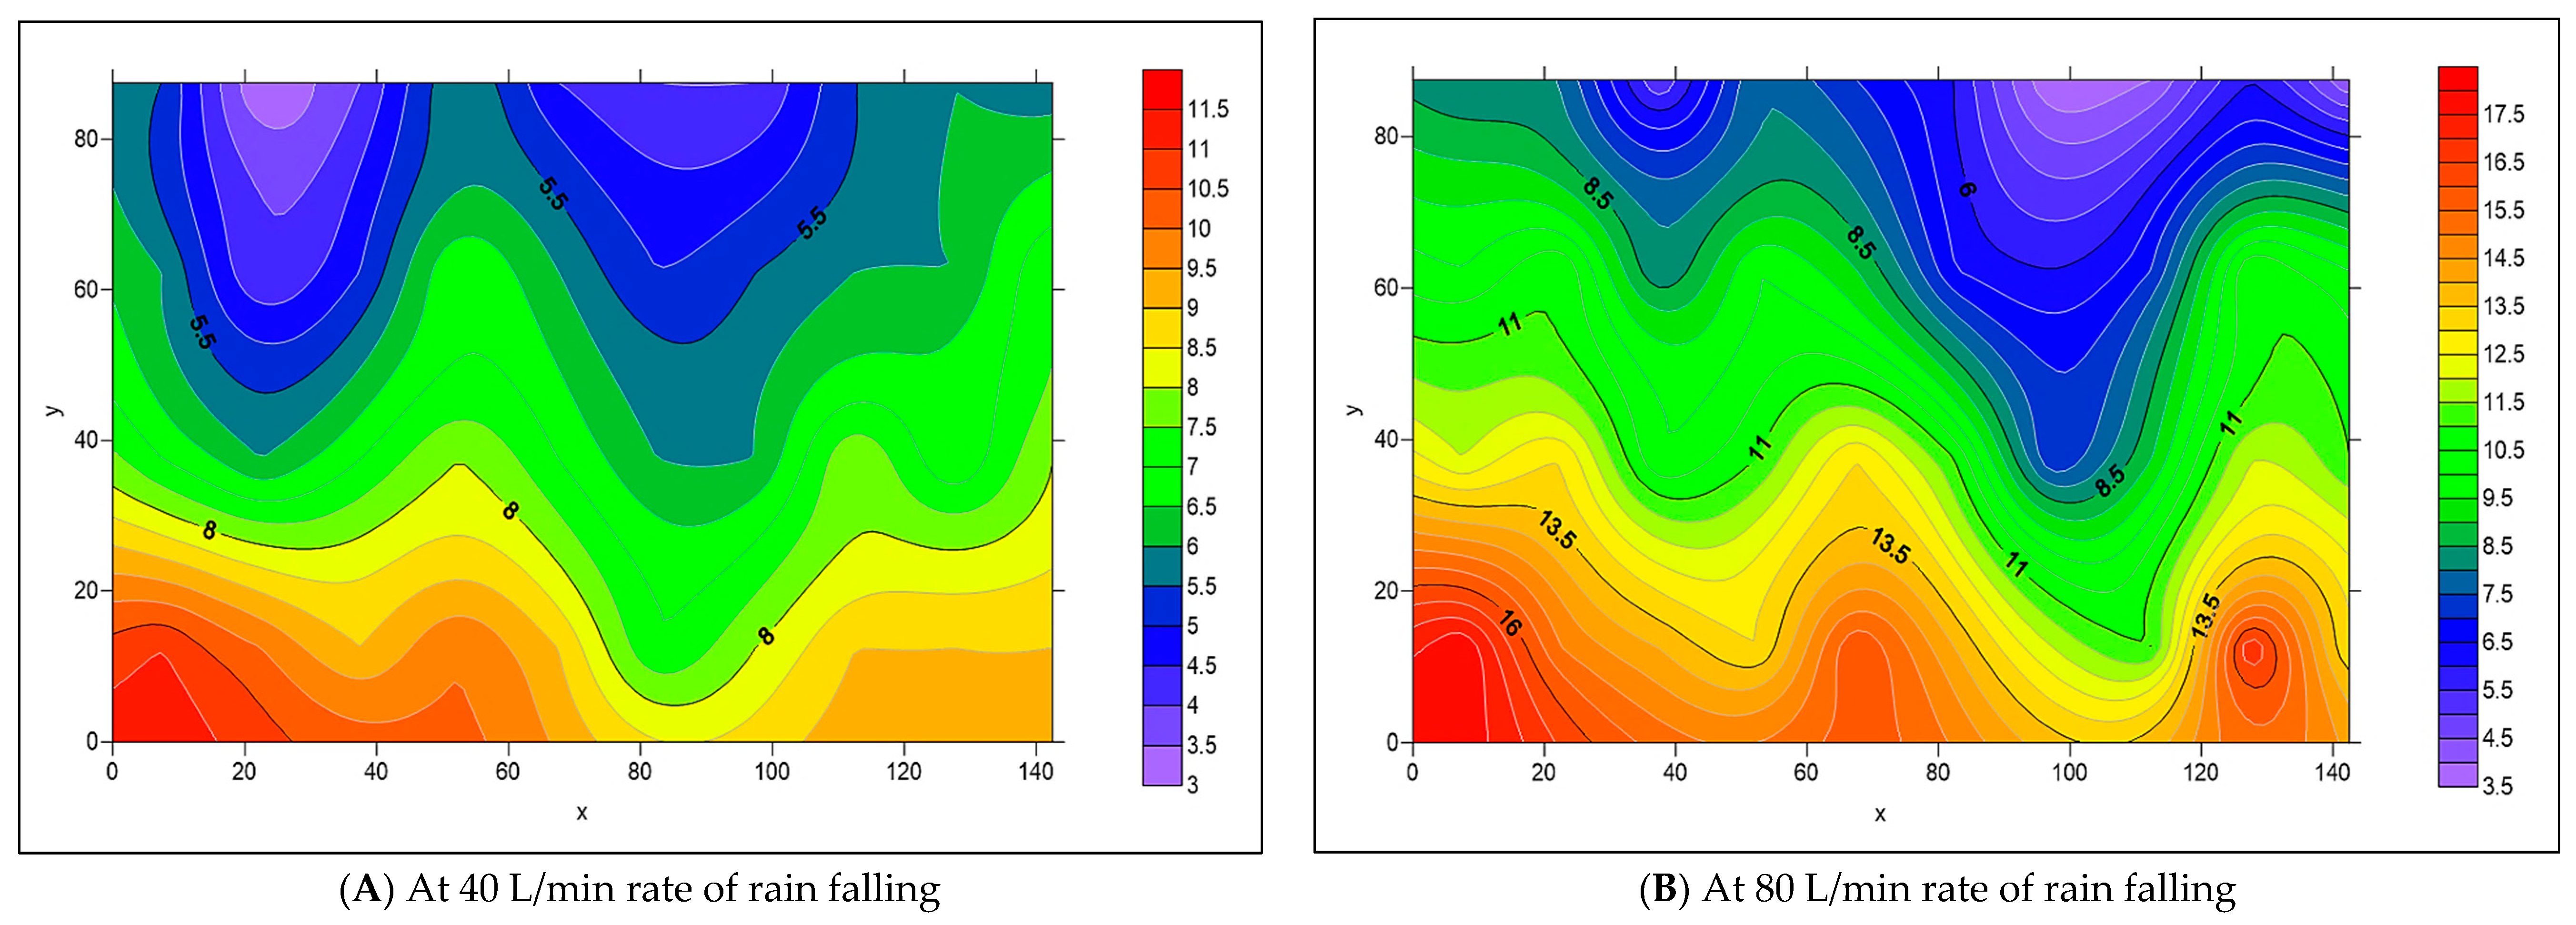
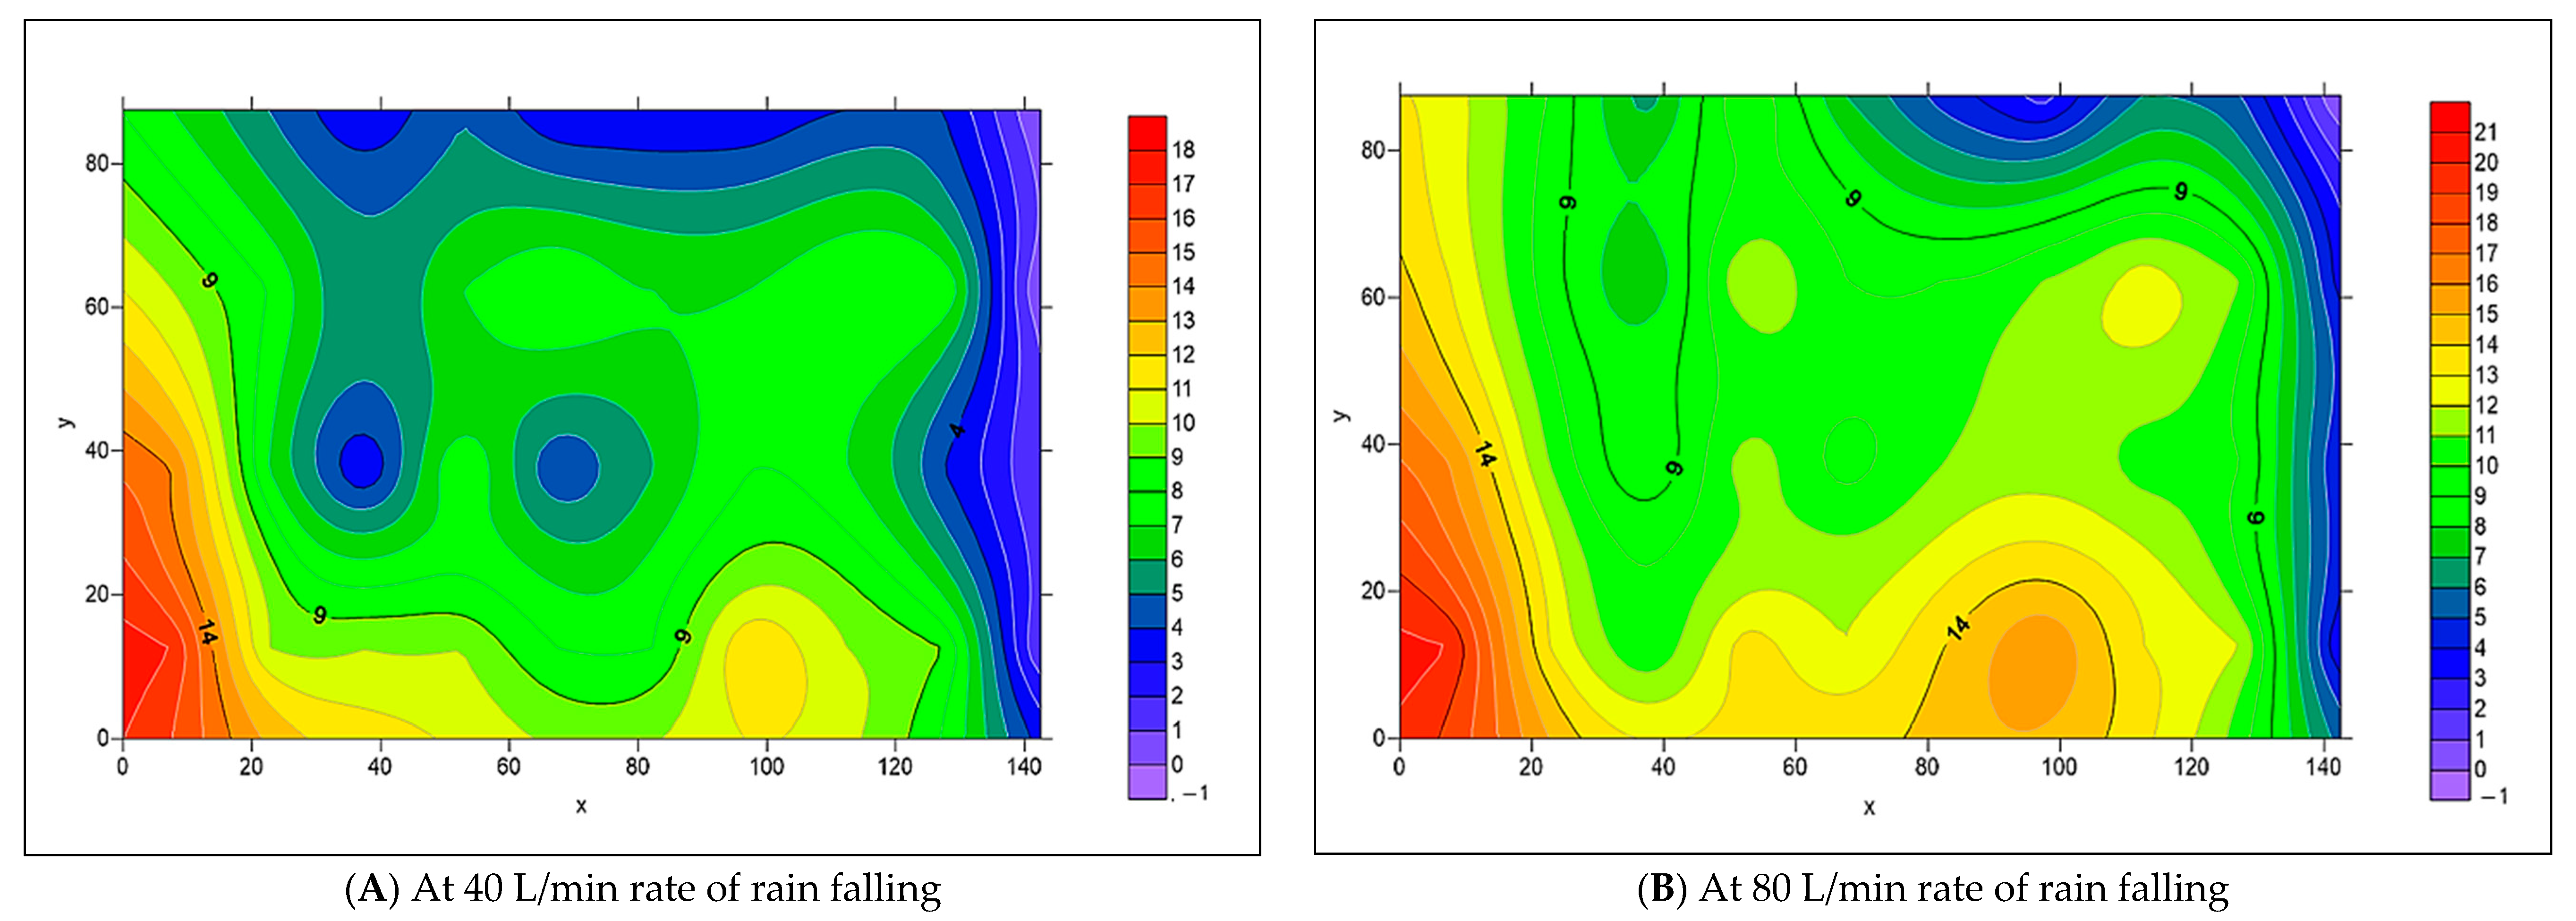
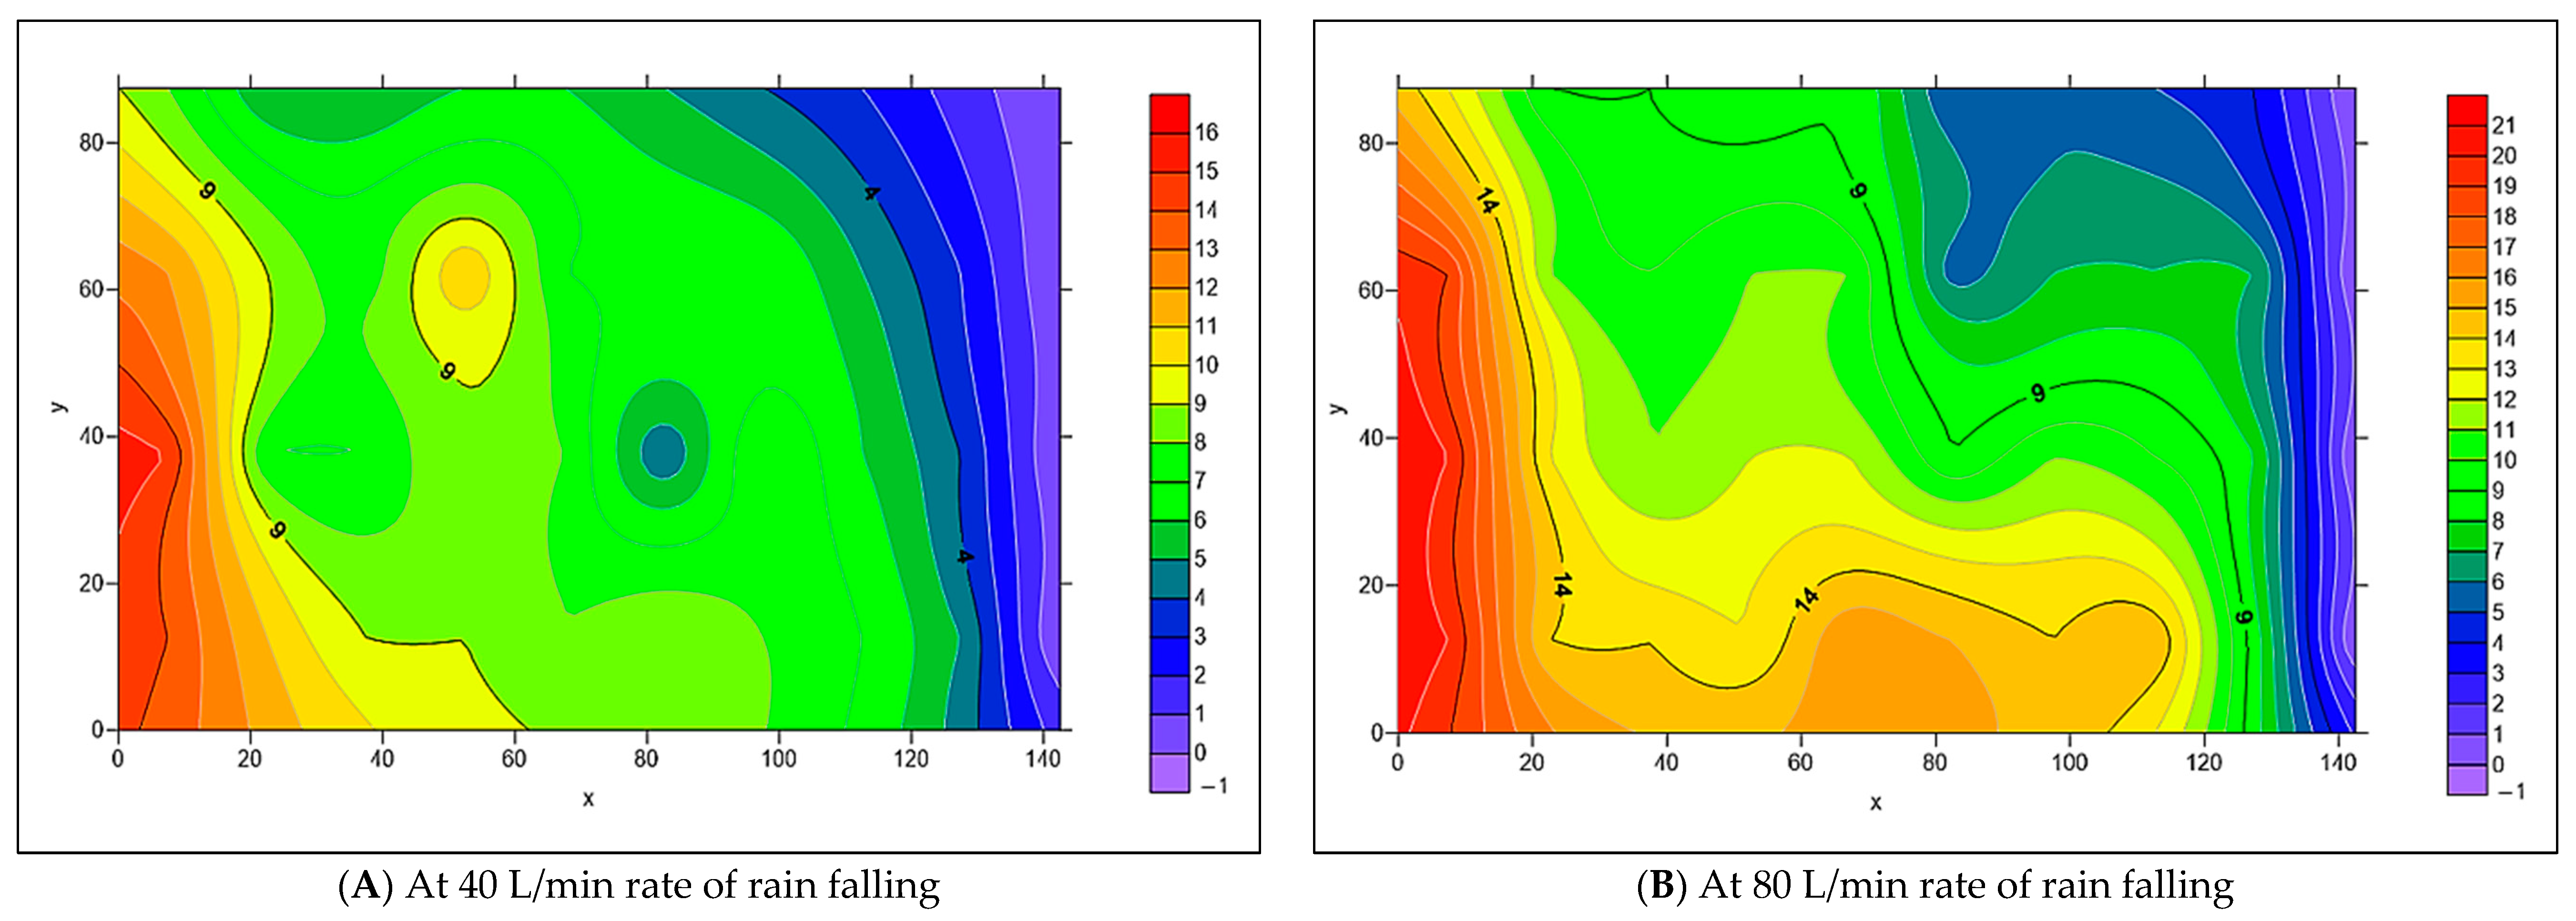
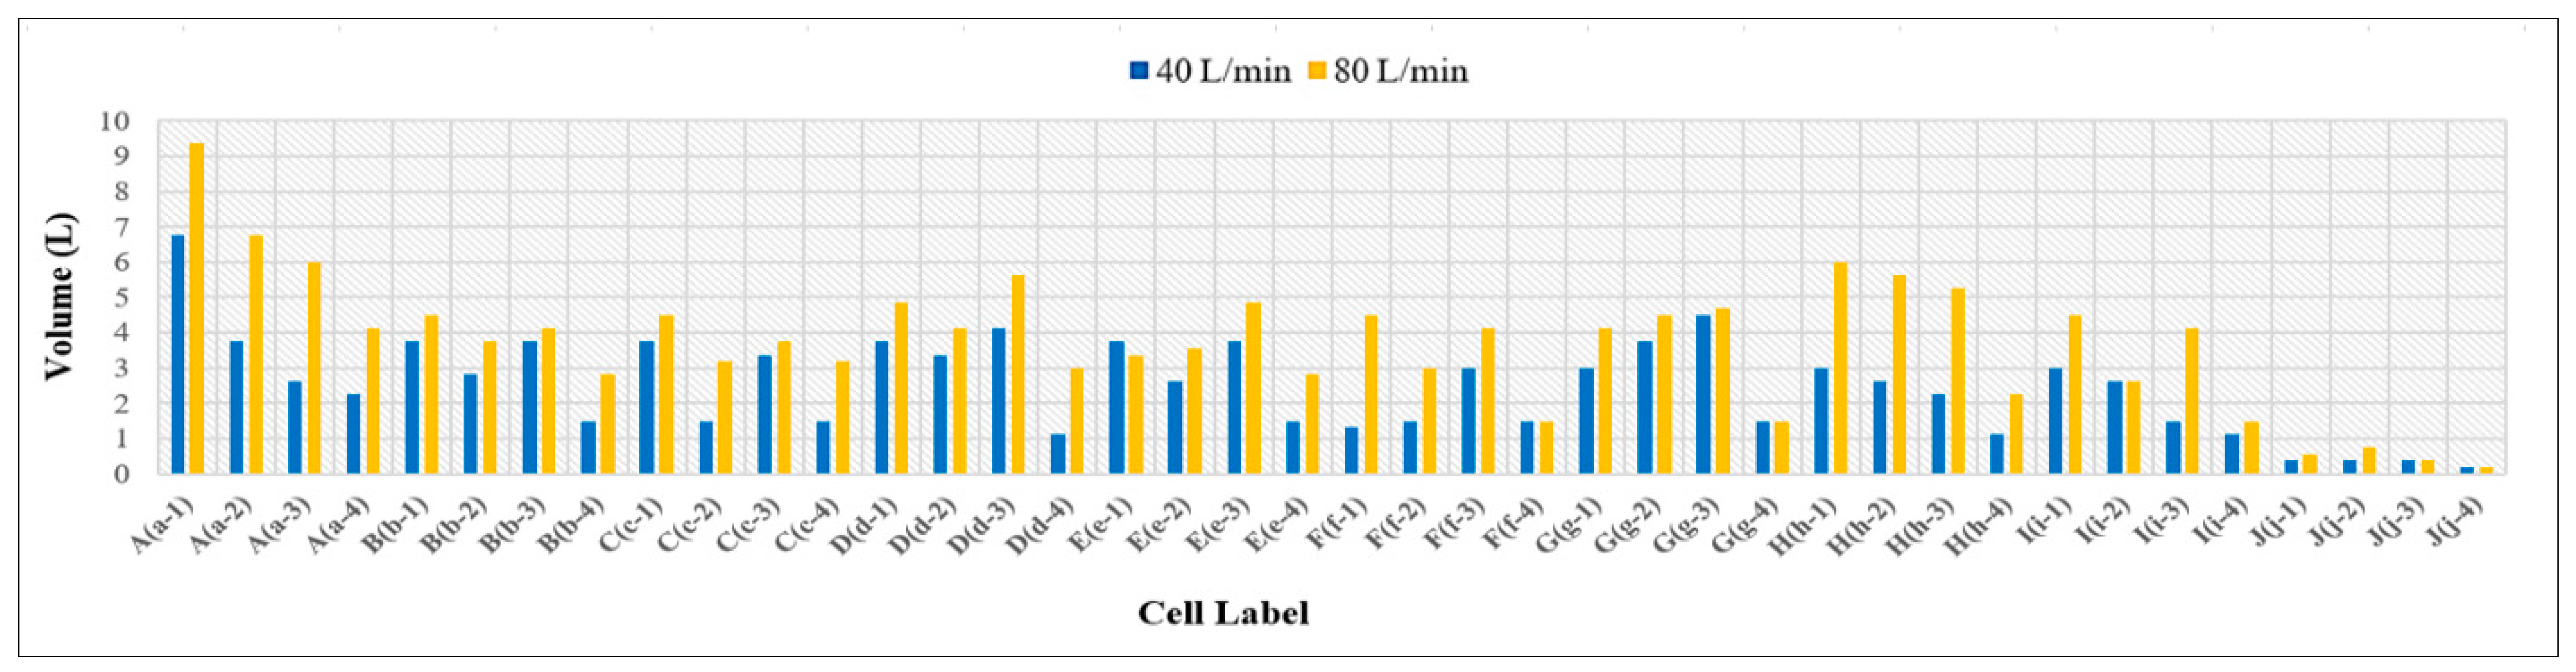
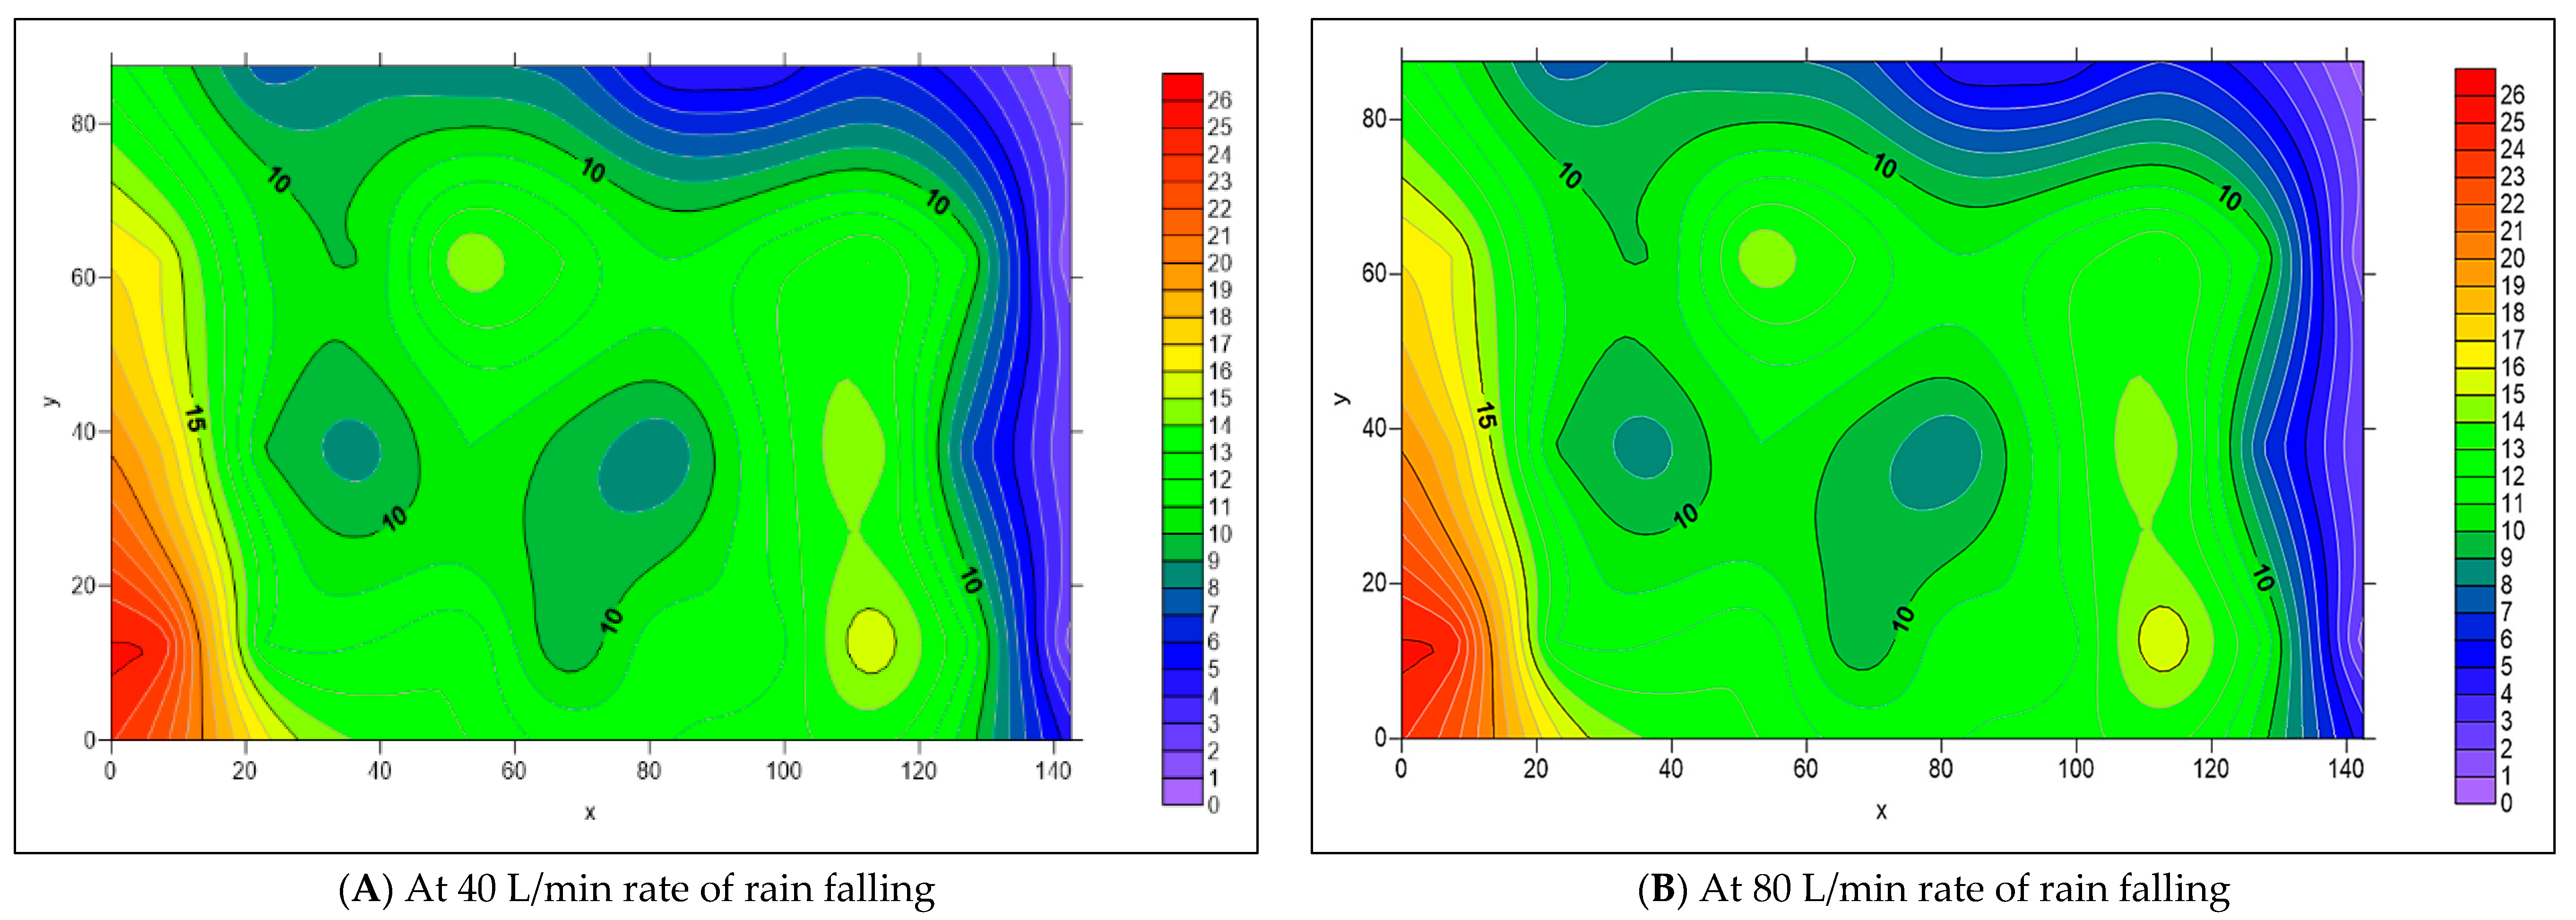
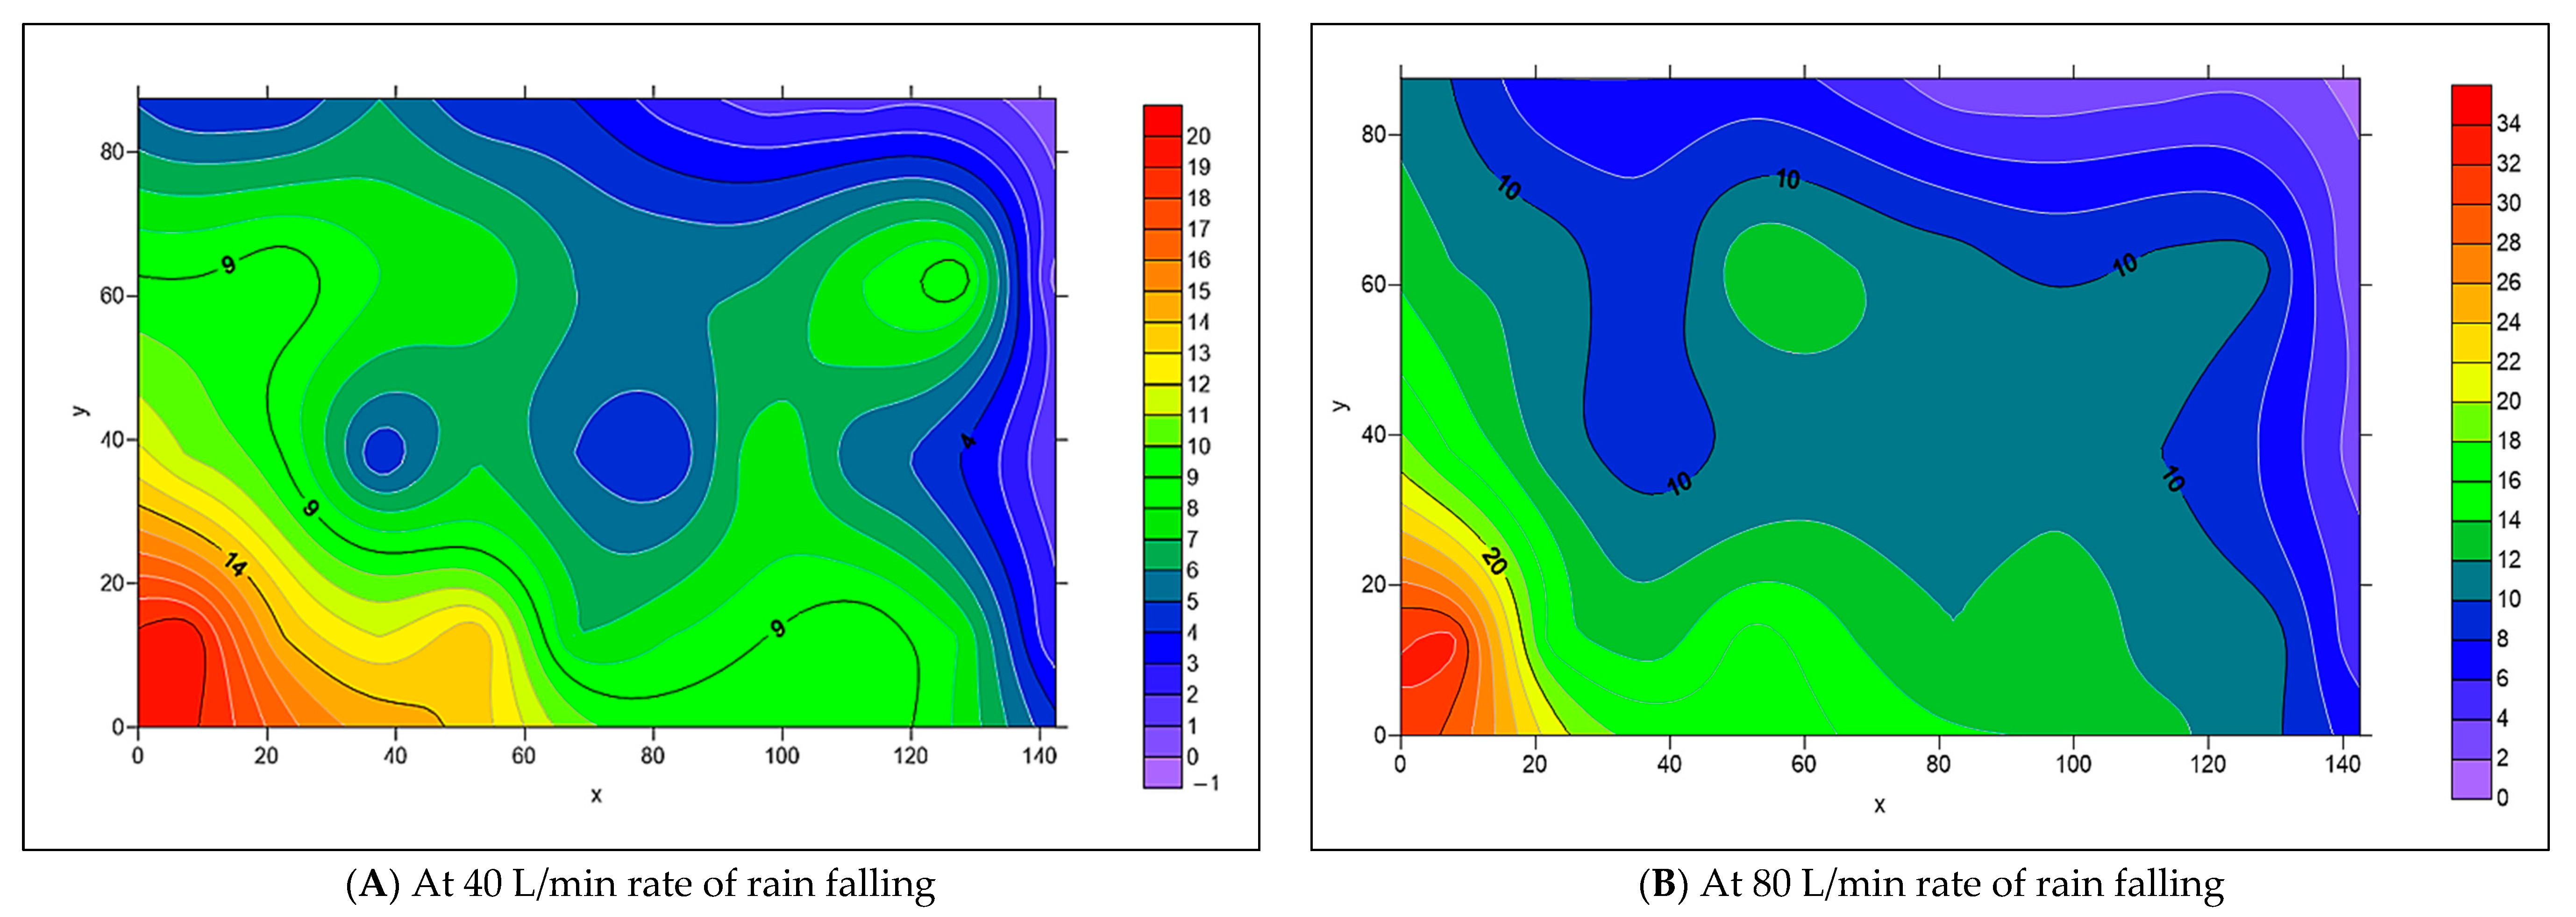
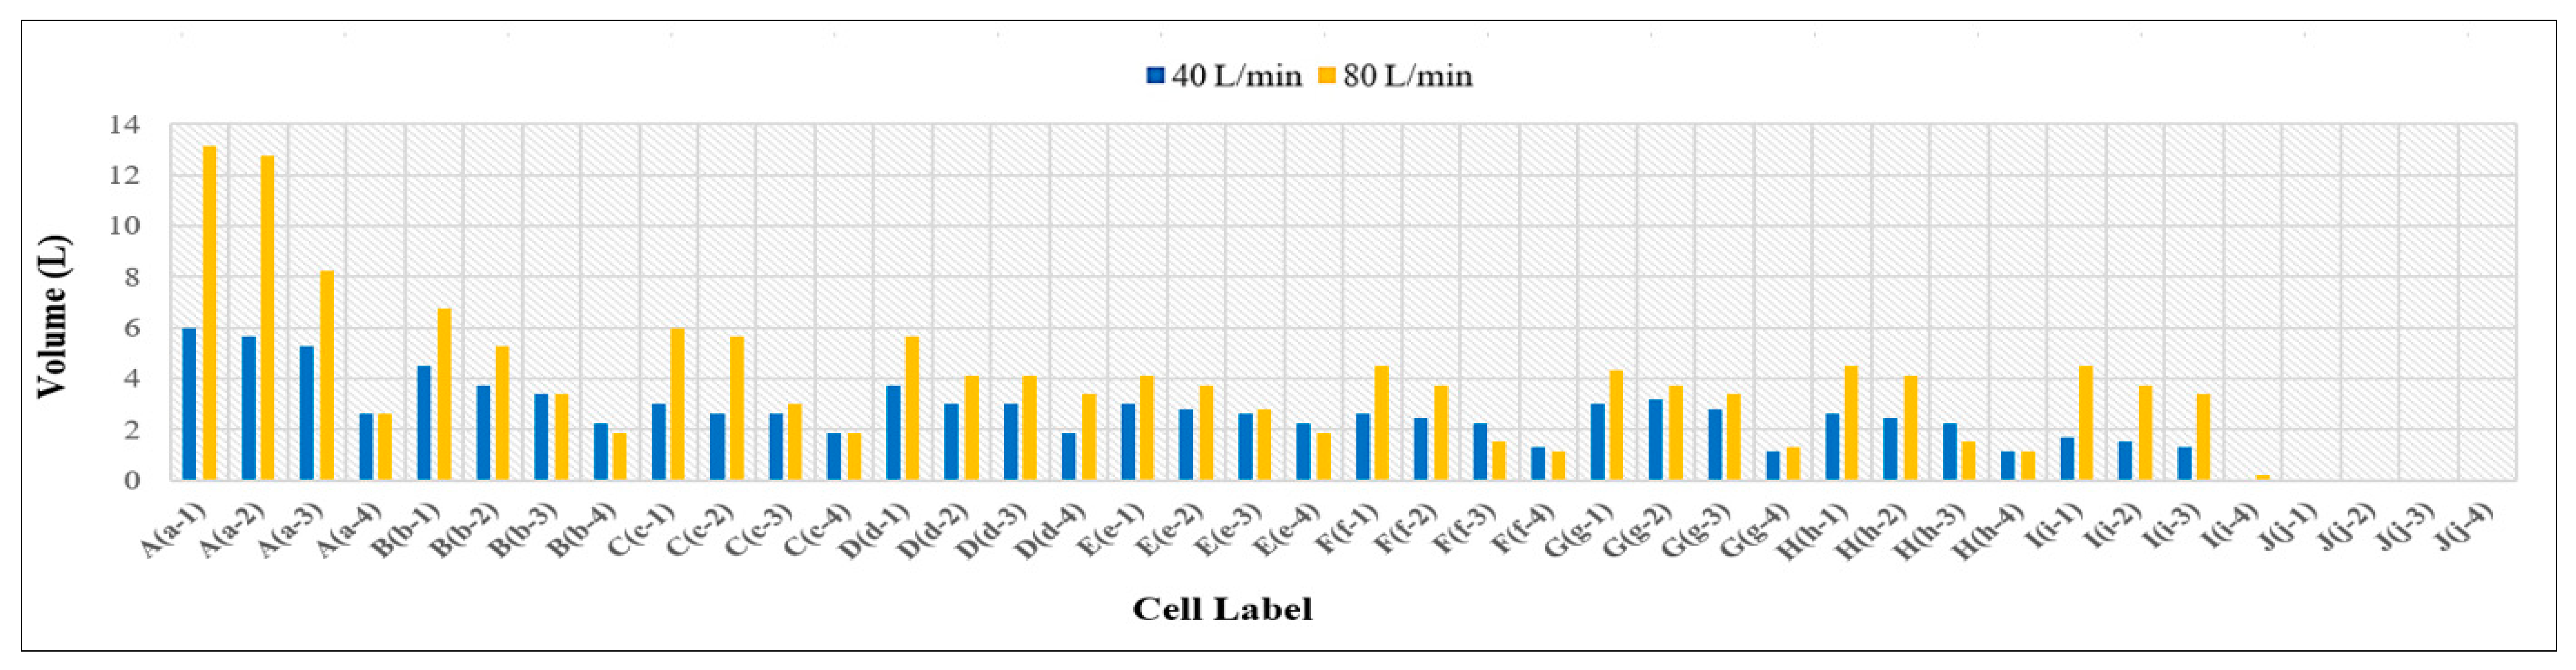
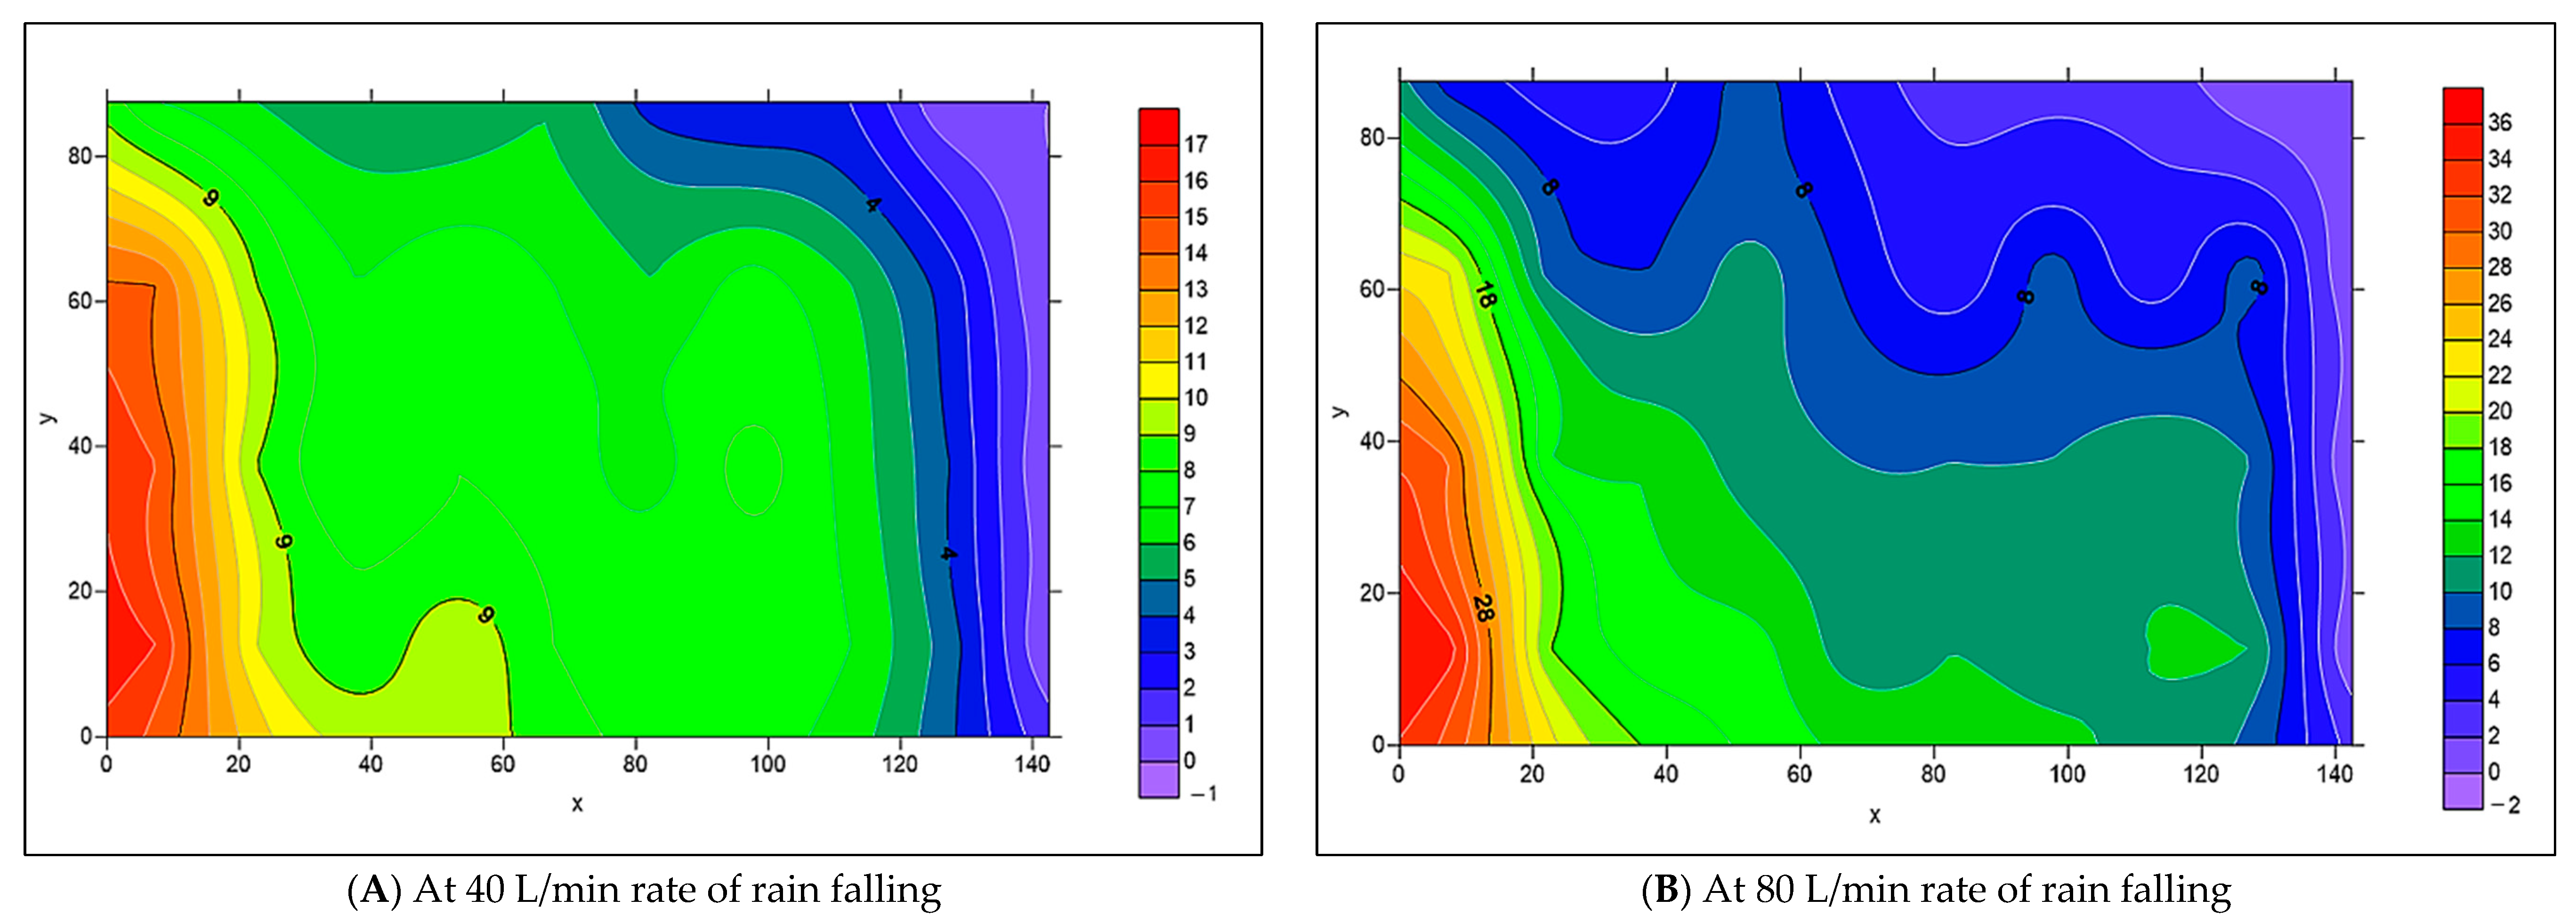
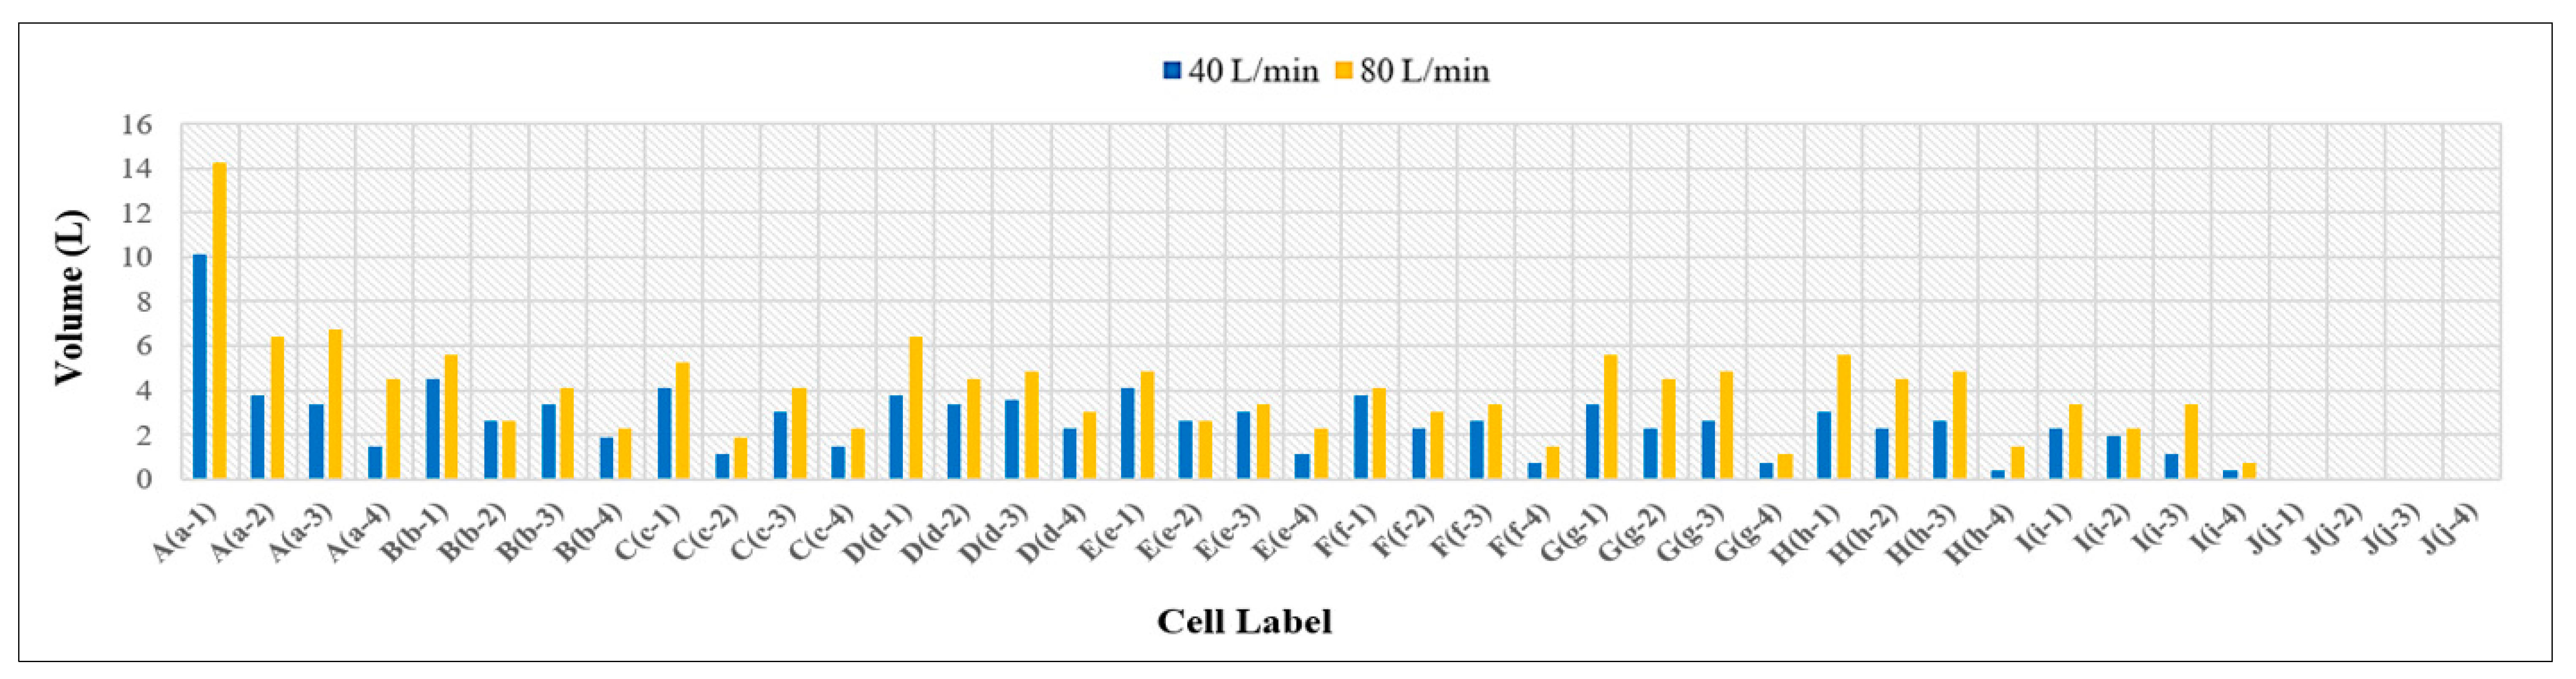
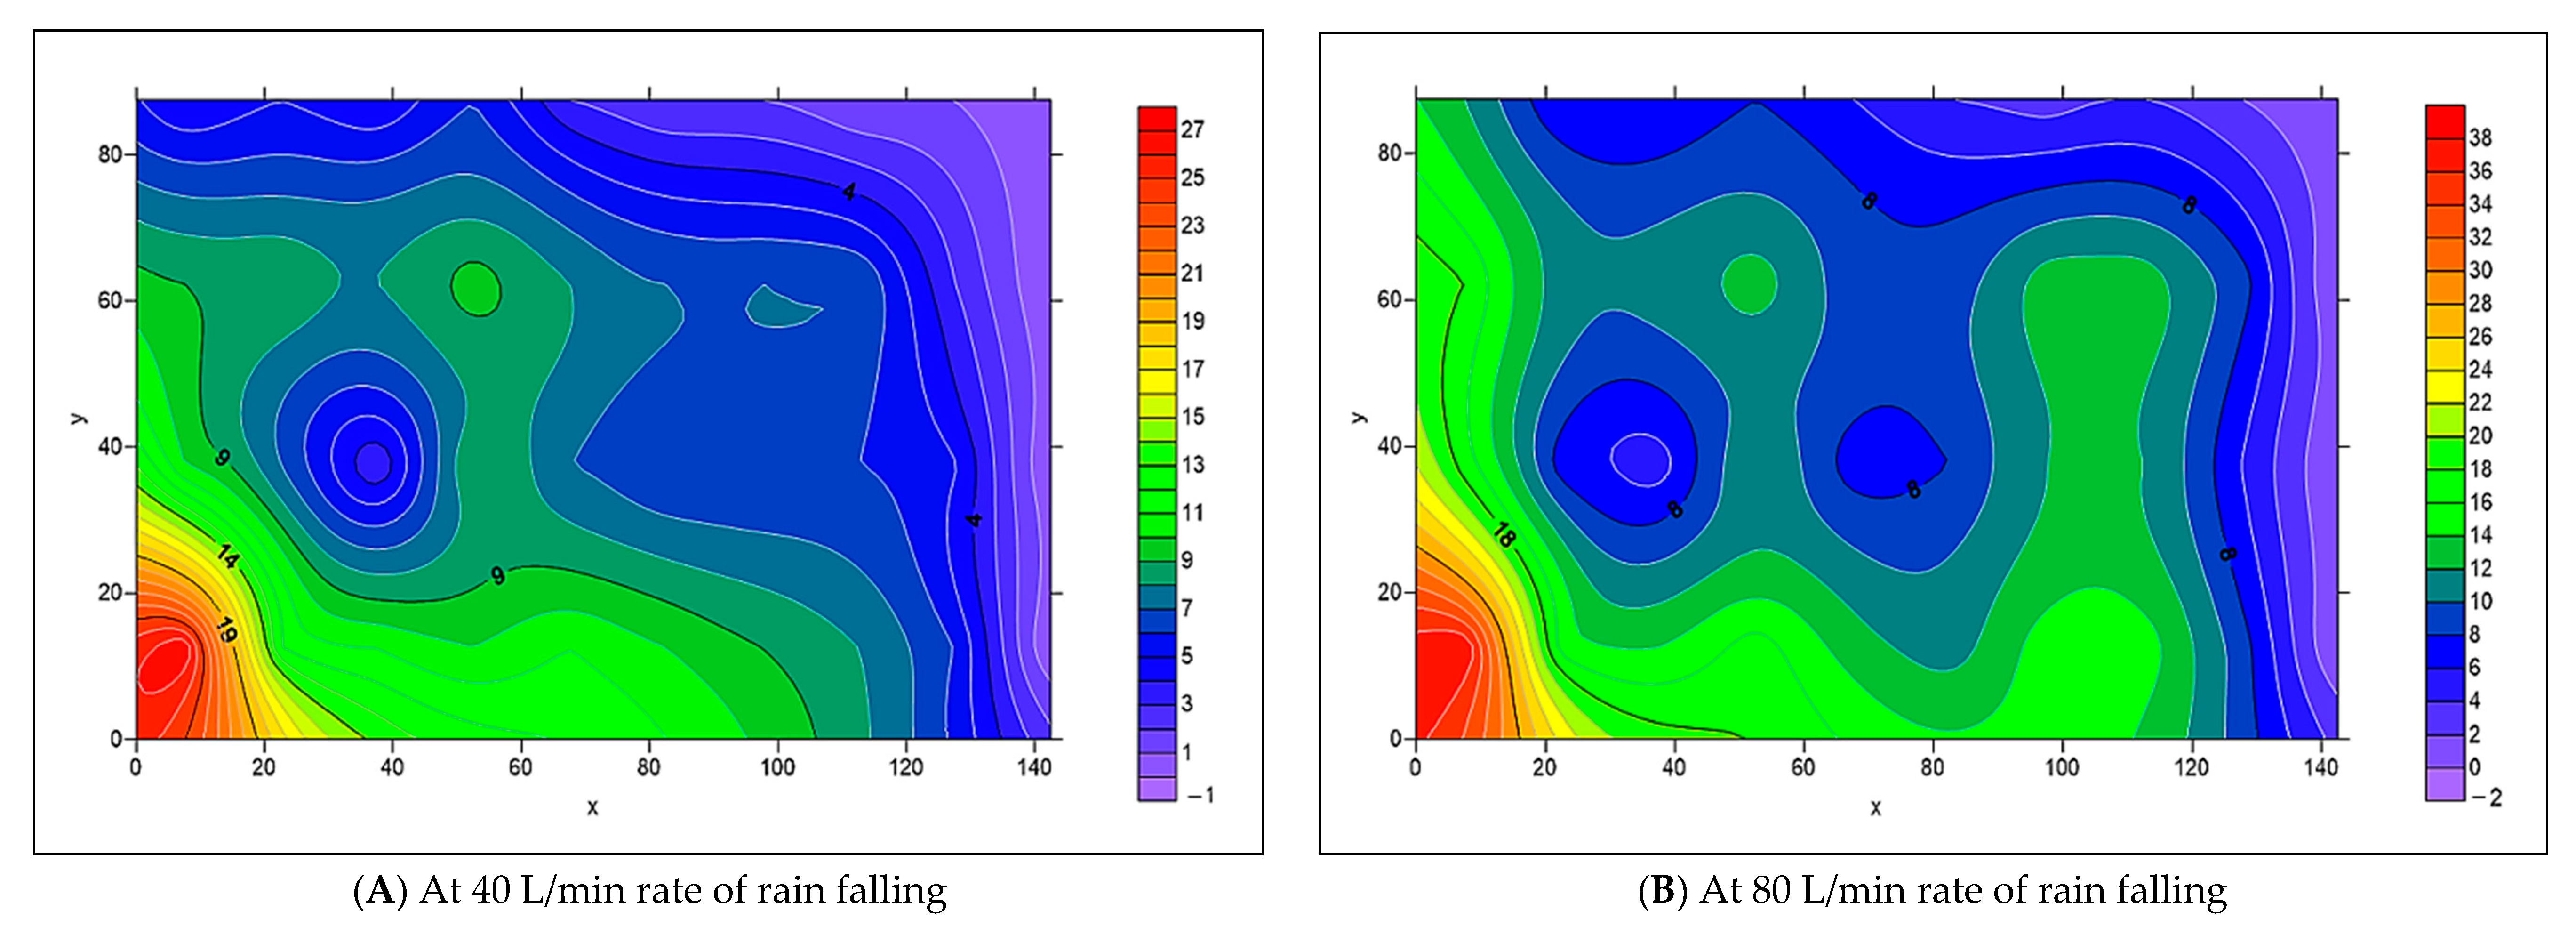
3.2. The Spread of Infiltrated Water Throughout the PICP Layers
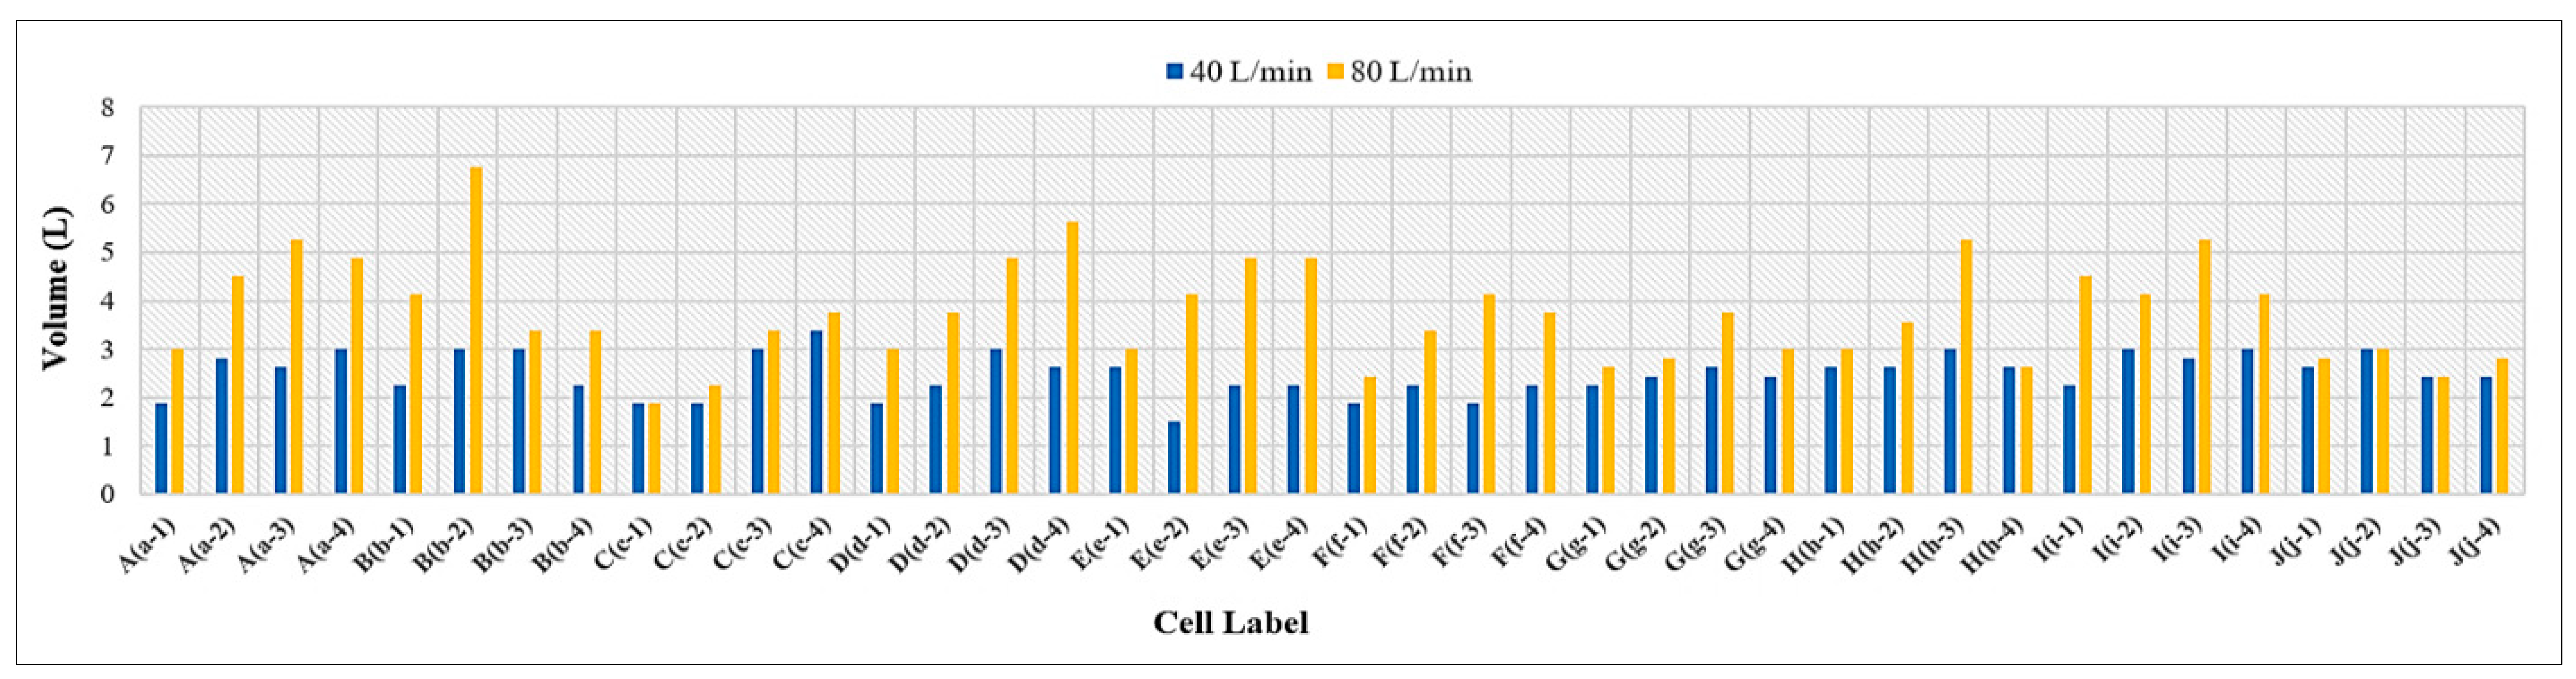
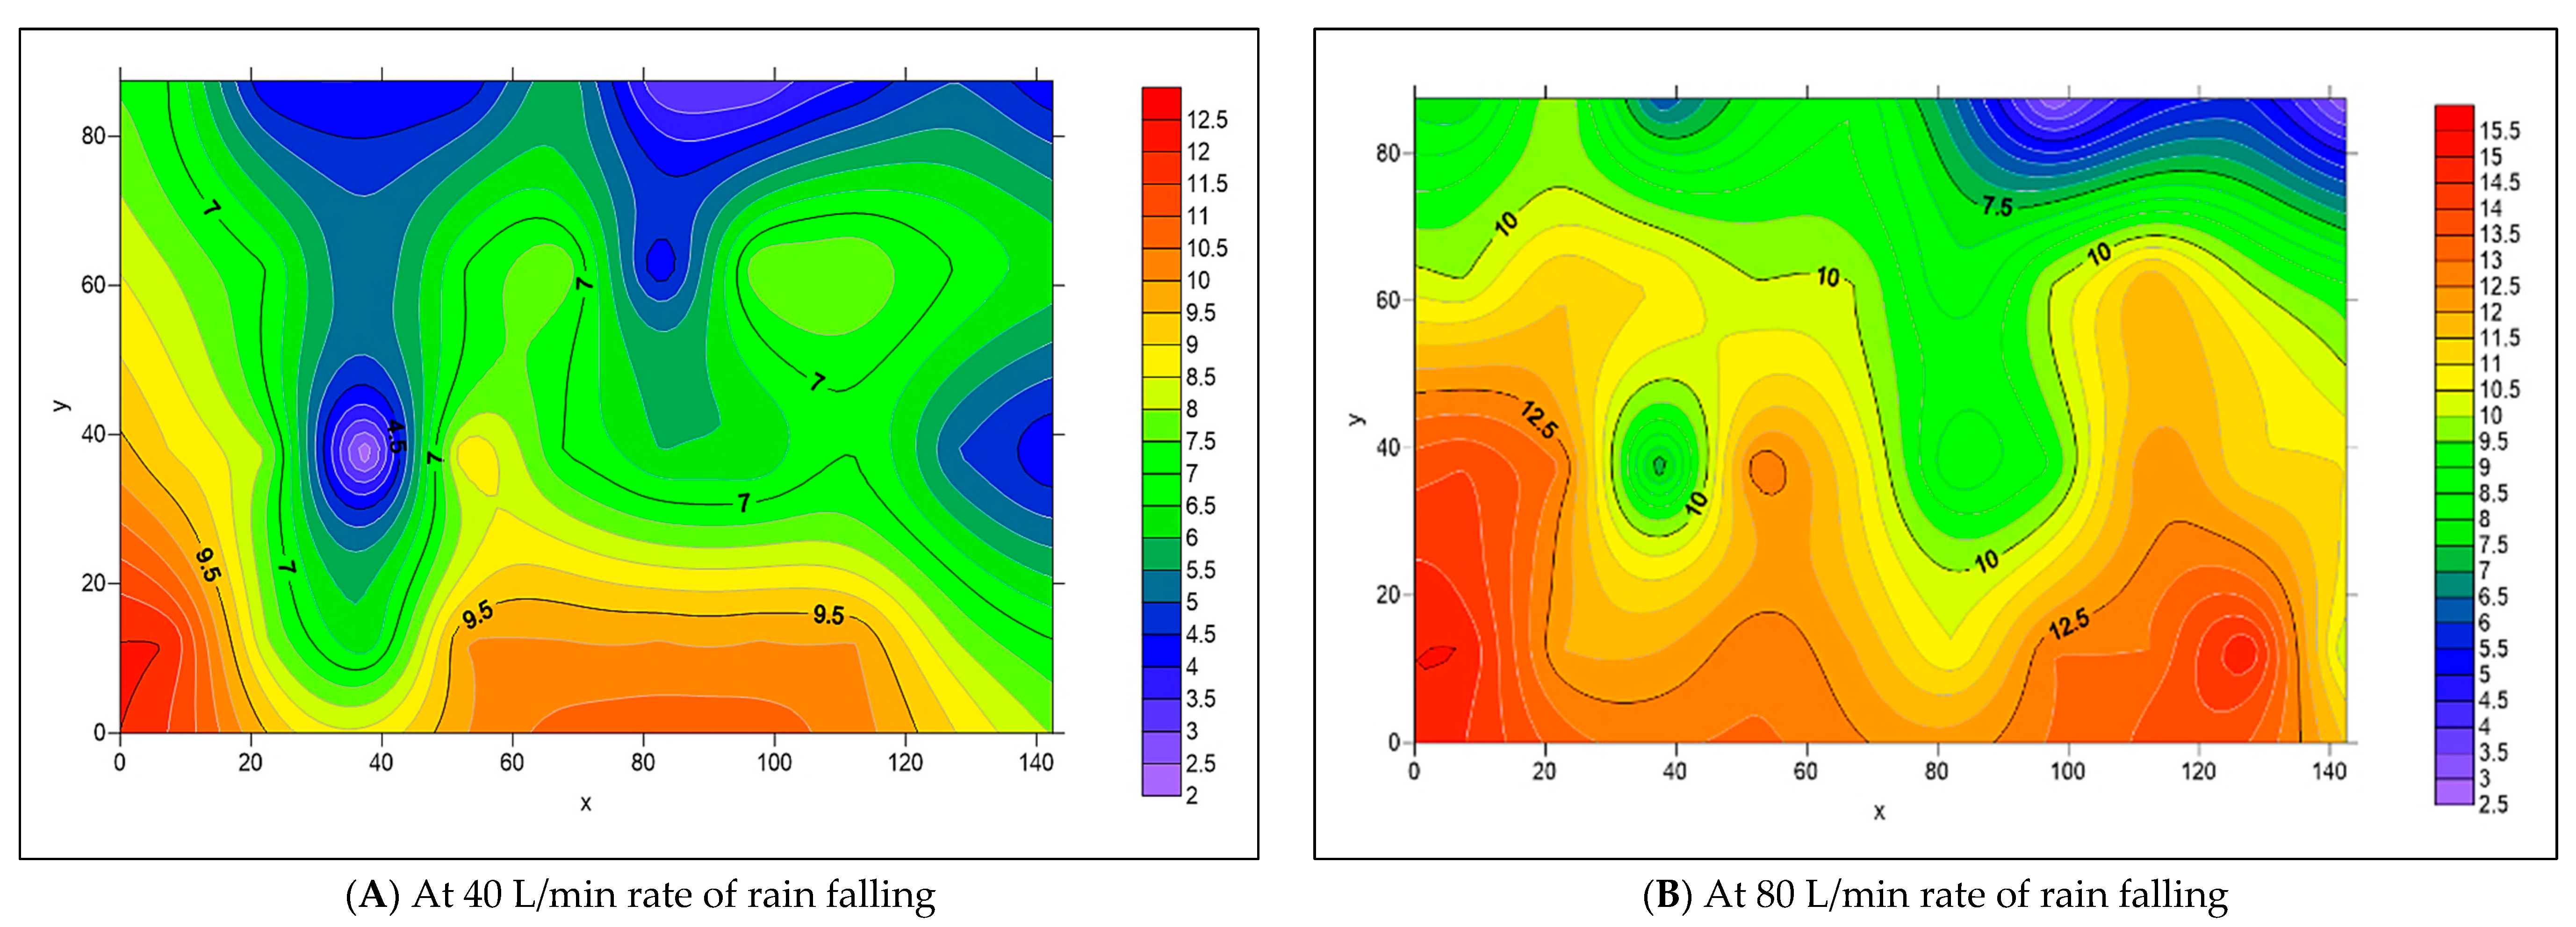
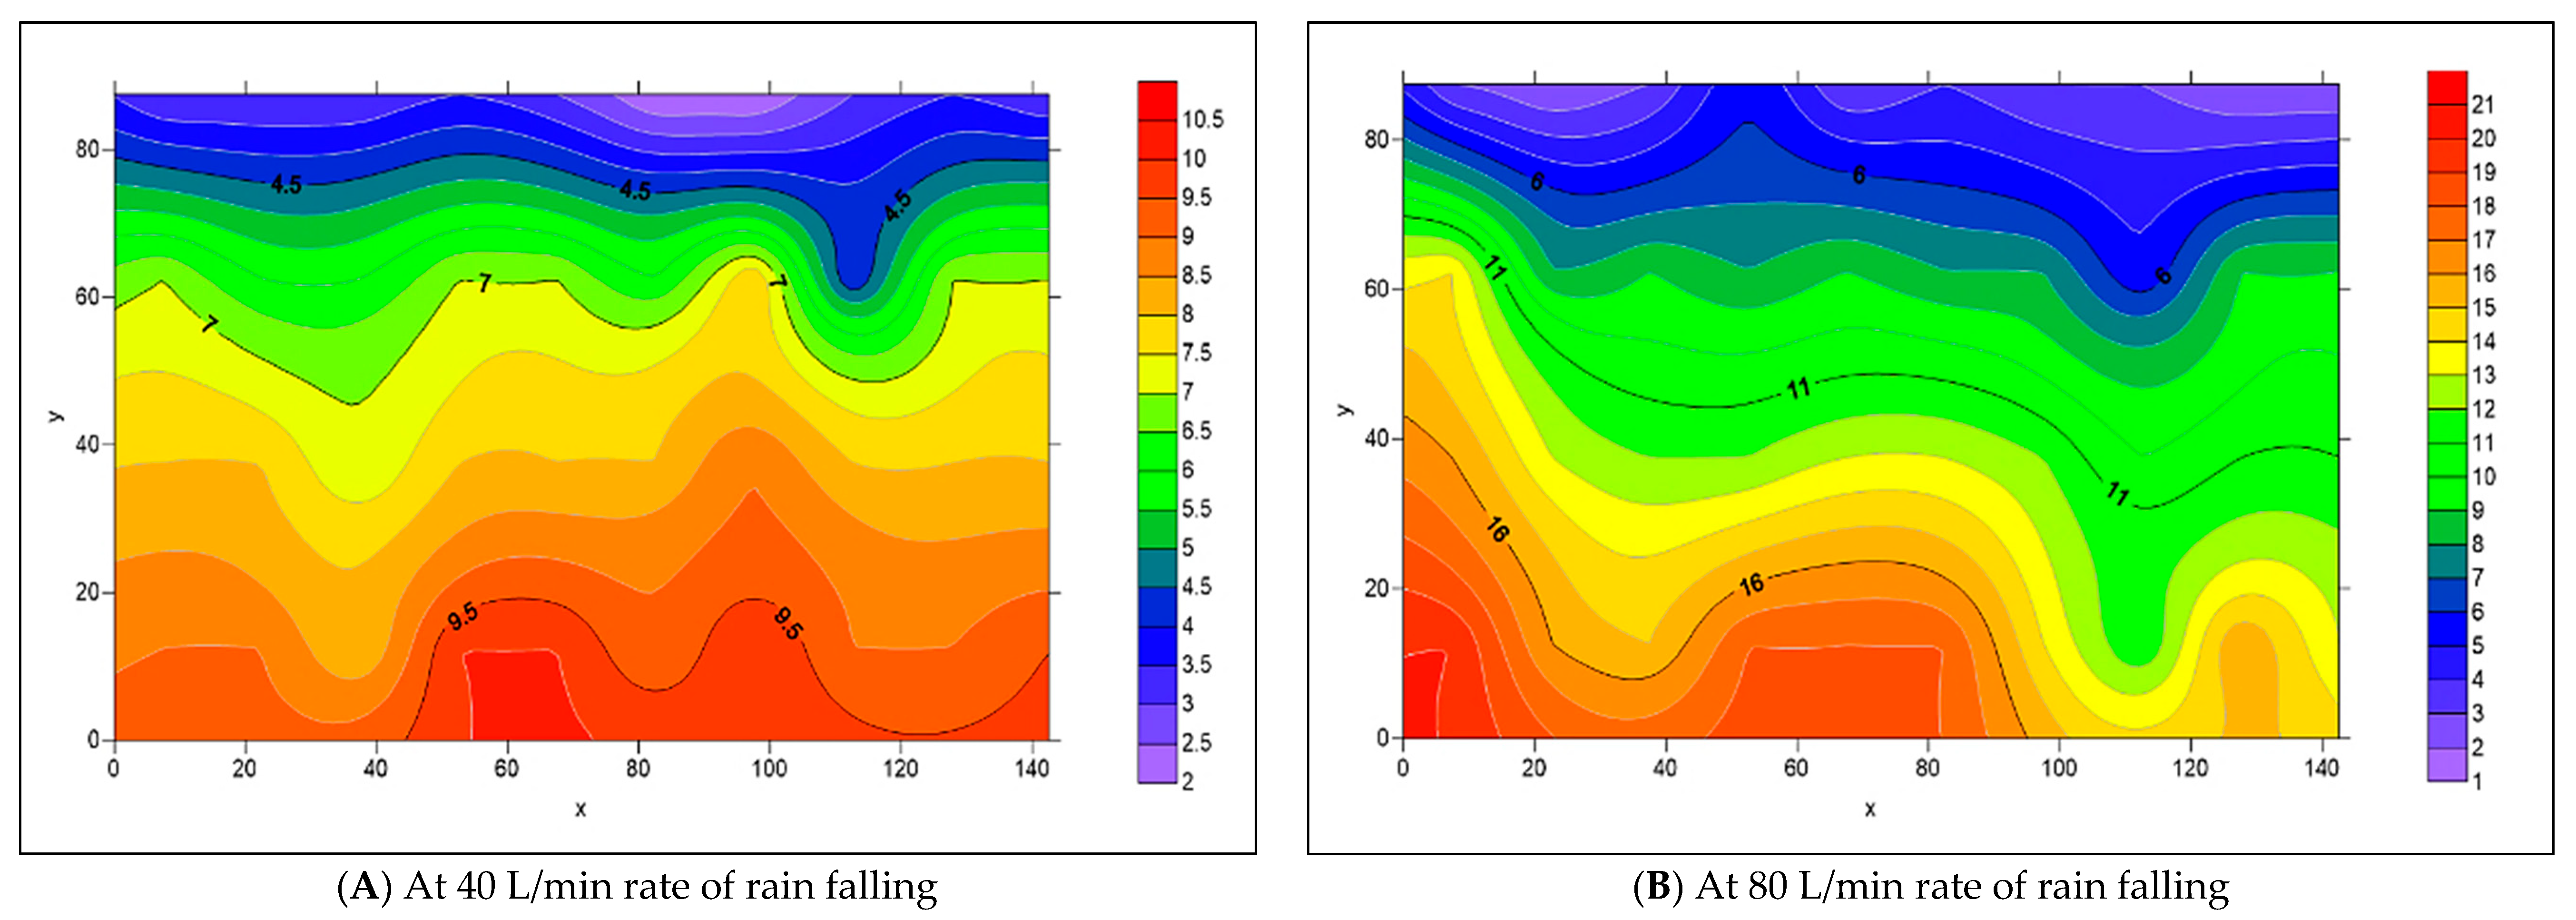
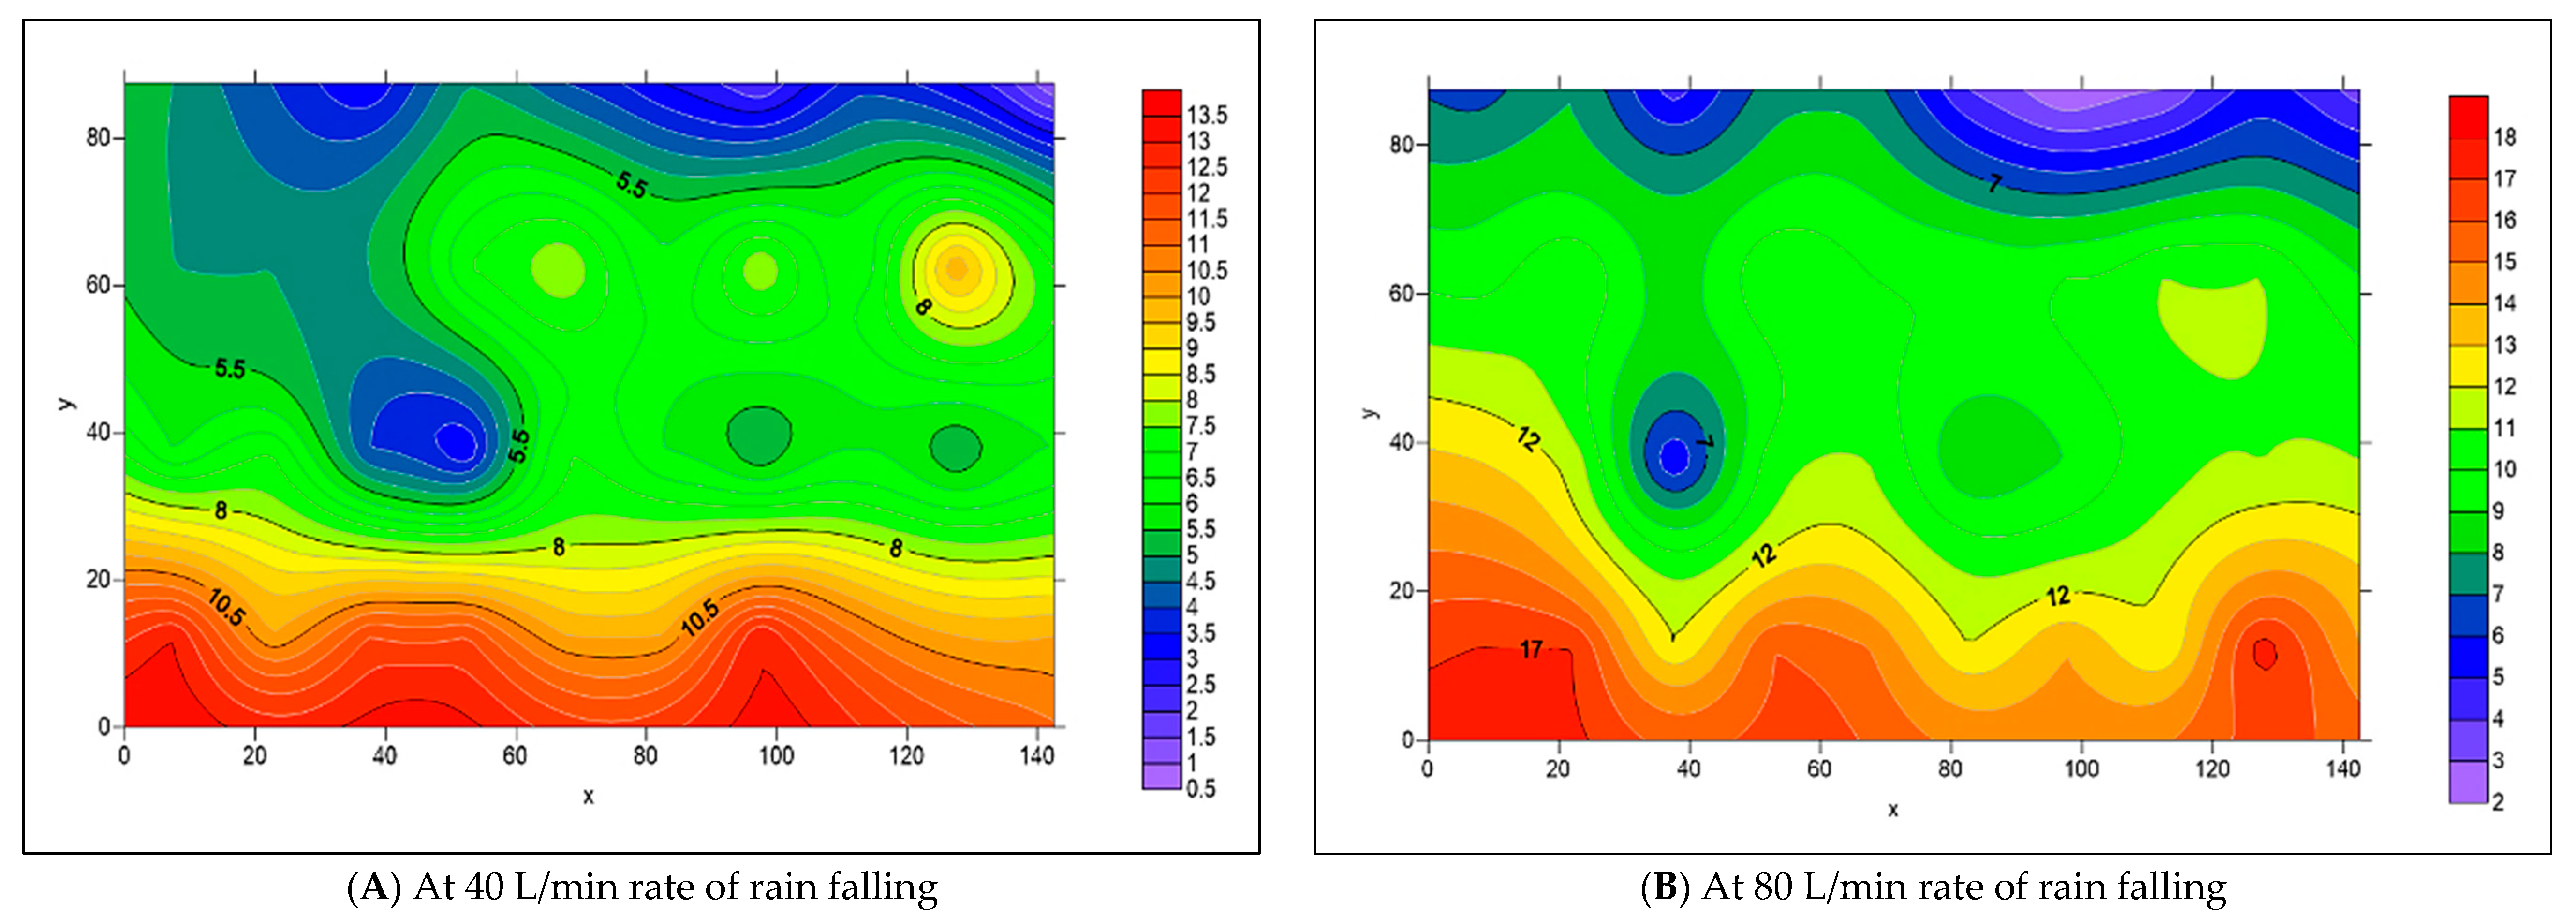
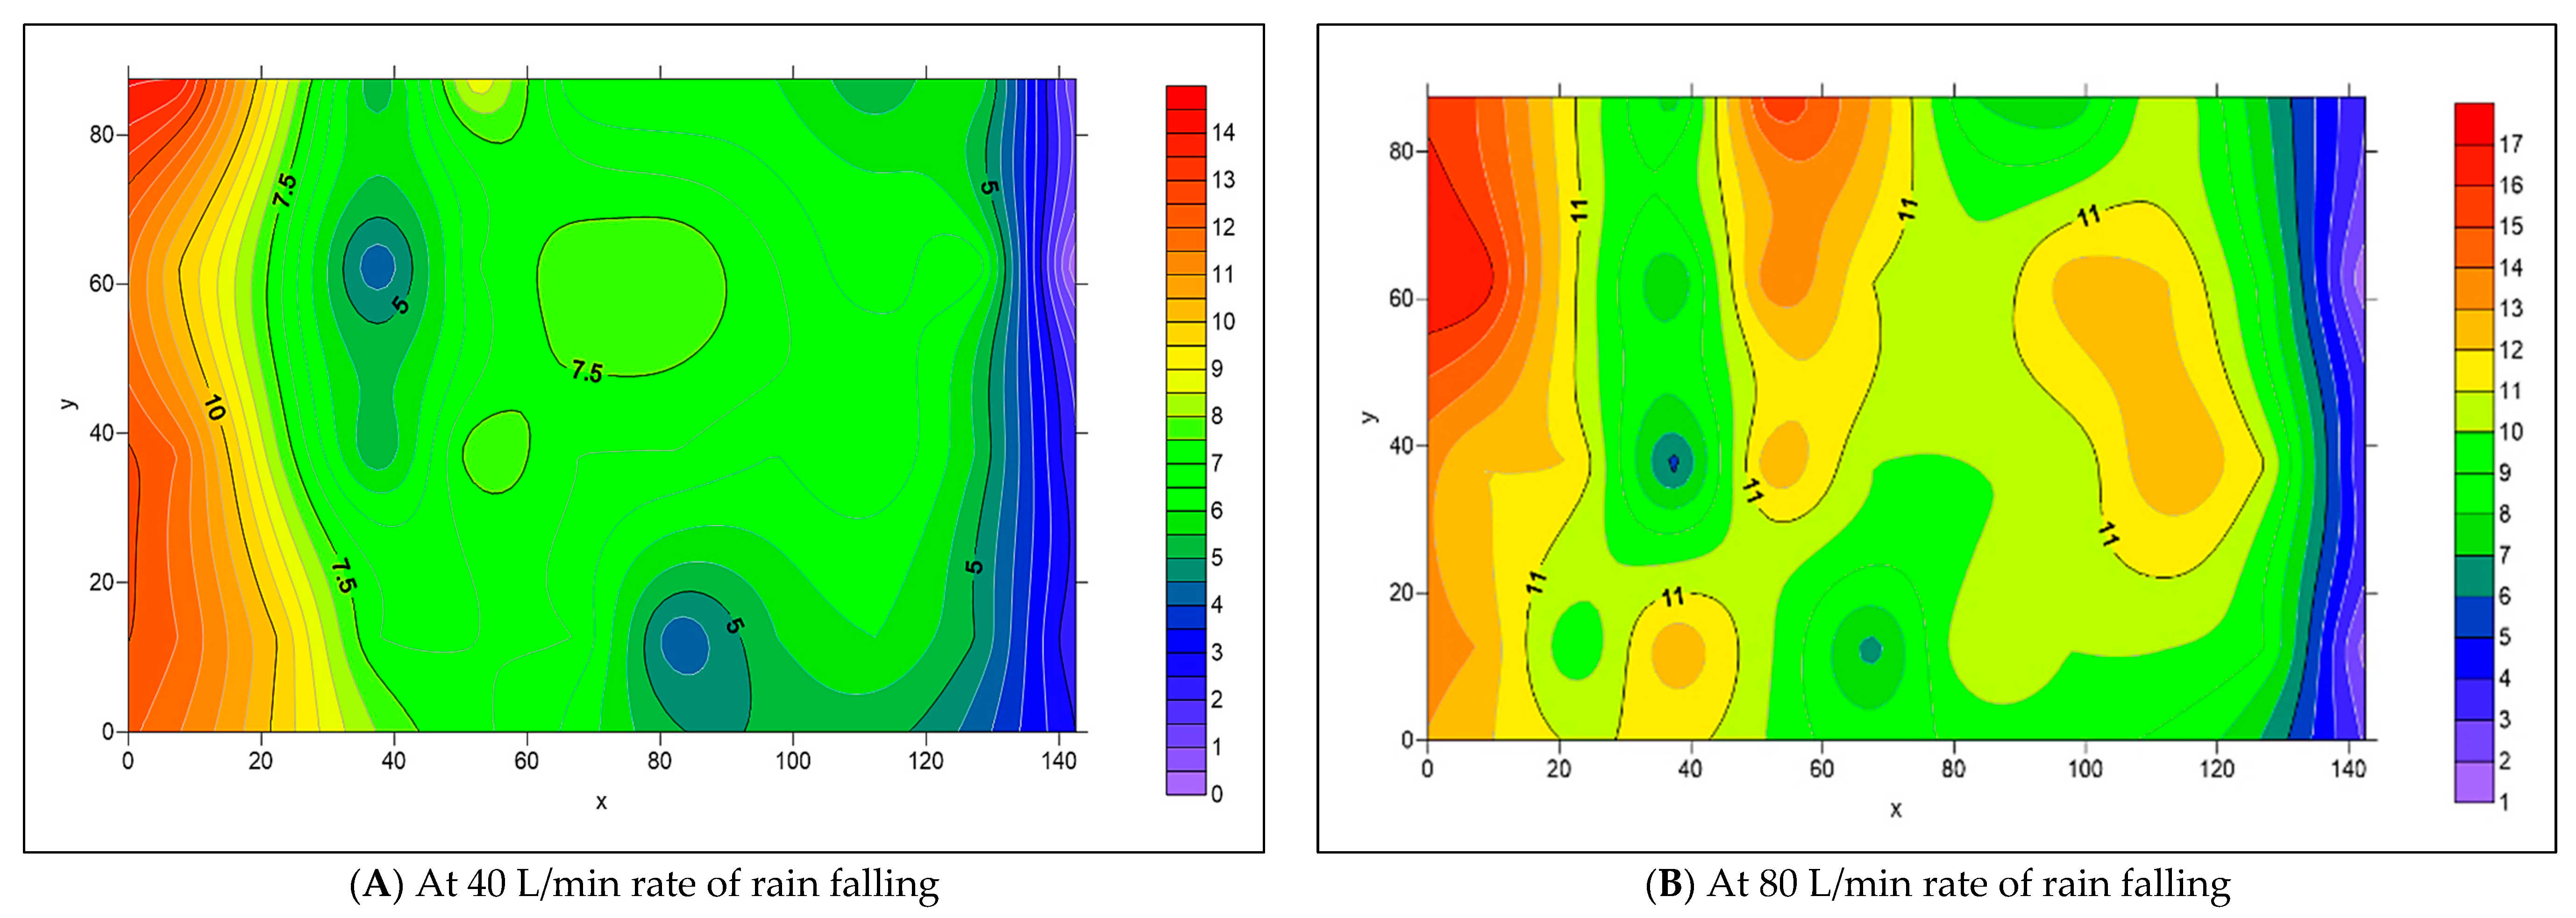
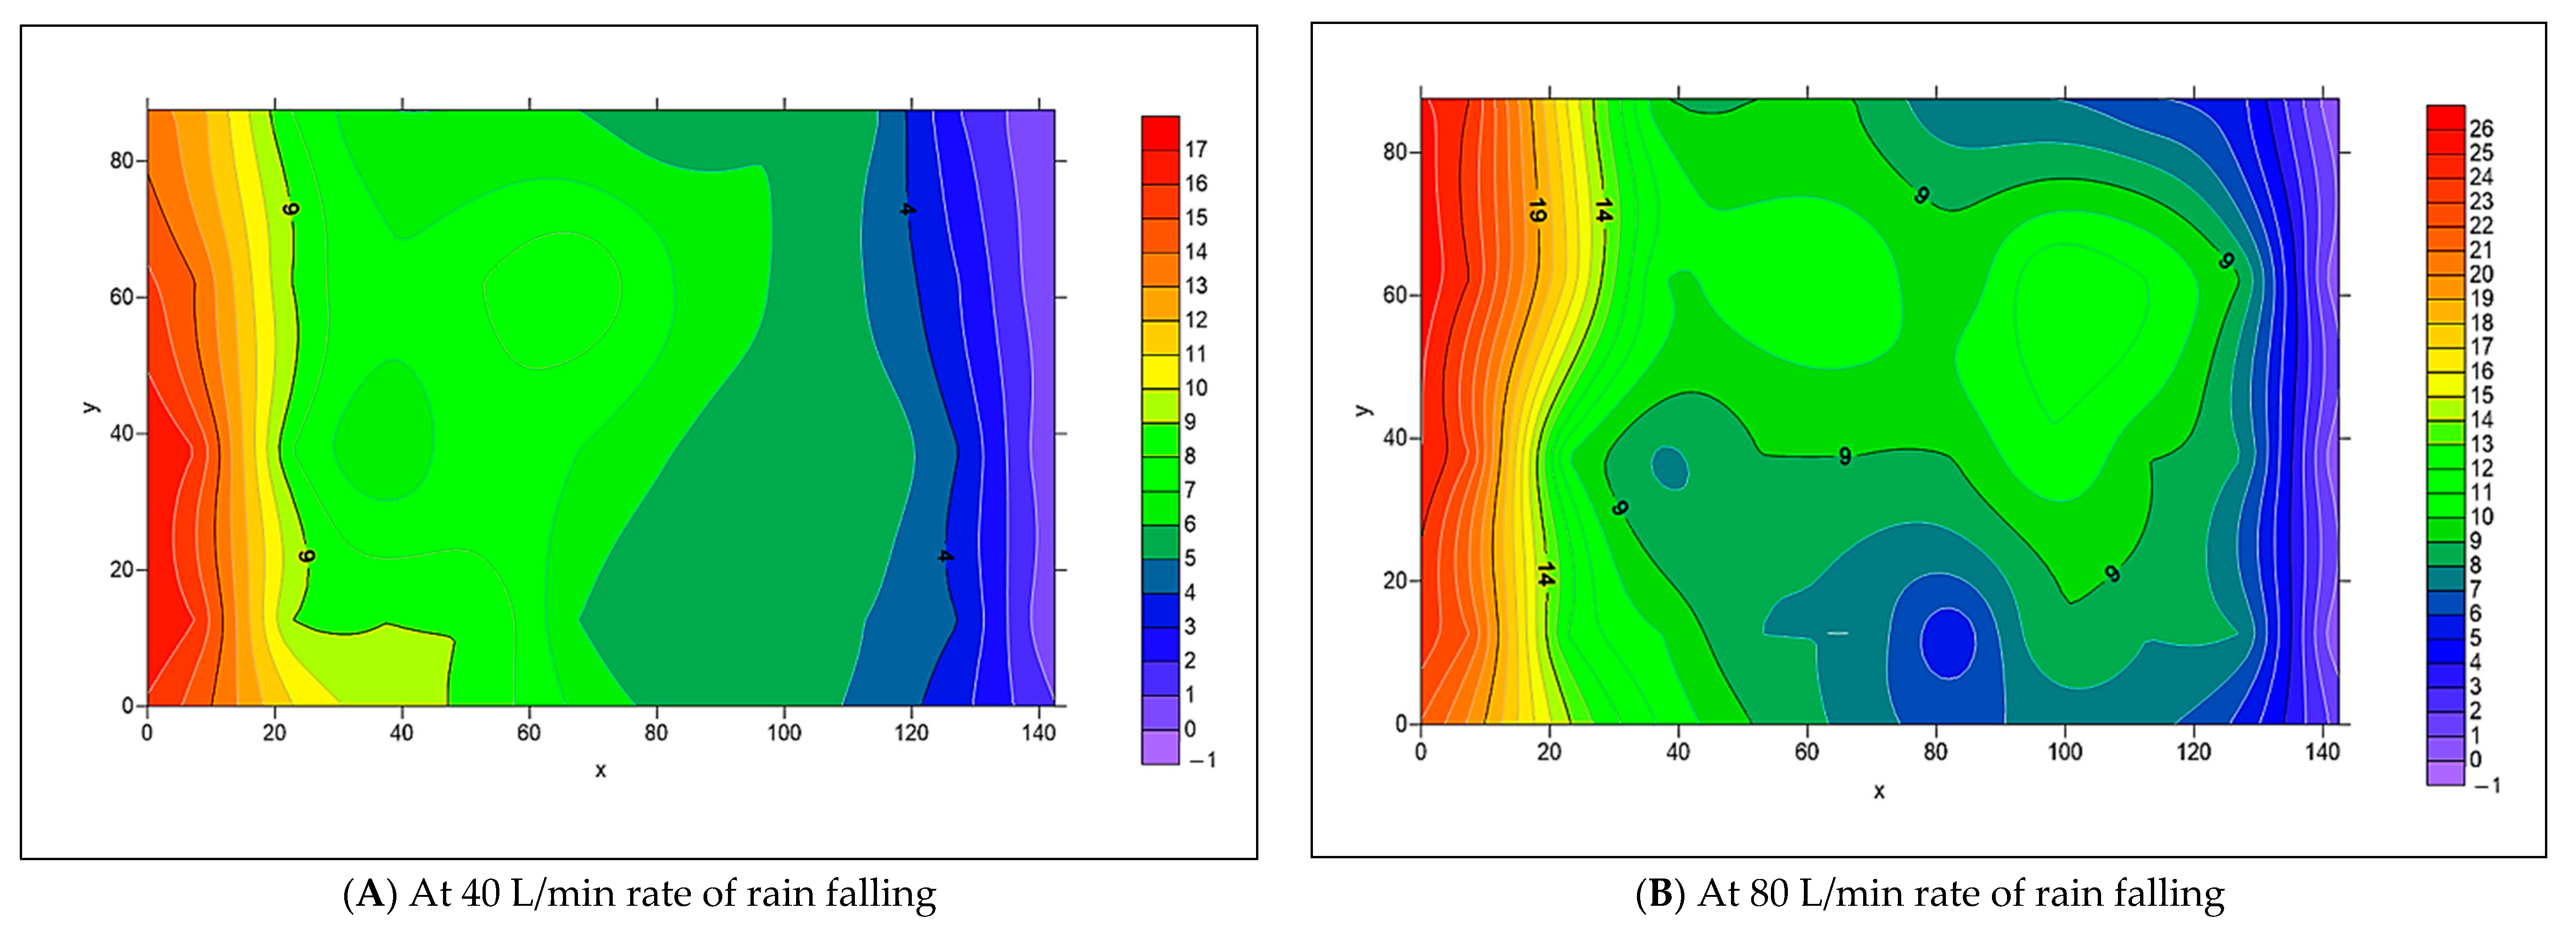
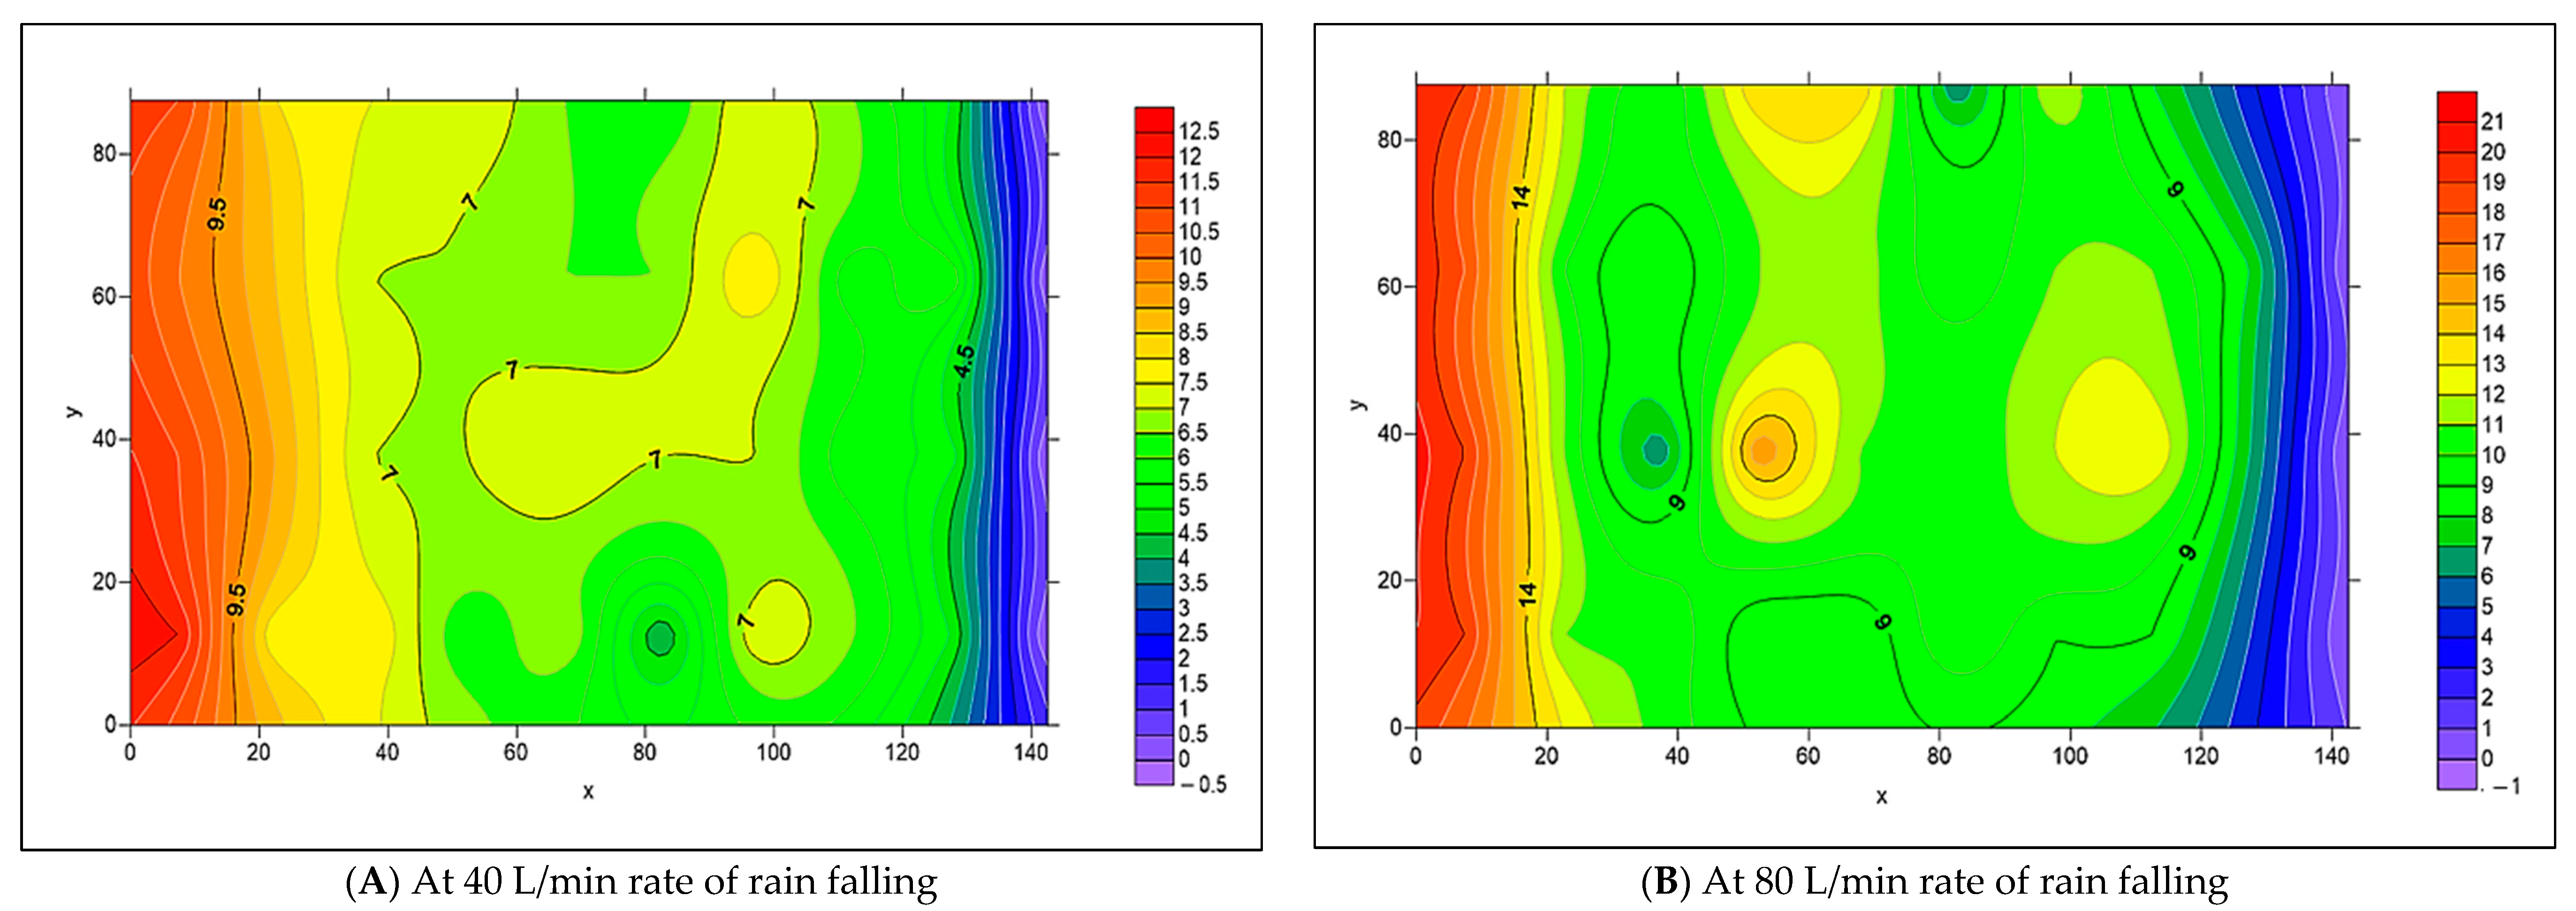
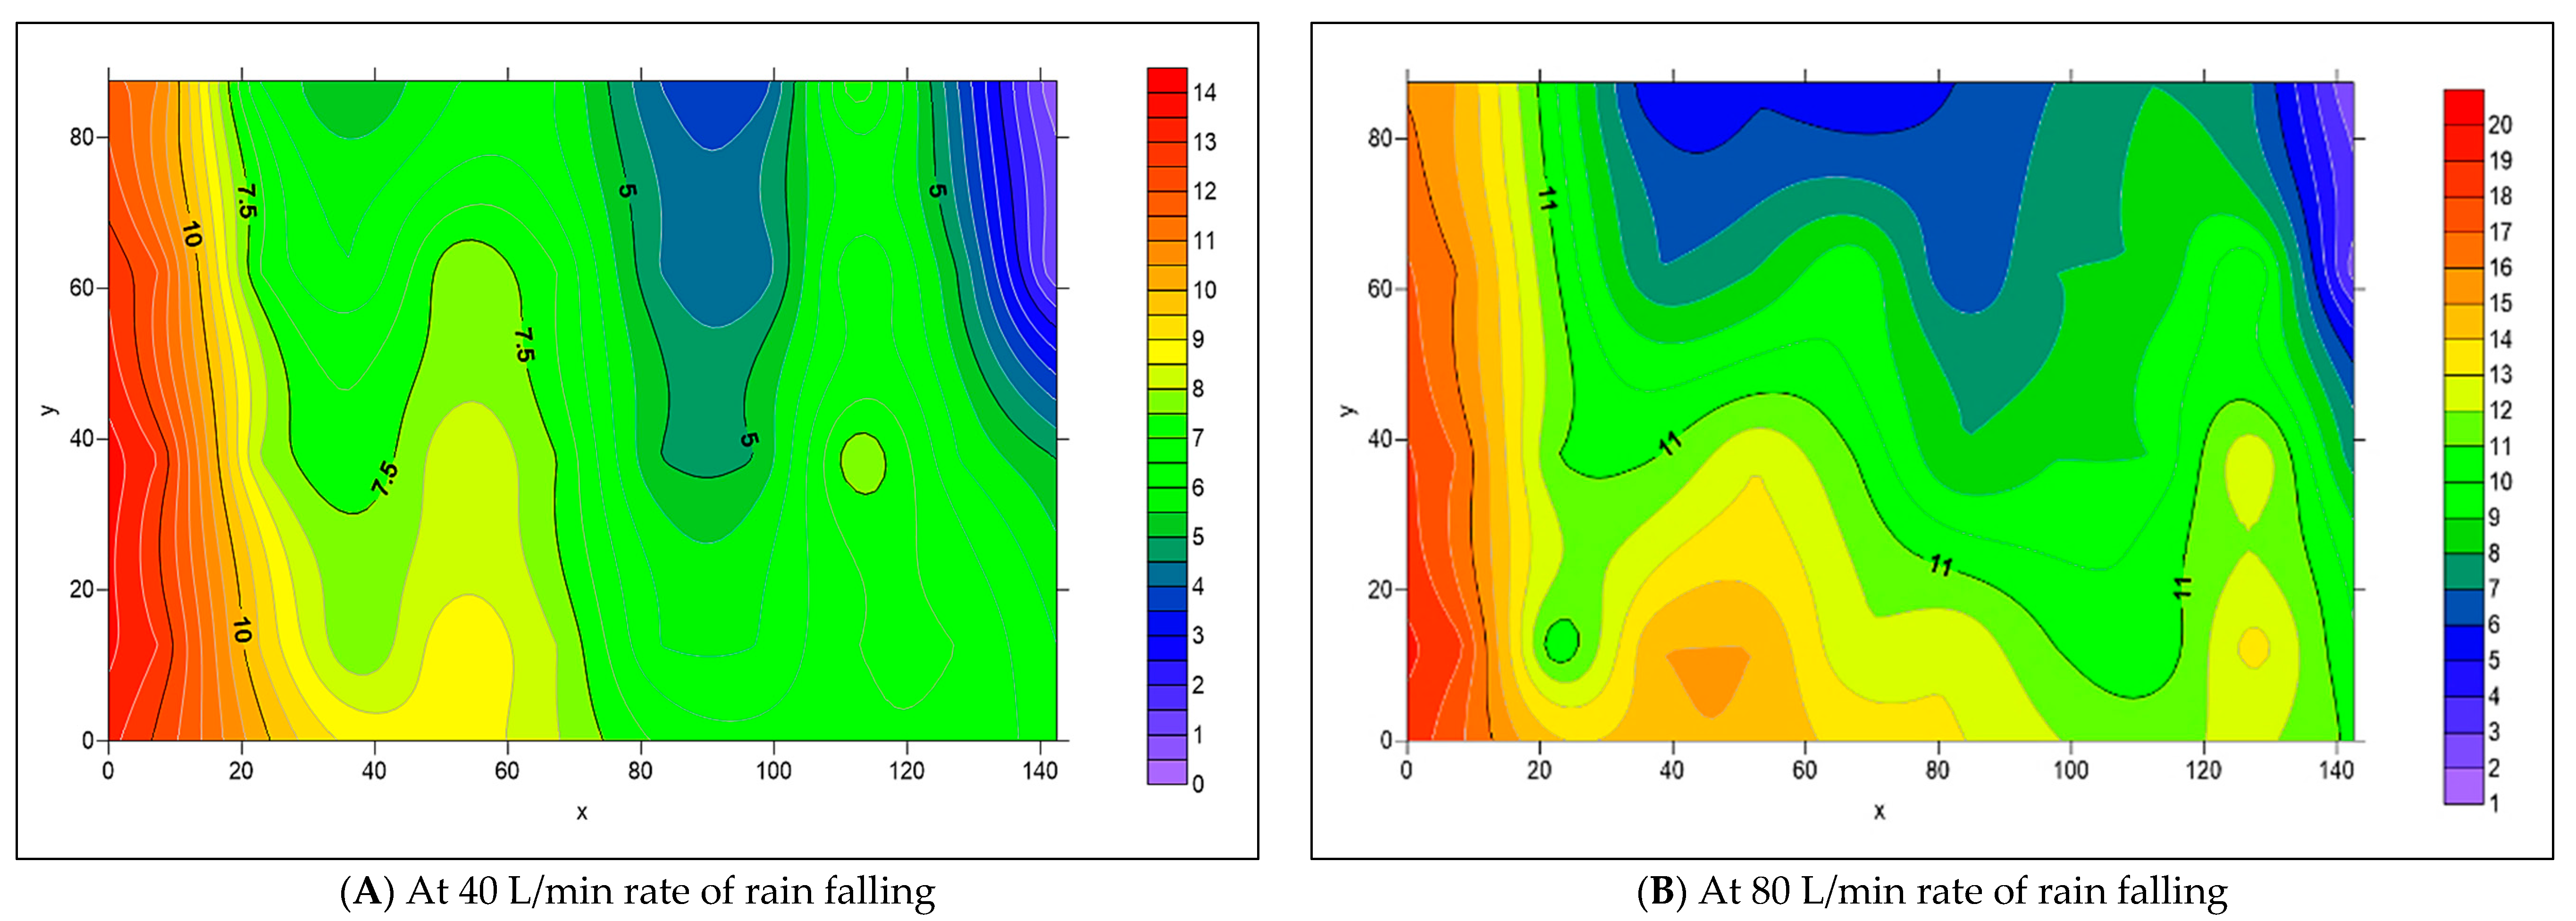
The spread of water under the layers of PICP is largely influenced by the longitudinal slope (L-Slope) and transverse slope (T-Slope) of the surface paver. To analyze the water distribution within the PICP layers, the volume of water collected in the containers can be directly measured. In addition, Surfer 2.0 software has been used to simulate the distribution of water, whereas the X-axis of the software represents the length of the pavement and the Y-axis is the width, as depicted in the cases below.

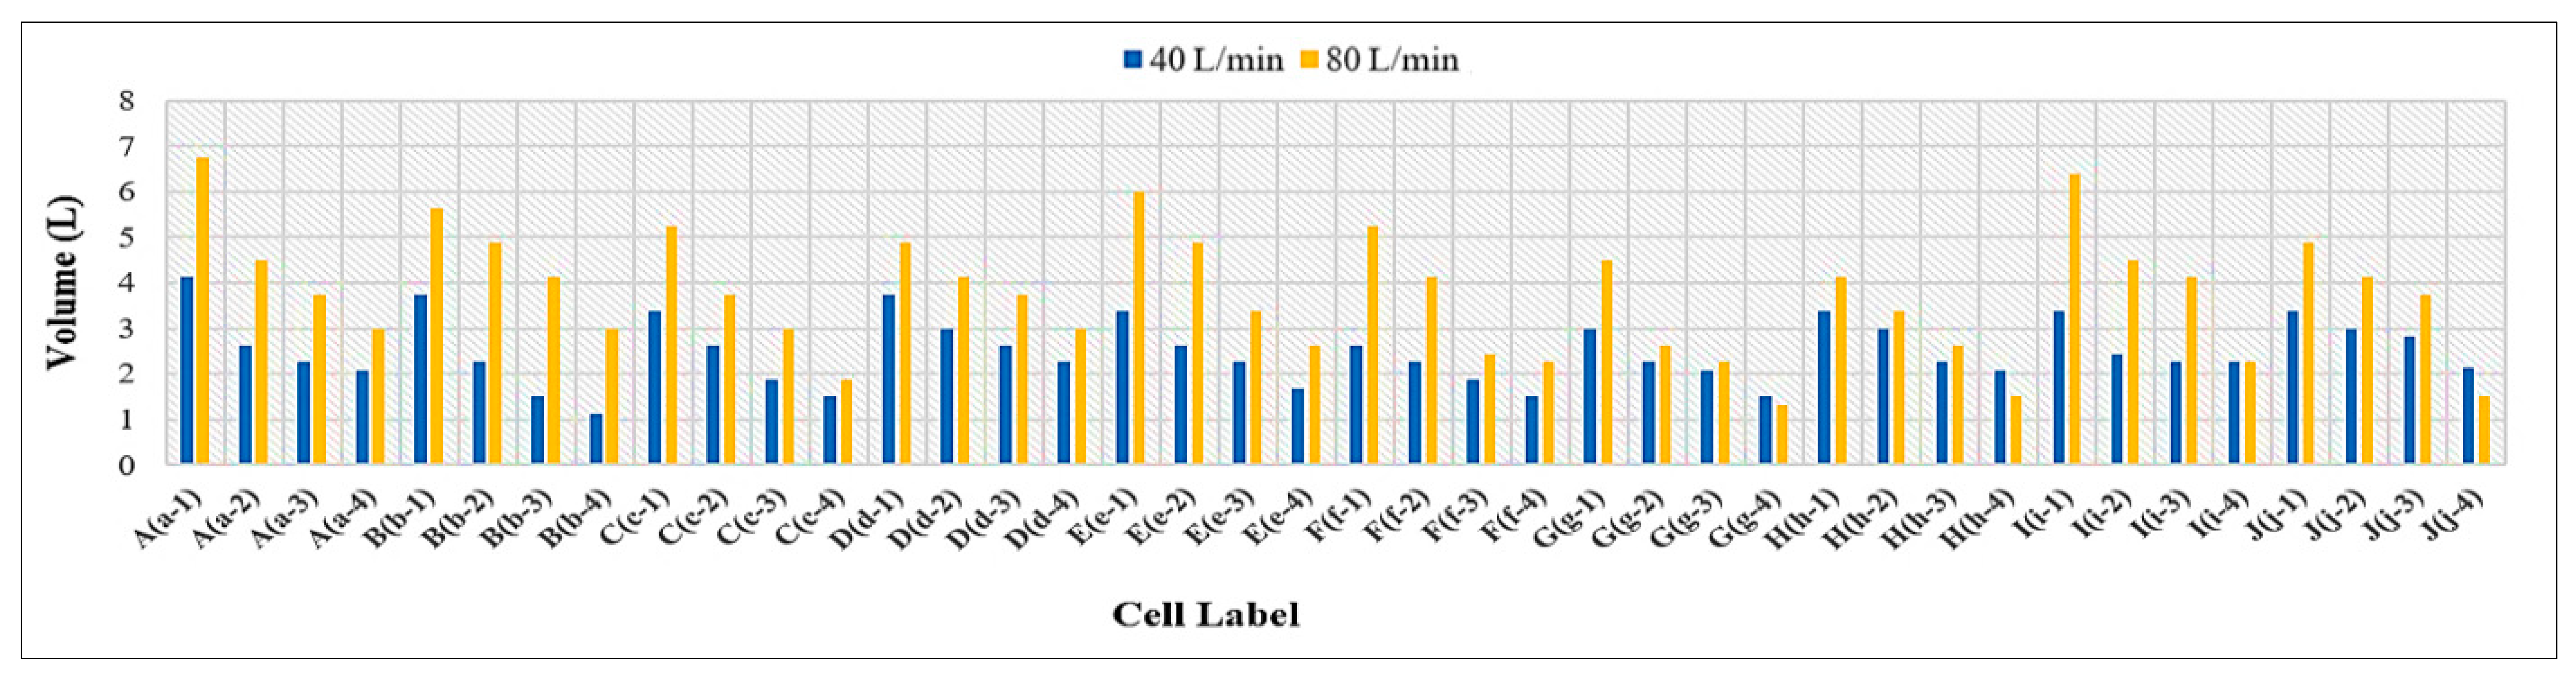
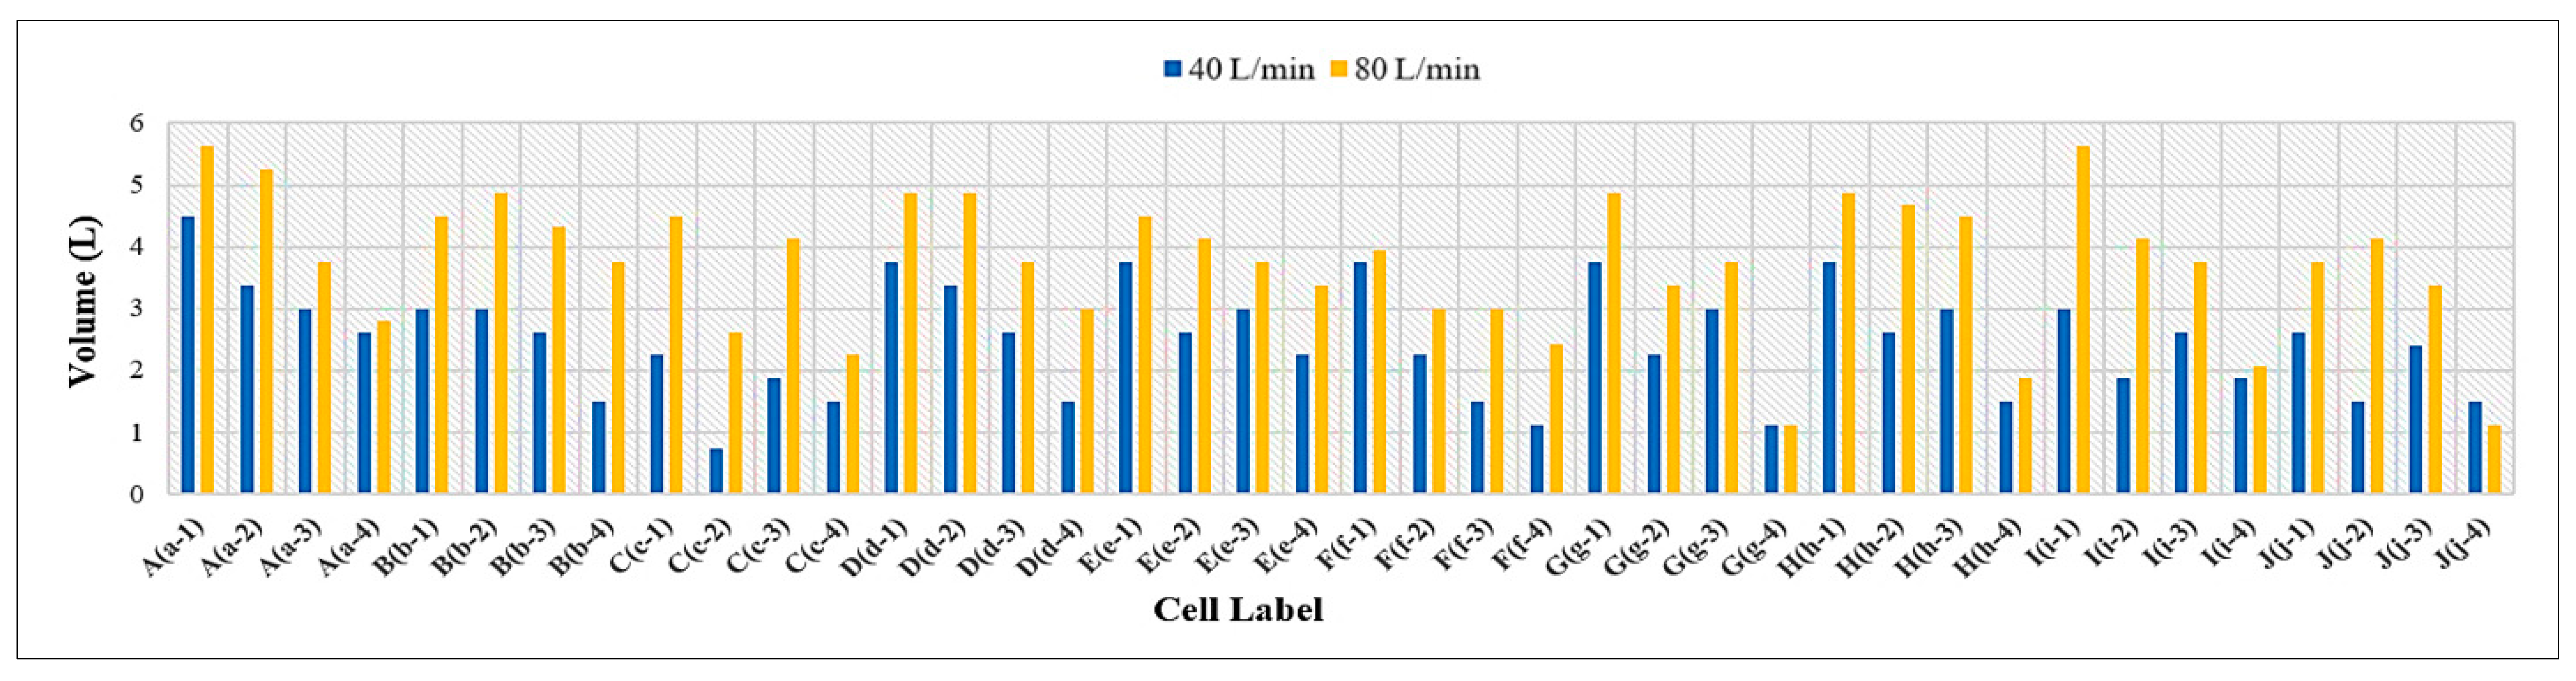
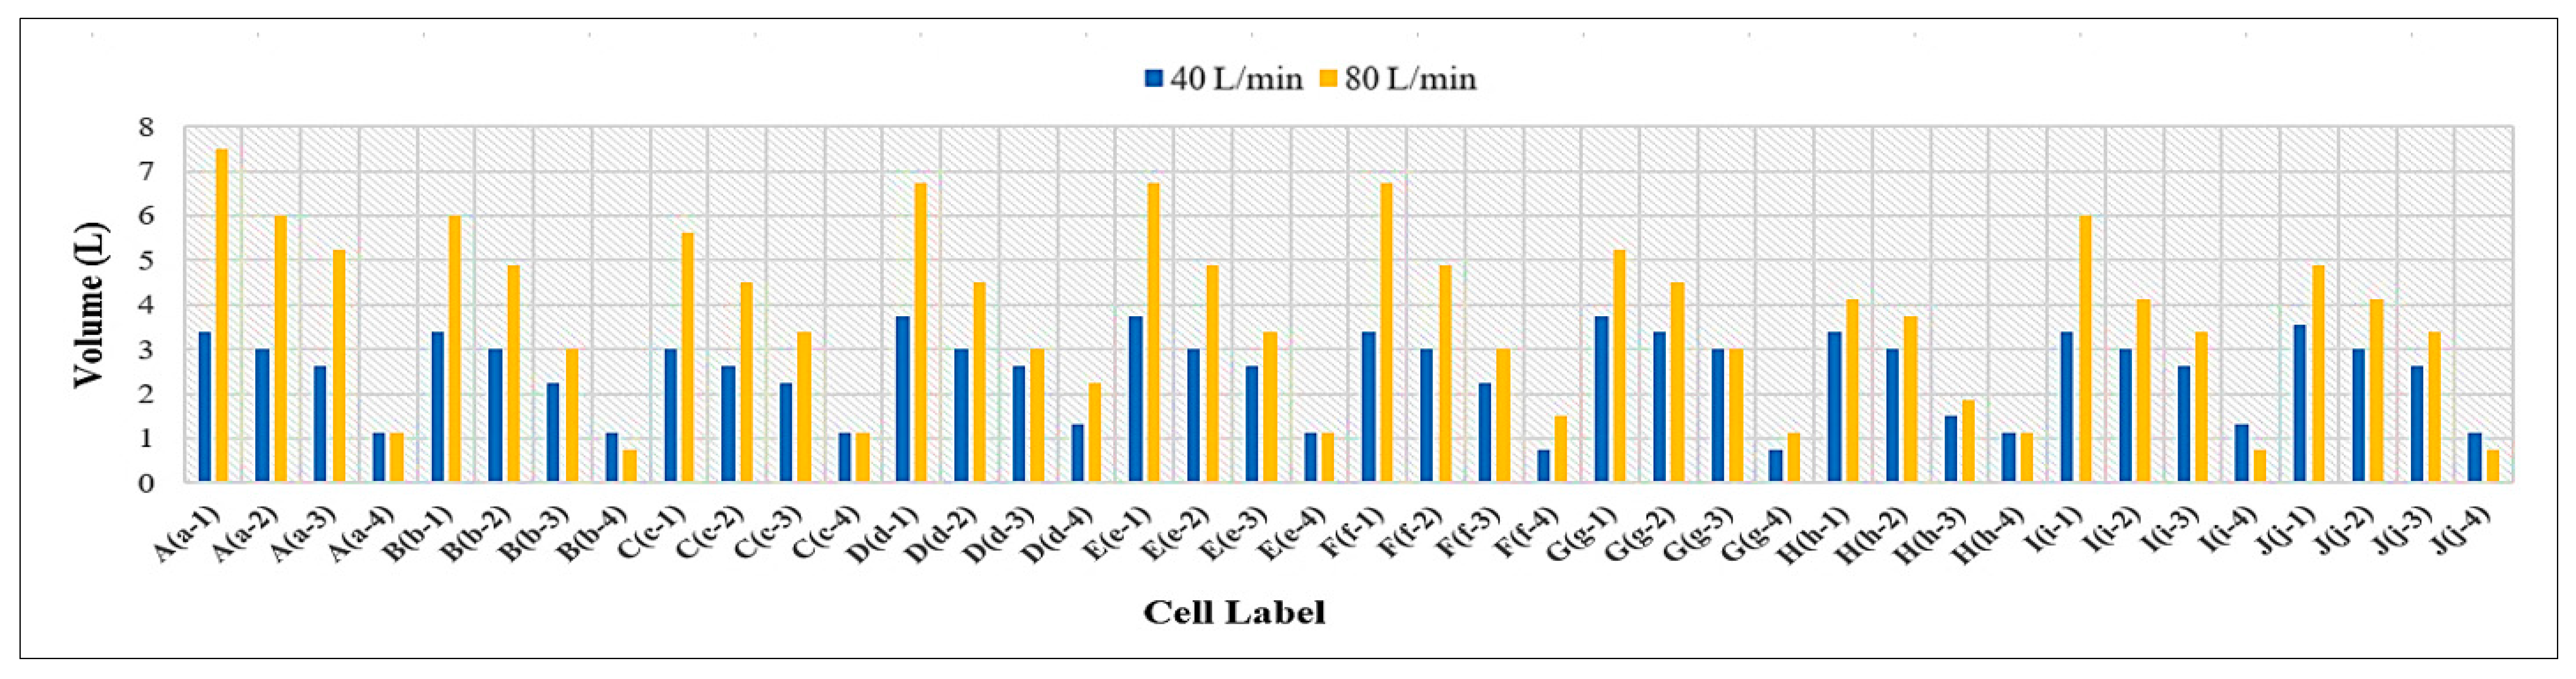
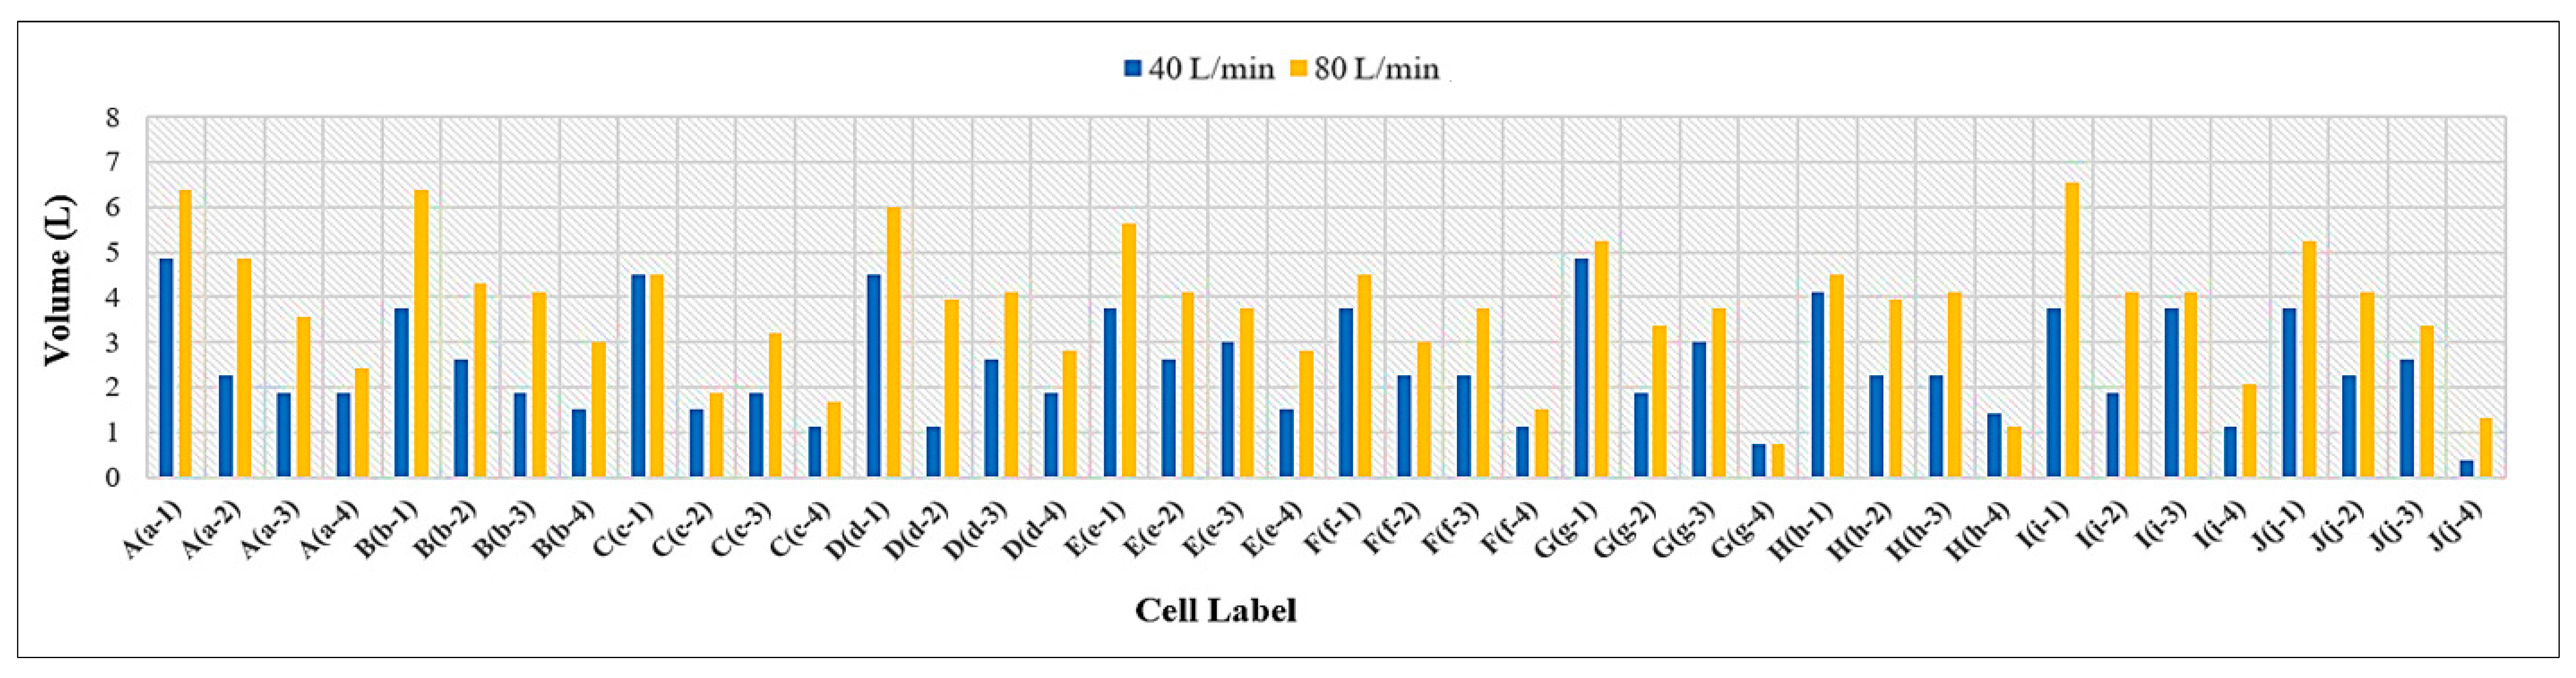
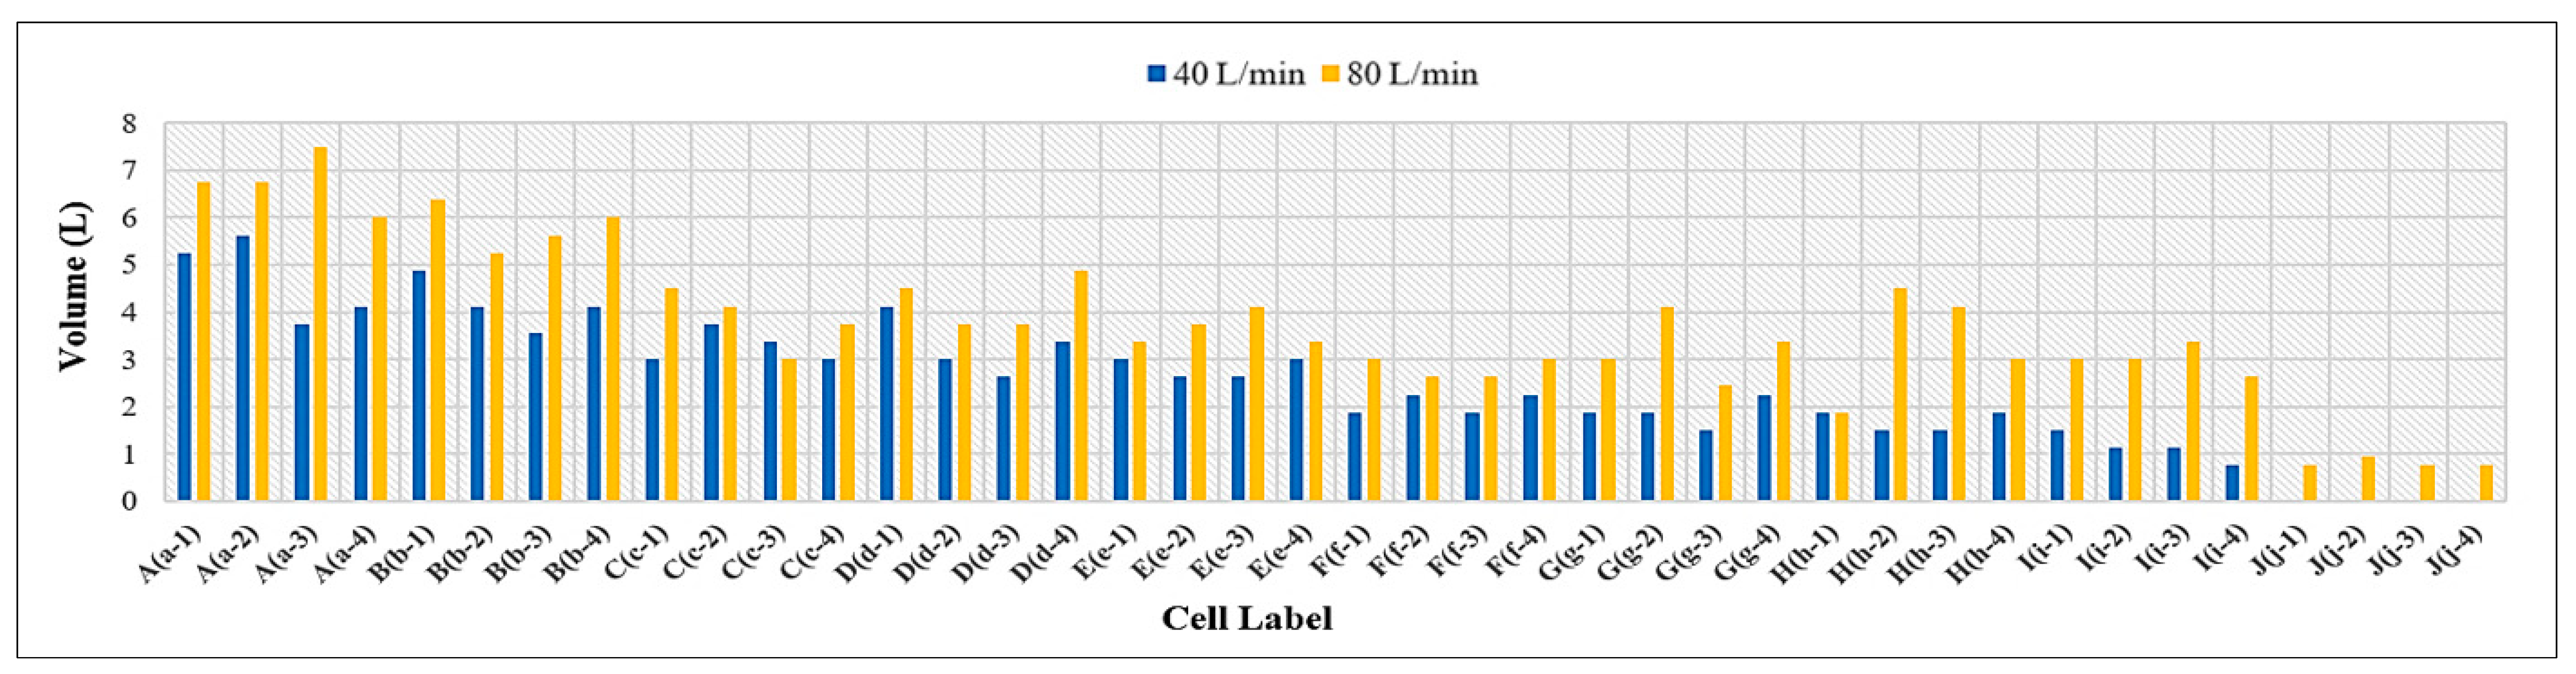
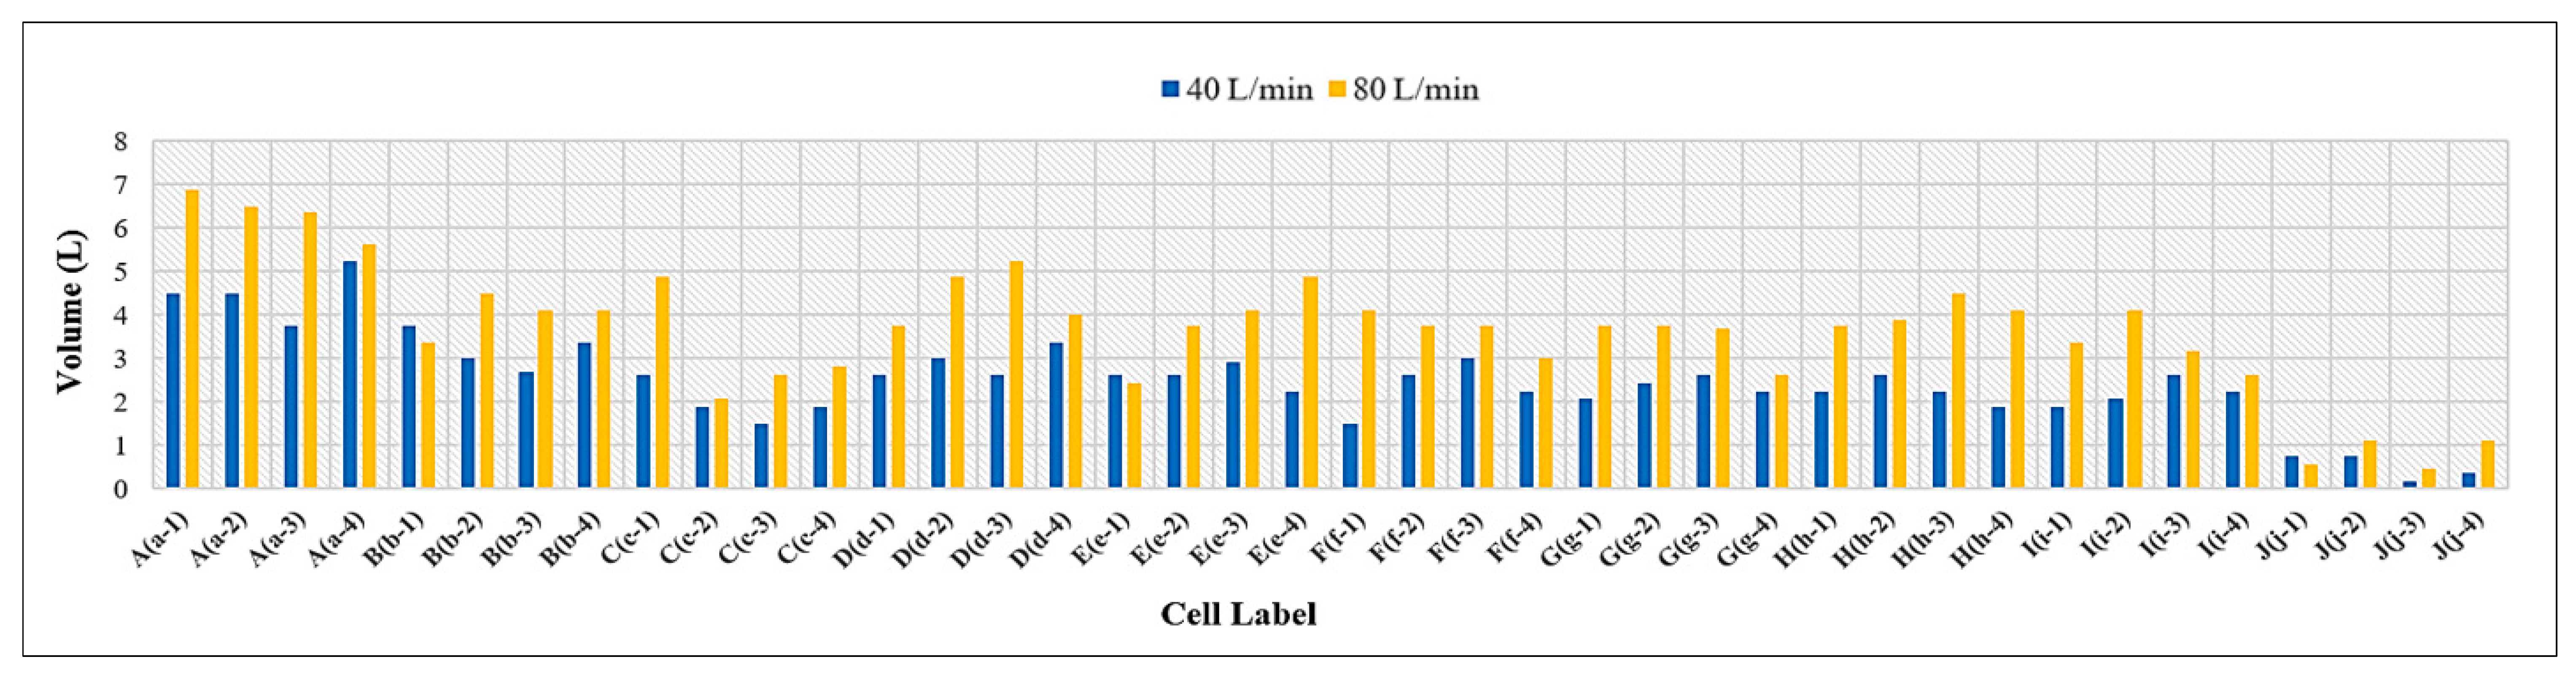
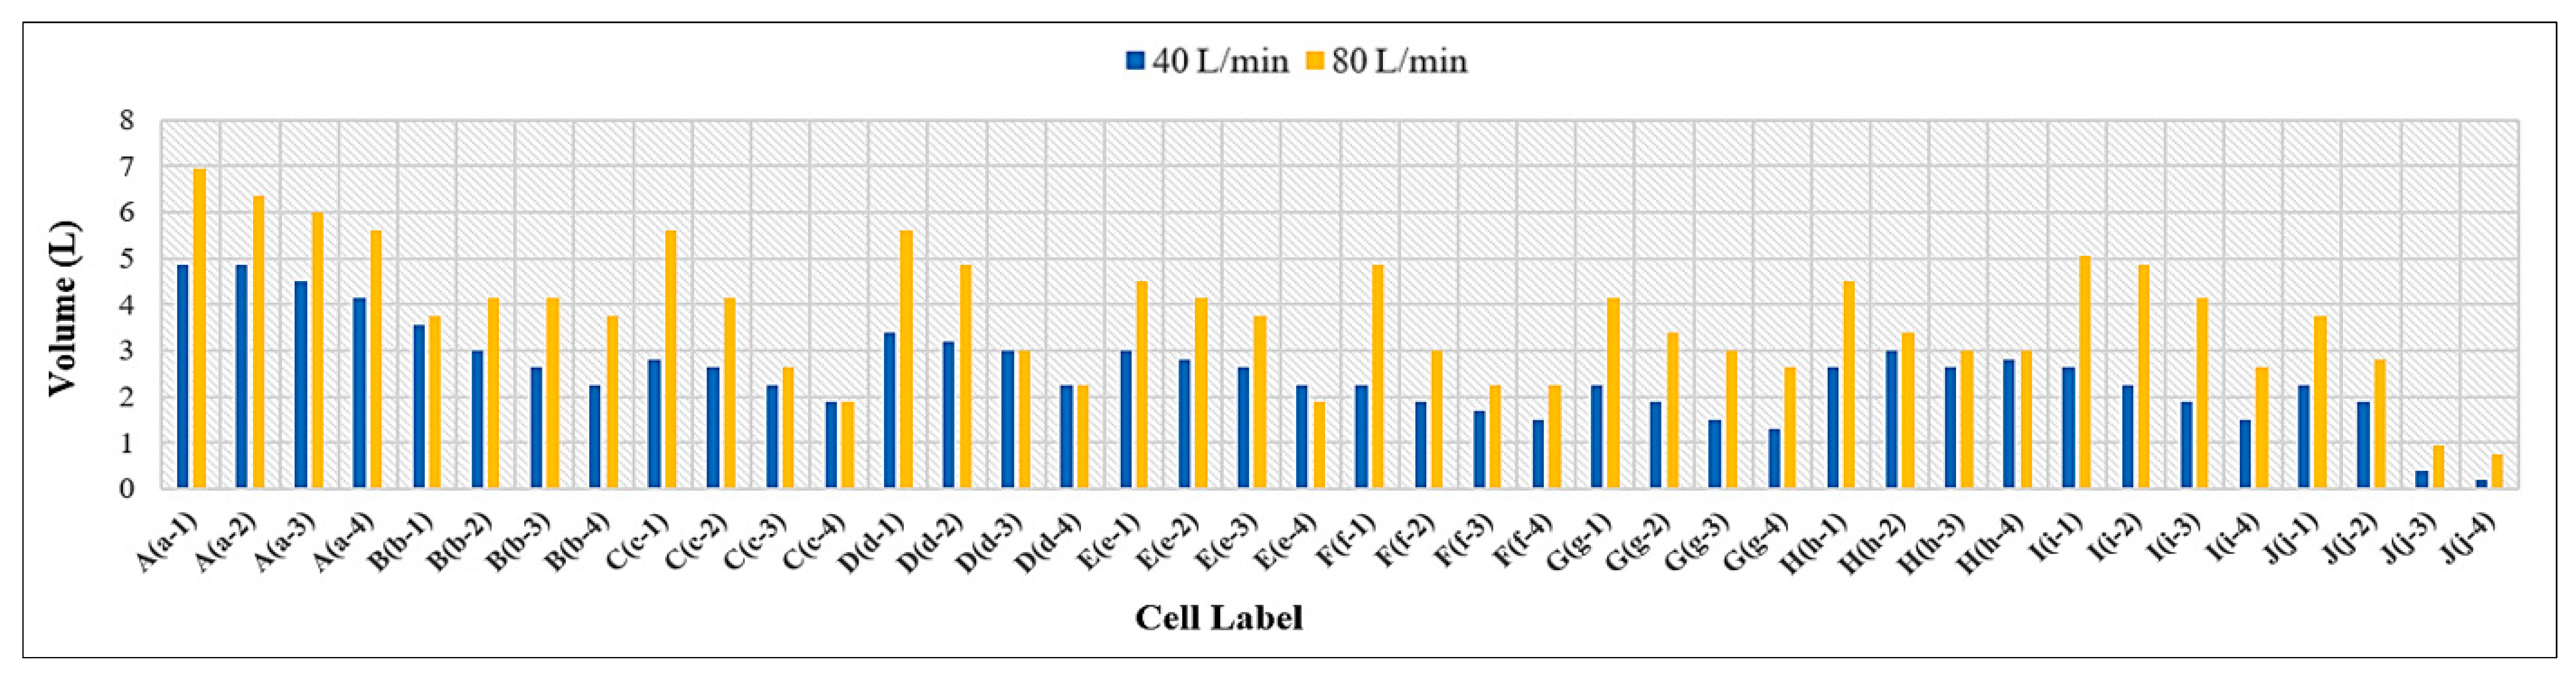
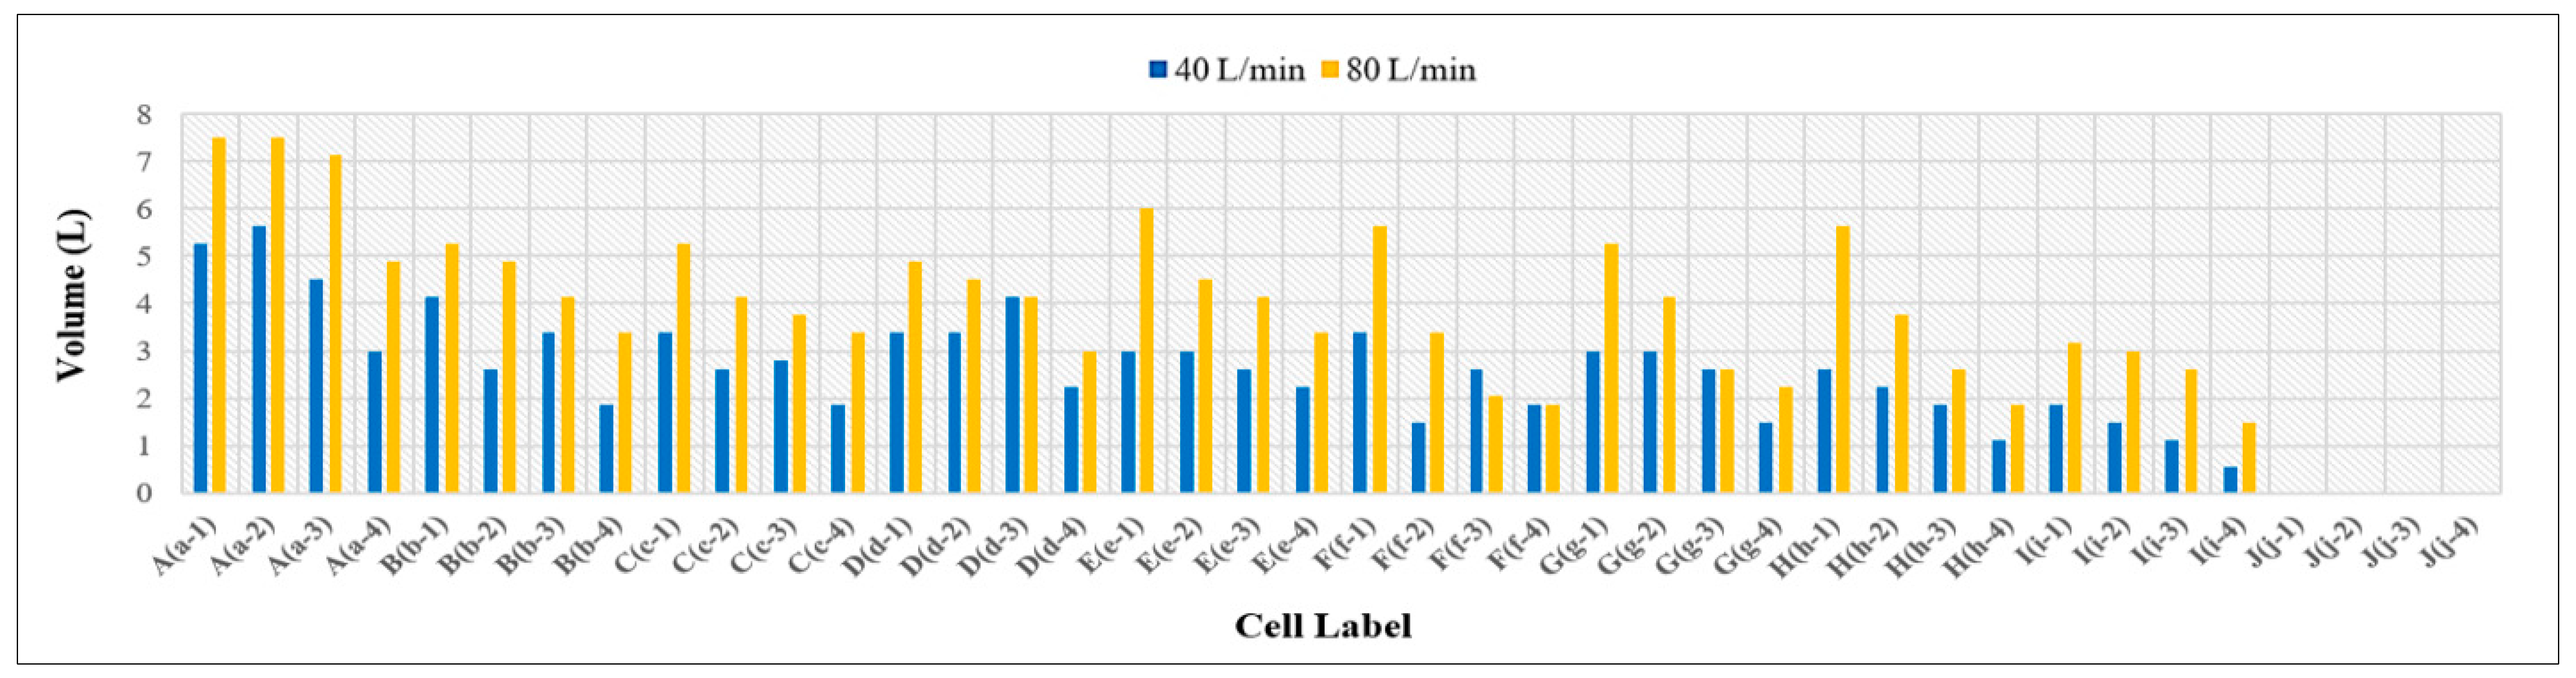
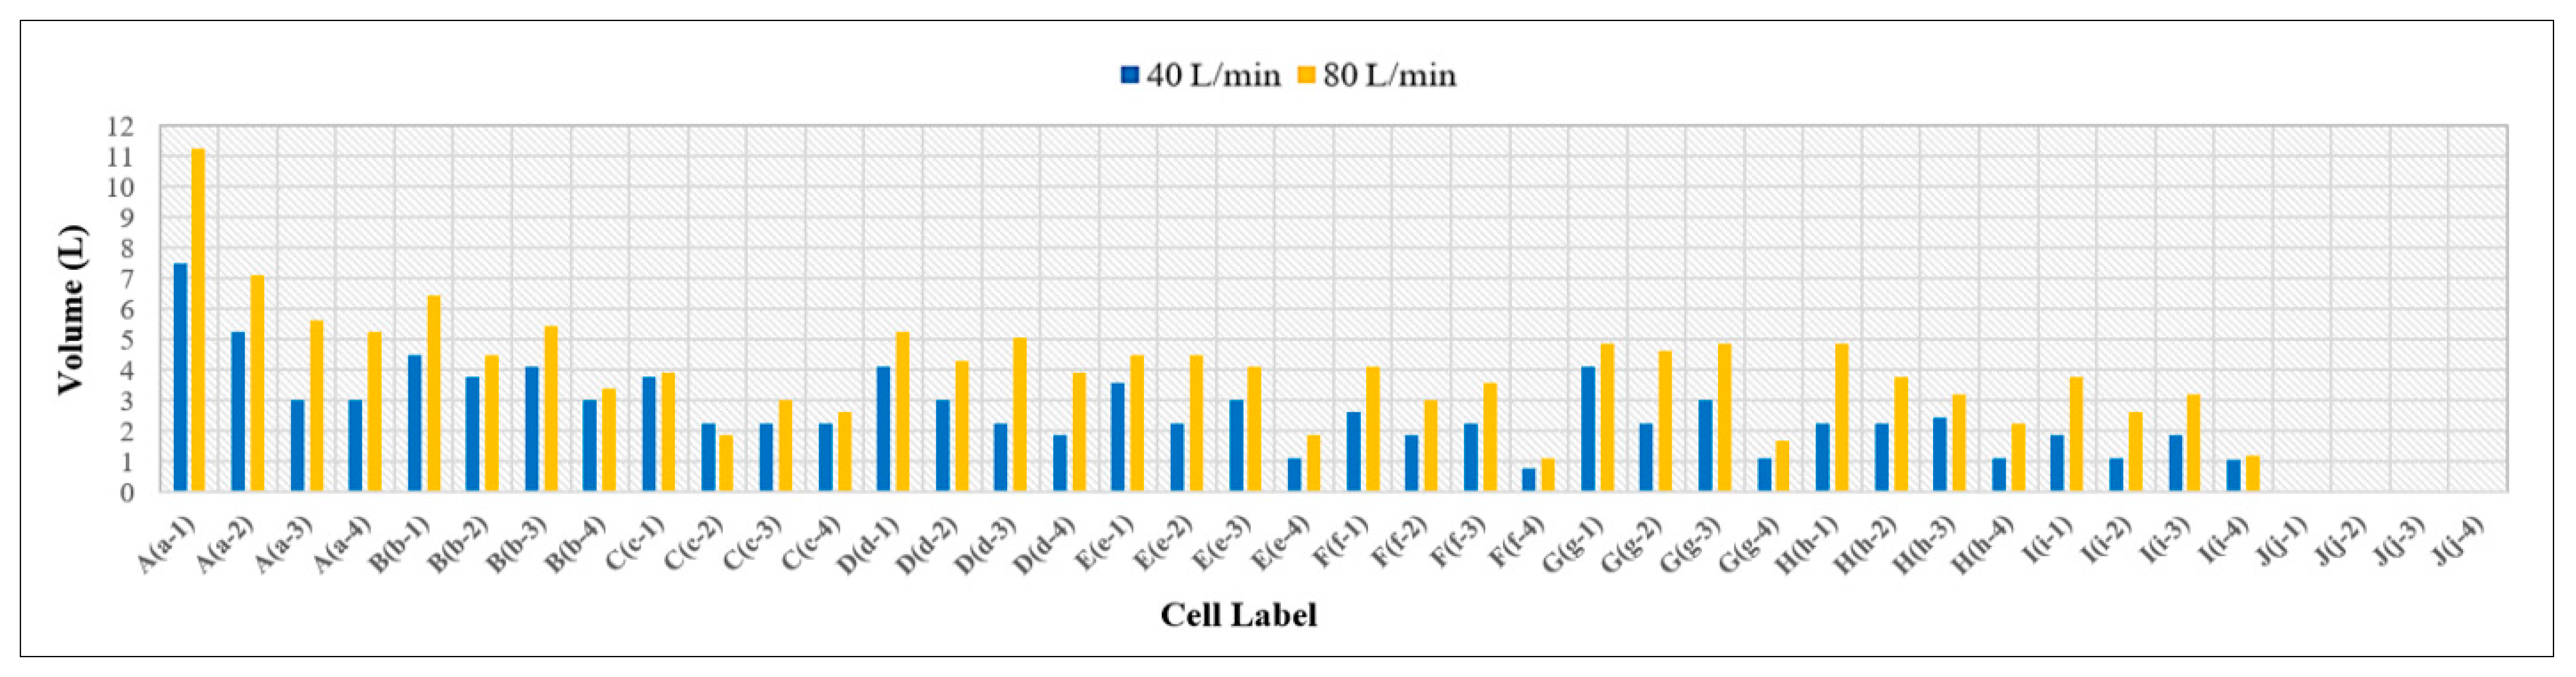
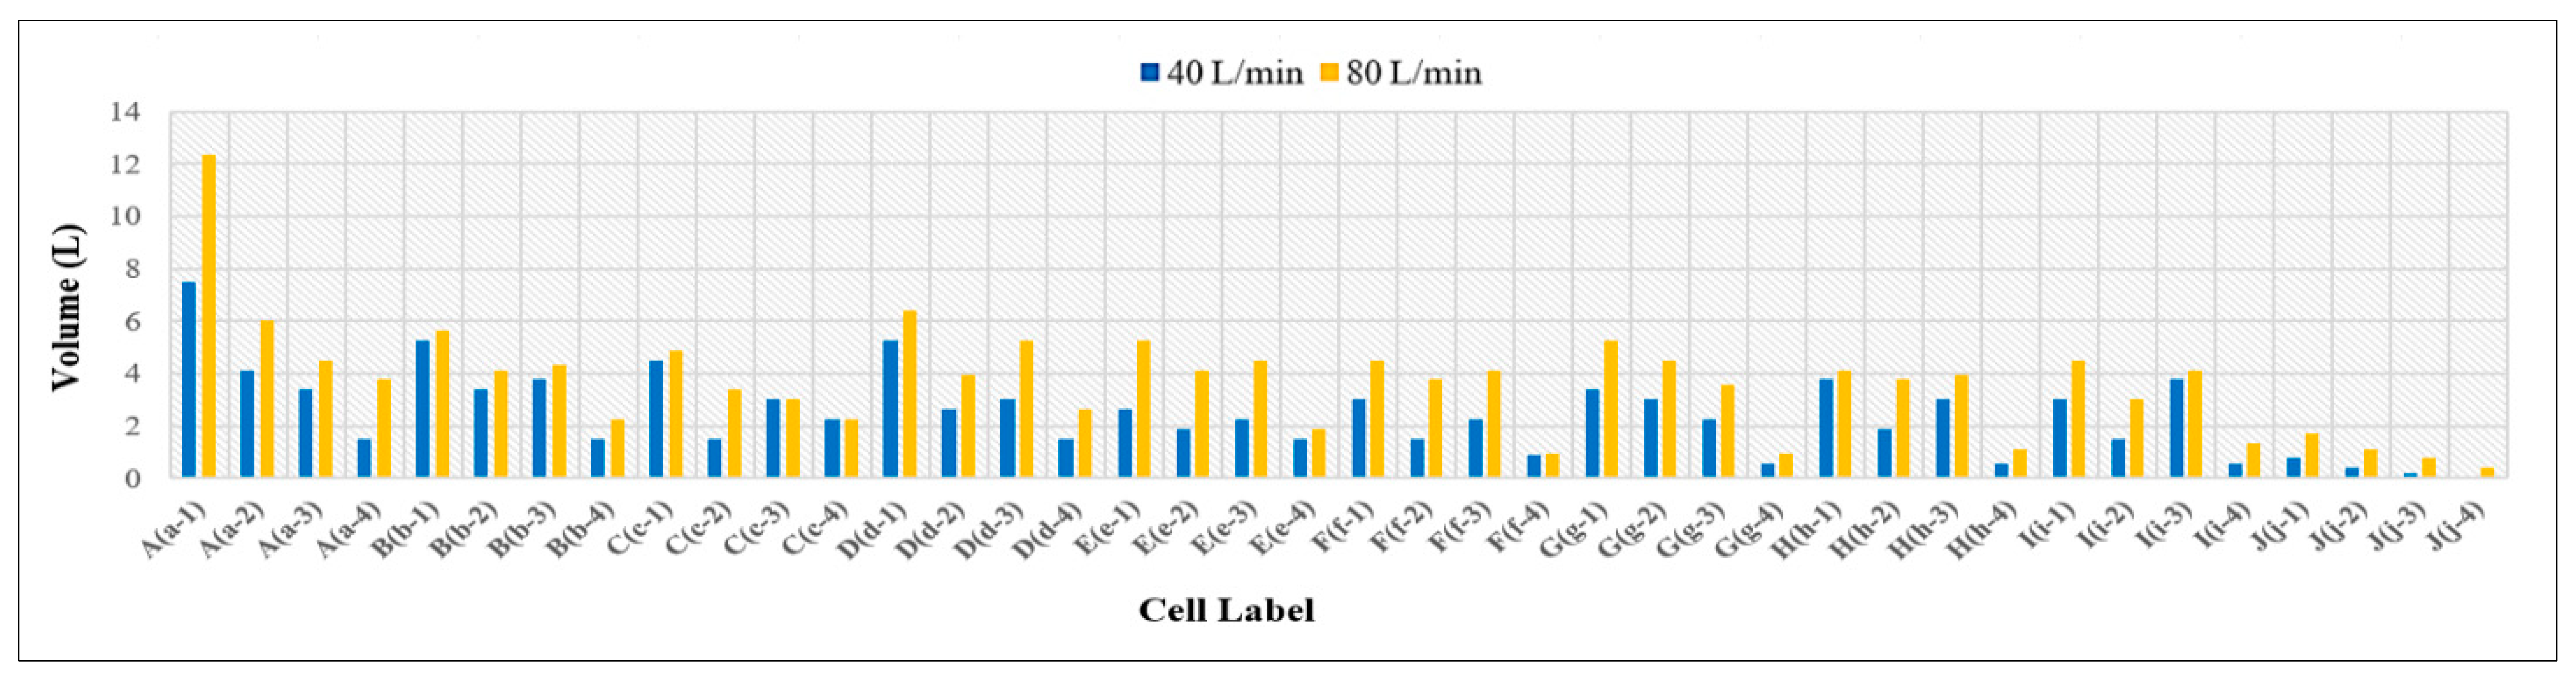
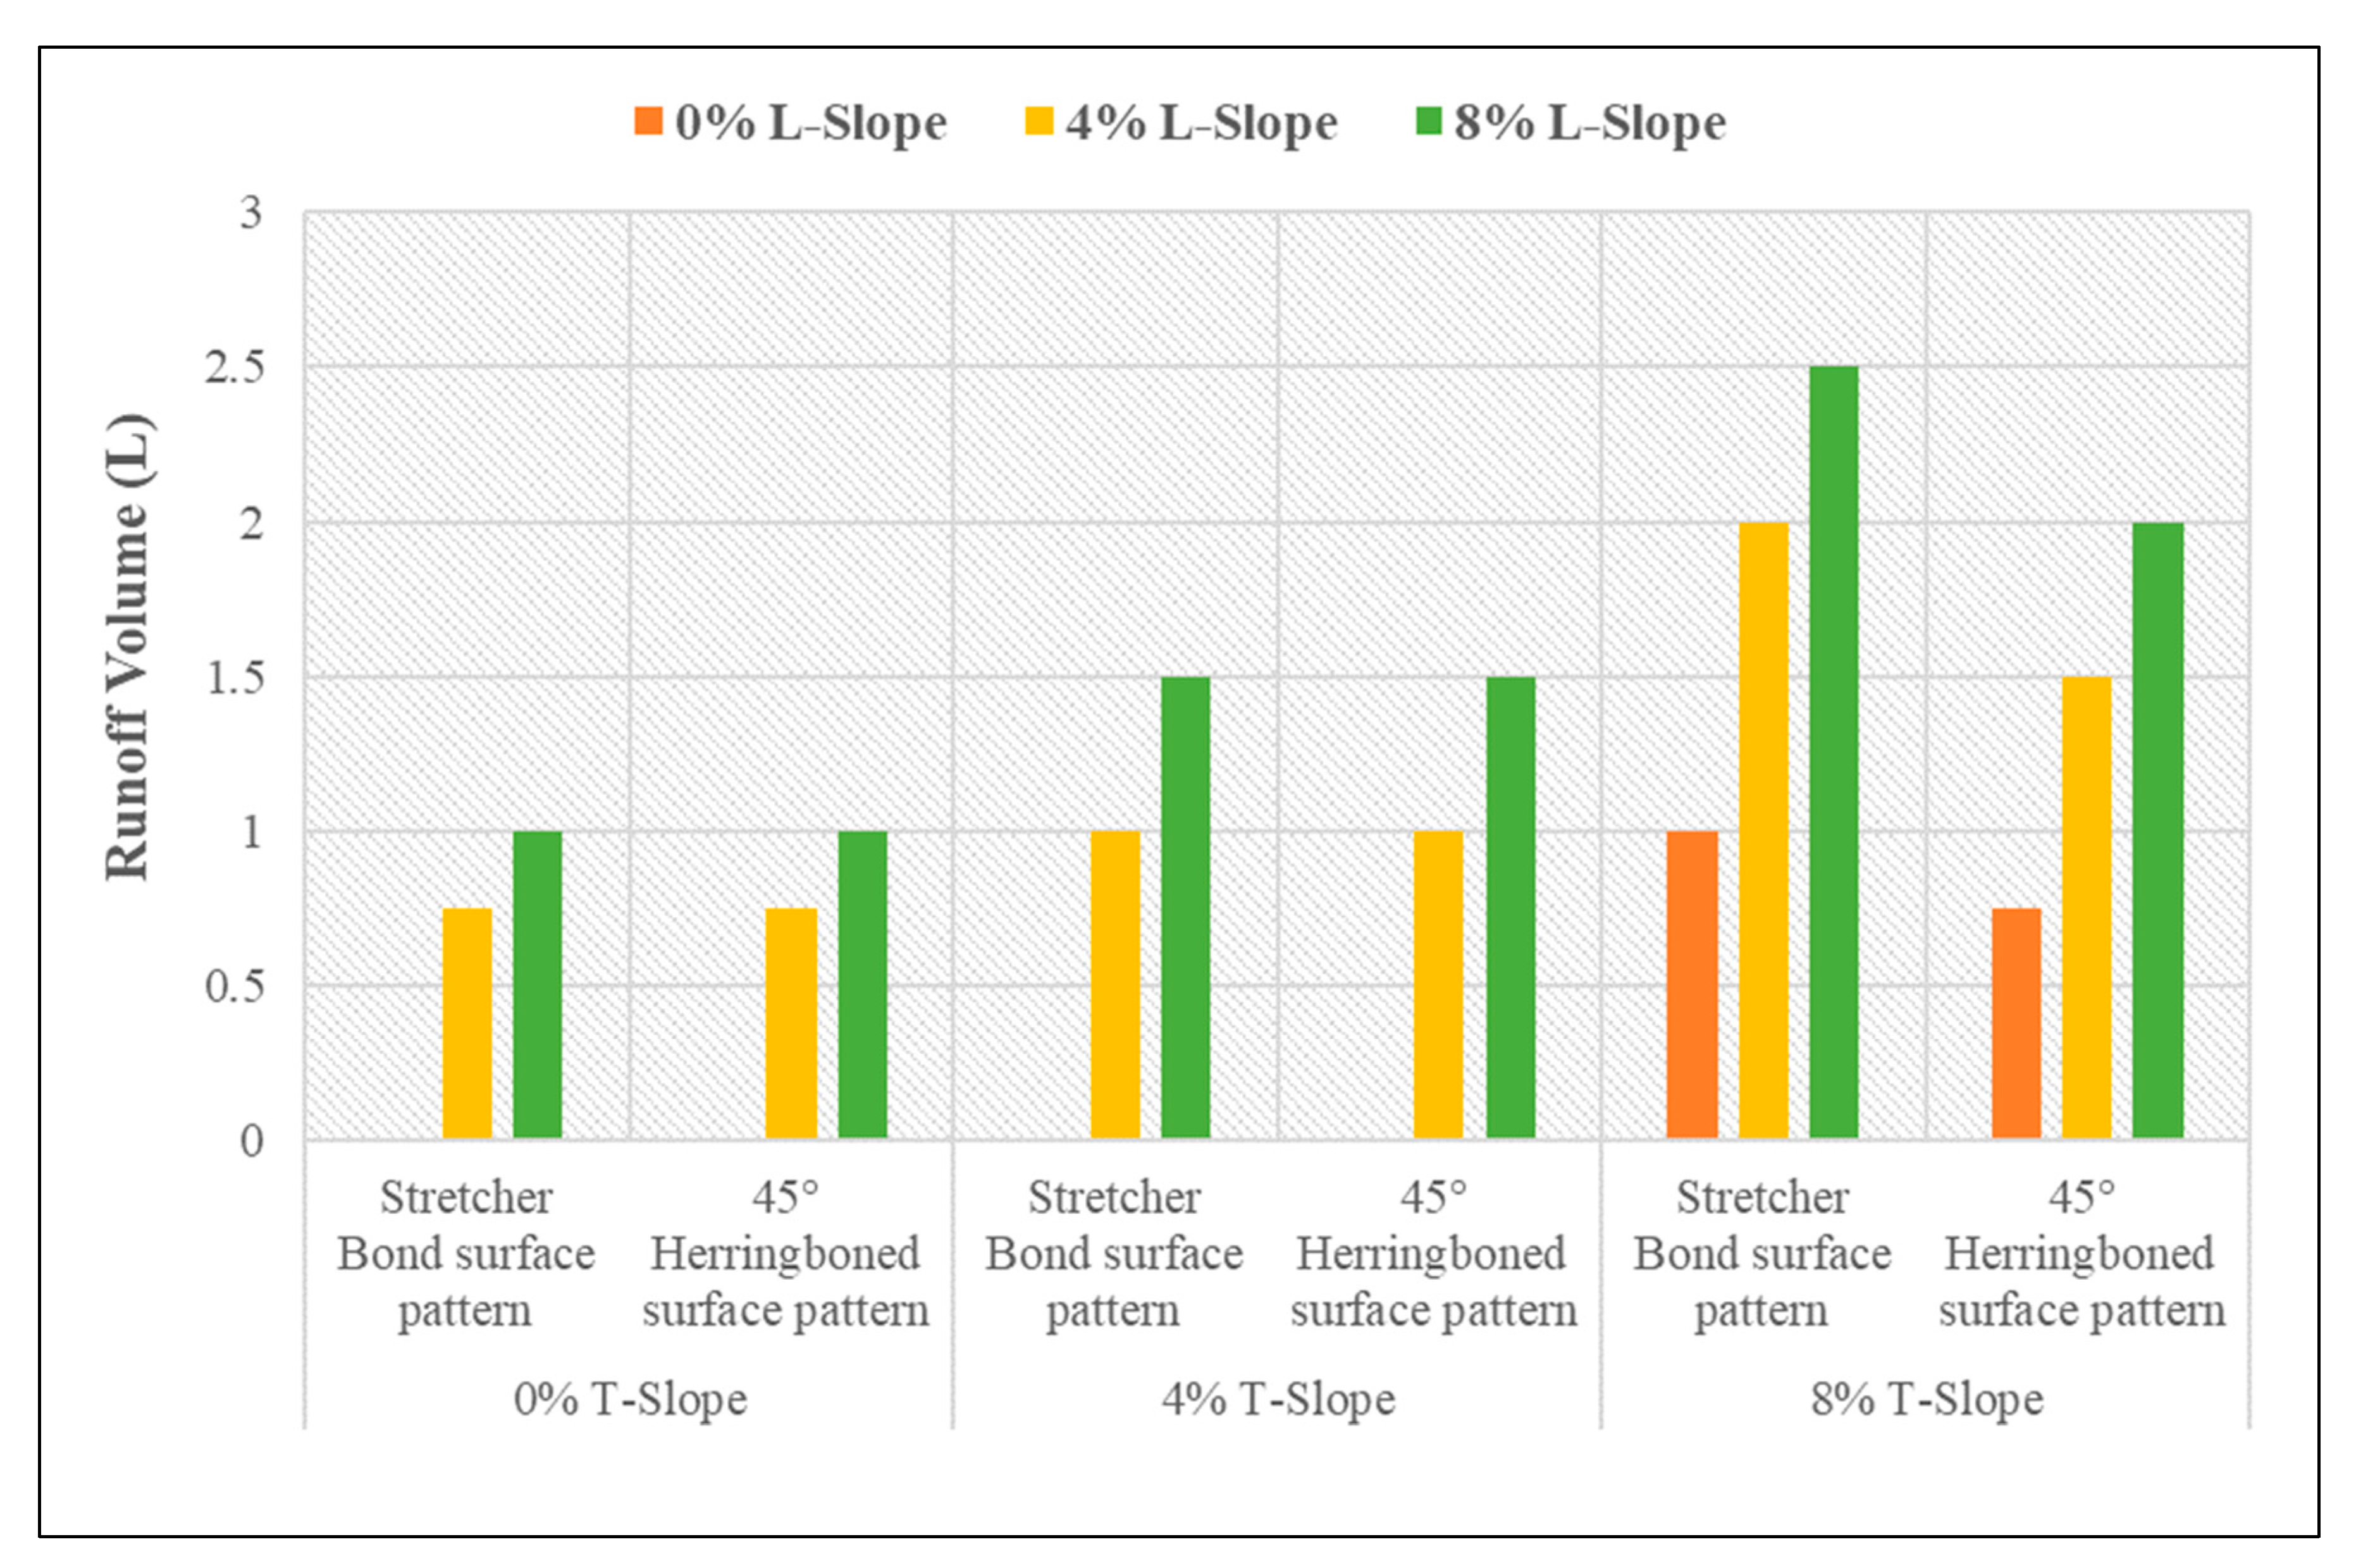
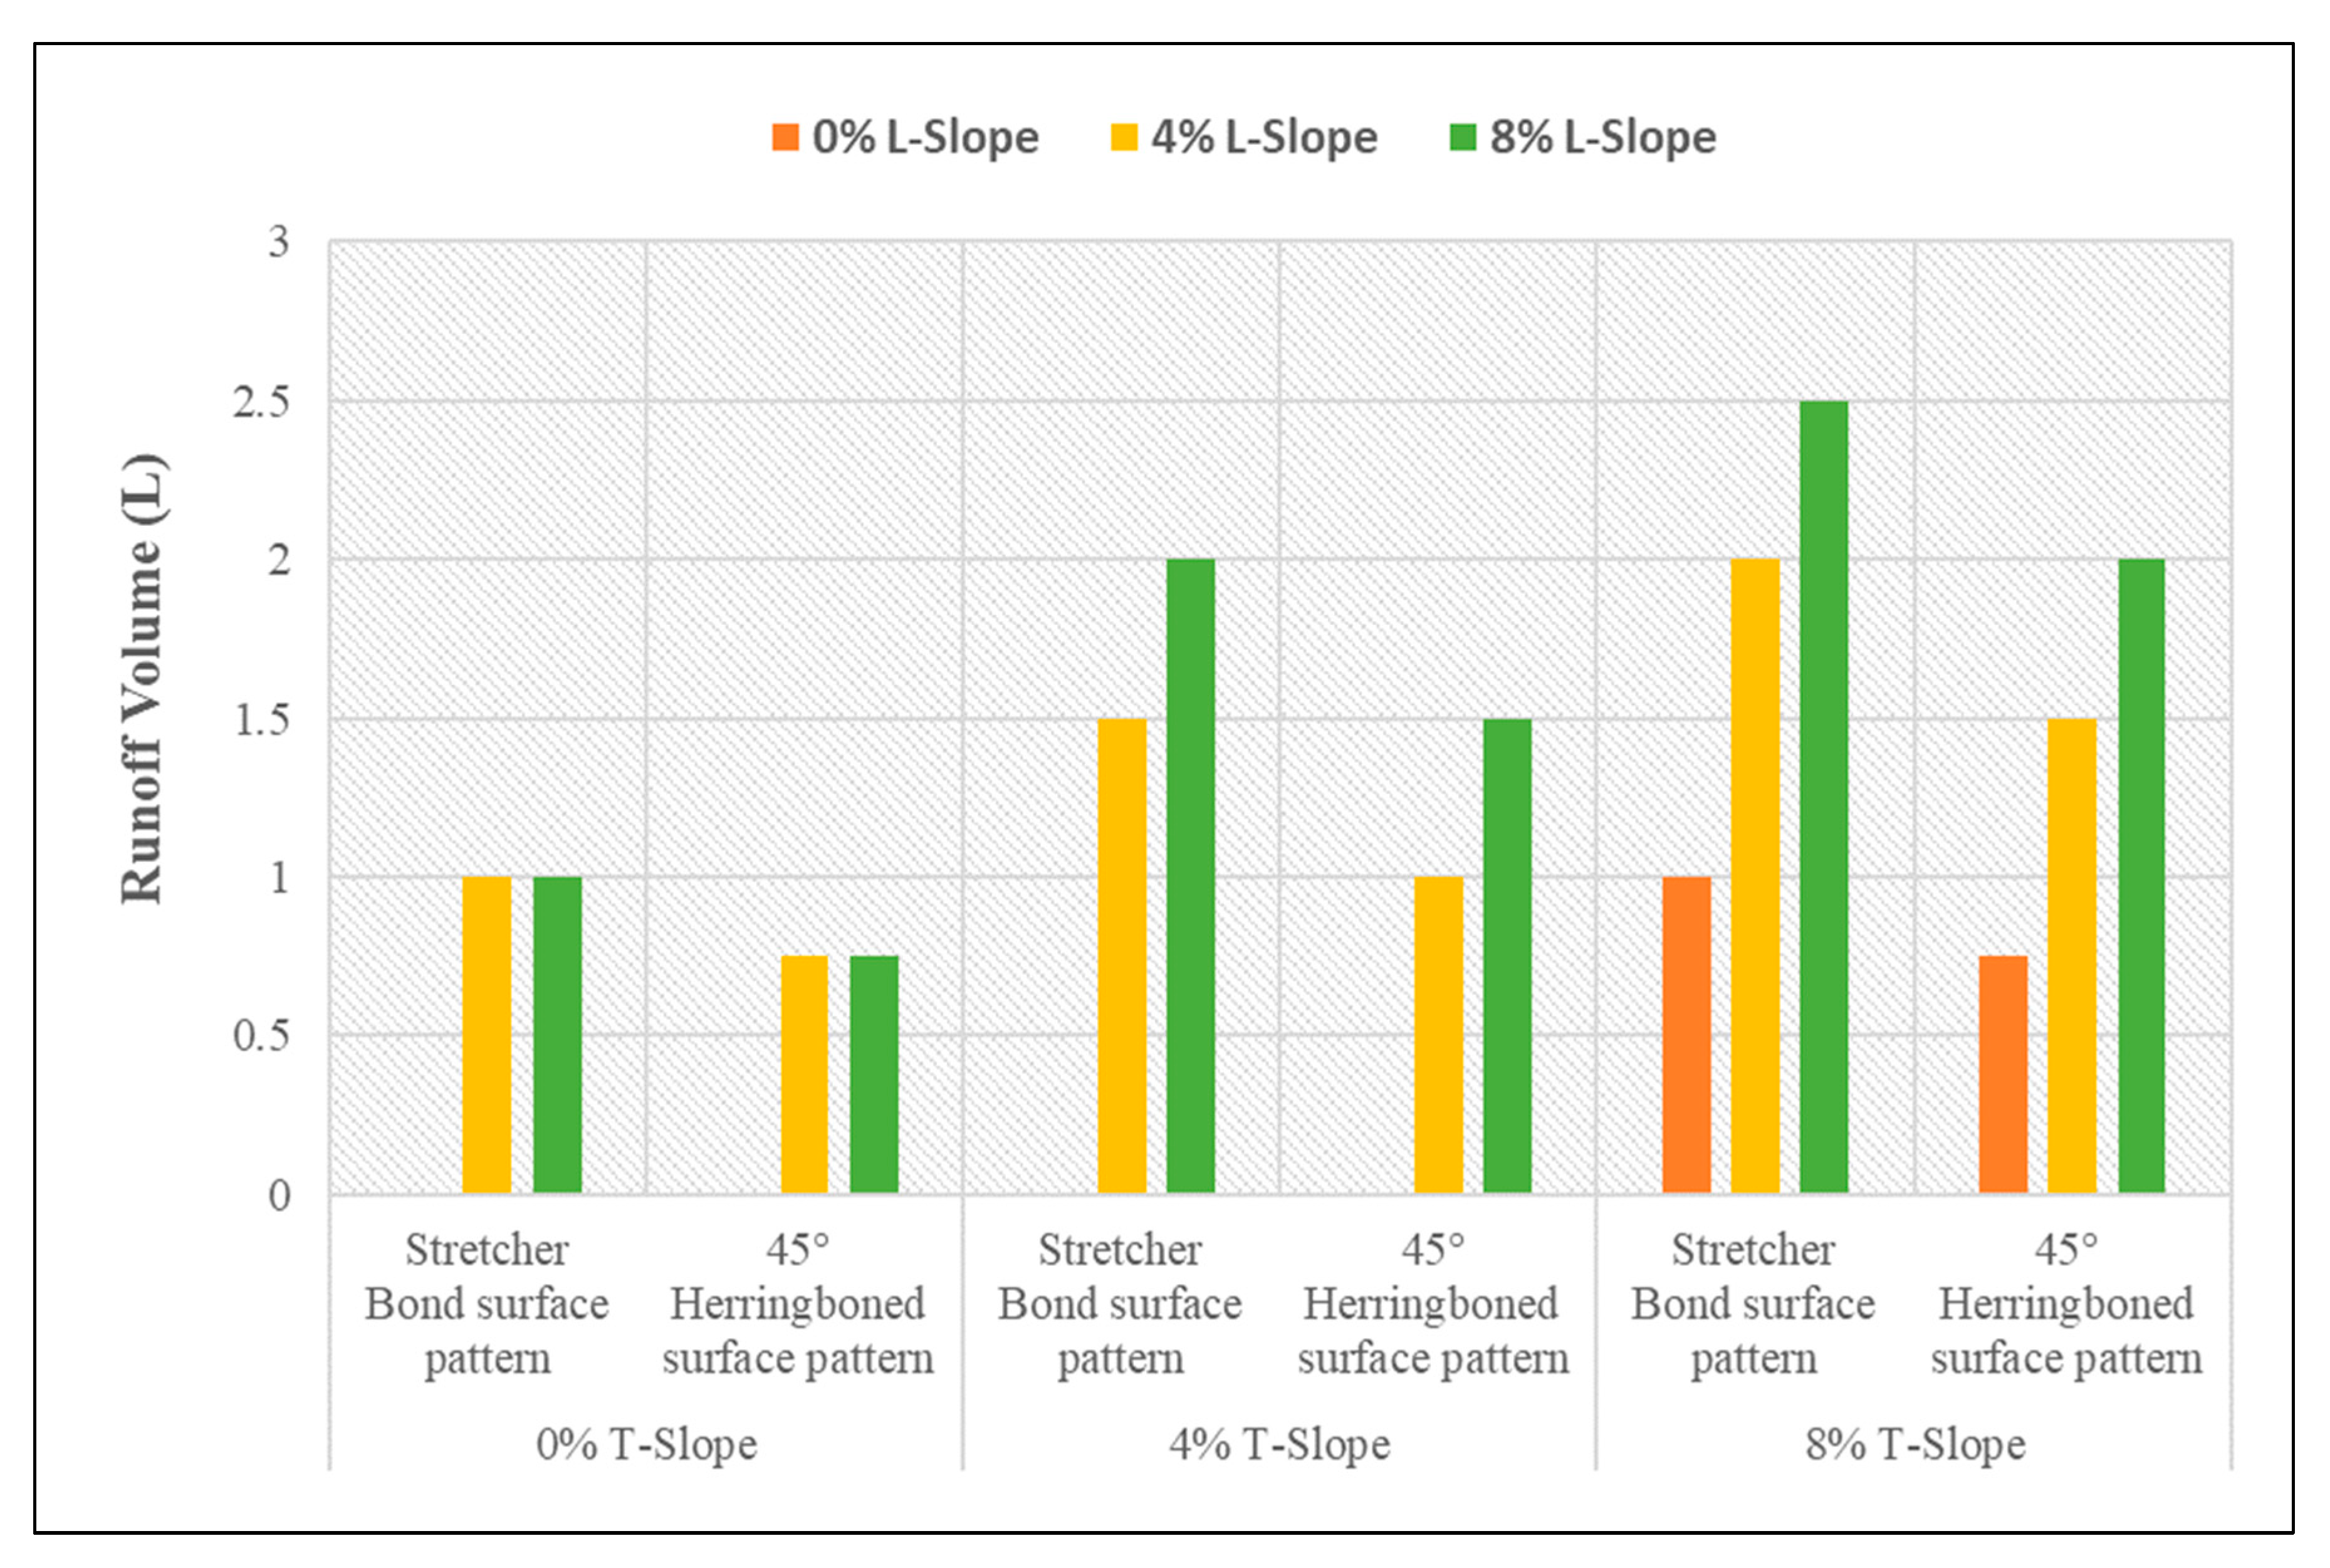
3.3. Volume of Runoff Water for PICPs’ Both Surface Types

Figure 64 shows that at a 40 L/min rate of rain falling, the quantity of runoff is equal on both surface types of PICP at (0 and 4%) transverse slopes and for all the adopted longitudinal slopes. The runoff level for the stretcher-bonded PICP has been increased relatively higher than the 45° herringbone at all adopted longitudinal slopes by increasing the value of the transverse slope to 8%. The 45° herringbone laying pattern favors water infiltration over runoff, particularly on steep slopes. This occurs because the 45° herringbone permeable interlocking concrete pavement (PICP) features a larger joint surface area compared to the stretcher bond pattern.
Figure 65 illustrates that at a rainfall intensity of 80 L/min, the runoff volume for the stretcher-bonded PICP is consistently greater than that of the 45° herringbone pattern across all selected longitudinal and transverse slopes. The difference in behavior between the two patterns can be attributed to the larger joint surface area in the 45° herringbone pattern compared to the stretcher bond pattern. This results in the 45° herringbone pattern being more advantageous during heavy rainfall (≥80 L/min), with a lower runoff rate compared to the stretcher bond pattern.
Both this study and the study by Smith DR et al. [28] examined the application of permeable interlocking concrete pavement (PICP) for managing surface runoff under diverse rainfall conditions. Expanding on previous studies, this research enhances PICP design parameters by incorporating varying rainfall intensities, a novel geometric surface layout, and different block spacing configurations.
While residual runoff is a significant factor in figuring out the ideal surface pattern, other essential factors like the maximum resistance to loading from traffic, appearance and functionality, and the system’s hydraulic efficiency must also be considered.

3.4. Modeling Analysis

3.4.1. Introduction

This section of the research focuses on detailing the statistical analysis employed to develop a model linking the output parameter—infiltration—with various input parameters. These inputs include the distance from the higher side of the roadway length, the distance from the higher side of the roadway width, side slope, longitudinal slope, block paver spacing, and rainfall intensity. Predictive modeling utilizes a range of mathematical techniques to establish relationships between a target output variable and multiple input variables, aiming to predict future values of the target variable based on these inputs [29]. In practical applications, it is desirable to provide an estimate of the uncertainty in the predictions, usually in the form of a prediction interval with a certain level of confidence, such as 95% [30]. Another aspect of the process is model building, which involves selecting, fitting, and validating a model.

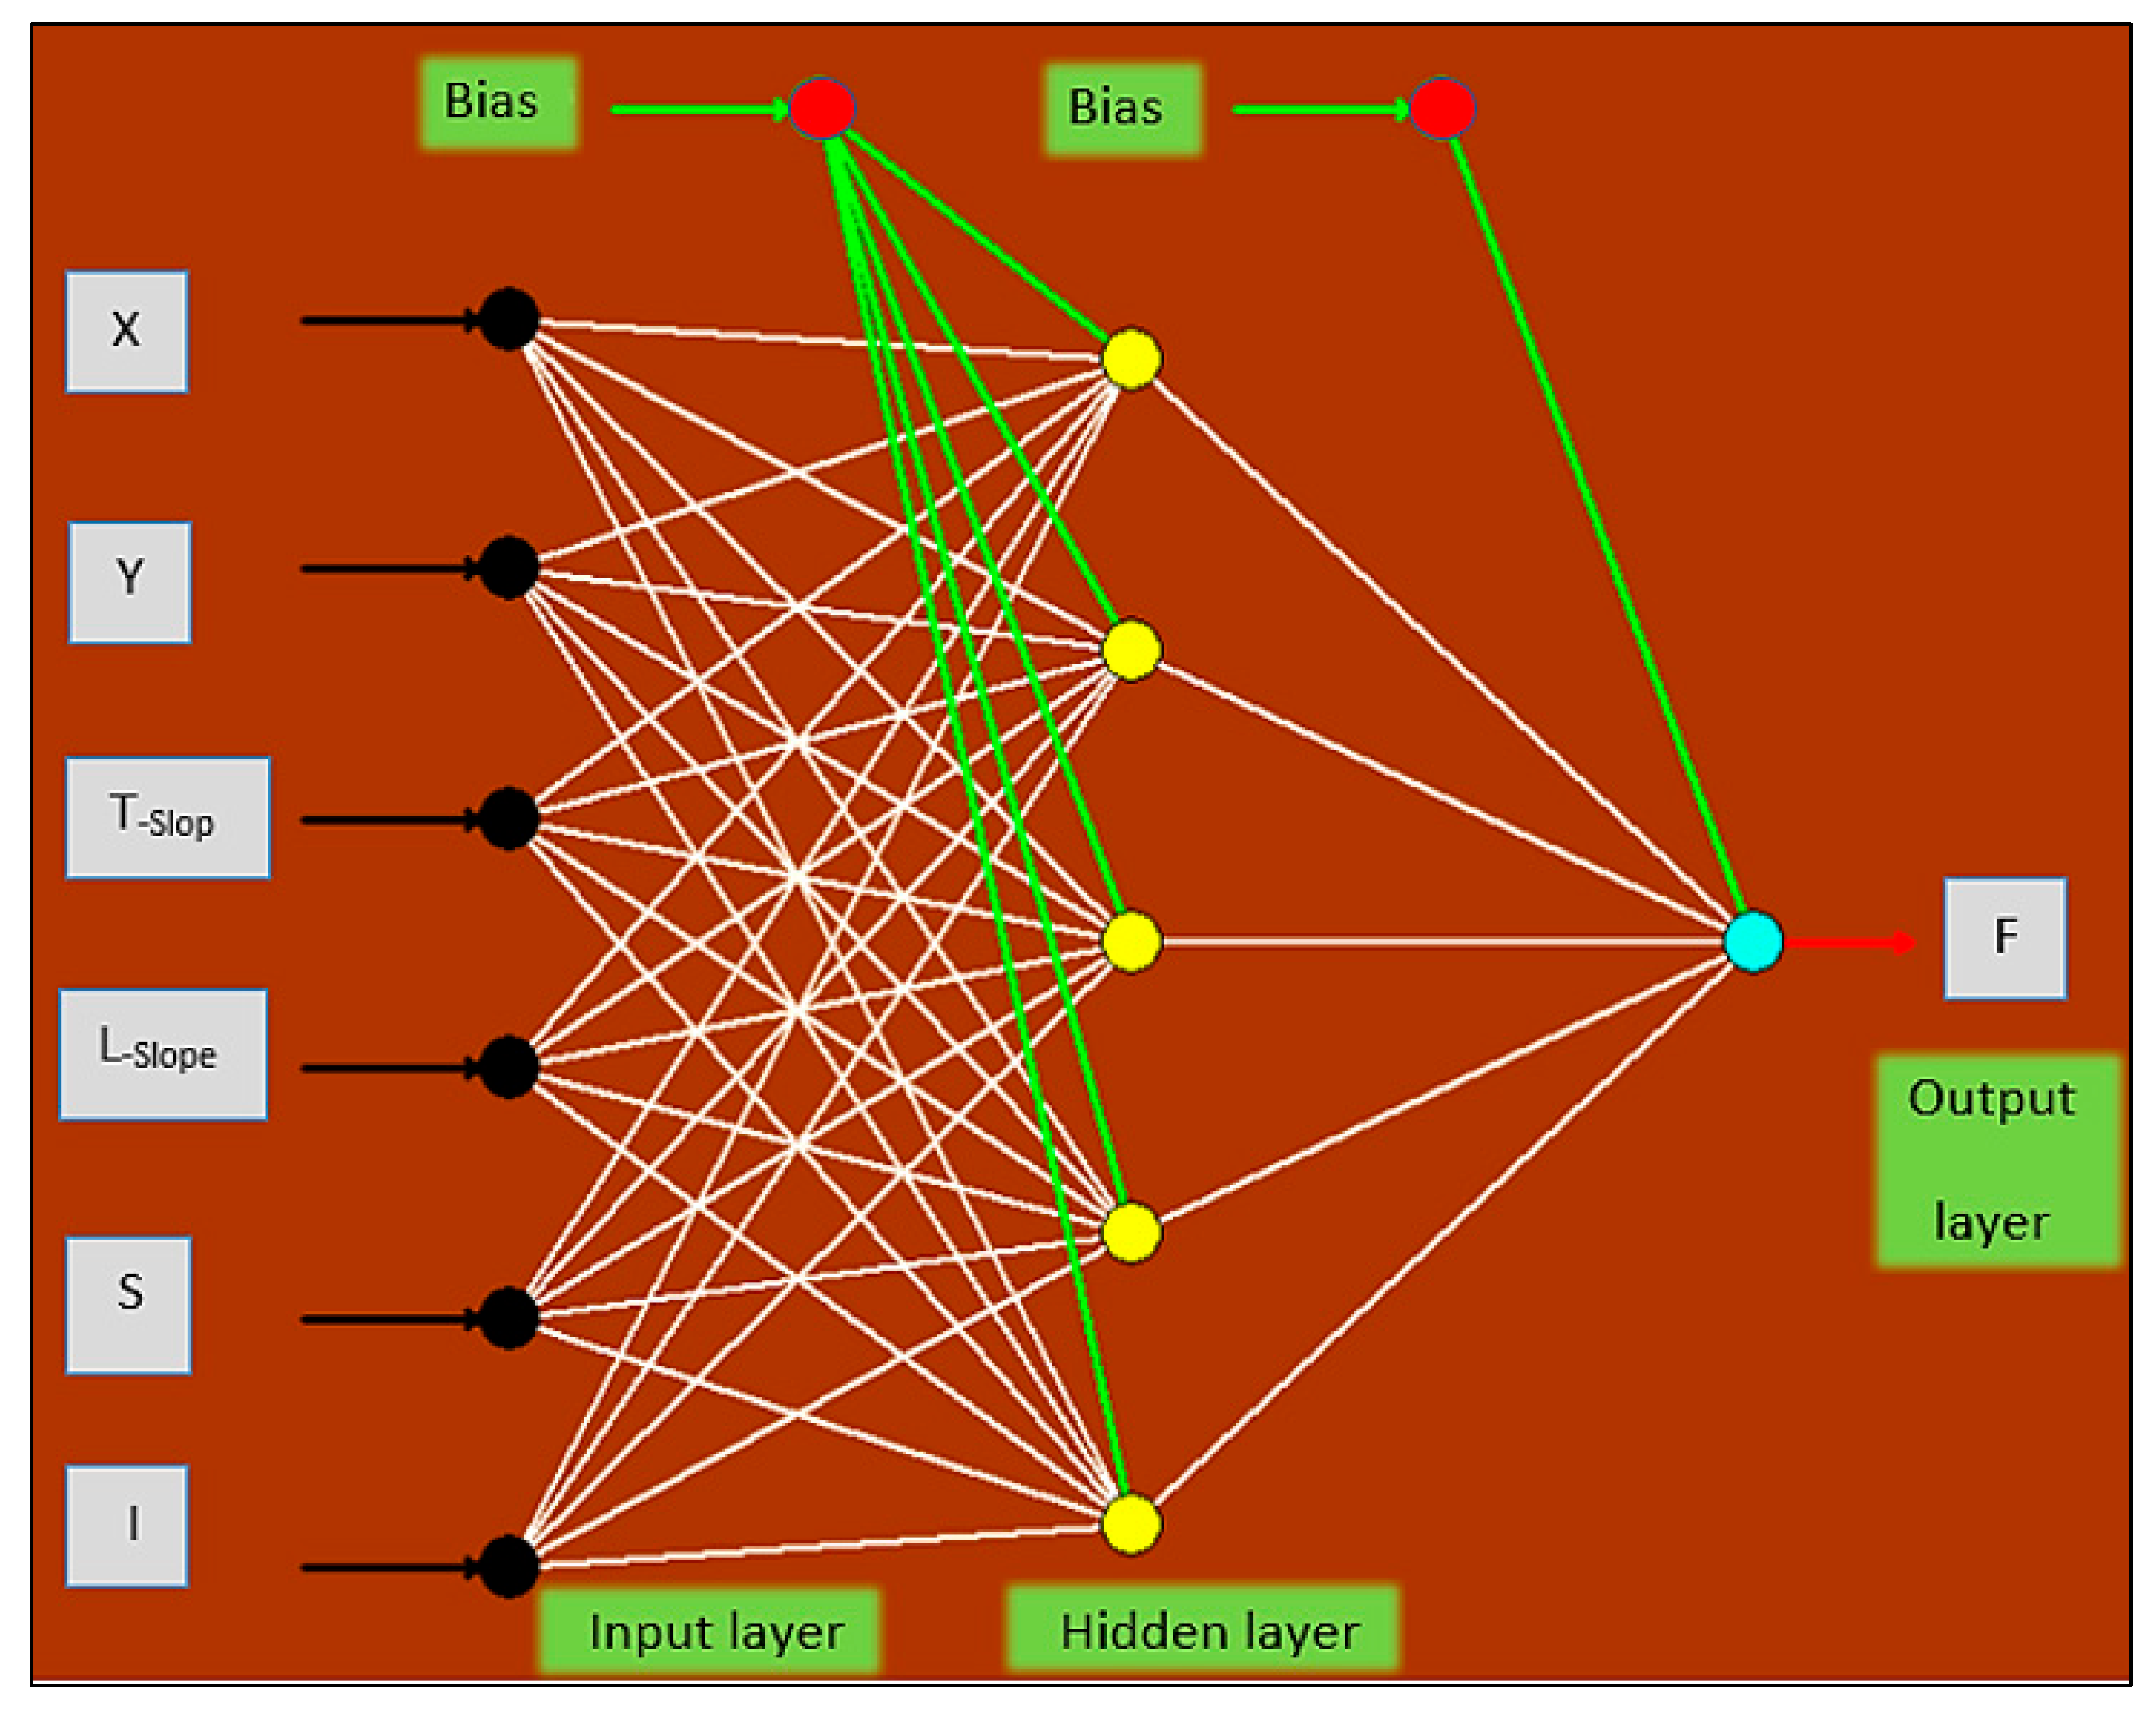
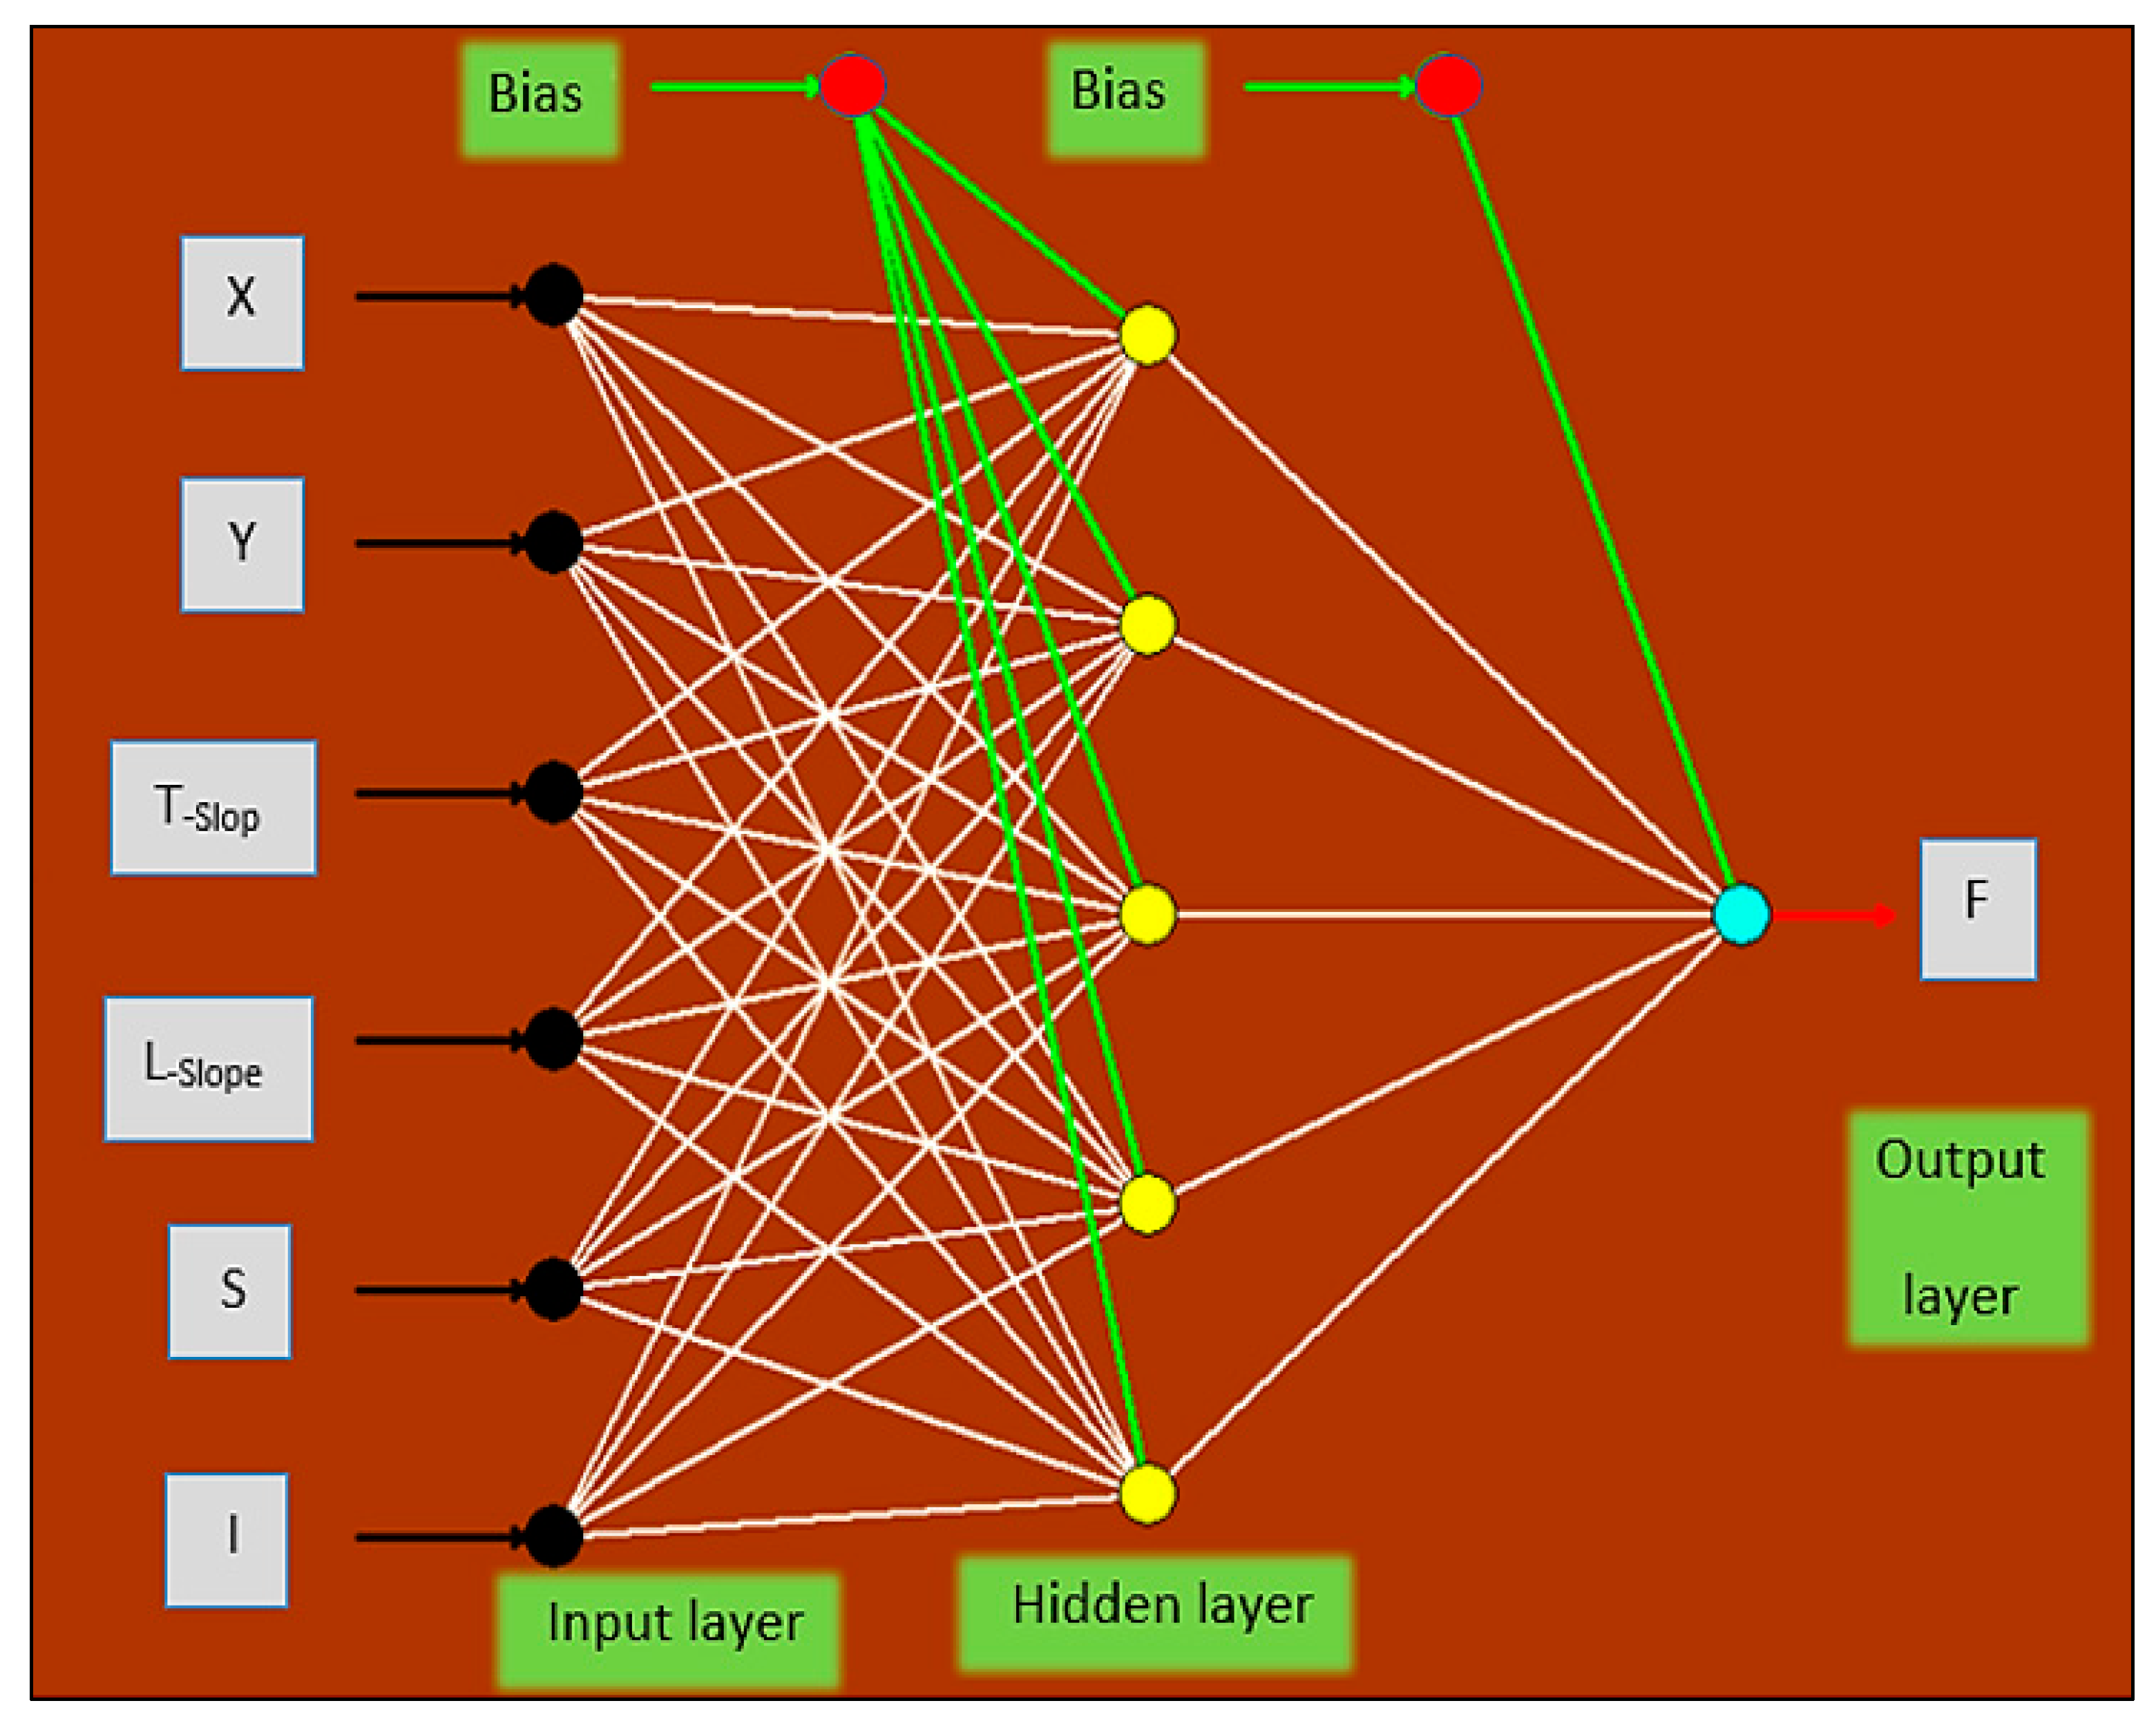
3.4.2. Artificial Neural Networks (ANNs)

Artificial neural networks (ANNs) are considered among the most advanced statistical processes. They have the capability to tackle complex problems and mimic the human brain [31]. ANNs are utilized to predict the hydraulic properties of phenomena by interpolating and extrapolating data. ANNs have been widely used by researchers to model various complex hydrological processes due to their good generalization efficiency. They are frequently utilized in practical hydrology projects. ANNs can even assist in filling missing hydrological records when data values are absent. ANNs are mathematical models composed of neurons. Each neuron receives inputs, which are weighted sums of previous neuron outputs [31]. The neuron processes this input through an activation function and a bias value. The ANN system consists of three primary components: the input layer, hidden layer(s), and output layer. An ANN may include multiple hidden layers, each possessing distinct learning values that control the processing of data from the input layer [31].
In this study, the goal was to find a solution with the least number of iterations that has a root mean square error less than 1. Since the output values from an Artificial Neural Network (ANN) are limited by the sigmoid function to values less than or equal to 1; scaling was applied to the input and output layers. The sigmoid activation function was used to model the rainfall simulation data, and the learning rate and momentum were set to 0.8. The dataset consisted of N samples, including two discharge rates, three longitudinal and transverse slopes, 40 collecting cells, one joint spacing value, and two patterns of block pavers.

3.4.3. Adequacy of the Model

The model architecture includes an input layer, one or more intermediate hidden layers, and an output layer [32]. Its parameters are determined by various transfer functions, such as the Sigmoid (logistic) function f x = 1 1 + e x , the hyperbolic tangent (tanh) function, the sine or cosine function, and the linear function.
The structure of a model can be succinctly described as an ANN i-j-k, where (i) represents the number of neurons in the input layer, (j) represents the number of neurons in the hidden layer, and k represents the number of neurons in the output layer. The Neural Power software(version 3.0), which uses artificial neural networks to perform computations, is utilized to determine the weights and bias factors that minimize errors in the output variables [32]. The mathematical expression can be succinctly described as follows:
  • Input Layer
All models have an input layer that is determined by the parameters outlined below.
A.
Output Parameters
F: The infiltration (cm/hr).
B.
Input Parameters
X: Distance from the upper side of the road length (cm).
Y: Distance from the upper side of the road width (cm).
L-Slope: Surface slope in the long direction (%).
T-Slop: Surface slope in the transverse direction (%).
S: The gap between paving blocks (cm).
I: Rainfall intensity by (L/min).
2.
Hidden Layer
The transfer of data from the input layer to the hidden layer occurs on a specific date and is processed with an activation function and bias value as described below in Equations (4) and (5).
σ X j = 1 1 + e X j
X j = Q j + W i , j * Y i  
For 45° herringbone and stretcher bond surface patterns
X 1 = Q 31 + W 1 X + W 6 Y + W 11 S + W 16 S l + W 21 S x + W 26 I    
X 2 = Q 32 + W 2 X + W 7 Y + W 12 S + W 17 S L + W 22 S x + W 27 I  
X 3 = Q 33 + W 3 X + W 8 Y + W 13 S + W 18 S L + W 23 S x + W 28 I    
X 4 = Q 34 + W 4 X + W 9 Y + W 14 S + W 19 S L + W 24 S x + W 29 I  
X 5 = Q 35 + W 5 X + W 10 Y + W 15 S + W 20 S L + W 25 S x + W 30 I
3.
Output Layer
In this layer, the output of the hidden layer is received, processed, and presented as the result of the neural system, as shown below in Equations (6) and (7).
σ X k = 1 1 + e X k
X k = Q k + W j , k σ X j  
For 45° herringbone and stretcher bond surface patterns
σ X = 1 1 + e X 1 + X 2 + X 3 + X 4 + X 5
X F = Q 41 + W 36 σ X + W 37 σ X + W 38 σ X + W 39 σ X + W 40 σ X
F = 1 1 + e X F
where:
  • Yi: Denotes the input variables.
  • Xj and Xk: Power value of the sigmoid function for input and output, respectively.
  • Q j and Q k : Bias values for neurons in the hidden and output layers, respectively.
  • Wi, j and Wj, k: weights of the connections between neurons in the input and hidden layers, respectively.
  • σxj and σxk: output values of the hidden and output layers, respectively.
The definitions of X, Y, S, L-Slope, T-Slope, I, and F are detailed previously. The value of W and Q for stretcher bond can be seen in Table 4, and for 45° herringbone in Table 5.
Distribution of weights in an artificial neural network (ANN) for infiltration in permeable pavements (stretcher bond and 45° herringbone patterns) is shown below in Figure 66 and Figure 67.

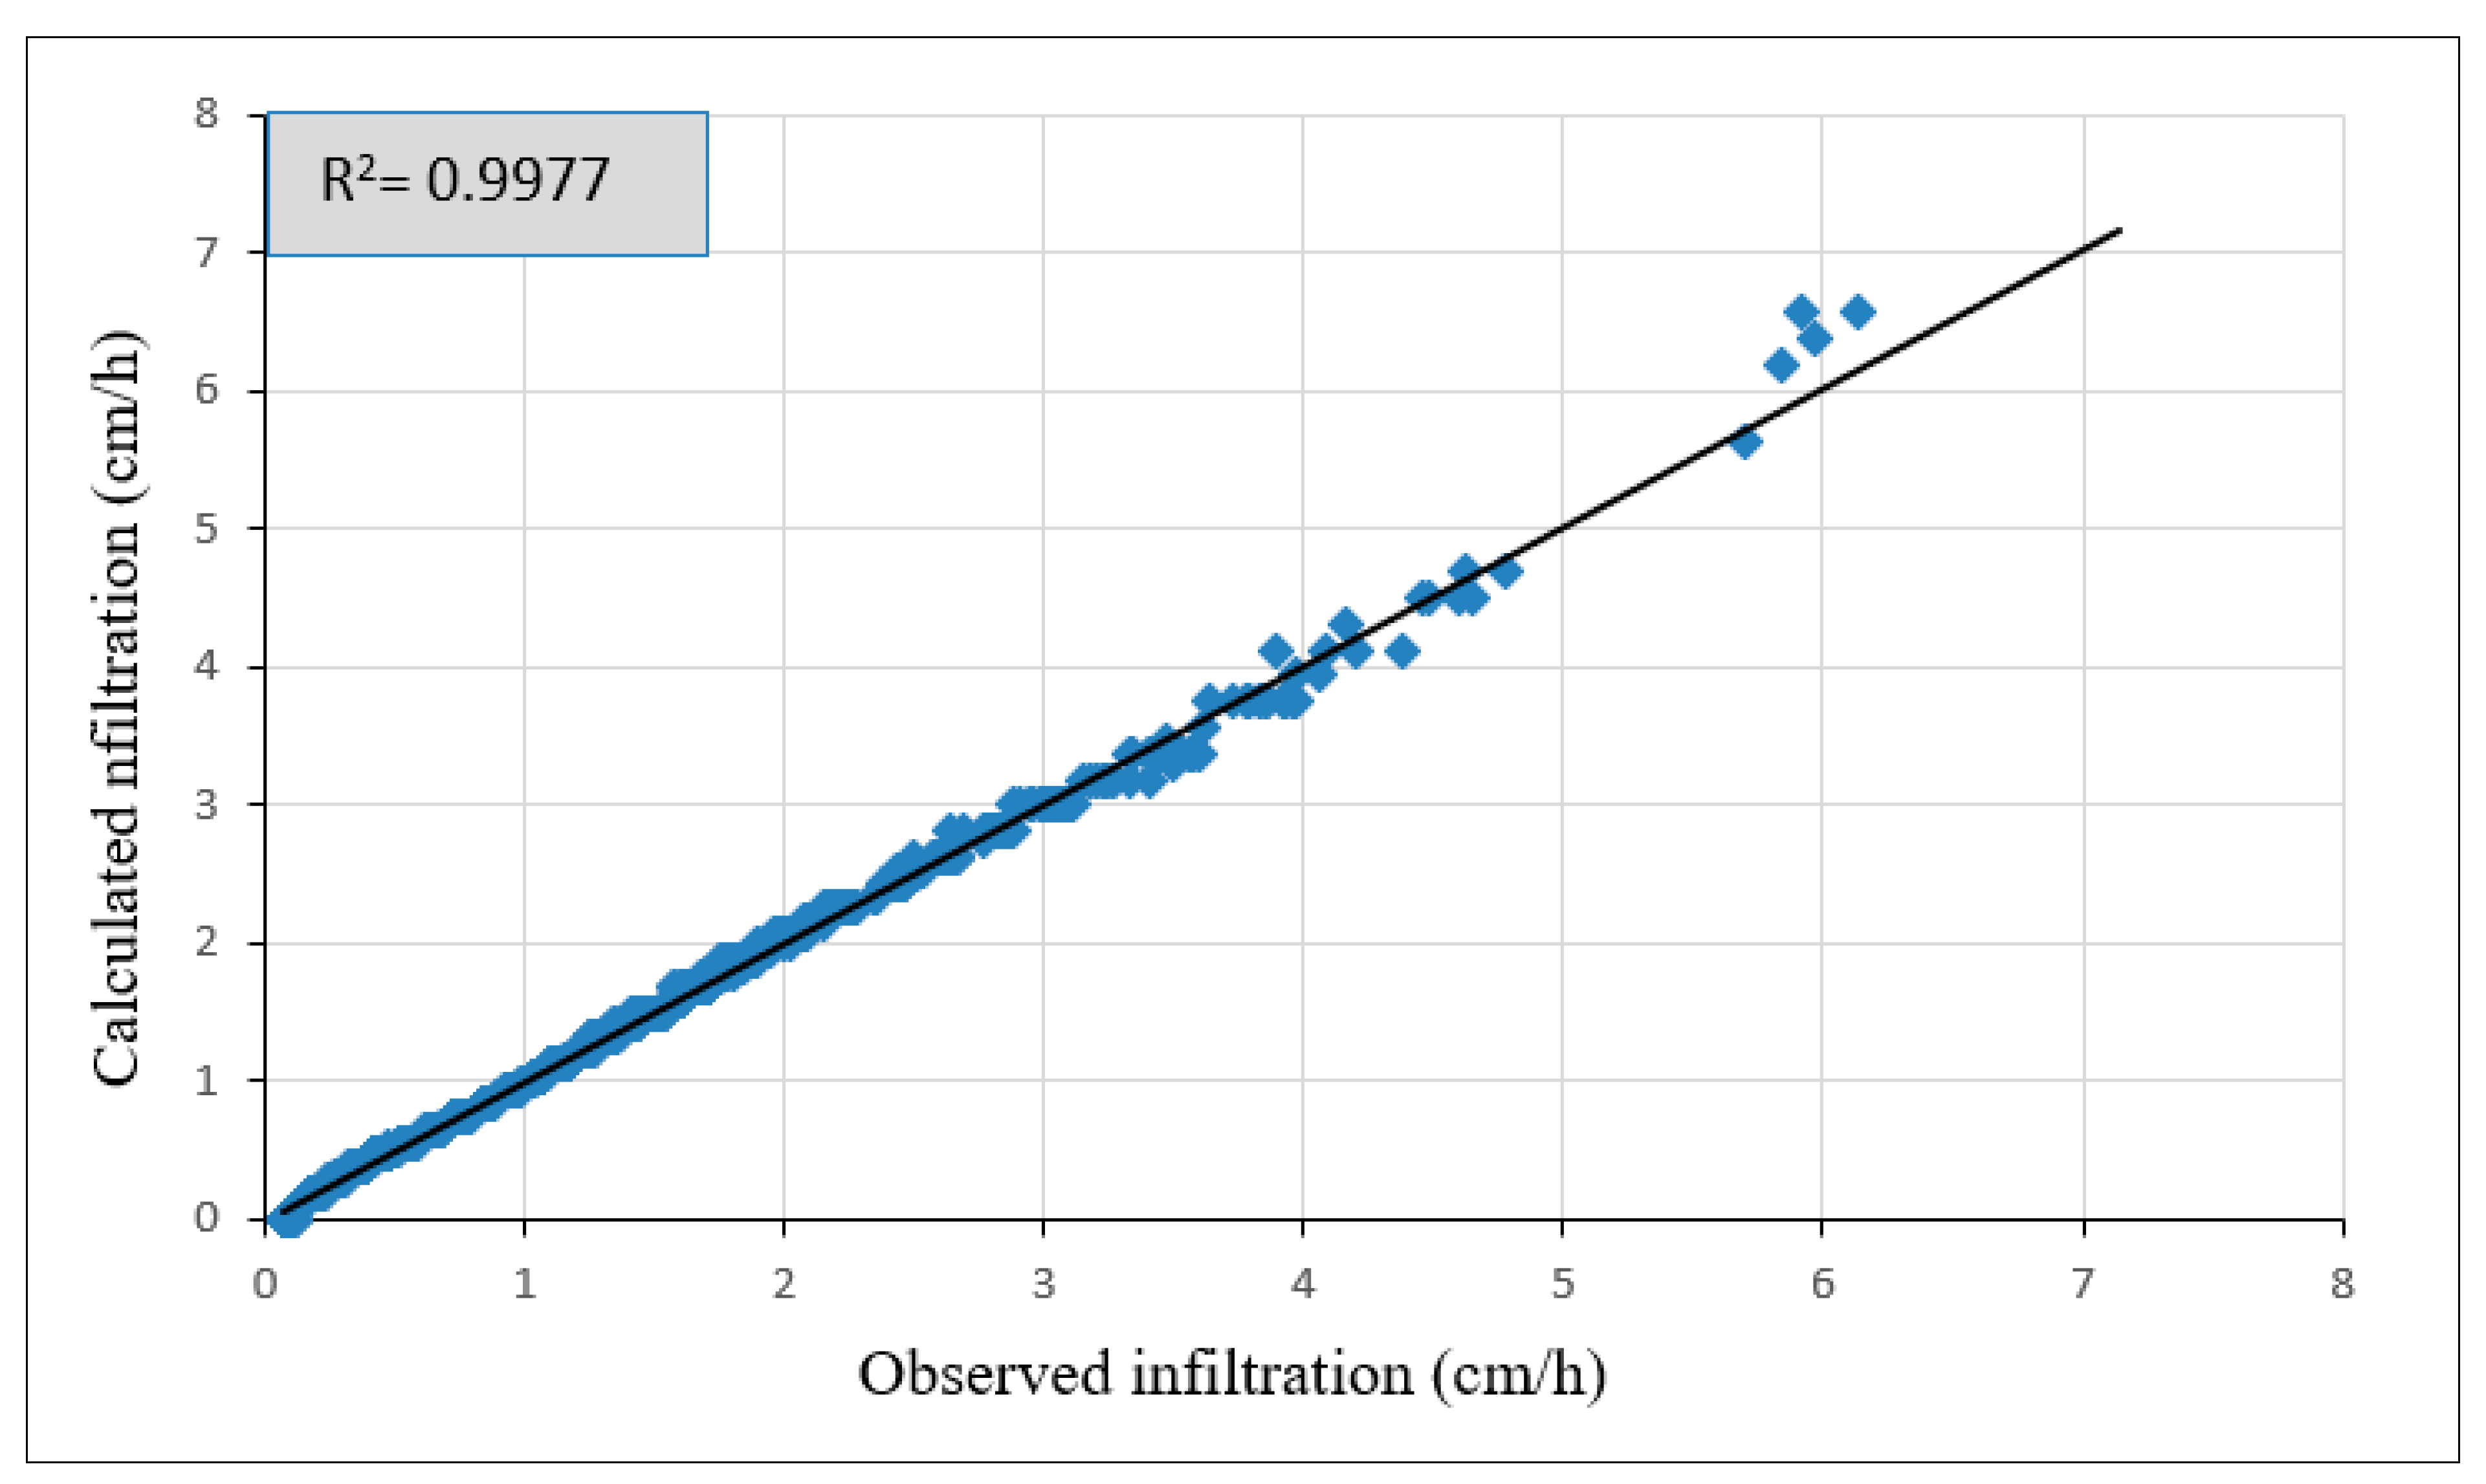
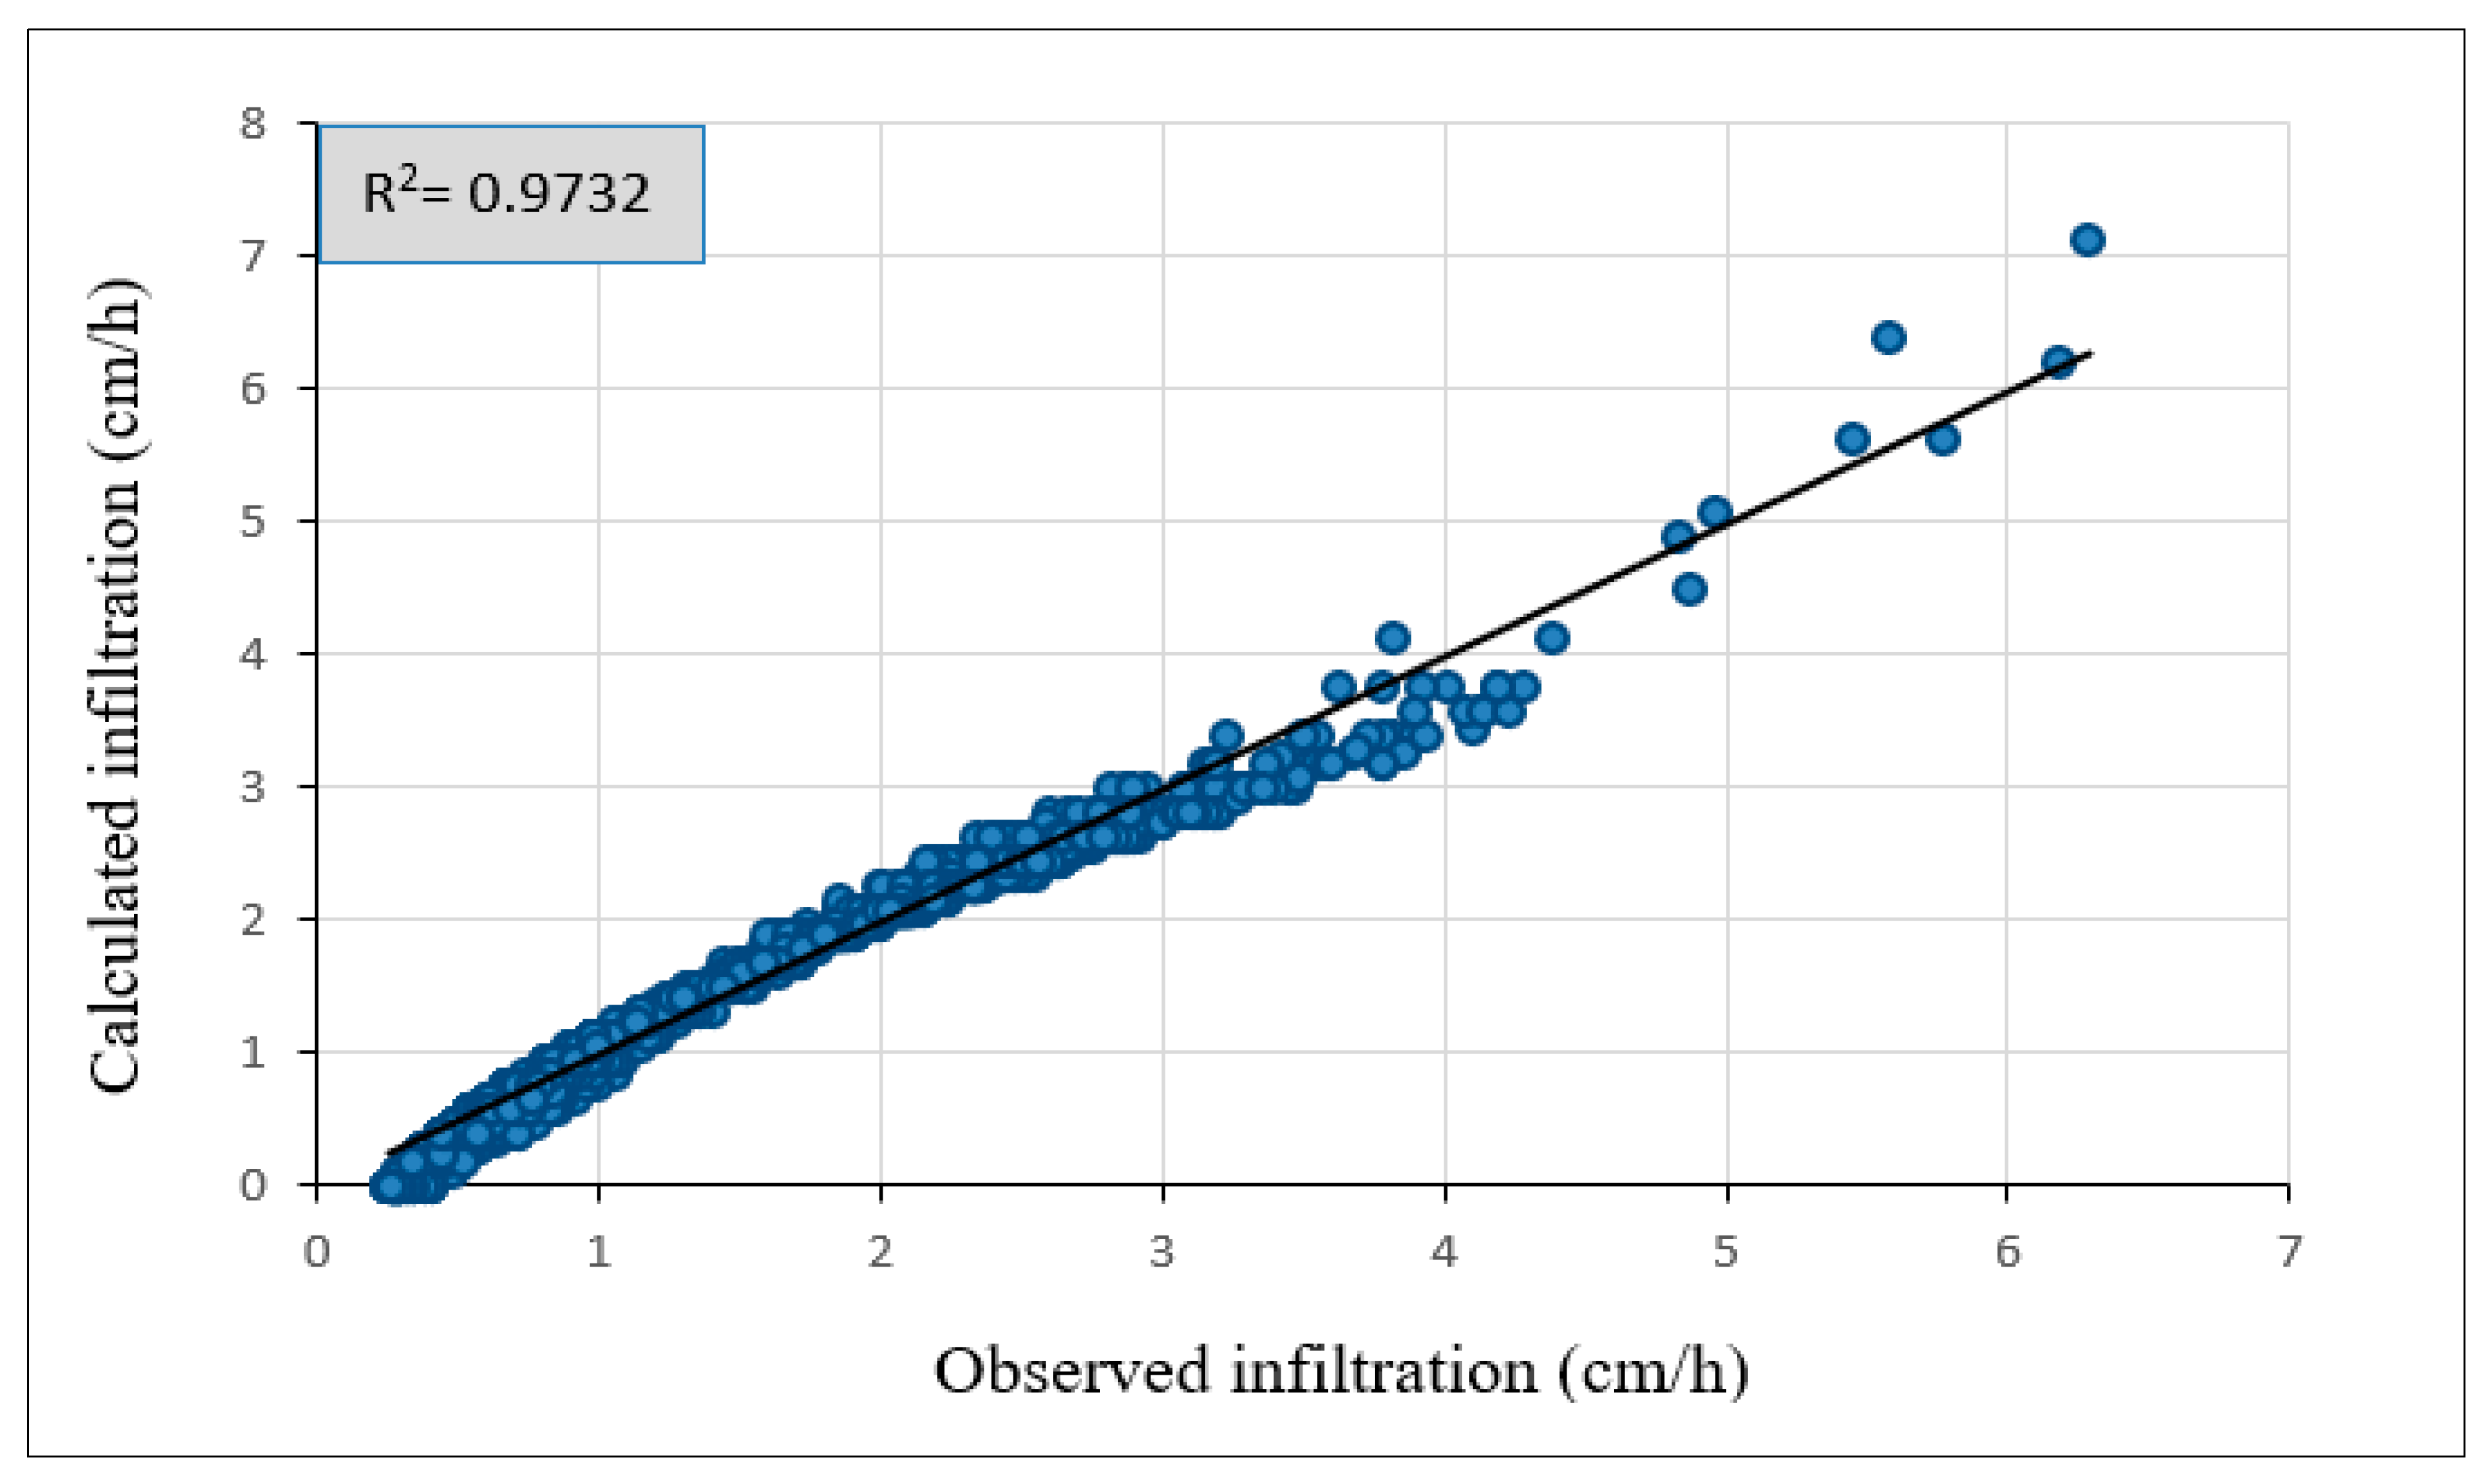
3.4.4. Validation of Modeling

The validation of a model plays a crucial role in the model-building process. It assesses how well the developed model represents the physical or engineering phenomenon under consideration. The aim of validation is to determine the accuracy of the model’s predictions [33]. In order to validate the observation and calculate the infiltration for a permeable interlocking concrete pavement layer, Microsoft Excel 2019 is utilized. The validation process uses the actual 50% of the data that was not utilized in building the models. The comparison of the suggested parameter estimate between observation and calculation parameters is also shown in the results. Additionally, the balls in Figure 68 and Figure 69 depict the input layers as black, the hidden layers as yellow, the bias layer as red, and the output layer as blue.
Figure 70 and Figure 71 illustrate the correlation between the calculated and observed infiltration modulus for permeable pavement. The accuracy of the models, as indicated by the R2 values of 99.97% and 97.32% for the stretcher bond pattern and 45° herringbone pattern, indicates that the models are deemed valid.

4. Conclusions

The performance of the PICP was illustrated by demonstrating how water was distributed beneath its layers following the operation of the rainfall simulator at different intensities. The amount of infiltrated water was quantified by measuring the volume collected in containers across various longitudinal and transverse slopes. Additionally, surface runoff volumes were assessed under different slopes and design parameters to evaluate the total runoff. Furthermore, the distribution of water under the PICP layers was modeled using Surfer 2.0 software, and the whole behavior of both types of PICP (stretcher bond and 45° herringbone patterns) has been statistically analyzed using Artificial Neural Networks (ANNs). The conclusions presented below are based on the outcomes and previous discussions.
  • Under a rainfall intensity of 40 L/min, both stretcher bond and 45° herringbone PICP patterns exhibit comparable water infiltration rates at longitudinal slopes of 0% and 4% T-Slope. However, at an 8% T-Slope, the 45° herringbone pattern outperforms the stretcher bond by demonstrating higher infiltration rates, attributable to its design facilitating greater water penetration over runoff on steeper slopes. This suggests that the 45° herringbone configuration is more effective for enhancing stormwater management in areas with increased gradients.
  • At a rainfall intensity of 80 L/min and a 0% longitudinal slope (L-Slope), both stretcher bond and 45° herringbone PICP patterns exhibited similar water infiltration rates at transverse slopes (T-Slope) of 0% and 4%. However, at an (8% T-Slope), the 45° herringbone pattern surpassed the stretcher bond with greater infiltration. This trend persisted as the longitudinal slope increased to 4% and 8%, where the 45° herringbone PICP consistently outperformed the stretcher bond across all tested transverse slopes. These findings indicate that the 45° herringbone pattern is more effective at enhancing water infiltration under higher slopes and intense rainfall, making it a superior choice for managing stormwater in such conditions.
  • Under the same geometrical and weathering conditions, the PICP’s performance in reducing runoff with a 45° herringbone surface pattern is superior compared to the stretcher bond pattern.
  • The operating tests revealed that both PICP surface patterns, the stretcher bond and 45° herringbone, performed highly and are on par with traditional pavement.
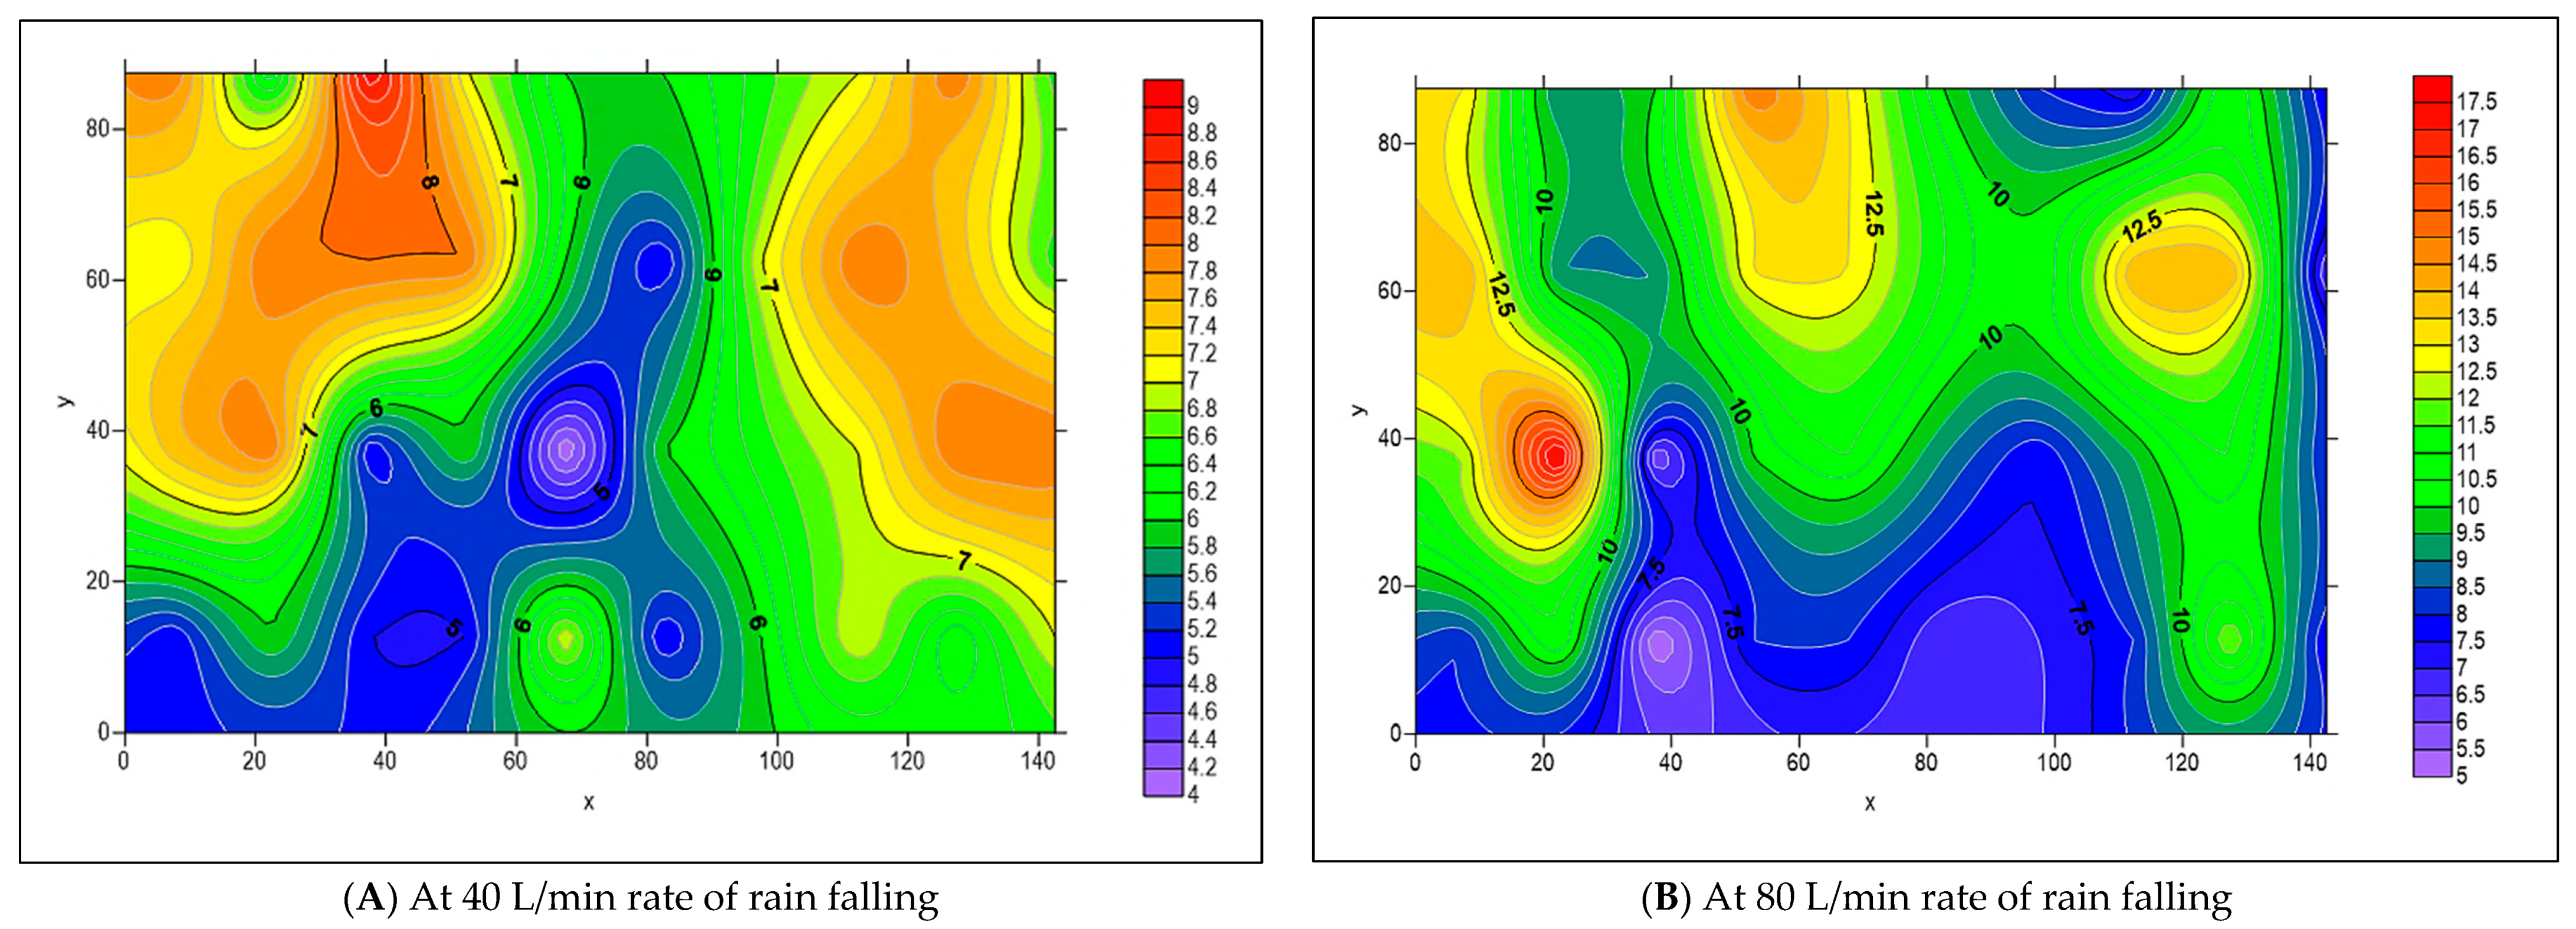
  • The results of the simulation process for the distribution of infiltrated water, as modeled by Surfer 2.0 software, matched the actual distribution in the collection cells.
  • The statistical models for the stretcher bond and 45° herringbone patterns exhibit high accuracy, with R2 values of 99.97% and 97.32%, respectively, indicating their validity.
This study looked at the surface patterns of permeable interlocking pavement in terms of its capacity to absorb water and the volume of runoff at different longitudinal and transverse slopes, as well as under various rainfall intensities. Our study’s major limitations include only using one spacing value between the permeable pavers and not conducting a static load test. To improve upon this research, future studies should give greater attention to these limitations.

Author Contributions

M.A.-F. and F.M.H.; methodology, M.A.-F., B.M.H.A.-k. and S.S.H.; software, T.M.H. and A.S.; validation, M.M.A.-A., A.A.A.-K. and T.M.H.; formal analysis, M.S.N. and T.J.A.; investigation, T.M.A.-A., M.M.A.-A. and M.A.-F.; writing—original draft preparation, T.M.H., A.S., M.S.N. and T.J.A.; writing—review and editing, T.M.H., F.M.H. and B.M.H.A.-k. All authors have read and agreed to the published version of the manuscript.

Funding

This research received no external funding.

Data Availability Statement

The datasets employed and analyzed in this study can be obtained from the corresponding author upon a reasonable request.

Conflicts of Interest

The authors affirm that they have no conflicts of interest to disclose.

References

  1. Hein, D.K.; Eng, P. Development of an ASCE standard for permeable interlocking concrete pavement. In Proceedings of the of the 2014 Conference of the Transportation Association of Canada Montréal, Québec, QC, Canada, 28 September–1 October 2014; Volume 416, pp. 1–15. [Google Scholar]
  2. Leipard, A.R.; Kevern, J.T.; Richardson, J.R. Hydraulic characterization and design of permeable interlocking concrete pavement. In Proceedings of the World Environmental and Water Resources Congress 2015, Austin, TX, USA, 17–21 May 2015. [Google Scholar]
  3. Smith, D.R. Permeable Interlocking Concrete Pavement [Techbrief]; Federal Highway Administration: Washington, DC, USA, 2019. [Google Scholar]
  4. Kayhanian, M.; Li, H.; Harvey, J.T.; Liang, X. Application of permeable pavements in highways for stormwater runoff management and pollution prevention: California research experiences. Int. J. Transp. Sci. Technol. 2019, 8, 358–372. [Google Scholar] [CrossRef]
  5. Al Qurishee, M. Application of geosynthetics in pavement design. Int. Res. J. Eng. Technol. 2017, 4, 1–7. [Google Scholar]
  6. Zhang, K.; Kevern, J. Review of porous asphalt pavements in cold regions: The state of practice and case study repository in design, construction, and maintenance. J. Infrastruct. Preserv. Resil. 2021, 2, 1–17. [Google Scholar] [CrossRef]
  7. Fanijo, E.O.; Kolawole, J.T.; Babafemi, A.J.; Liu, J. A comprehensive review on the use of recycled concrete aggregate for pavement construction: Properties, performance, and sustainability. Clean. Mater. 2023, 9, 100199. [Google Scholar] [CrossRef]
  8. Khan, Z.A.; Balunaini, U.; Costa, S.; Nguyen, N. A review on sustainable use of recycled construction and demolition waste aggregates in pavement base and subbase layers. Clean. Mater. 2024, 13, 100266. [Google Scholar] [CrossRef]
  9. Putman, B.J.; Neptune, A.I. Comparison of test specimen preparation techniques for pervious concrete pavements. Constr. Build. Mater. 2011, 25, 3480–3485. [Google Scholar] [CrossRef]
  10. Mo, L.T.; Huurman, M.; Wu, S.P.; Molenaar, A.A.A. Investigation into stress states in porous asphalt concrete on the basis of FE-modelling. Finite Elem. Anal. Des. 2007, 43, 333–343. [Google Scholar] [CrossRef]
  11. Park, D.-G.; Sandoval, N.; Lin, W.; Kim, H.; Cho, Y.-H. A case study: Evaluation of water storage capacity in permeable block pavement. KSCE J. Civ. Eng. 2014, 18, 514–520. [Google Scholar] [CrossRef]
  12. W. B.Nichols, P.; Lucke, T.; Dierkes, C. Comparing two methods of determining infiltration rates of permeable interlocking concrete pavers. Water 2014, 6, 2353–2366. [Google Scholar] [CrossRef]
  13. Smith, D.R.; Earley, K.; Lia, J. Potential application of ASTM C 1701 for evaluating Surface infiltration of permeable interlocking concrete pavements; ASTM Special Technical Publication: West Conshohocken, PA, USA, 2012; pp. 97–105. [Google Scholar] [CrossRef]
  14. Smith, D.R.; Hein, D.K. Development of a National ASCE standard for permeable interlocking concrete pavement. In Green Streets, Highways, and Development 2013: Advancing the Practice; ASCE: Reston, VA, USA, 2013; pp. 89–105. [Google Scholar]
  15. Hashim, T.M.; Al-mulali, M.Z.; Al-Khafaji, F.F.; Alwash, A.A.A.; Ali, Y.A. An experimental comparison between different types of surface patterns of permeable interlocking concrete pavement for roadway subsurface drainage. Case Stud. Constr. Mater. 2022, 17, e01227. [Google Scholar] [CrossRef]
  16. Hein, D.K.; Strecker, E.; Poresky, A.; Roseen, R.; Venner, M. Permeable Shoulders with Stone Reservoirs; American Association of State Highway and Transportation Officials (AASHTO): Washington, DC, USA, 2013. [Google Scholar]
  17. Yusuf, K.O.; Olaoke, S.O.; Iwayemi, A.K.; Adewoye, W.A.; Oyebode, O.O.; Omokore, S. Design and construction of a simple rainfall simulator from locally available materials. LAUTECH J. Eng. Technol. 2015, 9, 13–19. [Google Scholar]
  18. Mendes, T.A.; Pereira, S.A. dos S.; Rebolledo, J.F.R.; Gitirana Jr, G. de F.N.; Melo, M.T. da S.; Luz, M.P. da Development of a rainfall and runoff simulator for performing hydrological and geotechnical tests. Sustainability 2021, 13, 3060. [Google Scholar] [CrossRef]
  19. Alzamly, S.A.; Aldefae, A.H.; Humaish, W.H.; Sinichenko, E.K.; Zubaidi, S.L. Design and manufacturing of rainfall simulator machine for the soil erosion investigation. In Geotechnical Engineering and Sustainable Construction: Sustainable Geotechnical Engineering; Springer: Berlin/Heidelberg, Germany, 2022; pp. 177–190. [Google Scholar]
  20. Mhaske, S.N.; Pathak, K.; Basak, A. A comprehensive design of rainfall simulator for the assessment of soil erosion in the laboratory. Catena 2019, 172, 408–420. [Google Scholar] [CrossRef]
  21. ASTM C418; Standard Test Method for Abrasion Resistance of Concrete by Sandblasting. ASTM International: West Conshohocken, PA, USA, 2012.
  22. ASTM C563; Standard Test Method for Approximation of Optimum SO3 in Hydraulic Cement Using Compressive Strength. ASTM International: West Conshohocken, PA, USA, 1996.
  23. ASTM C140; Standard Test Methods for Sampling and Testing Concrete Masonry Units and Related Units. ASTM International: West Conshohocken, PA, USA, 2008.
  24. ASTM D448; Standard Classification for Sizes of Aggregate for Road and Bridge Construction. ASTM International: West Conshohocken, PA, USA, 2008.
  25. Abdollahi, S.F.; Lanotte, M.; Kutay, M.E.; Bahia, H. AASHTO 1993 Plus: An alternative procedure for the calculation of structural asphalt layer coefficients. Int. J. Pavement Eng. 2022, 24, 2118273. [Google Scholar] [CrossRef]
  26. Knothe, G.J. The Influence of Urbanization on Streams: The Use of GIS Spatial Analysis to Study Land Use Influence on Fish Communities, Water Quality and Physical Habitats in Southeast Texas; University of Houston-Clear Lake: Houston, TX, USA, 2012. [Google Scholar]
  27. Hashim, T.M.; Al-Fatlawi, T.J.; Al-Abody, A.A.; Musa, D.A.; Nasr, M.S. The behavior of permeable interlocking concrete pavement under different rainfall intensities and design conditions. Int. J. Pavement Eng. 2023, 24, 2152026. [Google Scholar] [CrossRef]
  28. Smith, D.R.; Sinagra, E.; Duvall, J. Surface Characteristics of Segmental Concrete Pavements Acceptable to Wheelchair Users. In Proceedings of the 12th International Conference on Concrete Block Pavement, Seoul, Republic of Korea, 16–19 October 2018; Volume 16. [Google Scholar]
  29. Chatfield, C. Prediction intervals for time-series forecasting. In Principles of Forecasting: A Handbook for Researchers and Practitioners; Springer: Boston, MA, USA, 2001; pp. 475–494. [Google Scholar]
  30. Gershenson, C. Artificial neural networks for beginners. arXiv 2003, arXiv:cs/0308031. [Google Scholar]
  31. Karsoliya, S. Approximating number of hidden layer neurons in multiple hidden layer BPNN architecture. Int. J. Eng. Trends Technol. 2012, 3, 714–717. [Google Scholar]
  32. Ghanizadeh, A.R.; Heidarabadizadeh, N.; Jalali, F. Artificial neural network back-calculation of flexible pavements with sensitivity analysis using Garson’s and connection weights algorithms. Innov. Infrastruct. Solut. 2020, 5, 1–19. [Google Scholar] [CrossRef]
  33. Shubbar, A.; Nasr, M.S.; Kadhim, A.; Hashim, T.M.; Sadique, M. Performance Comparison of 45° and 90° Herringboned Permeable Interlocking Concrete Pavement. Infrastructures 2023, 8, 97. [Google Scholar] [CrossRef]
Figure 1. The benefits of using PICP.
Civileng 06 00024 g001
Figure 2. Permeable pavement surface types.
Civileng 06 00024 g002
Figure 3. The adopted PICP surface patterns.
Civileng 06 00024 g003
Figure 4. Principe types of PICP cross-sections.
Civileng 06 00024 g004
Figure 5. Details of the fabricated simulator [15].
Civileng 06 00024 g005
Figure 6. Sketch of the fabricated simulator [15].
Civileng 06 00024 g006
Figure 7. The rain-dropping system.
Civileng 06 00024 g007
Figure 8. Connected system to supply water [15].
Civileng 06 00024 g008
Figure 9. Flowmeter.
Civileng 06 00024 g009
Figure 10. Steel water containers.
Civileng 06 00024 g010
Figure 11. Steel container to collect runoff [15].
Civileng 06 00024 g011
Figure 12. Paver concrete.
Civileng 06 00024 g012
Figure 13. Joint spacing.
Civileng 06 00024 g013
Figure 14. Aggregate-filling.
Civileng 06 00024 g014
Figure 15. Aggregate for the base layer.
Civileng 06 00024 g015
Figure 16. Aggregate for the reservoir layer.
Civileng 06 00024 g016
Figure 17. The gradation of aggregate for the layers of PICP.
Civileng 06 00024 g017
Figure 18. A cross-section in PICP.
Civileng 06 00024 g018
Figure 19. Finalizing process of PICP surface pavers. (A) Filling process of joints [27]; (B) Sweeping and distribution [27].
Civileng 06 00024 g019
Figure 20. The implemented PICP surface patterns.
Civileng 06 00024 g020
Figure 21. The sequence of the water collection cells [27].
Civileng 06 00024 g021
Figure 22. Simulating rainfall. (A) Stretcher bond [15]; (B) 45° herringbone [15].
Civileng 06 00024 g022
Figure 23. Water infiltration volume for PICP surface patterns with 0% L-Slope and (0, 4, and 8%) T-Slope.
Civileng 06 00024 g023
Figure 24. Water infiltration volume for PICP surface patterns with 4% L-Slope and (0, 4, and 8%) T-Slope.
Civileng 06 00024 g024
Figure 25. Water infiltration volume for PICP surface patterns with 8% L-Slope and (0, 4, and 8%) T-Slope.
Civileng 06 00024 g025
Figure 26. Number of PICP blocks per m2.
Civileng 06 00024 g026
Figure 27. Infiltration of PICP surface area per m2.
Civileng 06 00024 g027
Figure 28. The spread of infiltrated water across the surface pattern of stretcher bond at 0% L-Slope and 0% T-Slope.
Civileng 06 00024 g028
Figure 29. The spread of infiltrated water across the surface pattern of stretcher bond at 0% L-Slope and 0% T-Slope using Surfer 2.0 software.
Civileng 06 00024 g029
Figure 30. The spread of infiltrated water across the surface pattern of 45° herringbone at 0% L-Slope and 0% T-Slope.
Civileng 06 00024 g030
Figure 31. The spread of infiltrated water across the surface pattern of 45° herringbone at 0% L-Slope and 0% T-Slope using Surfer 2.0 software.
Civileng 06 00024 g031
Figure 32. The spread of infiltrated water across the surface pattern of stretcher bond at 0% L-Slope and 4% T-Slope.
Civileng 06 00024 g032
Figure 33. The spread of infiltrated water across the surface pattern of stretcher bond at 0% L-Slope and 4% T-Slope using Surfer 2.0 software.
Civileng 06 00024 g033
Figure 34. The spread of infiltrated water across the surface pattern of 45° herringbone at 0% L-Slope and 4% T-Slope.
Civileng 06 00024 g034
Figure 35. The spread of infiltrated water across the surface pattern of 45° herringbone at 0% L-Slope and 4% T-Slope using Surfer 2.0 software.
Civileng 06 00024 g035
Figure 36. The spread of infiltrated water across the surface pattern of stretcher bond at 0% L-Slope and 8% T-Slope.
Civileng 06 00024 g036
Figure 37. The spread of infiltrated water across the surface pattern of stretcher bond at 0% L-Slope and 8% T-Slope using Surfer 2.0 software.
Civileng 06 00024 g037
Figure 38. The spread of infiltrated water across the surface pattern of 45° herringbone at 0% L-Slope and 8% T-Slope.
Civileng 06 00024 g038
Figure 39. The spread of infiltrated water across the surface pattern of 45° herringbone at 0% L-Slope and 8% T-Slope using Surfer 2.0 software.
Civileng 06 00024 g039
Figure 40. The spread of infiltrated water across the surface pattern of stretcher bond at 4% L-Slope and 0% T-Slope.
Civileng 06 00024 g040
Figure 41. The spread of infiltrated water across the surface pattern of stretcher bond at 4% L-Slope and 0% T-Slope using Surfer 2.0 software.
Civileng 06 00024 g041
Figure 42. The spread of infiltrated water across the surface pattern of 45° herringbone at 4% L-Slope and 0% T-Slope.
Civileng 06 00024 g042
Figure 43. The spread of infiltrated water across the surface pattern of 45° herringbone at 4% L-Slope and 0% T-Slope using Surfer 2.0 software.
Civileng 06 00024 g043
Figure 44. The spread of infiltrated water across the surface pattern of stretcher bond at 8% L-Slope and 0% T-Slope.
Civileng 06 00024 g044
Figure 45. The spread of infiltrated water across the surface pattern of stretcher bond at 8% L-Slope and 0% T-Slope using Surfer 2.0 software.
Civileng 06 00024 g045
Figure 46. The spread of infiltrated water across the surface pattern of 45° herringbone at 8% L-Slope and 0% T-Slope.
Civileng 06 00024 g046
Figure 47. The spread of infiltrated water across the surface pattern of 45° herringbone at 8% L-Slope and 0% T-Slope using Surfer 2.0 software.
Civileng 06 00024 g047
Figure 48. The spread of infiltrated water across the surface pattern of stretcher bond at 4% L-Slope and 4% T-Slope.
Civileng 06 00024 g048
Figure 49. The spread of infiltrated water across the surface pattern of stretcher bond at 4% L-Slope and 4% T-Slope using Surfer 2.0 software.
Civileng 06 00024 g049
Figure 50. The spread of infiltrated water across the surface pattern of 45° herringbone at 4% L-Slope and 4% T-Slope.
Civileng 06 00024 g050
Figure 51. The spread of infiltrated water across the surface pattern of 45° herringbone at 4% L-Slope and 4% T-Slope using Surfer 2.0 software.
Civileng 06 00024 g051
Figure 52. The spread of infiltrated water across the surface pattern of stretcher bond at 8% L-Slope and 4% T-Slope.
Civileng 06 00024 g052
Figure 53. The spread of infiltrated water across the surface pattern of stretcher bond at 8% L-Slope and 4% T-Slope using Surfer 2.0 software.
Civileng 06 00024 g053
Figure 54. The spread of infiltrated water across the surface pattern of 45° herringbone at 8% L-Slope and 4% T-Slope.
Civileng 06 00024 g054
Figure 55. The spread of infiltrated water across the surface pattern of 45° herringbone at 8% L-Slope and 4% T-Slope using Surfer 2.0 software.
Civileng 06 00024 g055
Figure 56. The spread of infiltrated water across the surface pattern of stretcher bond at 4% L-Slope and 8% T-Slope.
Civileng 06 00024 g056
Figure 57. The spread of infiltrated water across the surface pattern of stretcher bond at 4% L-Slope and 8% T-Slope using Surfer 2.0 software.
Civileng 06 00024 g057
Figure 58. The spread of infiltrated water across the surface pattern of 45° herringbone at 4% L-Slope and 8% T-Slope.
Civileng 06 00024 g058
Figure 59. The spread of infiltrated water across the surface pattern of 45° herringbone at 4% L-Slope and 8% T-Slope using Surfer 2.0 software.
Civileng 06 00024 g059
Figure 60. The spread of infiltrated water across the surface pattern of stretcher bond at 8% L-Slope and 8% T-Slope.
Civileng 06 00024 g060
Figure 61. The spread of infiltrated water across the surface pattern of stretcher bond at 8% L-Slope and 8% T-Slope using Surfer 2.0 software.
Civileng 06 00024 g061
Figure 62. The spread of infiltrated water across the surface pattern of 45° herringbone at 8% L-Slope and 8% T-Slope.
Civileng 06 00024 g062
Figure 63. The spread of infiltrated water across the surface pattern of 45° herringbone at 8% L-Slope and 8% T-Slope using Surfer 2.0 software.
Civileng 06 00024 g063
Figure 64. Runoff water volume during a 40 L/min rainfall event.
Civileng 06 00024 g064
Figure 65. Runoff water volume during an 80 L/min rainfall event.
Civileng 06 00024 g065
Figure 66. Distribution of weights in (ANN) for infiltration in permeable pavements using a stretcher bond pattern.
Civileng 06 00024 g066
Figure 67. Distribution of weights in (ANN) for infiltration in permeable pavements using a 45° herringbone pattern.
Civileng 06 00024 g067
Figure 68. Schematic of a neural network system using a stretcher bond pattern.
Civileng 06 00024 g068
Figure 69. Schematic of a neural network system using a 45° herringbone pattern.
Civileng 06 00024 g069
Figure 70. Comparison of calculated and observed infiltration values using an artificial neural network model with a stretcher bond pattern.
Civileng 06 00024 g070
Figure 71. Comparison of calculated and observed infiltration values using an artificial neural network model with a 45° herringbone pattern.
Civileng 06 00024 g071
Table 1. The physical properties of the pavers.
CharacteristicResultCriteriaSpecification
Loss in thickness as a result of abrasion1.79 mmASTM C418 [21]Max. level (3.0 mm)
SO32.69%ASTM C563-96 [22]Max. level (6%)
by weight of cement
Absorption2.70%ASTM C140 [23] Max. level (7%)
Compressive strength37.83 MPaASTM C140 [23]Min. level (20 MPa)
Table 2. The permeability coefficients of the various pavement layers [25].
Layers of PavementThe Values of (a), Layers Coefficient
Surface and beddinga1 = 0.3
Basea2 = 0.09
Subbase (reservoir)a3 = 0.06
Table 3. Calculation of reservoir layer depth based on structural and hydraulic design.
Design ApproachReservoir DepthMinimum Limit
Structural design40 cm20 cm
Hydraulic design35 cm
Table 4. The connection between nodes in a neural network system and the respective weight for each connection in the stretcher bond pattern.
SeriesNode-Line ConnectionWeightsSeriesNode-Line ConnectionWeights
W1N1L1-N1L2−0.0277W22N5L1-N2L2−0.0719
W2N1L1-N2L20.3773W23N5L1-N3L20.5719
W3N1L1-N3L2−0.877W24N5L1-N4L20.1279
W4N1L1-N4L2−0.6111W25N5L1-N5L20.0582
W5N1L1-N5L2−0.2072W26N6L1-N1L211.856
W6N2L1-N1L2−0.0659W27N6L1-N2L2−2.8843
W7N2L1-N2L2−0.3729W28N6L1-N3L20.2384
W8N2L1-N3L20.3528W29N6L1-N4L22.061
W9N2L1-N4L20.5816W30N6L1-N5L2−2.3189
W10N2L1-N5L20.1727Q31B1-N1L20.6431
W11N3L1-N1L20.0196Q32B1-N2L2−2.551
W12N3L1-N2L20.1665Q33B1-N3L20.6061
W13N3L1-N3L2−0.1611Q34B1-N4L2−0.4507
W14N3L1-N4L2−0.2924Q35B1-N5L2−0.7204
W15N3L1-N5L2−0.0848W36N1L2-N1L30.2504
W16N4L1-N1L2−0.0102W37N2L2-N1L3−0.8357
W17N4L1-N2L20.4785W38N3L2-N1L30.0369
W18N4L1-N3L20.2593W39N4L2-N1L30.1956
W19N4L1-N4L2−0.647W40N5L2-N1L3−0.6857
W20N4L1-N5L2−0.1726Q41B2-N1L3−0.017
W21N5L1-N1L2−0.0366
Table 5. The connection between nodes in a neural network system and the respective weight for each connection in the 45° herringbone pattern.
SeriesNode-Line ConnectionWeightsSeriesNode-Line ConnectionWeights
W1N1L1-N1L2−0.0088W22N5L1-N2L2−0.6679
W2N1L1-N2L2−0.1813W23N5L1-N3L20.7279
W3N1L1-N3L20.2189W24N5L1-N4L20.1254
W4N1L1-N4L2−0.2727W25N5L1-N5L20.7597
W5N1L1-N5L2−0.0145W26N6L1-N1L21.646
W6N2L1-N1L20.0864W27N6L1-N2L2−0.2469
W7N2L1-N2L20.1435W28N6L1-N3L21.6375
W8N2L1-N3L2−0.1535W29N6L1-N4L23.3364
W9N2L1-N4L2−0.0625W30N6L1-N5L21.0578
W10N2L1-N5L2−0.228Q31B1-N1L20.2936
W11N3L1-N1L20.0737Q32B1-N2L20.4334
W12N3L1-N2L2−0.6341Q33B1-N3L20.5343
W13N3L1-N3L2−0.3155Q34B1-N4L2−0.2177
W14N3L1-N4L20.0865Q35B1-N5L2−0.943
W15N3L1-N5L20.8044W36N1L2-N1L30.7718
W16N4L1-N1L20.0625W37N2L2-N1L3−0.478
W17N4L1-N2L2−0.731W38N3L2-N1L30.3384
W18N4L1-N3L2−0.2891W39N4L2-N1L30.6166
W19N4L1-N4L20.035W40N5L2-N1L3−0.9633
W20N4L1-N5L20.7239Q41B2-N1L30.4636
W21N5L1-N1L2−0.3792
Disclaimer/Publisher’s Note: The statements, opinions and data contained in all publications are solely those of the individual author(s) and contributor(s) and not of MDPI and/or the editor(s). MDPI and/or the editor(s) disclaim responsibility for any injury to people or property resulting from any ideas, methods, instructions or products referred to in the content.

