Article

Structural Performance of a Hollow-Core Square Concrete Column Longitudinally Reinforced with GFRP Bars under Concentric Load

1
Department of Civil Engineering, College of Engineering, University of Baghdad, Baghdad 17001, Iraq
2
L2MGC—Civil Engineering Mechanics and Materials Laboratory, CY Cergy-Paris University, 95031 Neuville-sur-Oise, France
*
Author to whom correspondence should be addressed.
CivilEng 2024, 5(4), 928-948; https://doi.org/10.3390/civileng5040047
Submission received: 27 June 2024 / Revised: 2 August 2024 / Accepted: 8 October 2024 / Published: 15 October 2024
(This article belongs to the Collection Recent Advances and Development in Civil Engineering)

Abstract

:
Concrete columns with hollow-core sections find widespread application owing to their excellent structural efficiency and efficient material utilization. However, corrosion poses a challenge in concrete buildings with steel reinforcement. This paper explores the possibility of using glass fiber-reinforced polymer (GFRP) reinforcement as a non-corrosive and economically viable substitute for steel reinforcement in short square hollow concrete columns. Twelve hollow short columns were meticulously prepared in the laboratory experiments and subjected to pure axial compressive loads until failure. All columns featured a hollow square section with exterior dimensions of (180 × 180) mm and 900 mm height. The columns were categorized into four separate groups with different variables: steel and GFRP longitudinal reinforcement ratio, hollow ratio, spacing between ties, and reinforcement type. The experimental findings point to the compressive participation of longitudinal GFRP bars, estimated to be approximately 35% of the tensile strength of GFRP bars. Notably, increasing GFRP longitudinal reinforcement significantly improved the ultimate load capability of hollow square GFRP column specimens. Specifically, elevating the ratio of GFRP reinforcement from 1.46% to 2.9%, 3.29%, 4.9%, and 5.85% resulted in axial load capacity improvements of 32.3%, 43.9%, 60.5%, and 71.7%, respectively. Specifically, the GFRP specimens showed a decrease in capacity of 13.1%, 9.2%, and 9.4%, respectively. Notably, the load contribution of steel reinforcement to GFRP reinforcement (with similar sectional areas) was from approximately three to four times the axial peak load, highlighting the greater load participation of steel reinforcement due to its higher elastic modulus. In addition, the numerical modeling and analysis conducted using ABAQUS/CAE 2019 software exhibited strong concordance with experimental findings concerning failure modes and capacity to carry axial loads.

1. Introduction

Reinforced concrete columns are essential for concrete buildings to be stable and to make it easier to distribute applied loads to the foundation. High strength and suitable rigidity are necessary for these structural elements. Consequently, hollow concrete columns have gained prominence due to their ability to enhance the efficiency of reinforced concrete (RC) columns within buildings. Compared to solid concrete columns of equivalent cross-sectional dimensions, hollow columns exhibit superior strength and stiffness while maintaining a lighter overall weight [1,2,3,4].
Reinforced concrete columns, whether found in concrete piles or used in bridges and maritime constructions, are particularly susceptible to the corrosion of embedded steel. Exposure to moisture and other environmental stresses significantly reduces these supporting components’ load-bearing capability and overall strength. As a result, corroded components may reach their ultimate service life sooner than intended during the design phase. Strengthening the columns of deteriorated reinforced structures is a practical approach to extending the lifetime of such constructions [5,6,7,8].
Various techniques are employed to reduce corrosion and increase the functional duration of concrete-reinforced buildings. These methods include using stainless steel, corrosion-resistant composites, anodic and cathodic protection, corrosion inhibitors, corrosion-resistant alloys, protective coatings, metallic coatings, and other protective measures. However, some treatments exhibit low-efficiency rates or come with substantial costs. As internal reinforcement in modern concrete buildings, fiber-reinforced polymer (FRP) bars are frequently utilized due to their track record of performance [9,10,11,12].
Many studies have explored the function of FRP constructions in the last several years. The main goal was to determine how glass fiber-reinforced polymer (GFRP) reinforcement affected the load capability of columns under various load scenarios, given the scarcity of studies specifically addressing internal GFRP reinforcement within concrete columns. As stated by the ACI 440.1R-15 [13], it is expressly forbidden for designers to use longitudinal GFRP reinforcement as compressive bars in columns. However, the CAN/CSA-S806-12 [14] code suggests that the compressive impact of GFRP reinforcement is insignificant. In contrast, the latest ACI 440.1R-22 [15] code allows the use of GFRP in columns. However, it neglects the role of GFRP reinforcement in the concrete compression zone, assuming that GFRP reinforcing bars have no compressive strength or stiffness. It allows them to be replaced with concrete in calculations. For the usage of GFRP in compression members, appropriate design requirements must be developed to gain widespread acceptability among users.
GFRP bars may be employed in columns with minor adjustments to the current design equations, according to several studies conducted in recent years. Castro et al. [16] examined the impact of GFRP reinforcement on concrete columns. The researchers used square concrete columns of varying heights and concrete grades, with two groups: 800 mm and 1600 mm in height. GFRP bars and ties spaced 200 mm apart were employed for bracing. Notably, GFRP reinforcement in concrete columns made them more susceptible to buckling. Specifically, GFRP-reinforced columns, especially those with low-grade concrete, exhibited increased vulnerability to buckling. Mirmiran et al. [17] analyzed slender GFRP-reinforced concrete columns. Their findings indicated that variations in GFRP reinforcement’s tensile and compressive strength had minimal impact on column slenderness. The study suggested lowering the current GFRP-RC column slenderness limitation from 22 to 17. Choo [18] investigated numerous probable failures and the state of the GFRP-reinforced column under axial load. Choo studied the axial strength–moment interaction (P-M) and failure modes. The study determined that GFRP-RC columns exhibited a significant advantage over steel RC columns with equivalent stiffness. This advantage was particularly beneficial for GFRP-RC columns when resisting significant bending forces. De Luca et al. [19] examined square concrete columns with GFRP reinforcement. The investigation focused on axial load effects, column strength, and failure mechanisms. Smaller tie spacing led to the gradual collapse and more significant axial deformation in GFRP-RC columns than steel-reinforced ones. Steel-reinforced columns exhibited steel bar buckling, whereas GFRP columns broke as a consequence of concrete core crushing. The participation of GFRP reinforcement to peak load was less than 5%, suggesting that estimating axial capacity can exclude GFRP longitudinal bars. The performance of a full-size circular RC column with GFRP bars was studied by Tavassoli [20]. The tested columns, measuring 1473 mm in height and 356 mm in diameter, were exposed to axial and flexural stresses. In addition, GFRP-RC columns exhibited stable post-peak responses and high deformability. A high transverse reinforcement ratio must be utilized for GFRP-RC columns that experience intense axial stresses. GFRP-RC columns exhibit better resistance to axial loads compared to steel-reinforced columns. Unlike longitudinal steel reinforcement, which tends to yield after a certain strain, GFRP longitudinal reinforcement can withstand significantly higher stresses before failing. Al-Ajarmeh et al. [21] investigated hollow-section columns with spirals and longitudinal bars made of GFRP. According to this study, a ductile failure reaction was seen when the ratio of inner-to-outer diameter was raised to 36%. GFRP-reinforced hollow columns have a greater confinement efficiency than solid GFRP-reinforced and hollow columns reinforced with steel. These findings imply that hollow concrete columns reinforced with GFRP might be more resilient and sustainable. Furthermore, the application of GFRP bars for concrete columns subjected to eccentric and concentric stresses was investigated by Abed et al. [22]. According to their findings, steel-reinforced concrete columns could support more load than GFRP columns. In particular, 22% and 34% reduced ultimate capacities for concentric and eccentric loads, respectively. Nevertheless, the two types of columns showed the same failure mechanisms. About 10.5% of the final column capacity under concentric loading was contributed by GFRP bars.
The extensive literature study that was previously mentioned sheds essential insight into the behavioral aspects of GFRP-reinforced columns. Prior research studies and technical developments have mainly concentrated on solid concrete columns. However, this paper aims to advance existing understanding by thoroughly investigating hollow square concrete columns reinforced with GFRP bars. The main goal is to determine the critical design elements that substantially influence these columns’ performance and to analyze how these columns behave under concentric compression pressures.

2. Experimental Procedure and Methodology

2.1. Column Specimens

Twelve short hollow column specimens with a 180 mm × 180 mm square hollow section and a height of 900 mm were prepared in experimental work. All specimens had concrete covers that were 20 mm thick. All columns were loaded concentrically until they failed. The letters “G” and “S” were used to indicate that the column was reinforced with GFRP or steel, and the following letter “R” and numbers refer to main bar reinforcement ratios. The second part with the letter “S” represents the uniform spacing of tie reinforcement, and the last part with the letter “H” represents the hollow ratio. Four separate sets of columns were created from the specimens. Group 1 included three columns, each reinforced with steel bars. These columns had varying longitudinal bar reinforcement ratios (1.64%, 3.29%, and 4.9%) while keeping other variables constant. Additionally, Group 1 included reference columns for comparison with columns reinforced by GFRP bars. Group 2 consisted of five models with varying GFRP longitudinal bar reinforcement ratios (1.46%, 2.9%, 3.29%, 4.9%, and 5.85%). Four longitudinally deformed GFRP bars of nominal diameter (12 mm) were used to reinforce the first column, which was then used as a reference. This resulted in a reinforcement ratio of 1.64%. Like the first column, four bars were used to reinforce the second, but their diameter was 16 mm this time, providing a reinforcement ratio equal to 2.9%. The third column had eight 12 mm-diameter reinforcement bars, which gave a reinforcement ratio equal to 3.29%. The fourth column was reinforced with 12 bars of 12 mm, providing a reinforcement ratio equal to 4.9%. Finally, the fifth column was reinforced with eight bars with 16 mm diameter, giving a reinforcement ratio of 5.85%. Group 3 explored the impact of changing the hole dimensions used in the section (hollow ratio) (0.07, 0.15, and 0.25). The first size was a 70 × 70 mm2 square, used in the reference column, representing a hollow ratio of 0.15. It was constant in the other columns when examining the different variables. The other two sizes were 50 × 50 mm2 and 90 × 90 mm2, indicating a hollow ratio of 0.07 and 0.25, respectively. Finally, Group 4 examined the consequence of altering tie spacing (85 mm, 120 mm, and 170 mm), in which 170 mm tie spacing was used in the reference model. All specimens’ transverse reinforcement was made using lateral steel ties 10 mm in diameter. Table 1 provides the specimens’ identification, reinforcement type, reinforcement ratio of the longitudinal bar, spacing between ties, and hollow ratio, which was employed thoroughly during this experimental study. The details of reinforcement for these columns are displayed in Figure 1.

2.2. Material Characteristics

2.2.1. Concrete

Normal-strength concrete (NSC) mix was used to cast each column specimen. The components of the concrete mix combination were river sand, 10 mm crushed gravel, plain Portland cement (Type-I), and pure tap water. The goal was to produce normal-weight concrete with a cylinder’s compressive strength after 28 days, varying from 22 to 28 MPa. Numerous test mixtures were made to obtain the right combination for this inquiry. The weights of the components needed for producing 1 m3 of concrete are mentioned in Table 2.

2.2.2. GFRP and Steel

The column specimens were longitudinally reinforced using 12 mm and 16 mm GFRP and steel deformed bars, along with 10 mm steel stirrups for lateral reinforcement. The tensile characteristics of the reinforcement, as provided by the manufacturer, are displayed in Table 3.

2.3. Test Specimen Preparation

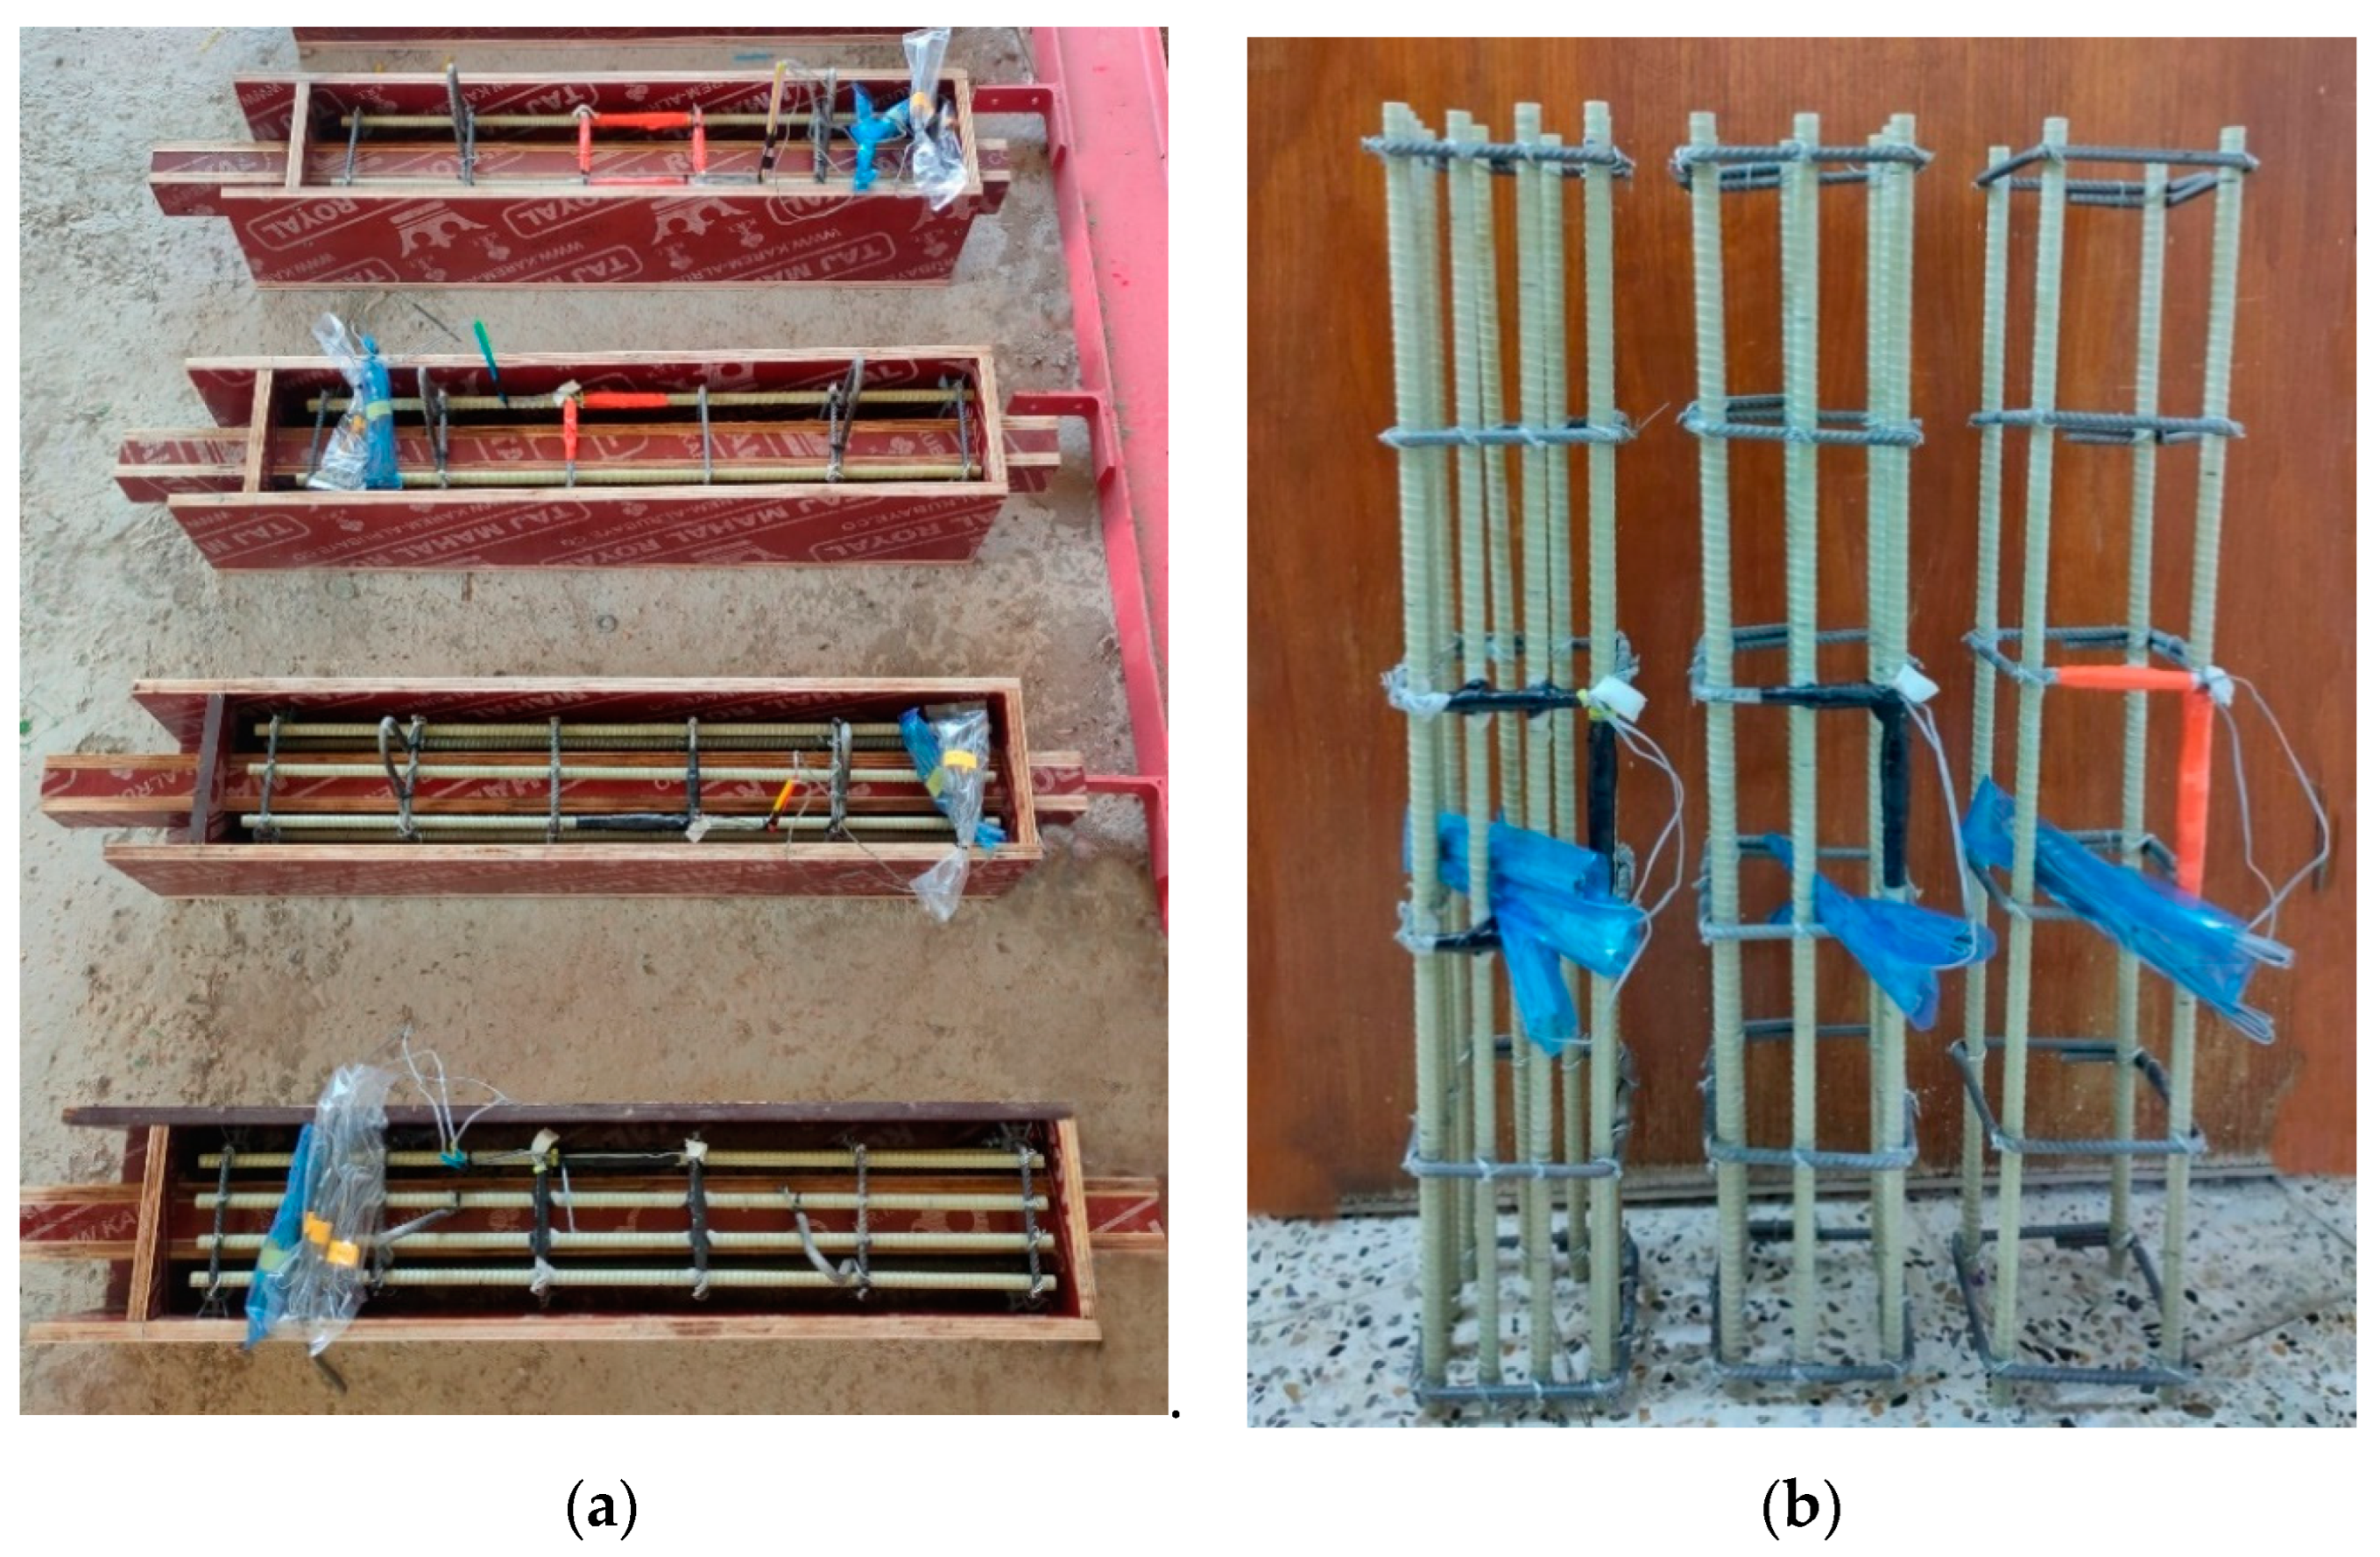
All the column specimens have been cast horizontally using 12 wooden molds. The molds were made of plywood panels with internal clear section dimensions of 180 × 180 mm2 and overall heights of 900 mm. Each mold had two square wood bases containing a square hole, through which a wooden mold passed to make a hollow section while casting concrete columns. The reinforcement was then carefully positioned inside the wooden molds, with the necessary bottom and side covers maintained precisely. The column samples were cast horizontally in this investigation, as shown in Figure 2. The new concrete had removed the entrapped air using a vibrating tool, and the fresh concrete was adequately compacted. Regarding the number of layers and tamping rods, standard processes were employed to comply with ordinary concrete in wooden molds. The upper surface of conventional concrete underwent a meticulous finishing process following casting. A hand trowel was used to achieve a smooth texture. Subsequently, the specimens were extracted within 24 h. All columns were immersed in a tap water basin for 28 days to facilitate proper curing. The strain gauge was a sensitive wire used to measure strain in reinforcement and concrete with different sizes. The strains used in the experimental work had lengths of (5 mm and 60 mm) for longitudinal bar and concrete, respectively. Concrete strain gauges were positioned at the center on opposing sides of column faces, and the average was taken to extract the strain value of the column. For longitudinal reinforcement, the strain was positioned at the bar’s midpoint.

2.4. Test Configuration and Equipment

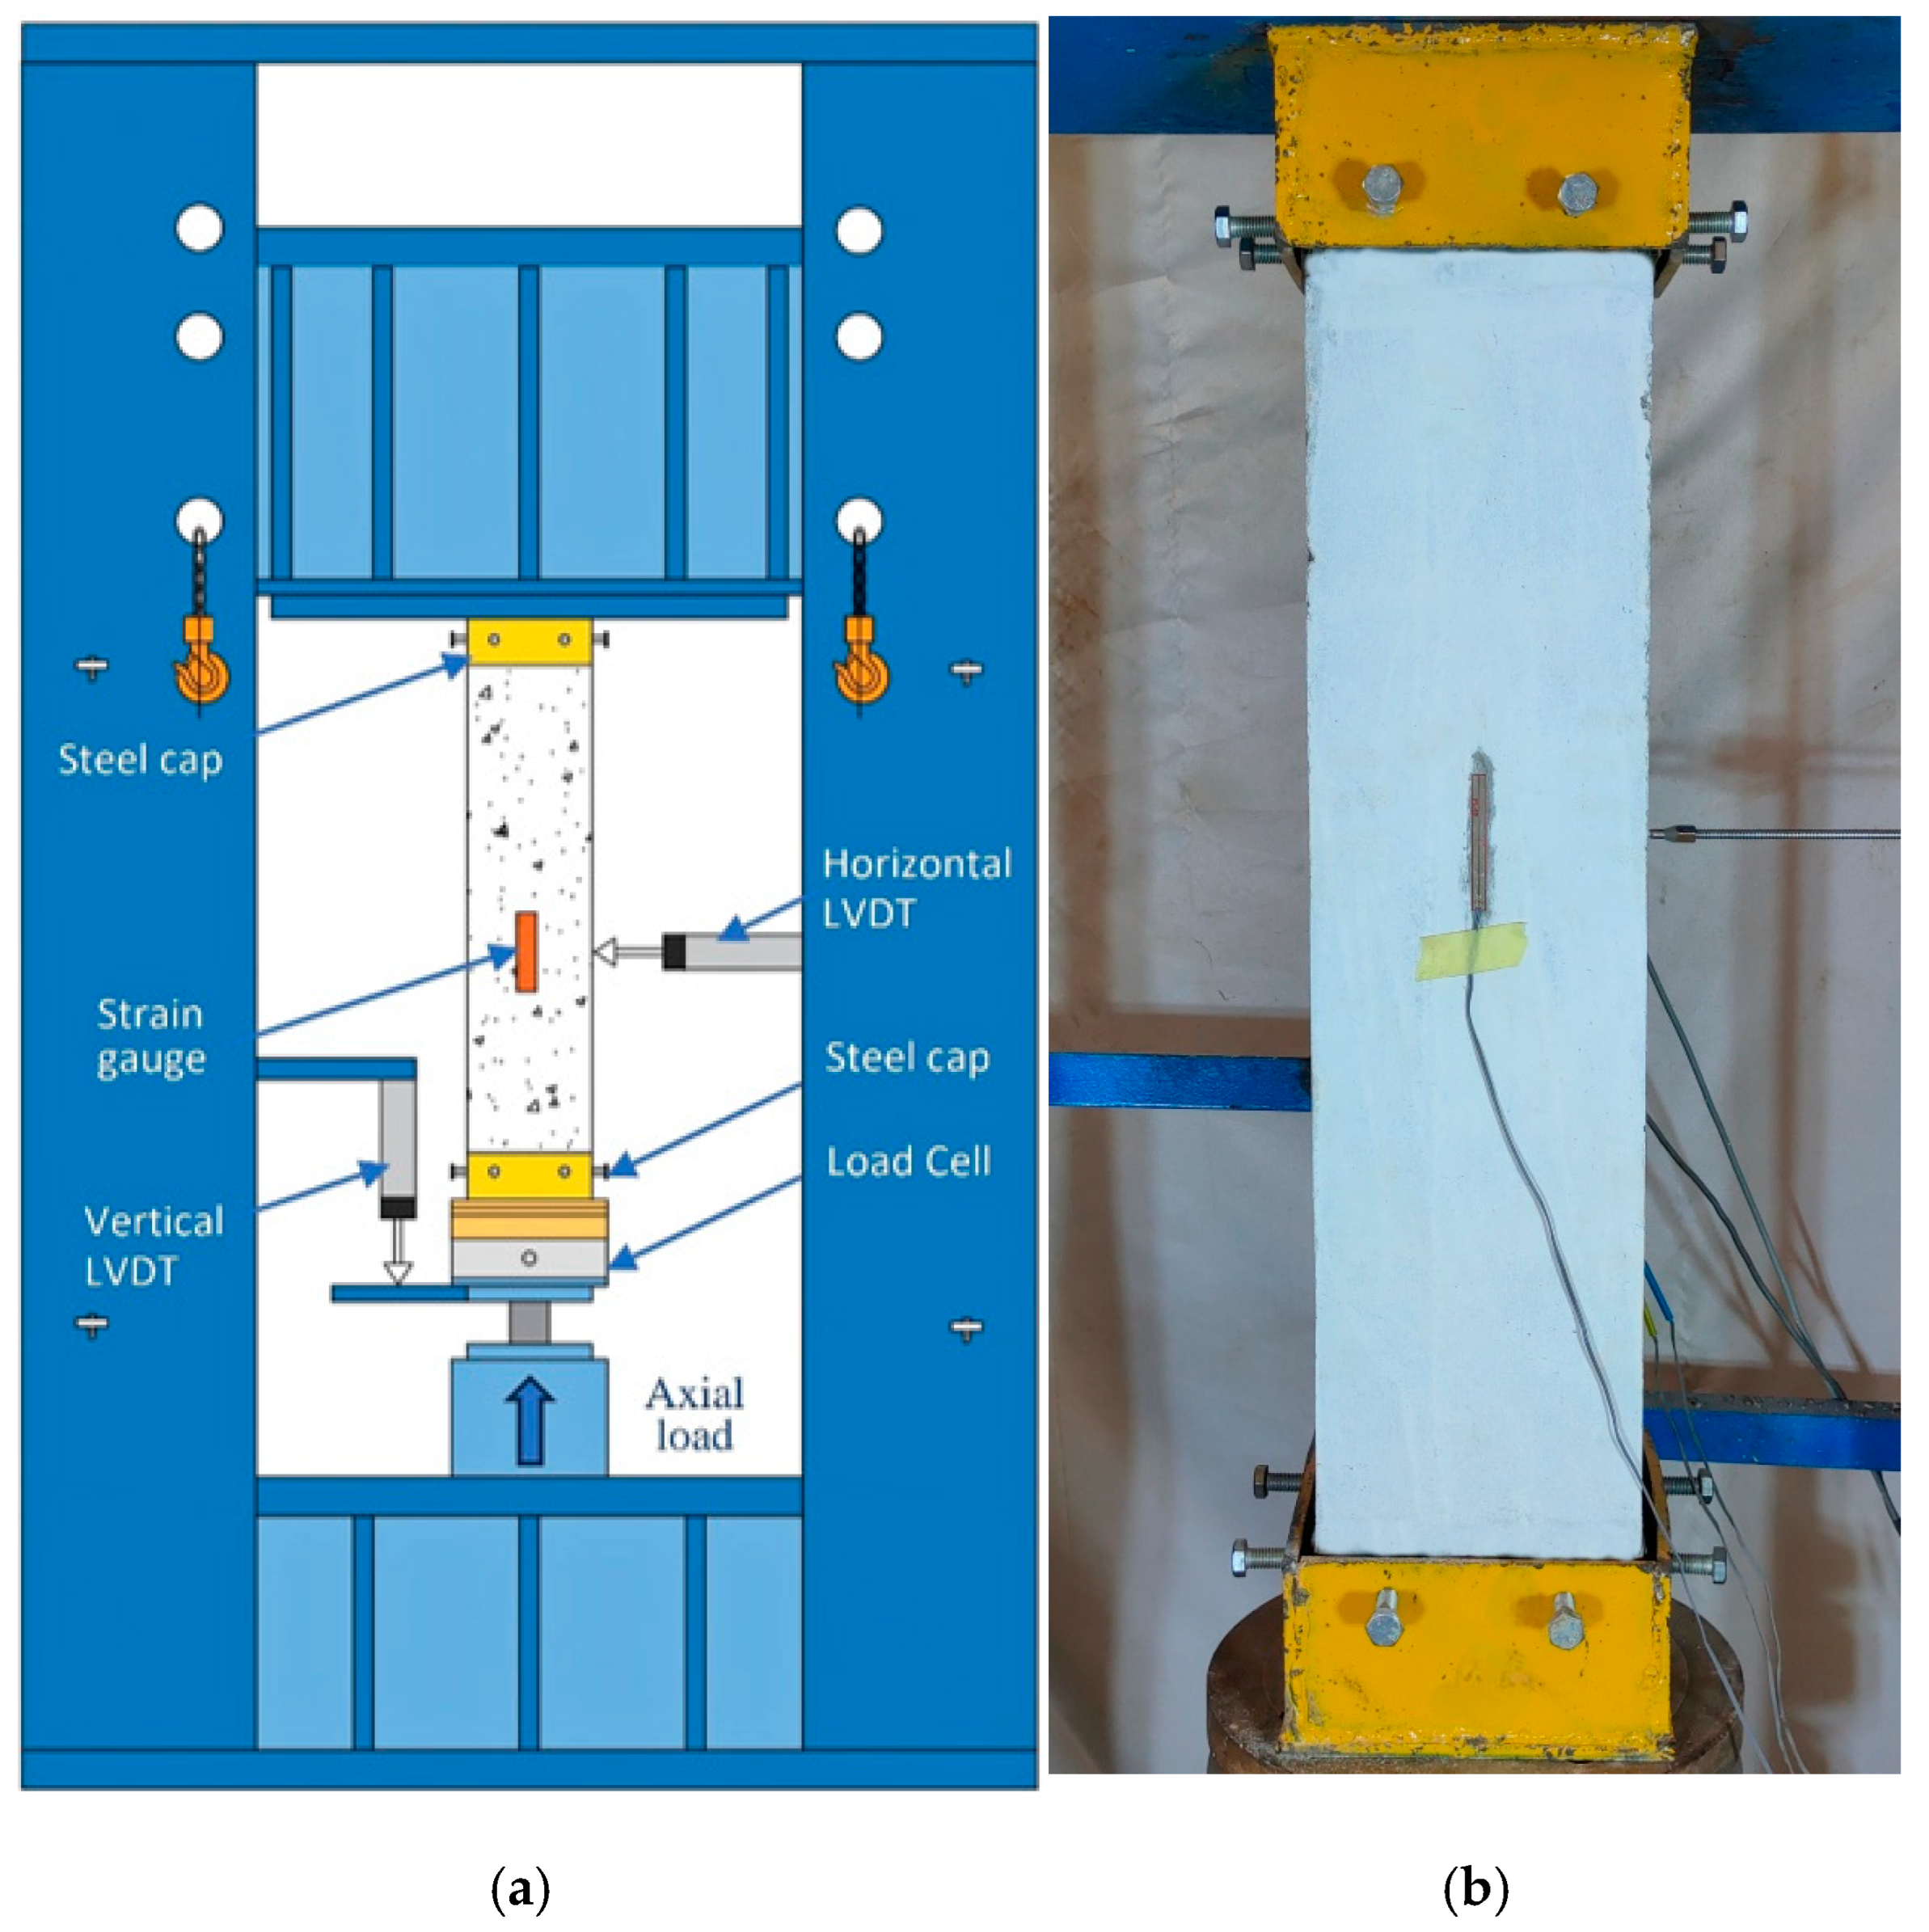
The columns were subjected to compressive loading until failure using a compression testing machine. Before testing, all faces of the columns were painted. Axial load data were collected using a calibrated load cell with a 2000 kN capacity positioned beneath the column. Vertical displacement was recorded using an LVDT installed at the base of the testing machine, which moved upward during the test. Two LVDTs positioned in the middle of the specimens were used to measure the horizontal displacement. During the tests, rigid steel caps were attached to both ends of each column. Strain measurements were taken using two linear strain gauges: one at the middle height of the concrete and the other on the longitudinal reinforcement bar. An automated data acquisition system recorded the compressive loads and deformations throughout the testing period. Figure 3 illustrates the experimental setup and instruments used in this study.

3. Experimental Outcomes

The experimental findings for every column specimen are shown, discussed, and compared with one another in this section. Concerning the ultimate load, axial and lateral displacement, equivalent strain in concrete, and longitudinal reinforcements, Table 4 illustrates the experimental outcomes of the tested specimens.

3.1. Steel Reinforcement Ratio

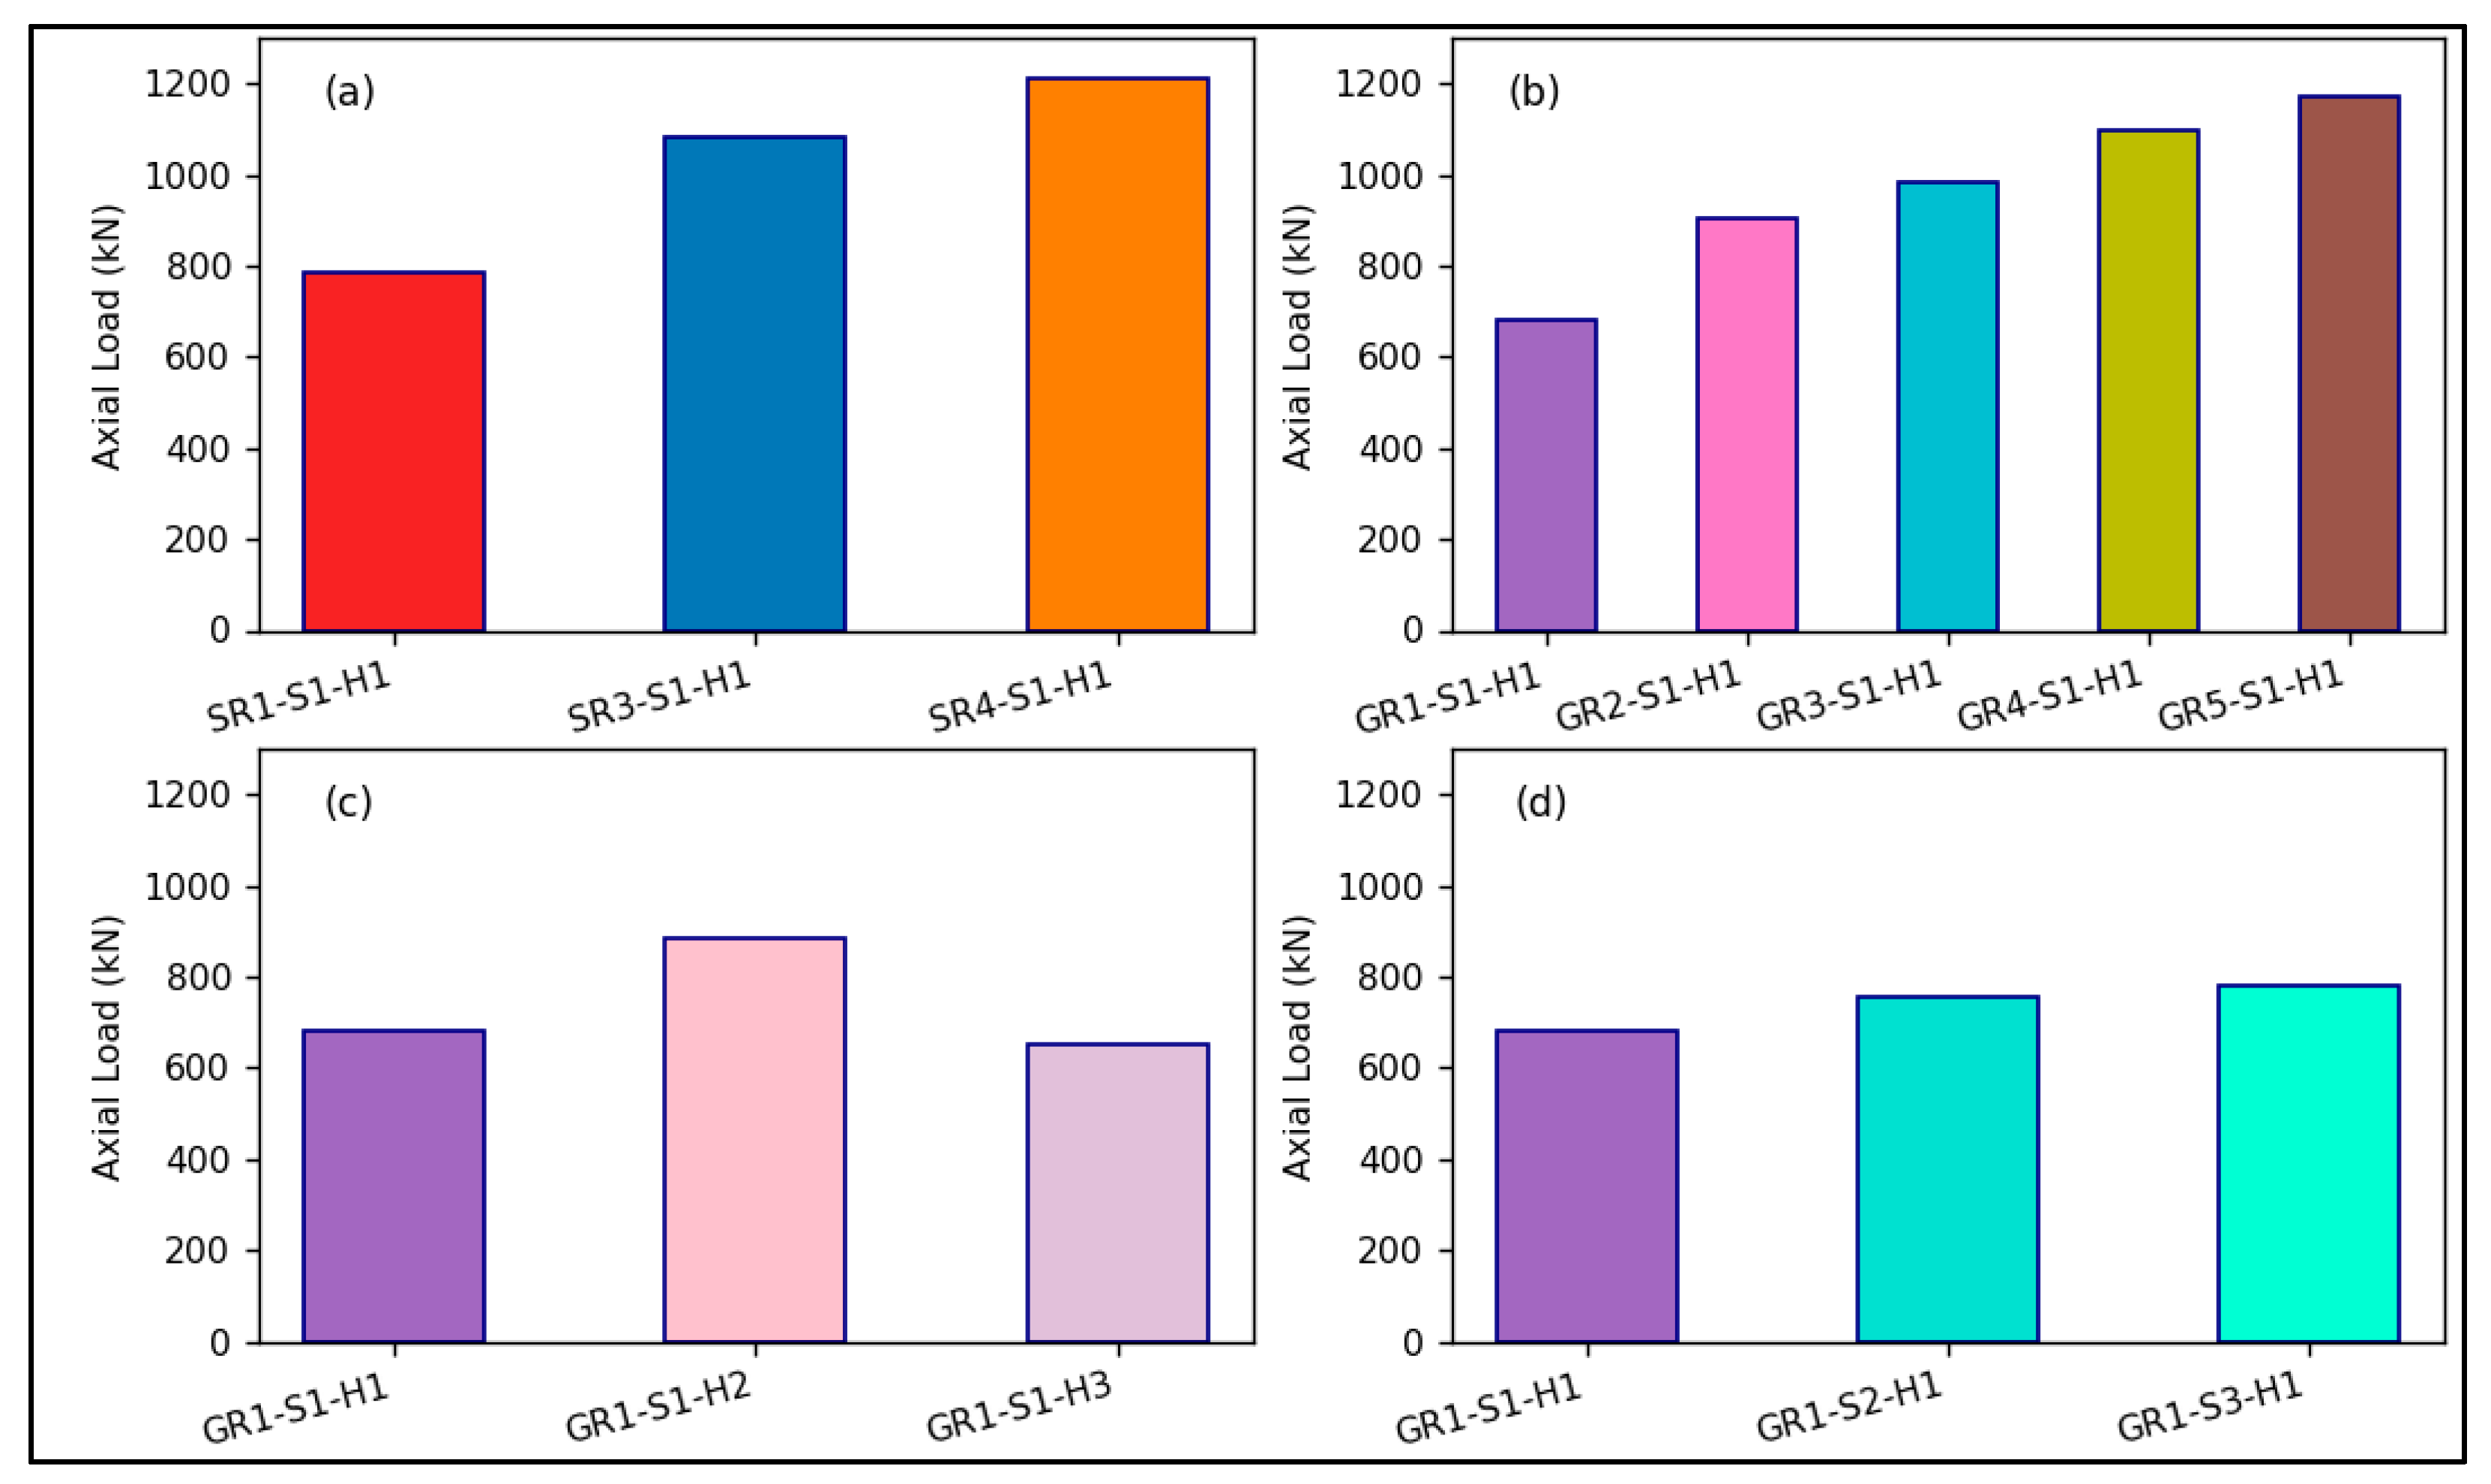
A detailed examination of the effect of longitudinal steel reinforcement on the reinforced hollow square concrete columns’ loads capacity is shown in Figure 4a. The study examined three specimens from Group 1, labeled SR1-S1-H1, SR3-S1-H1, and SR4-S1-H1, which had longitudinal steel reinforcement ratios of 1.47%, 3.29%, and 4.91%, respectively. The axial load capacity of specimen SR1-S1-H1 was recorded at 785.2 kN. As the reinforcement ratios increased in specimens SR3-S1-H1 and SR4-S1-H1, their axial load capacities rose to 1082.5 kN and 1210.3 kN, respectively. Comparing this to specimen SR1-S1-H1, the axial load capacity had increased by 37.8% and 54.1%, respectively. The observed improvement was attributed to the larger area of reinforcing steel, which effectively contributed to carrying the load.

3.2. GFRP Reinforcement Ratio

The reinforcement ratio notably affected the functionality of hollow concrete columns with GFRP reinforcement. This ratio increased the columns’ capacity to bear axial loads. A series of column specimens from Group 2 were analyzed to evaluate this effect, labeled as GR1-S1-H1, GR2-S1-H1, GR3-S1-H1, GR4-S1-H1, and GR5-S1-H1. These columns maintained a consistent concrete cross-sectional area but varied in reinforcement ratios of 1.46%, 2.9%, 3.29%, 4.9%, and 5.85%, respectively. The GR1-S1-H1 specimen demonstrated a load capacity of 682.6 kN. For the GR2-S1-H1, GR3-S1-H1, and GR4-S1-H1 specimens, the axial load capacity increased by 32.3%, 43.9%, and 60.5%, respectively. The GR5-S1-H1 specimen exhibited the highest axial load capacity of 1172.3 kN, reflecting a 71.7% increase compared to the GR1-S1-H1 specimen. Figure 4b illustrates the differences in load capacity among the Group 2 column specimens.

3.3. Hollow Ratio

Investigating the behavior of hollow columns with varying hollow ratios is essential for understanding their load-carrying capacity. In this study, Group 3 specimens were utilized to explore the impact of the hollow ratio on axial load capacity. The first specimen, GR1-S1-H1, with a hollow ratio of 0.15, showed a capability for axial loads equal to 682.6 kN. Interestingly, when the hollow ratio decreased to 0.07 for the specimen GR1-S1-H2, the axial load capacity increased by 29.2%. Conversely, increasing the hollow ratio to 0.25 for the specimen GR1-S1-H3 resulted in only a 4.5% reduction in axial load capacity, as depicted in Figure 4c. This behavior was related to the decrease in the concrete core, which altered the internal stress distribution. Consequently, the reduced cross-section expansion laterally enhanced axial stability, allowing for greater load-carrying capacity.

3.4. Spacing between Ties

Experiments were conducted on three-column specimens investigating the impact of varying tie spacing. These specimens featured different tie spacings, 85 mm, 120 mm, and 170 mm, as illustrated in Figure 4d. The initial specimen, denoted as GR1-S1-H1, had a tie spacing of 170 mm and showed a capability for axial loads equal to 682.6 kN. When the ties were spaced 120 mm apart instead of 170 mm (for specimen GR1-S2-H1), the axial load capacity increased to 756.3 kN, representing a 10.8% improvement. Further reducing the tie spacing to 85 mm (for specimen GR1-S3-H1) resulted in an axial load capacity of 778.4 kN, corresponding to a 14% increase. This enhancement in axial load capability for the hollow concrete column can be linked to the effective confinement induced by closely spaced ties. Specifically, the reduced longitudinal bar’s unbraced length bars and the limited extent of unconfined concrete between ties led to a more gradual failure behavior by extending the rupture of the GFRP bars.

3.5. Longitudinal Reinforcement Type

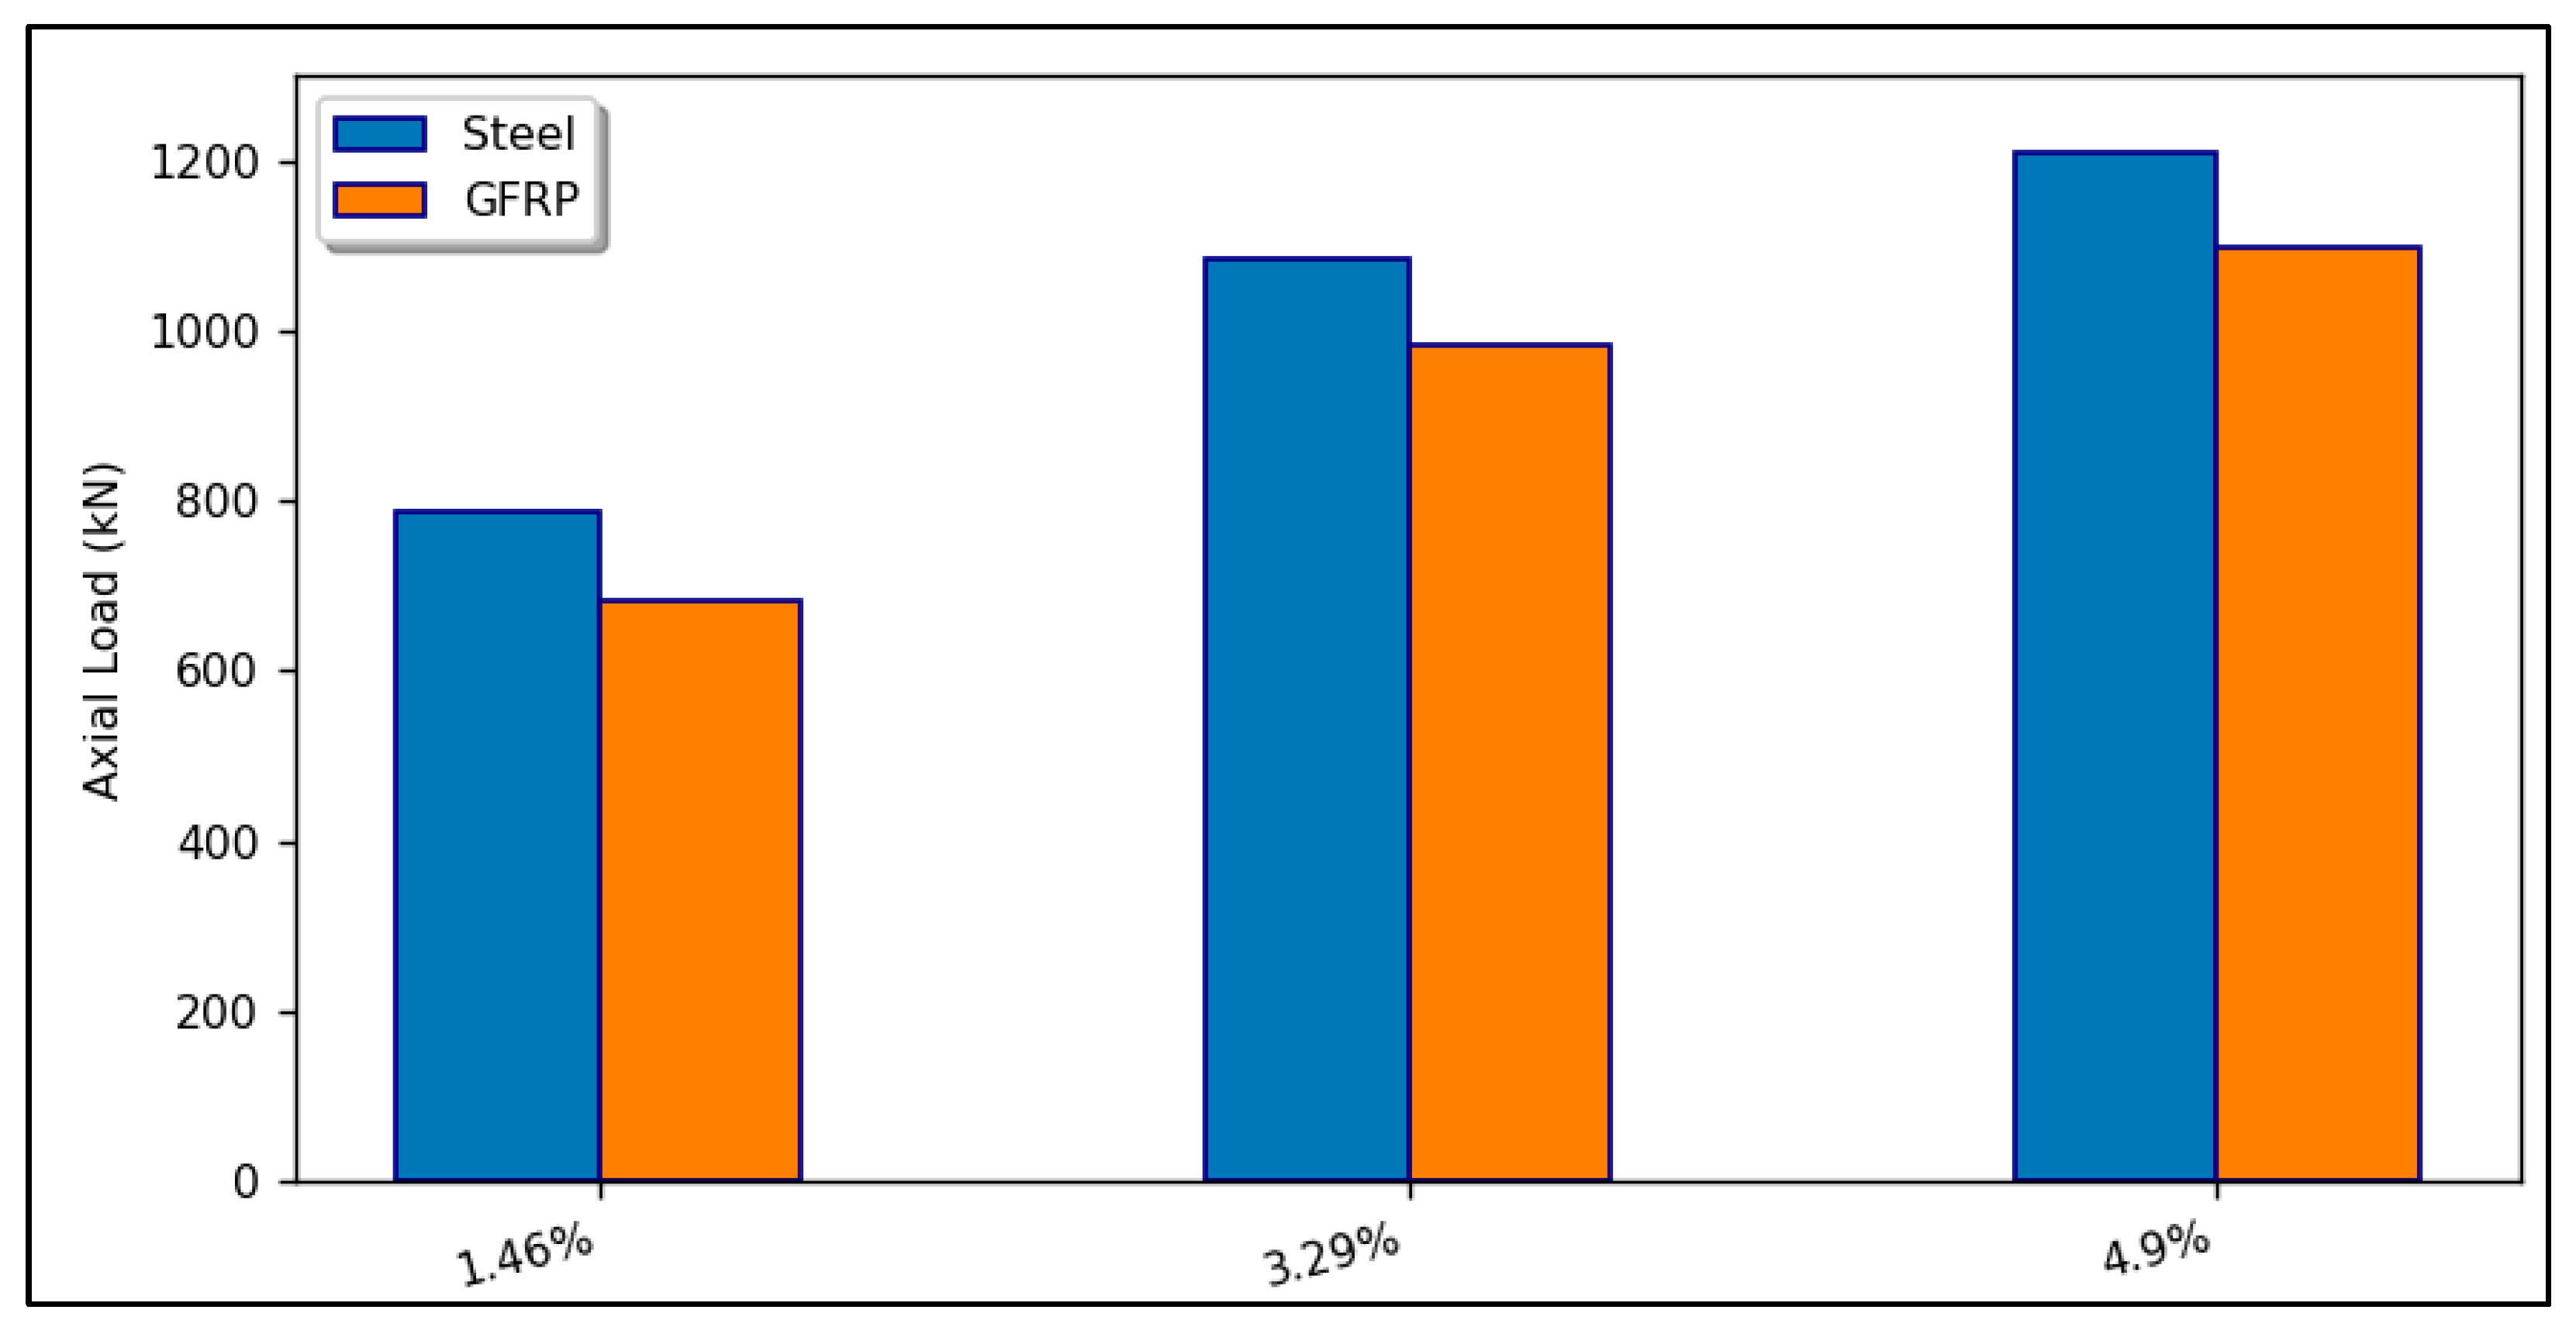
The mechanical properties of GFRP and steel reinforcement display notable differences. Steel bars are characterized by their higher stiffness and exhibit elastic-plastic response up to the point of yielding. Conversely, GFRP bars exhibit a linear elastic response up to failure. A comparative analysis was conducted to look into the performance differences between GFRP and steel-reinforced columns. This analysis involved two sets of specimens: Group 1, which used steel reinforcement, and Group 2, which employed GFRP bars. Despite having comparable reinforcement ratios (1.46%, 3.29%, and 4.9%), the GFRP specimens (labeled as GR1-S1-H1, GR3-S1-H1, and GR4-S1-H1) demonstrated a reduction in load capacity by 13.1%, 9.2%, and 9.4%, respectively, as illustrated in Figure 5. The decreased carrying loads capability was correlated to the GFRP bars’ lower modulus of elasticity in contrast to the steel reinforcement.

3.6. Failure Modes

The experimental investigation on all hollow columns was conducted until they reached structural failure. The observed failure patterns differed according to the reinforcing materials type and the columns’ cross-sectional design. Failure in columns with longitudinal GFRP bar reinforcement started when the bars buckled or crushed. Due to the longitudinal bars’ successive ruptures, this failure mechanism was notably explosive and resulted in the total loss of load-bearing capability. On the other hand, columns that were reinforced with steel bars usually collapsed because of excessive bar buckling rather than tie rupture. The substitution of steel with GFRP for longitudinal reinforcement significantly altered the failure mode.
In hollow column specimens reinforced longitudinally with steel bars, surface cracks emerged at around 65% of their ultimate load capacity. As the axial load continued to rise, these cracks propagated across various areas of the specimen’s surface, eventually producing spalling and cracks in the concrete cover. The failure location varied among different specimens. For example, in specimen SR1-S1-H1, failure occurred at the top section of the column, whereas in specimens SR3-S1-H1 and SR4-S1-H1, it was near the middle height. Notably, the failure’s distance decreased when the reinforcement steel ratio increased. The primary cause of failure was the excessive buckling of bars within the columns, which significantly reduced load capacity due to minor crushing of the concrete core. It is worth noting that none of the column specimens failed as a result of transverse reinforcement rupturing.
During the testing phase, vertical cracks began to form in the GFRP specimens when they reached approximately 90% of their maximum load capacity. At the same time, the concrete cover remained intact up to this point. As the load neared its peak, these vertical cracks expanded, resulting in rapid and severe failure, including GFRP bars buckling. Notably, no transverse reinforcement rupture was observed. Ultimately, the concrete core cracked. The extent and mechanism of rupture in the GFRP longitudinal reinforcement varied among the studied columns. In Group 2 specimens, the reinforcement ratio influenced the damage to the inner core of the concrete column. For instance, specimen GR1-S1-H1 exhibited crack propagation and concrete cover spalling at the upper middle height due to the rupture of all four GFRP longitudinal bars (each with a diameter of 12 mm). In contrast, GR2-S1-H1 displayed similar failure behavior but with only partial rupture of the GFRP bars (reinforced with 16 mm diameter bars), resulting in minor damage to the concrete core. Specimen GR3-S1-H1 also experienced spalling of the upper mid-height concrete cover, with significant damage resulting from the failure of all GFRP bars. Significant damage to the concrete core was caused in GR4-S1-H1 by buckling and partial splitting of the GFRP fibers within the longitudinal bars. Finally, GR5-S1-H1 failed at the lower half of its height, with pronounced damage to the concrete core and rupturing and buckling of the GFRP bars. Importantly, no damage was observed in the transverse steel ties of any hollow column specimens.
Regarding the tested concrete columns within Group 3 following failure, a comparison was made with the reference specimen GR1-S1-H1. Notably, specimens GR1-S1-H2 and GR1-S1-H3 exhibited cover spalling at middle height, leading to failure in light of the rupture of all GFRP bars and significant damage to the concrete core. Concrete crushing was discovered at the inner concrete wall, with variations noticed among the tested columns. Specifically, GR1-S1-H3, which had a hollow ratio 0.25, displayed complete damage in the concrete core. Conversely, GR1-S1-H2, characterized by a smaller hollow ratio of 0.07, exhibited inner concrete wall crushing.
For specimens of Group 4 specimens, alterations in tie spacing lead to distinct failure modes. Specifically, specimen GR1-S2-H1 exhibited behavior similar to that of GR1-S1-H1, albeit with minor damage to the concrete core and no inner concrete wall crushing. In contrast, specimen GR1-S3-H1 displayed varying failure mechanisms and longitudinal GFRP reinforcement rupture due to the reduced tie spacing. Notably, GR1-S3-H1 had the smallest damaged area among all GFRP columns, which could be associated with improved concrete core confinement. The failure form of GFRP-reinforced hollow concrete columns and detailed reinforcement bars is depicted in Figure 6 and Figure 7.

3.7. Load–Strain Relationship

As outlined in prior methodologies, strain gauges were employed to determine the strain values in both the longitudinal reinforcement and the concrete. With the progressive application of load, a modest increase in strain was observed within the elastic range, along with the emergence of minor cracks. This behavior persisted until the column attained its peak load capacity.
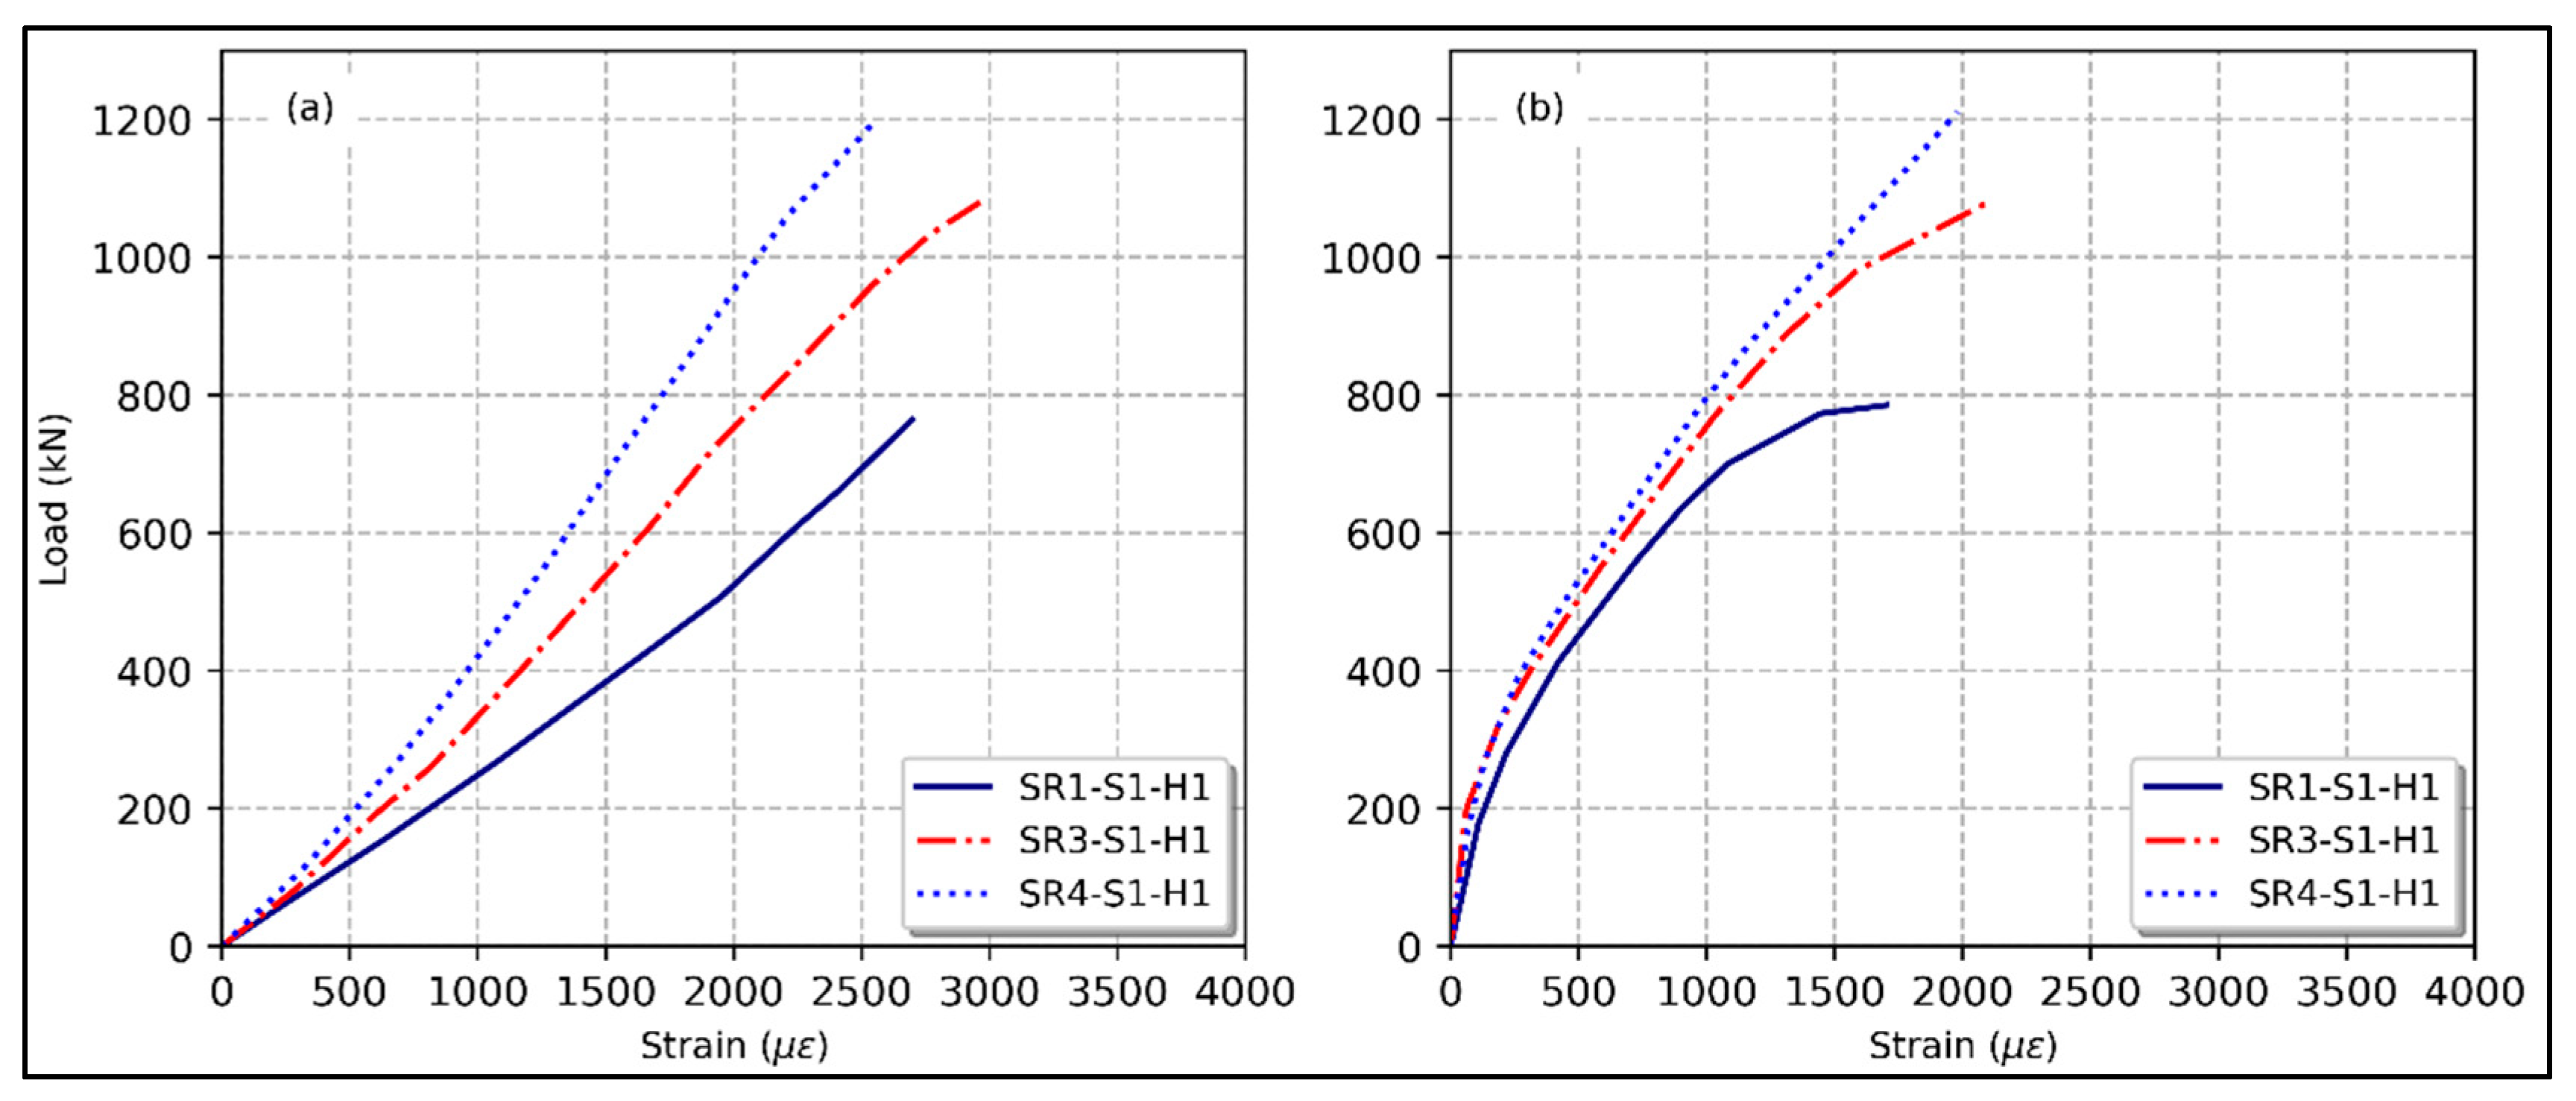
In Group 1 specimens, the specimens SR1-S1-H1, SR3-S1-H1, and SR4-S1-H1 were reinforced with steel. The steel bar strain values resulting in the experimental data were 2696, 2970, and 2553, respectively. According to these figures, the longitudinal steel reinforcement possibly buckled. The concrete strain values were observed to range between 1701 με and 2107 με. It should be noted that the specimen SR3-S1-H1, with its longitudinal reinforcement ratio of 3.29%, showed the most significant strain values for the concrete and the longitudinal steel bars. Figure 8a,b illustrates the load–strain curves for the specimens in this group.
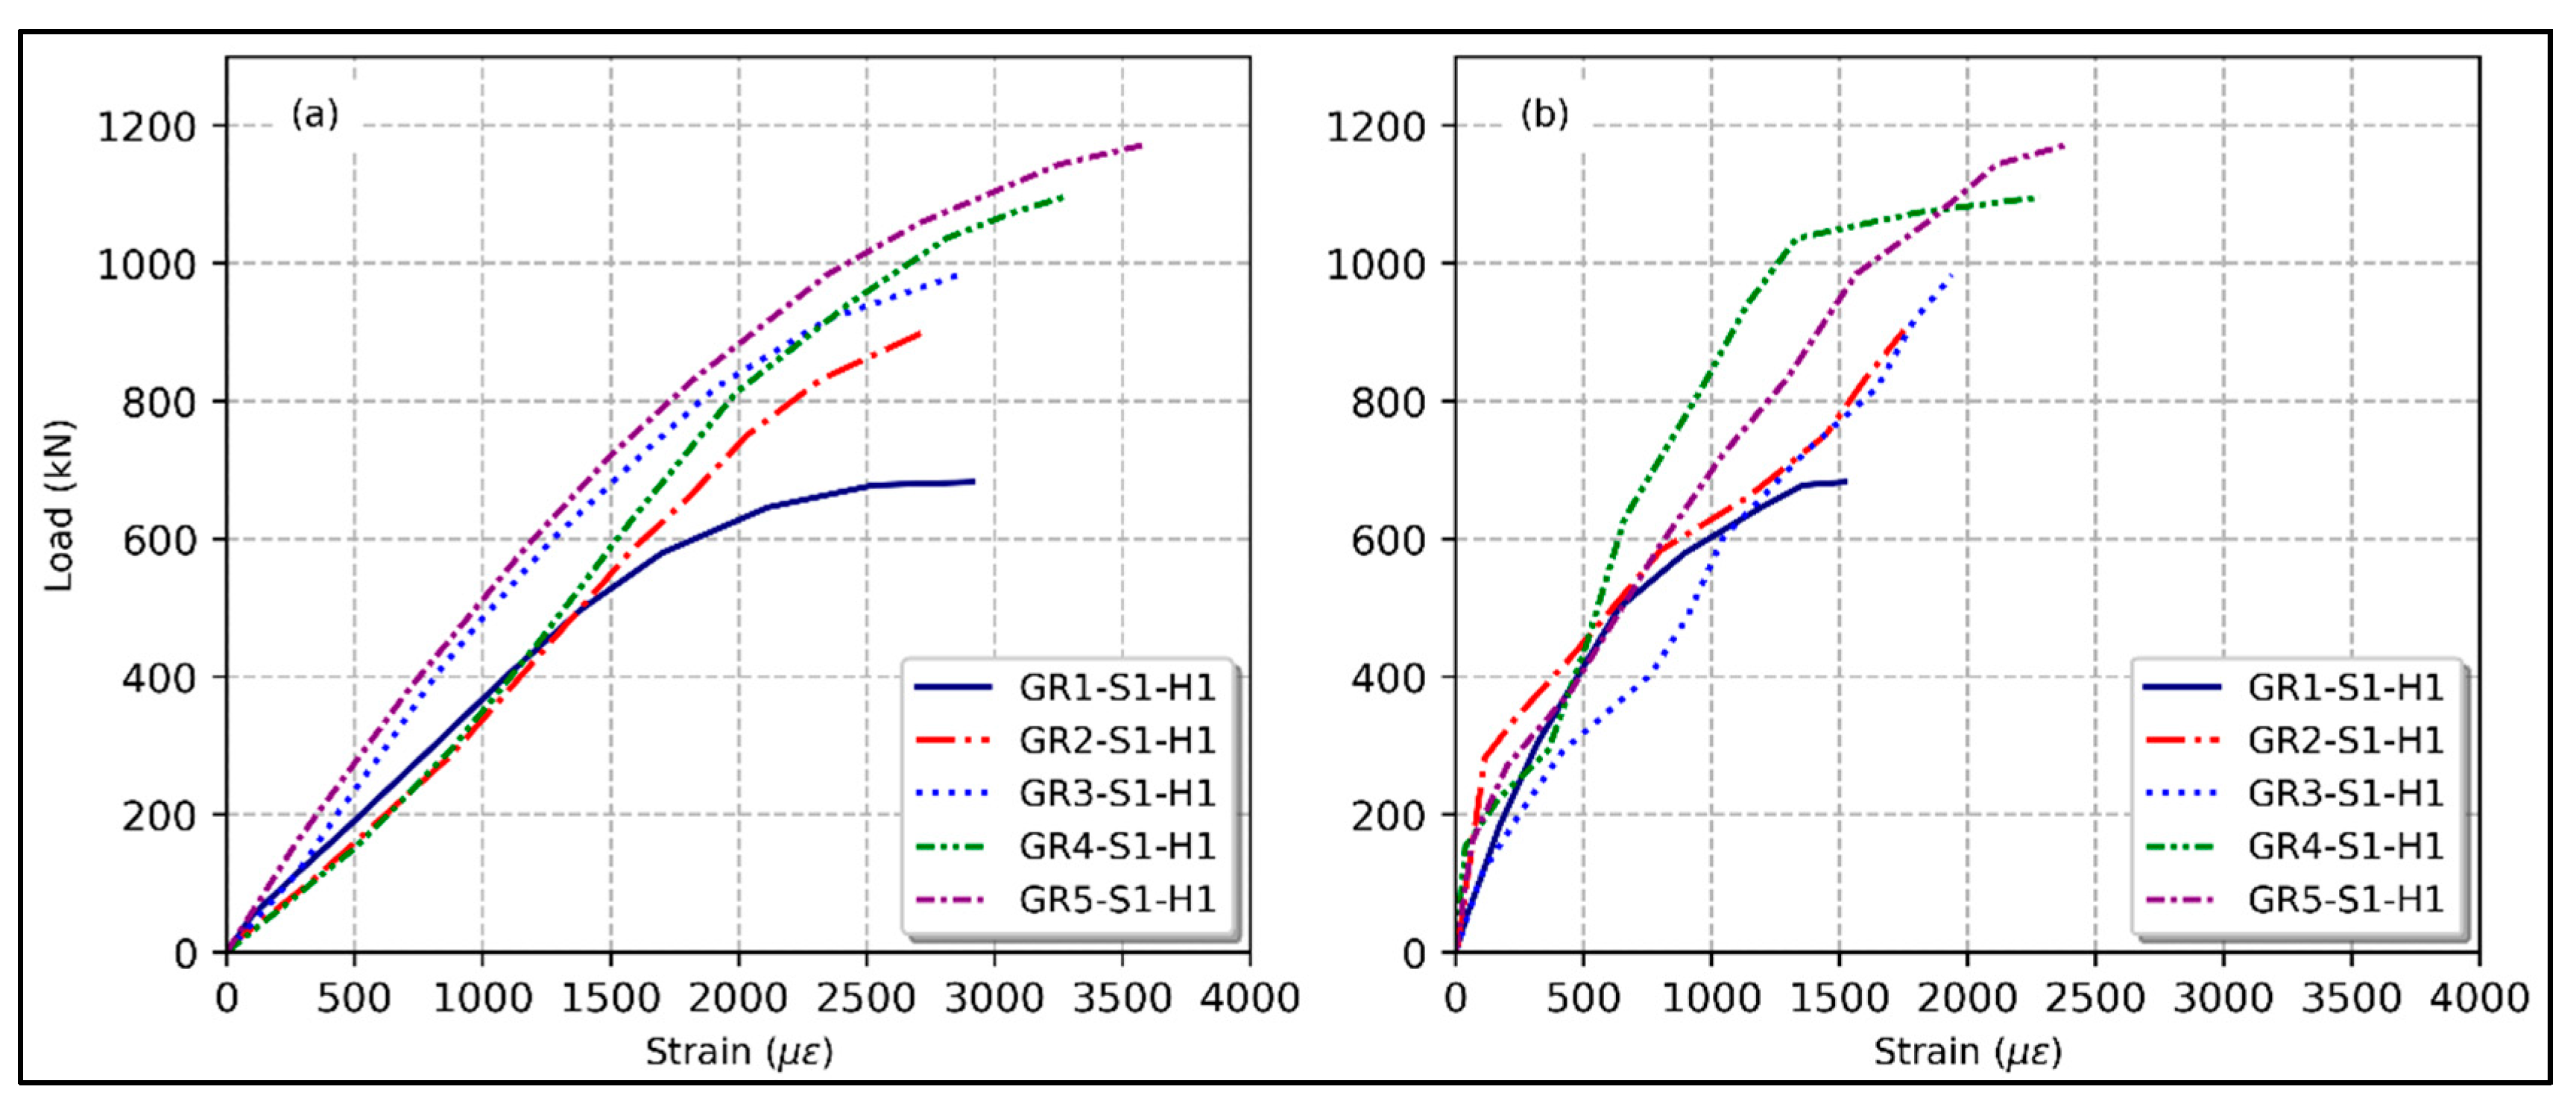
For the Group 2 specimens, the longitudinal GFRP bars showed an axial compression strain of around 3000 με, equivalent to 17.6% of the GFRP bars’ ultimate tensile strain. The calculated strains in columns GR1-S1-H1, GR2-S1-H1, and GR3-S1-H1 were 2913 με, 2739 με, and 2854 με, respectively. In contrast, columns GR4-S1-H1 and GR5-S1-H1 exhibited strains of 3269 με and 3586 με, respectively. Additionally, the vertical strain in the concrete ranged from 1519 με to 2388 με, corresponding to the point at which hairline cracks were initiated. However, once these cracks developed, the vertical strain values became unpredictable. Interestingly, the observed phenomenon increased axial strains within the longitudinal GFRP bars, as illustrated in Figure 9a,b. Notably, columns with higher reinforcement ratios demonstrated the most significant strain values in the longitudinal GFRP bars and the surrounding concrete.
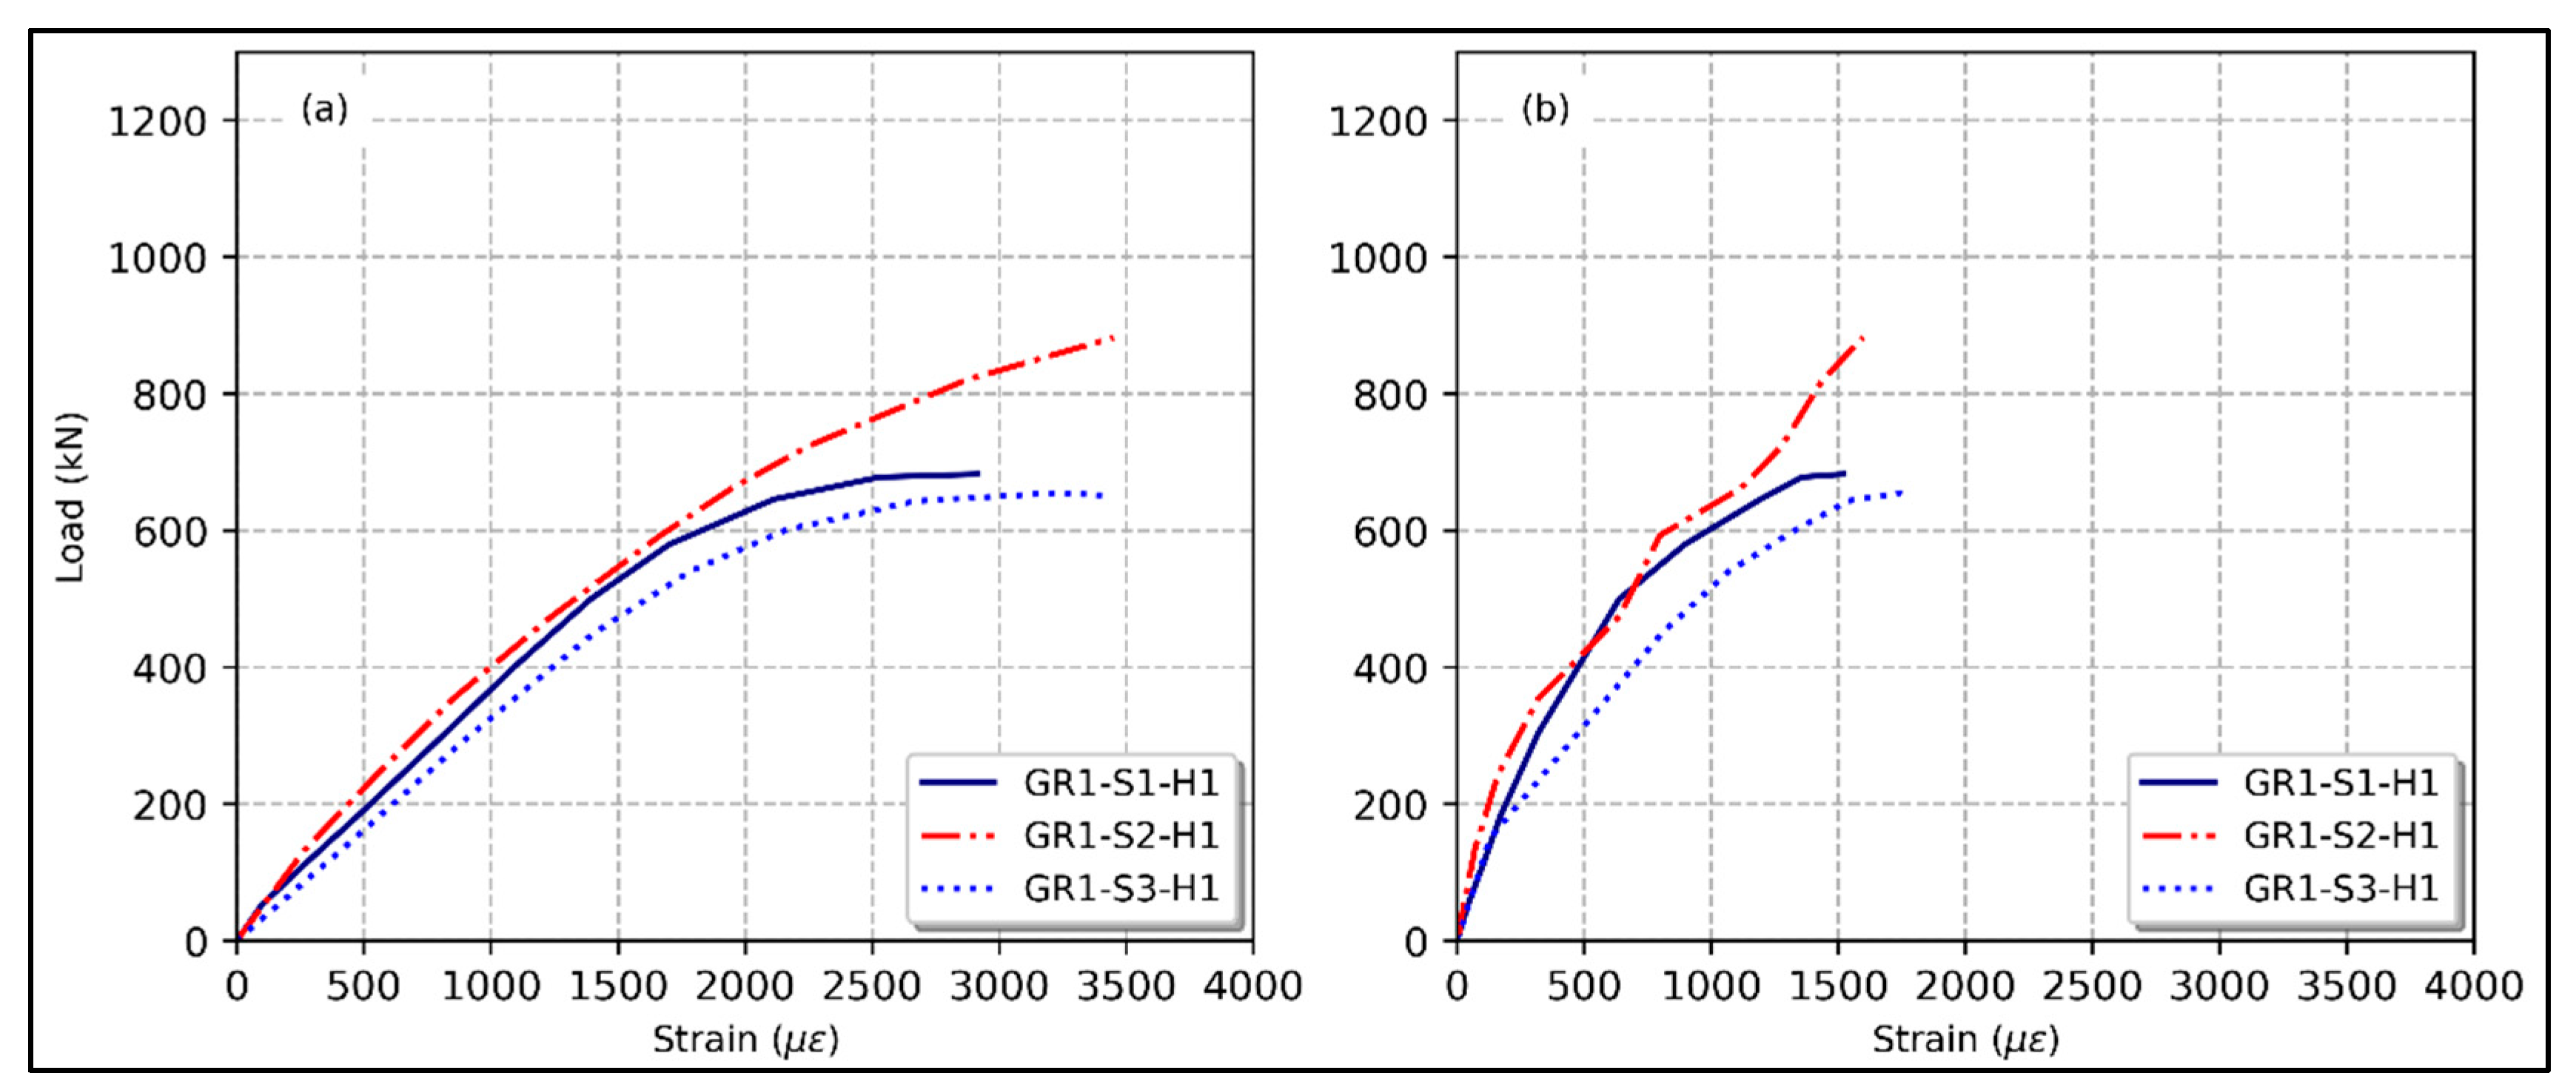
The specimens of Group 3, GR1-S1-H2, and GR1-S1-H3, showed longitudinal GFRP strain values of 3450 με and 3424 με, respectively, which was about the same value, but when compared to the vertical concrete strain (1597 με and 1763 με), there was a difference in the values as a result of the difference in the wall thickness, leading to the hairline cracks developing faster in the specimen with a higher hollow ratio, as shown in Figure 10a,b.
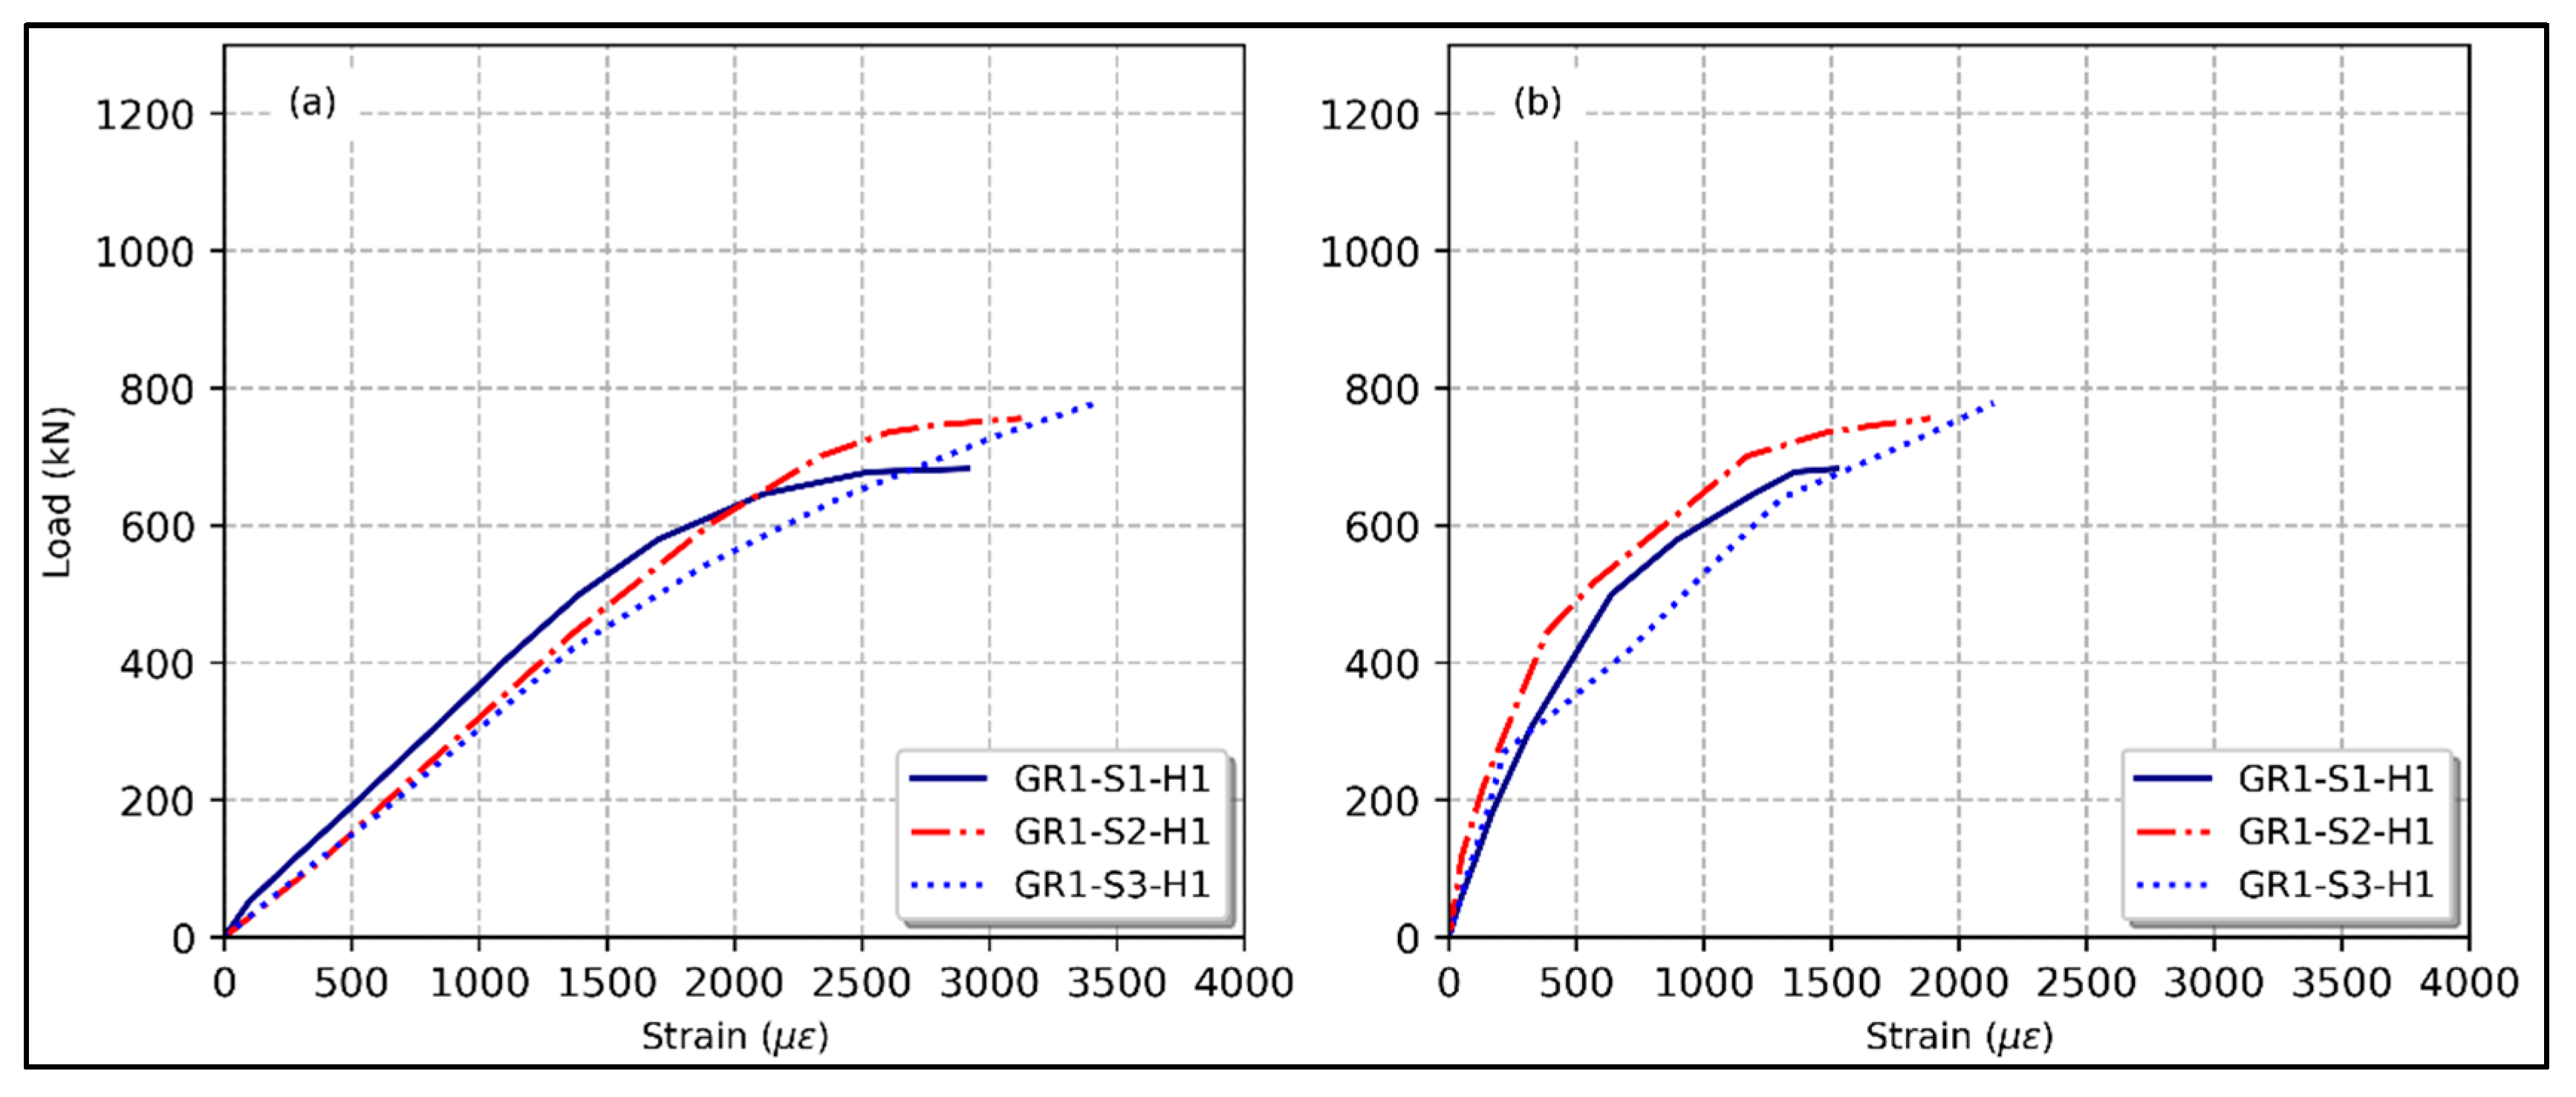
Lastly, for the specimens of Group 4, GR1-S2-H1 and GR1-S3-H1, the strain values for longitudinal GFRP bars were 2175 με and 3417 με, respectively, and the vertical concrete strain values were 1886 με and 2134 με, respectively, as shown in Figure 11a,b. Because of the delay in cracking development and increased concrete core stability, the measured axial concrete and GFRP bar strain increased as the tie spacing decreased.

3.8. Load–Displacement Relation

The load–displacement curve initially demonstrated a linear-elastic ascending phase for the steel-reinforced column. During this phase, the entire concrete and the reinforcement sectional area collectively resisted the applied stress and deform uniformly. However, when the load reached approximately 65% of the ultimate capacity, the response shifted to a nonlinear ascending phase. This shift was primarily a result of the development of tiny fissures in the exterior concrete cover. As the load increased, the concrete and the longitudinal reinforcements sustained the load until a part of the external concrete cover spalling occurred. This spalling led to a reduction in strength because of the cracking of the cover. At this stage, the effective area of the concrete decreased, reducing its contribution to load bearing. The columns failed because of the longitudinal steel bars’ buckling.
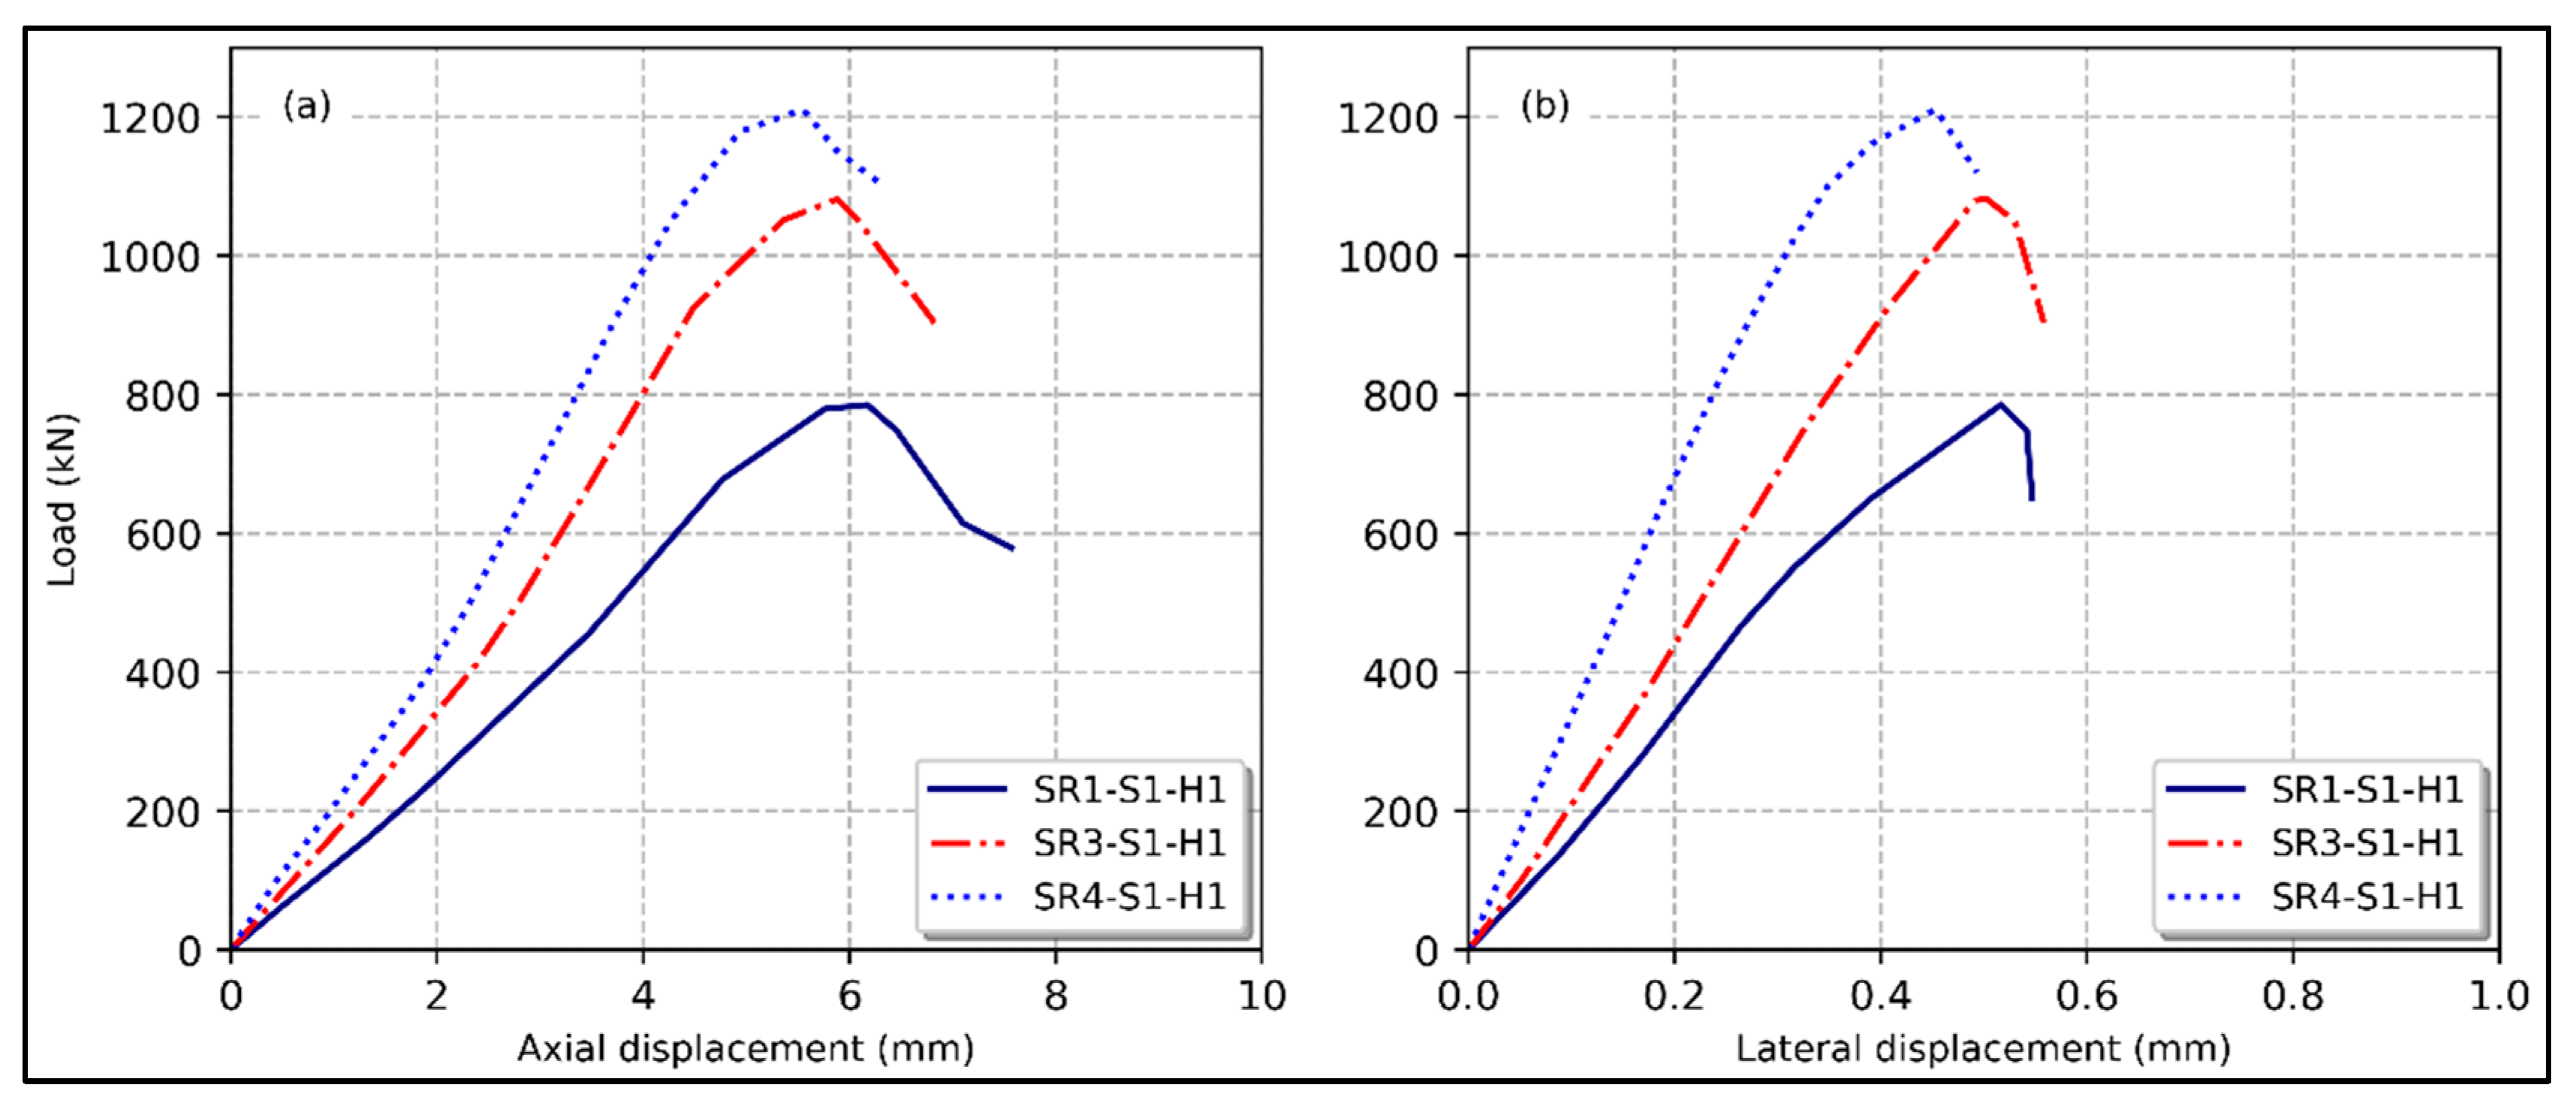
In Group 1, the SR1-S1-H1 column demonstrated an axial load capacity of 785.3 kN and an axial deformation of 6.18 mm. SR3-S1-H1 and SR4-S1-H1 exhibited axial load capabilities of 1082.5 kN and 1210.3 kN, respectively. It was observed that an increase in the longitudinal reinforcement ratio resulted in a decrease in axial displacement, with the SR3-S1-H1 column showing an axial displacement of 5.87 mm and the SR4-S1-H1 column showing 5.47 mm. The three specimens showed similar results regarding lateral displacement, ranging from 0.45 mm to 0.51 mm. This similarity can be attributed to the fact that all the tested columns were short with a low slenderness ratio (kl/r). Furthermore, all column specimens were subjected to concentric loading. The load–displacement response of Group 1 columns is illustrated in Figure 12a,b.
Investigations were also conducted on GFRP-reinforced columns. These columns exhibited distinct load–displacement behavior compared to specimens reinforced with steel. The columns maintained stability during loading, and the concrete surface remained crack-free within the linear-elastic range. However, nonlinear behavior emerged about 90% of the maximum applied load as a result of hairline fractures spreading immediately before reaching the ultimate load. Subsequently, the removal of the concrete cover, either completely or partially, resulted in a significant load drop caused by the explosive failure of the concrete core. At this critical stage, the longitudinal GFRP reinforcement experienced rupture, leading to the ultimate failure of the column. The test outcomes revealed varying concentric-load behavior influenced by factors such as longitudinal GFRP-bar details, lateral reinforcement spacing, and the hollow ratio.
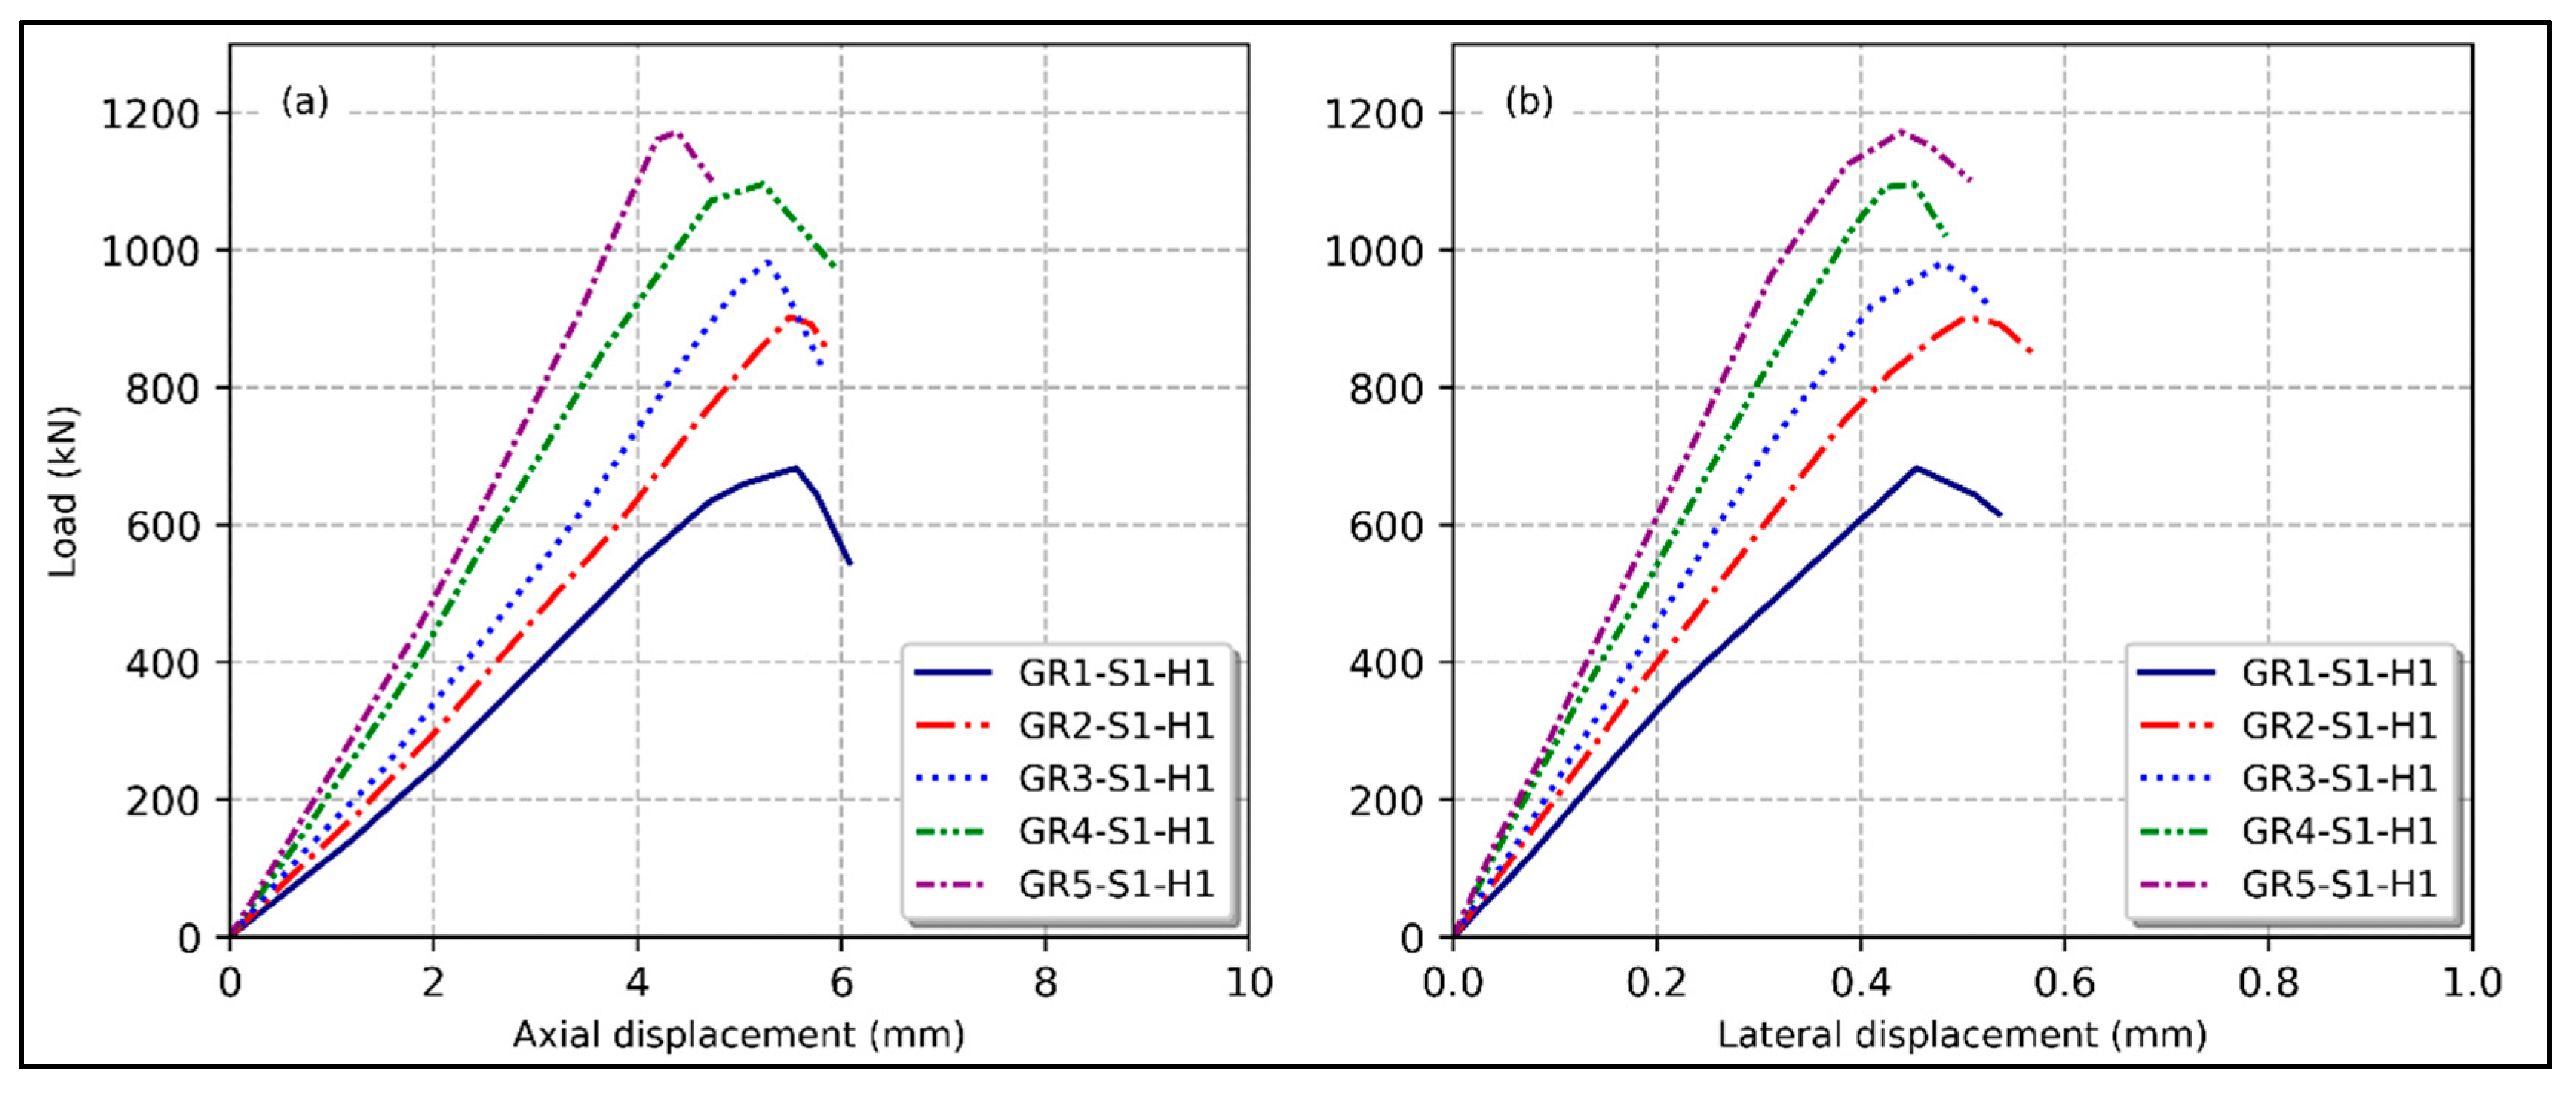
For the column specimens in Group 2, the initial behavior of GR1-S1-H1 showed a linear increase in load. This linear trend was disrupted by a nonlinear rise due to crack propagation, reaching a load capacity of 682 kN at a 5.54 mm axial displacement. Similar patterns were observed in columns GR2-S1-H1, GR3-S1-H1, GR4-S1-H1, and GR5-S1-H1 but with higher load capacities of 903 kN, 982 kN, 1096 kN, and 1172 kN, respectively. The axial displacement has been observed to decrease with an increase in the longitudinal reinforcement ratio. Specifically, the axial displacements for specimens GR2-S1-H1, GR3-S1-H1, GR4-S1-H1, and GR5-S1-H1 were 5.39 mm, 5.28 mm, 6.45 mm, 5.23 mm, and 4.39 mm, respectively, at the point of ultimate load. Figure 13a,b depicts the load–displacement response for Group 2 columns.
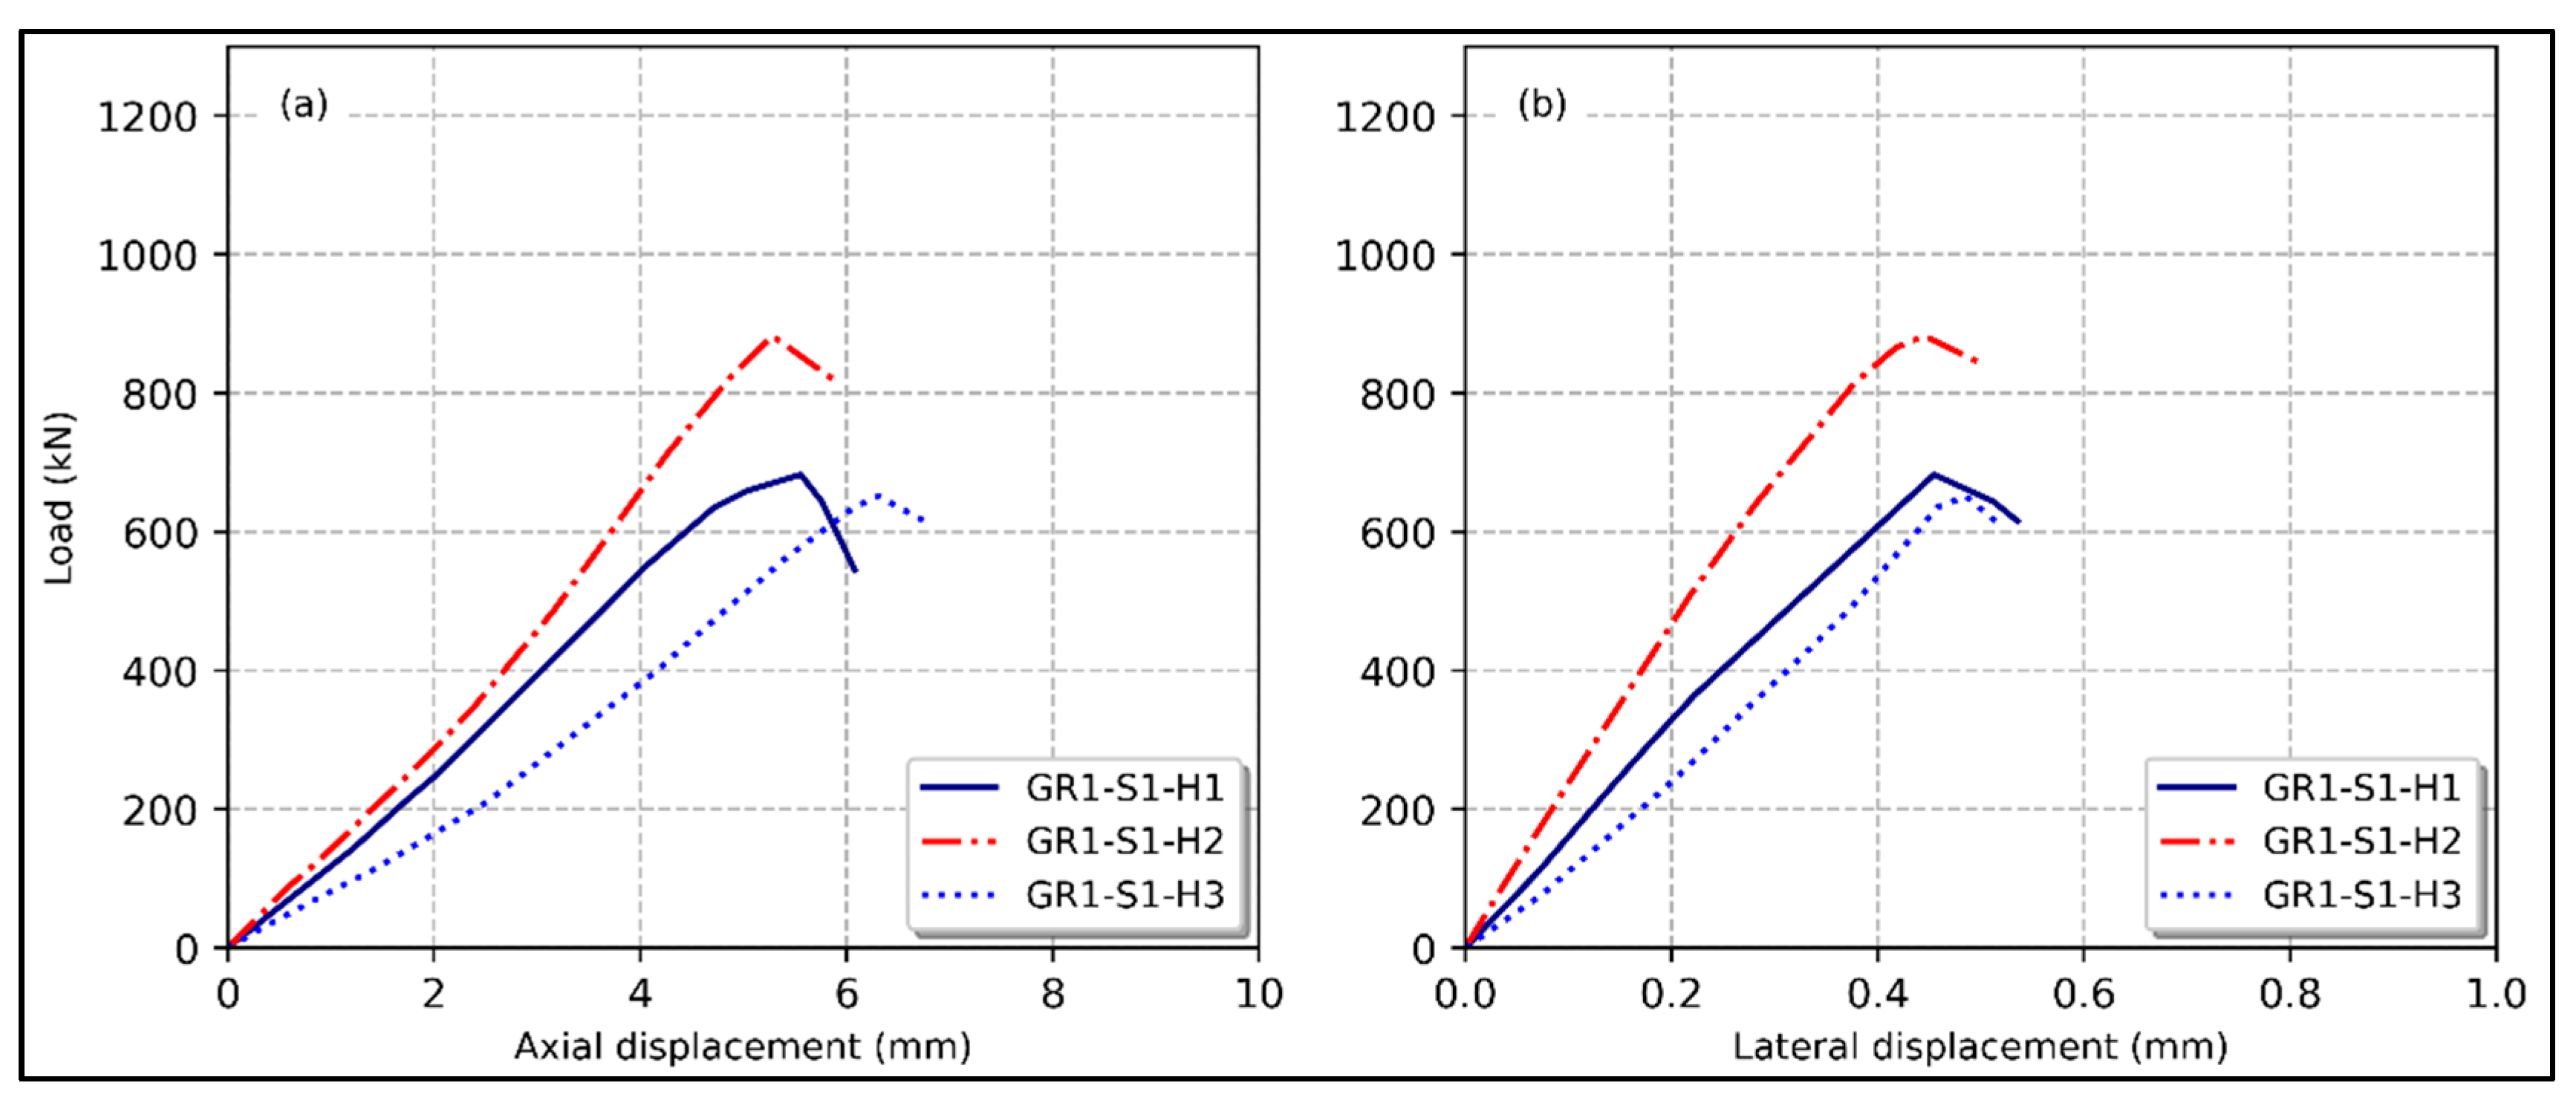
The column specimens in Group 3 displayed unique nonlinear load–deformation characteristics due to differences in their effective cross-sections. This behavior was attributed to initiating cracks in the inner and outer concrete covers, culminating at the peak load. Notably, specimen GR1-S1-H2 achieved a maximum axial load of 882.6 kN with an axial deformation of 5.28 mm, whereas specimen GR1-S1-H3 attained a maximum axial load of 651.4 kN with an axial deformation of 6.3 mm. Figure 14a,b shows the load–displacement responses for the Group 3 columns.
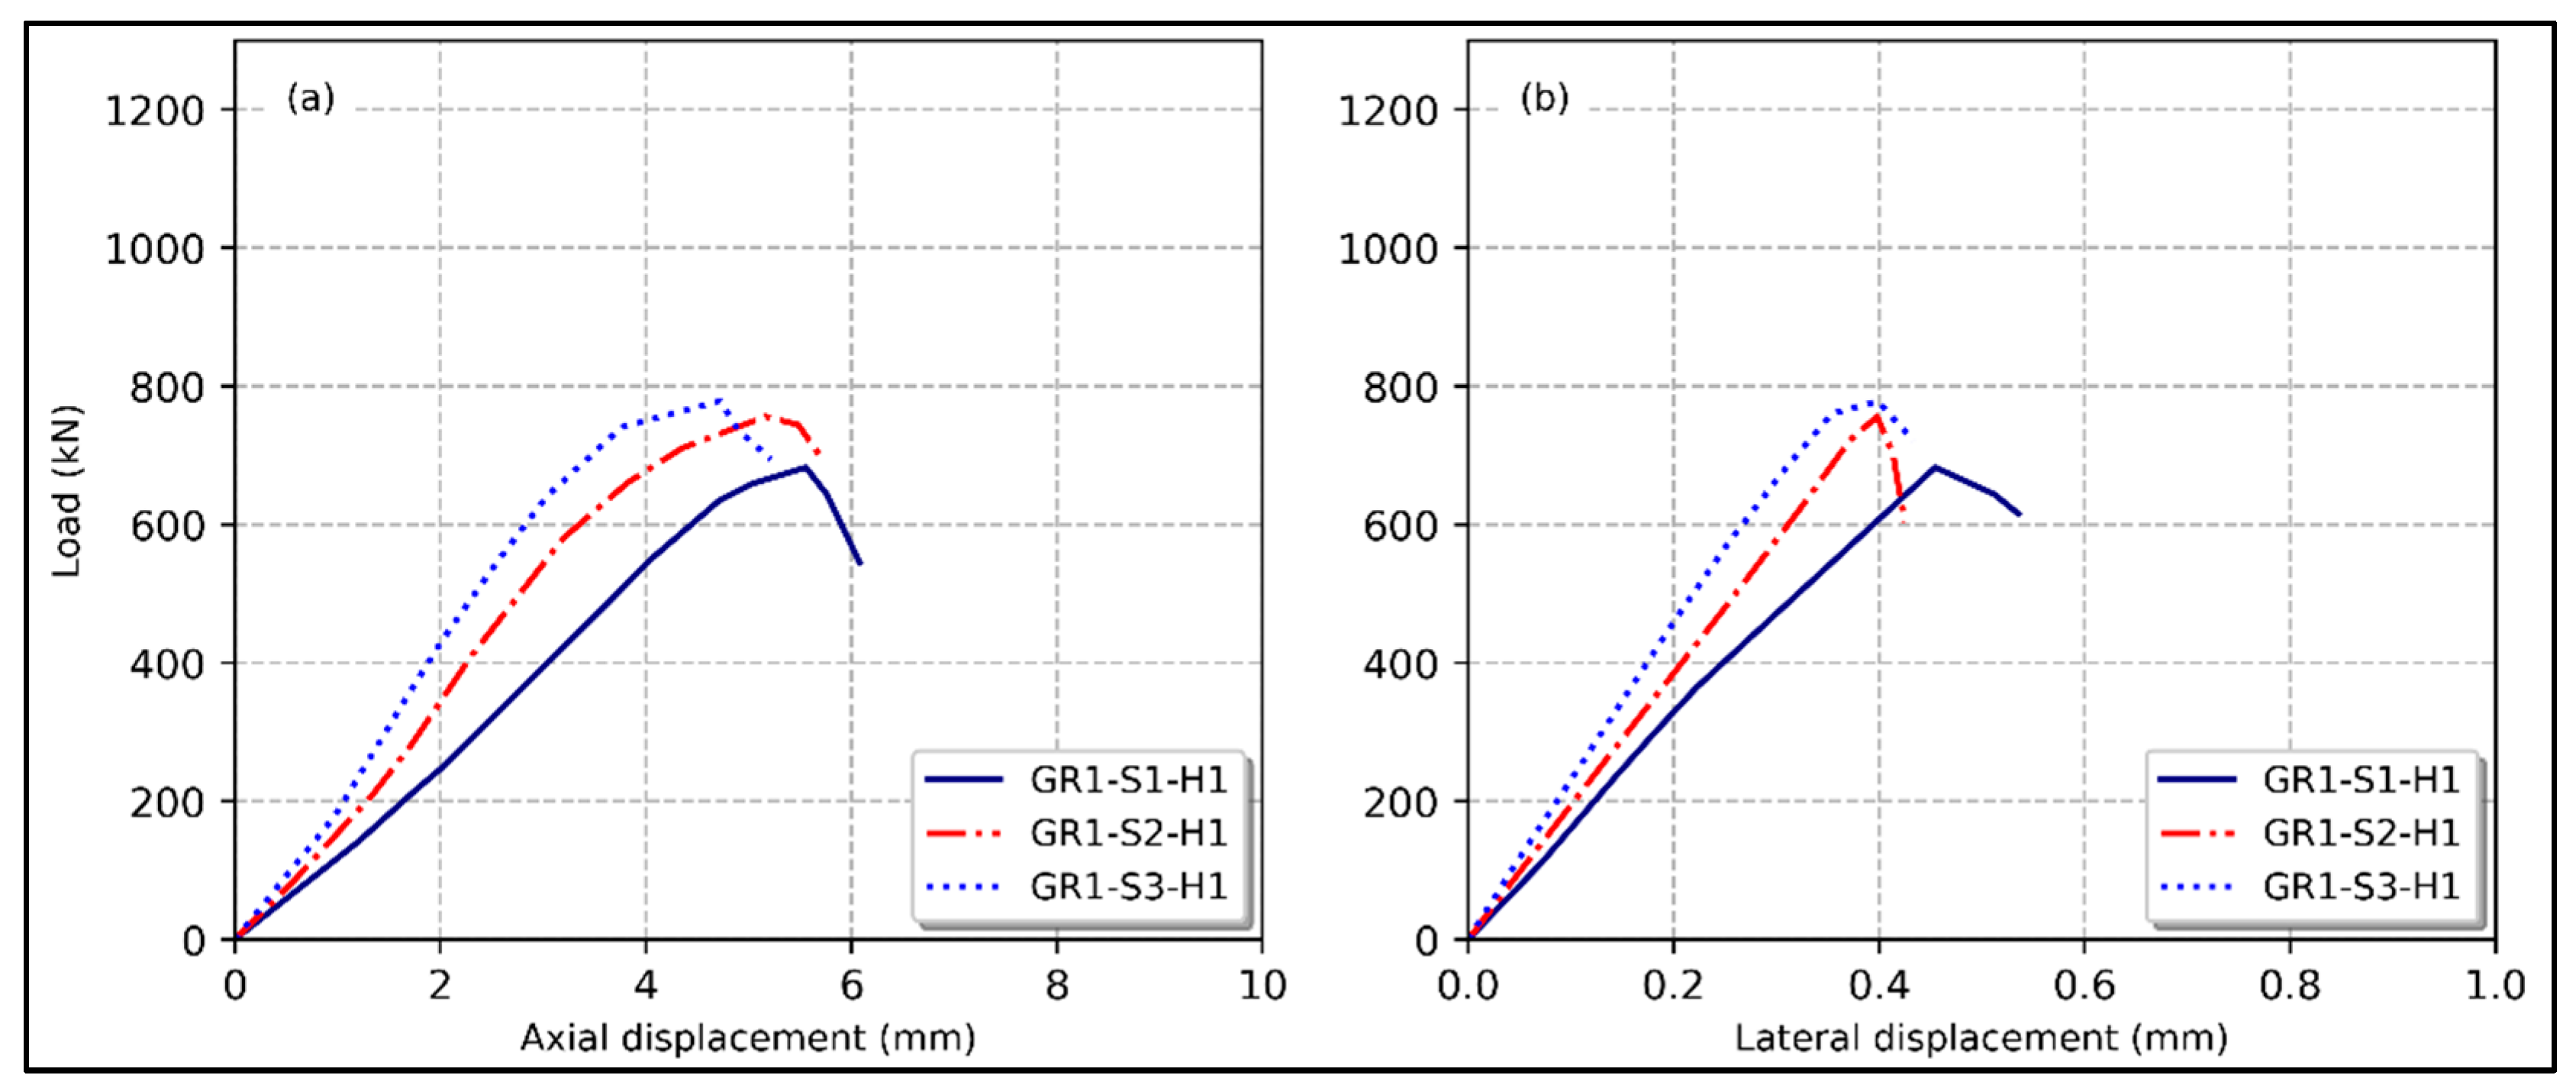
The influence of tie spacing on the load–displacement response of GFRP bars reinforced columns has been extensively investigated. Columns with reduced tie spacing demonstrated superior stability to those with wider spacing. This increased stability was assigned to the enhanced lateral confinement given by the tie reinforcement. Furthermore, the columns’ ultimate axial load capability was significantly impacted by tie spacing. For example, column GR1-S2-H1 exhibited a load capacity of 756.3 kN at an axial deformation of 5.16 mm, whereas column GR1-S3-H1 achieved a peak load capacity of 778.4 kN at an axial deformation of 4.72 mm. An increased axial load capacity was increased with the same cross-sectional area and longitudinal reinforcement ratio. These results highlight that lateral confinement is important in stopping cracks from spreading throughout the concrete. The concrete cover achieved favorable stress distribution due to the longitudinal bars and concrete core’s successful confinement. Figure 15a,b shows the load–displacement responses for the specimens in Group 4.

3.9. Longitudinal Bars’ Contribution to the Maximum Load Capacity

To assess the participation of the steel and GFPR bars, the values of the longitudinal bar’s mean axial strain, elastic modulus, and total area were multiplied [23]. It is important to note that steel reinforcement’s axial load contribution to GFRP reinforcement with the same cross-section was from about three to four times the axial peak load (=200 GPa/50 GPa) because steel reinforcement had a greater elastic modulus than GFRP reinforcement. The GFRP-reinforced hollow concrete column’s maximum load capacity may be precisely calculated by accounting for the contributions of the concrete cross-section and the longitudinal GFRP bar at an axial strain of 0.003. In this case, the contributions of the GFRP bar to the ultimate load capacity varied from 9% to 24%. Table 5 provides the longitudinal bar contribution of the present study’s hollow concrete column specimens.

3.10. Analytical Prediction of Ultimate Load Capacity

It is possible to determine the maximum load steel-bar reinforced columns can withstand using Equation (1) following ACI 318M-19 [24]. The concrete’s gross section area determines the GFRP column load-bearing capacity, whereas CAN/CSA-S806-12. and ACI continue to neglect the involvement of the GFRP bar. As a result of insufficient experimentation, several researchers have discovered that the longitudinal GFRP bar’s contribution is necessary to accurately anticipate concrete columns’ axial design load capacity. Due to the many ways that GFRP bars might fail under compression, it has not been easy to figure out how much they contribute to concrete columns. GFRP bars’ compressive strength is comparable to 35% of their typical tensile strength, as demonstrated in Equation (2), according to Tobbi et al. [25].
Pn = 0.85 fc (AgAst) + fy Ast
Pn = 0.85 fc (AgAGFRP) + 0.35 fu,GFRP AGFRP
where:
  • fc: compressive strength of concrete.
  • Ag: total area of the column’s cross-section.
  • Ast: steel reinforcement’s cross-sectional area.
  • fy: steel bar’s yield strength.
  • AGFRP: GFRP reinforcement’s cross-sectional area.
  • fu,GFRP: GFRP bar’s tensile strength.
The comparison between the axial load capacity determined by the experiment and the axial design load capacity, as determined by Equations (1) and (2), is presented in Table 6. An observed up to 8% discrepancy exists between the estimated and actual values. This variation can be attributed to the distinct considerations related to the participation of GFRP bars. Encouragingly, Equations (1) and (2) demonstrate a favorable matching between the expected axial column capacity and the test findings.

4. Result of Numerical Study

The ABAQUS program models the columns as compression members. The model was generated and analyzed to simulate the test specimen. The Concrete Damaged Plasticity Model (CDPM) represents concrete’s inelastic behavior, accounting for cracking and crushing. Additionally, the model considered steel reinforcement as a 3D deformable wire and GFRP bars as linear elastic isotropic materials. The structural behavior of GFRP bars was characterized by elasticity modulus and Poisson’s ratio.
In developing all elements, the C3D8R and T3D2 element types were utilized. The C3D8R element, characterized by eight nodes within a three-dimensional continuum and three degrees of freedom (DOFs) for translational movement at each node, was employed to model the concrete and steel caps. Conversely, the T3D2 element, a two-noded truss element in three dimensions with three translational DOFs per node, was used for other components. A mesh size of 20 mm was applied to discretize the concrete mass, longitudinal rebars, and ties, ensuring compatibility among the instances and alignment with the predefined partitions for the concrete cover [8,26,27].
The interaction between concrete and reinforcement was characterized using an embedded constraint approach, designating steel and GFRP cages as the embedded elements and concrete as the host material. The connection between the steel caps and the concrete column surface was modeled with a surface tie constraint, where the concrete column’s surface acted as the master surface and the inner surface of the steel caps as the slave surface. The accuracy of the finite element model (FEM) relied heavily on precise material simulations and accurate experimental boundary conditions. The top end of each column was left free, while an evenly distributed axial load was applied using a displacement control method. The base of each column was fully constrained in all degrees of freedom (DOF).
Compression failure was the mode of failure for every column that was tested. This kind of failure occurred when the force placed on the column exceeded the concrete’s matching compressive strength throughout the columns’ cross-sectional area. When the concrete and reinforcement reach yielded stress, the specimens failed with the collapse that occurred due to material failure and a small lateral displacement in all columns. There was no buckling because all the columns had a small slenderness ratio, all columns were designed as short, and all load cases were considered pure axial compression. When the load increased and reached its maximum, the column suddenly crushed and failed. The experimental results of most columns showed that the columns fail by crushing, concluding that there was no buckling in the columns. The lateral displacement in most columns was very small, which can be negligible. Furthermore, the column had already been designed as a short column. The failure mode was detected for all types of columns. Figure 16 illustrates the damage that occurred in each column for numerical results.
The column’s ultimate load of the numerical study was found and compared with the experimental result by the ratio (PNum/PExp), as represented in Table 7. The results of the comparisons gave a good agreement.

5. Conclusions

  • The cross-section area of GFRP-reinforced concrete columns determines their load-bearing capability. As a result of insufficient experimental data, existing design standards such as CAN/CSA-S806-12 and ACI 440.1R-22 do not expressly take GFRP bars into account. However, our findings indicate that the involvement of longitudinal GFRP bars may be adequately approximated by assuming that their compressive strength is around 35% of the GFRP bars’ tensile strength.
  • Increased internal longitudinal reinforcement provided by steel bars improved the structural efficacy of hollow square concrete columns regarding strength and deformation capacity. Specifically, raising the reinforcement ratio from 1.46% to 3.29% and 4.9% for the control column resulted in axial strength gains of 37.8% and 54.1%, respectively.
  • Compared to the GFRP control column, increasing the reinforcement ratio from 1.46% to 2.9%, 3.29%, 4.9%, and 5.85% achieved enhancements in axial strength of 32.3%, 43.9%, 60.5%, and 71.7%, respectively.
  • GFRP specimens had an axial load capacity of 13.1%, 9.2%, and 9.4% lower than steel-reinforced hollow columns with identical reinforcement ratios (1.46%, 3.29%, and 4.9%), respectively.
  • Reduced lateral tie reinforcement spacing positively impacted the maximum load-bearing capability. For instance, the axial bearing load increased by 10.8% and 14%, respectively, when the lateral tie spacing was decreased from 170 mm to 120 mm and 85 mm.
  • The load capacity of the hollow column decreased with an increase in the hollow ratio due to the reduced cross-sectional area. Additionally, faster crack propagation occurred in hollow columns with smaller concrete wall thicknesses. For instance, decreasing the hollow ratio from 0.15 to 0.07 increased the axial load capacity by 29.2%, while increasing it from 0.15 to 0.25 resulted in only a 4.5% increase.
  • The failure mechanisms of longitudinally reinforced columns exhibited significant differences when steel bars were replaced with GFRP bars. In hollow columns reinforced with GFRP longitudinally, failure typically manifested after the rupture of the longitudinal bars, which can occur due to buckling or crushing, leading to an abrupt loss of load-bearing capacity. Conversely, columns reinforced with longitudinal steel bars predominantly failed due to excessive bar buckling without the rupture of ties. Remarkably, hairline cracks in the outer concrete cover of hollow steel-reinforced columns appeared at around 65% of the maximum applied load; in contrast, crack initiation in GFRP-reinforced columns happened at almost 90% of the maximum applied load.
  • The compressive strain experienced by longitudinal GFRP bars was approximately 3000 με, corresponding to approximately 17.6% of the maximum strain capacity of GFRP bars. When comparing steel reinforcement to GFRP reinforcement with similar sectional areas, the load participation of steel reinforcement was from three to four times greater than the GFRP reinforcement’s axial peak load. This difference could be due to the significantly higher elastic modulus of steel reinforcement.
  • In summary, the numerical analysis exhibited favorable agreement with experimental results, validating the efficacy of the proposed modeling approach for simulating compression behavior in the studied columns.

Author Contributions

Conceptualization, A.I.S., H.A.H. and G.W.; Methodology, A.A.A.; Validation, A.I.S., H.A.H. and A.A.A.; Formal analysis, G.W.; Resources, H.A.H.; Writing—original draft, A.I.S.; Writing—review & editing, H.A.H. and A.A.A.; Visualization, A.A.A.; Project administration, G.W. All authors have read and agreed to the published version of the manuscript.

Funding

This research received no external funding.

Data Availability Statement

All data generated and analyzed during this study are included in this article.

Acknowledgments

This work was significantly supported by academic assistance from the Department of Civil Engineering, College of Engineering, University of Baghdad, for which the authors are thankful. Without their help and efforts, this task could not have been finished.

Conflicts of Interest

The authors declare no conflicts of interest.

References

  1. Mander, J.B.; Priestley, M.J.; Park, R. Behavior of ductile hollow reinforced concrete column. Bull. N. Z. Soc. Earthq. Eng. 1983, 16, 273–290. [Google Scholar] [CrossRef]
  2. Zahn, F. Design of Reinforced Concrete Bridges Column for Strength and Ductility. Ph.D. Thesis, University of Canterbury, Canterbury, UK, 1986. [Google Scholar]
  3. Whittaker, D. Seismic Performance of Off-Shore Concrete Gravity Platform. Ph.D. Thesis, University of Canterbury, Christchurch, New Zealand, 1987. [Google Scholar]
  4. Said, A.I.; Abbas, O.M. Serviceability behavior of high-strength concrete I-beam reinforced with carbon fiber reinforced polymer bar. J. Eng. 2013, 19, 1515–1530. [Google Scholar] [CrossRef]
  5. Ibrahim, T.H.; Allawi, A.A.; El-Zohairy, A. Impact Behavior of Composite Reinforced Concrete Beams with Pultruded I-GFRP Beam. Materials 2022, 15441, 441. [Google Scholar] [CrossRef] [PubMed]
  6. Kashani, M.M.; Madocks, J.; Dizaj, E.A. Residual Capacity of Corroded Reinforced Concrete Bridges Component: State-Of-The-Art Review. J. Bridges Eng. 2019, 24, 03119001. [Google Scholar] [CrossRef]
  7. Salh, L. Analysis and Behaviour of Structural Concrete Reinforced with Sustainable Material. Ph.D. Thesis, University of Liverpool, Liverpool, UK, 2014. [Google Scholar]
  8. Mohammed, S.A.; Said, A.I. Analysis of concrete beam reinforced by GFRP bar with varying parameters. J. Mech. Behav. Mater. 2022, 31, 767–774. [Google Scholar] [CrossRef]
  9. Ali, H.H.; Said, A.I. Flexural behavior of concrete beam with horizontal and vertical openings reinforced by glass-fiber-reinforced polymers (GFRP) bars. J. Mech. Behav. Mater. 2022, 31, 407–415. [Google Scholar] [CrossRef]
  10. AbdulMuttalib Issa, M.; Allawi, A.A.; Oukaili, N. Performance of doubly reinforced concrete beam with GFRP bar. J. Mech. Behav. Mater. 2024, 33, 20220308. [Google Scholar] [CrossRef]
  11. Issa, M.A.; Allawi, A.A.; Oukaili, N. Effects of GFRP Stirrup Spacings on the Behaviour of Doubly GFRP-Reinforced Concrete Beam. Civ. Eng. J. 2024, 10, 502–520. [Google Scholar] [CrossRef]
  12. Said, A.I. Evaluation of deflection in high strength concrete (HSC) I-beam reinforced with carbon fiber reinforced polymers (CFRP) bars. In Proceedings of the 7th Asia Pacific Young Researcher and Graduates Symposium, Innovations in Materials and Structural Engineering Practices, Kuala Lumpur, Malaysia, 20–21 August, 2015; pp. 519–533. [Google Scholar]
  13. ACI Committee 440; Guide for the Design and Constructions of Concrete Reinforced with FRP Bars (ACI 440.1R-15). American Concrete Institute: Philadelphia, PA, USA, 2015.
  14. CAN/CSA-S806-12; Design and Constructions of Buildings Structure with Fiber-Reinforced Polymer. Canadian Standards Association: Toronto, ON, Canada, 2012.
  15. ACI Code-440.11-22; Building Code Requirement for Structural Concrete Reinforced with GFRP Bar and Commentary. American Concrete Institute: Philadelphia, PA, USA, 2022.
  16. Castro, P.F.; Howie, I.; Karbhari, V. Concrete column reinforced with FRP rod. Int. J. Mater. Prod. Technol. 1995, 10, 338–343. [Google Scholar]
  17. Mirmiran, A.; Yuan, W.; Chen, X. Design for slenderness in concrete column internally reinforced with fiber-reinforced polymers bar. ACI Struct. J. 2001, 98, 116–125. [Google Scholar]
  18. Choo, C.C. Investigations of Rectangular Concrete Column Reinforced or Prestressed with Fiber Reinforced Polymers (FRP) Bar or Tendon. Ph.D. Thesis, University of Kentucky, Lexington, KY, USA, 2005. [Google Scholar]
  19. De Luca, A.; Matta, F.; Nanni, A. Behaviour of Full-Scale Glass Fiber-Reinforced Polymers Reinforced Concrete Column under Axial Loads. ACI Struct. J. 2010, 107, 589–596. [Google Scholar]
  20. Tavassoli, A. Behaviour of GFRP-Reinforced Concrete Column under Combined Axial Loads and Flexure. Master’s Thesis, University of Toronto, Toronto, ON, Canada, 2013. [Google Scholar]
  21. Al-Ajarmeh, O.S.; Manalo, A.C.; Benmokrune, B.; Karonasena, W.; Mendis, P.; Nguyen, K.T. Compressive behaviour of axially loaded circular hollow concrete column reinforced with GFRP bar and spiral. Constr. Build. Mater. 2019, 194, 12–23. [Google Scholar] [CrossRef]
  22. Abed, F.; El Refai, A.; El-Mesalami, N. Compressive Behaviour of Glass Fiber-Reinforced Polymers (GFRP) Reinforced Concrete Column. In Proceedings of the 10th International Conferences on FRP Composite in Civil Engineering: Proceeding of CICE 2020/2021, Istanbul, Turkey, 8–10 December 2021; Springer International Publishing: Berlin/Heidelberg, Germany, 2022; pp. 858–861. [Google Scholar]
  23. Lotfy, E.M. Behavior of reinforced concrete short column with fiber reinforced polymer bars. Int. J. Civ. Struct. Eng. 2010, 1, 545–557. [Google Scholar]
  24. ACI Committee 318; Building Code Requirement for Structural Concrete (ACI 318-19) and Commentary (ACI 318R-19). American Concrete Institute: Philadelphia, PA, USA, 2019.
  25. Tobbi, H.; Farghaly, A.S.; Benmokrune, B. Behaviour of Concentrically Loaded Fiber-Reinforced Polymers Reinforced Concrete Column with Varying Reinforcement Type and Ratio. ACI Struct. J. 2014, 111, 375–386. [Google Scholar] [CrossRef]
  26. Said, A.I.; Tu’ma, N.H. Numerical modeling for flexural behaviour of UHPC beam reinforced with steel and sand-coated CFRP bars. In Proceedings of the IOP Conferences Series: Earth and Environmental Sciences, Baghdad, Iraq, 22–23 June 2021; IOP Publishing: Bristol, UK, 2021; Volume 866. [Google Scholar]
  27. Hussein, H.A.; Said, A.I. Finite Element Analysis of Axially Loaded GFRP-Reinforced Concrete Hollow Square Column. In Proceedings of the E3S Web International Conference on Geotechnical Engineering and Energetic-Iraq (ICGEE 2023); EDP Sciences: Hulis, France, 2023; Volume 427. [Google Scholar]
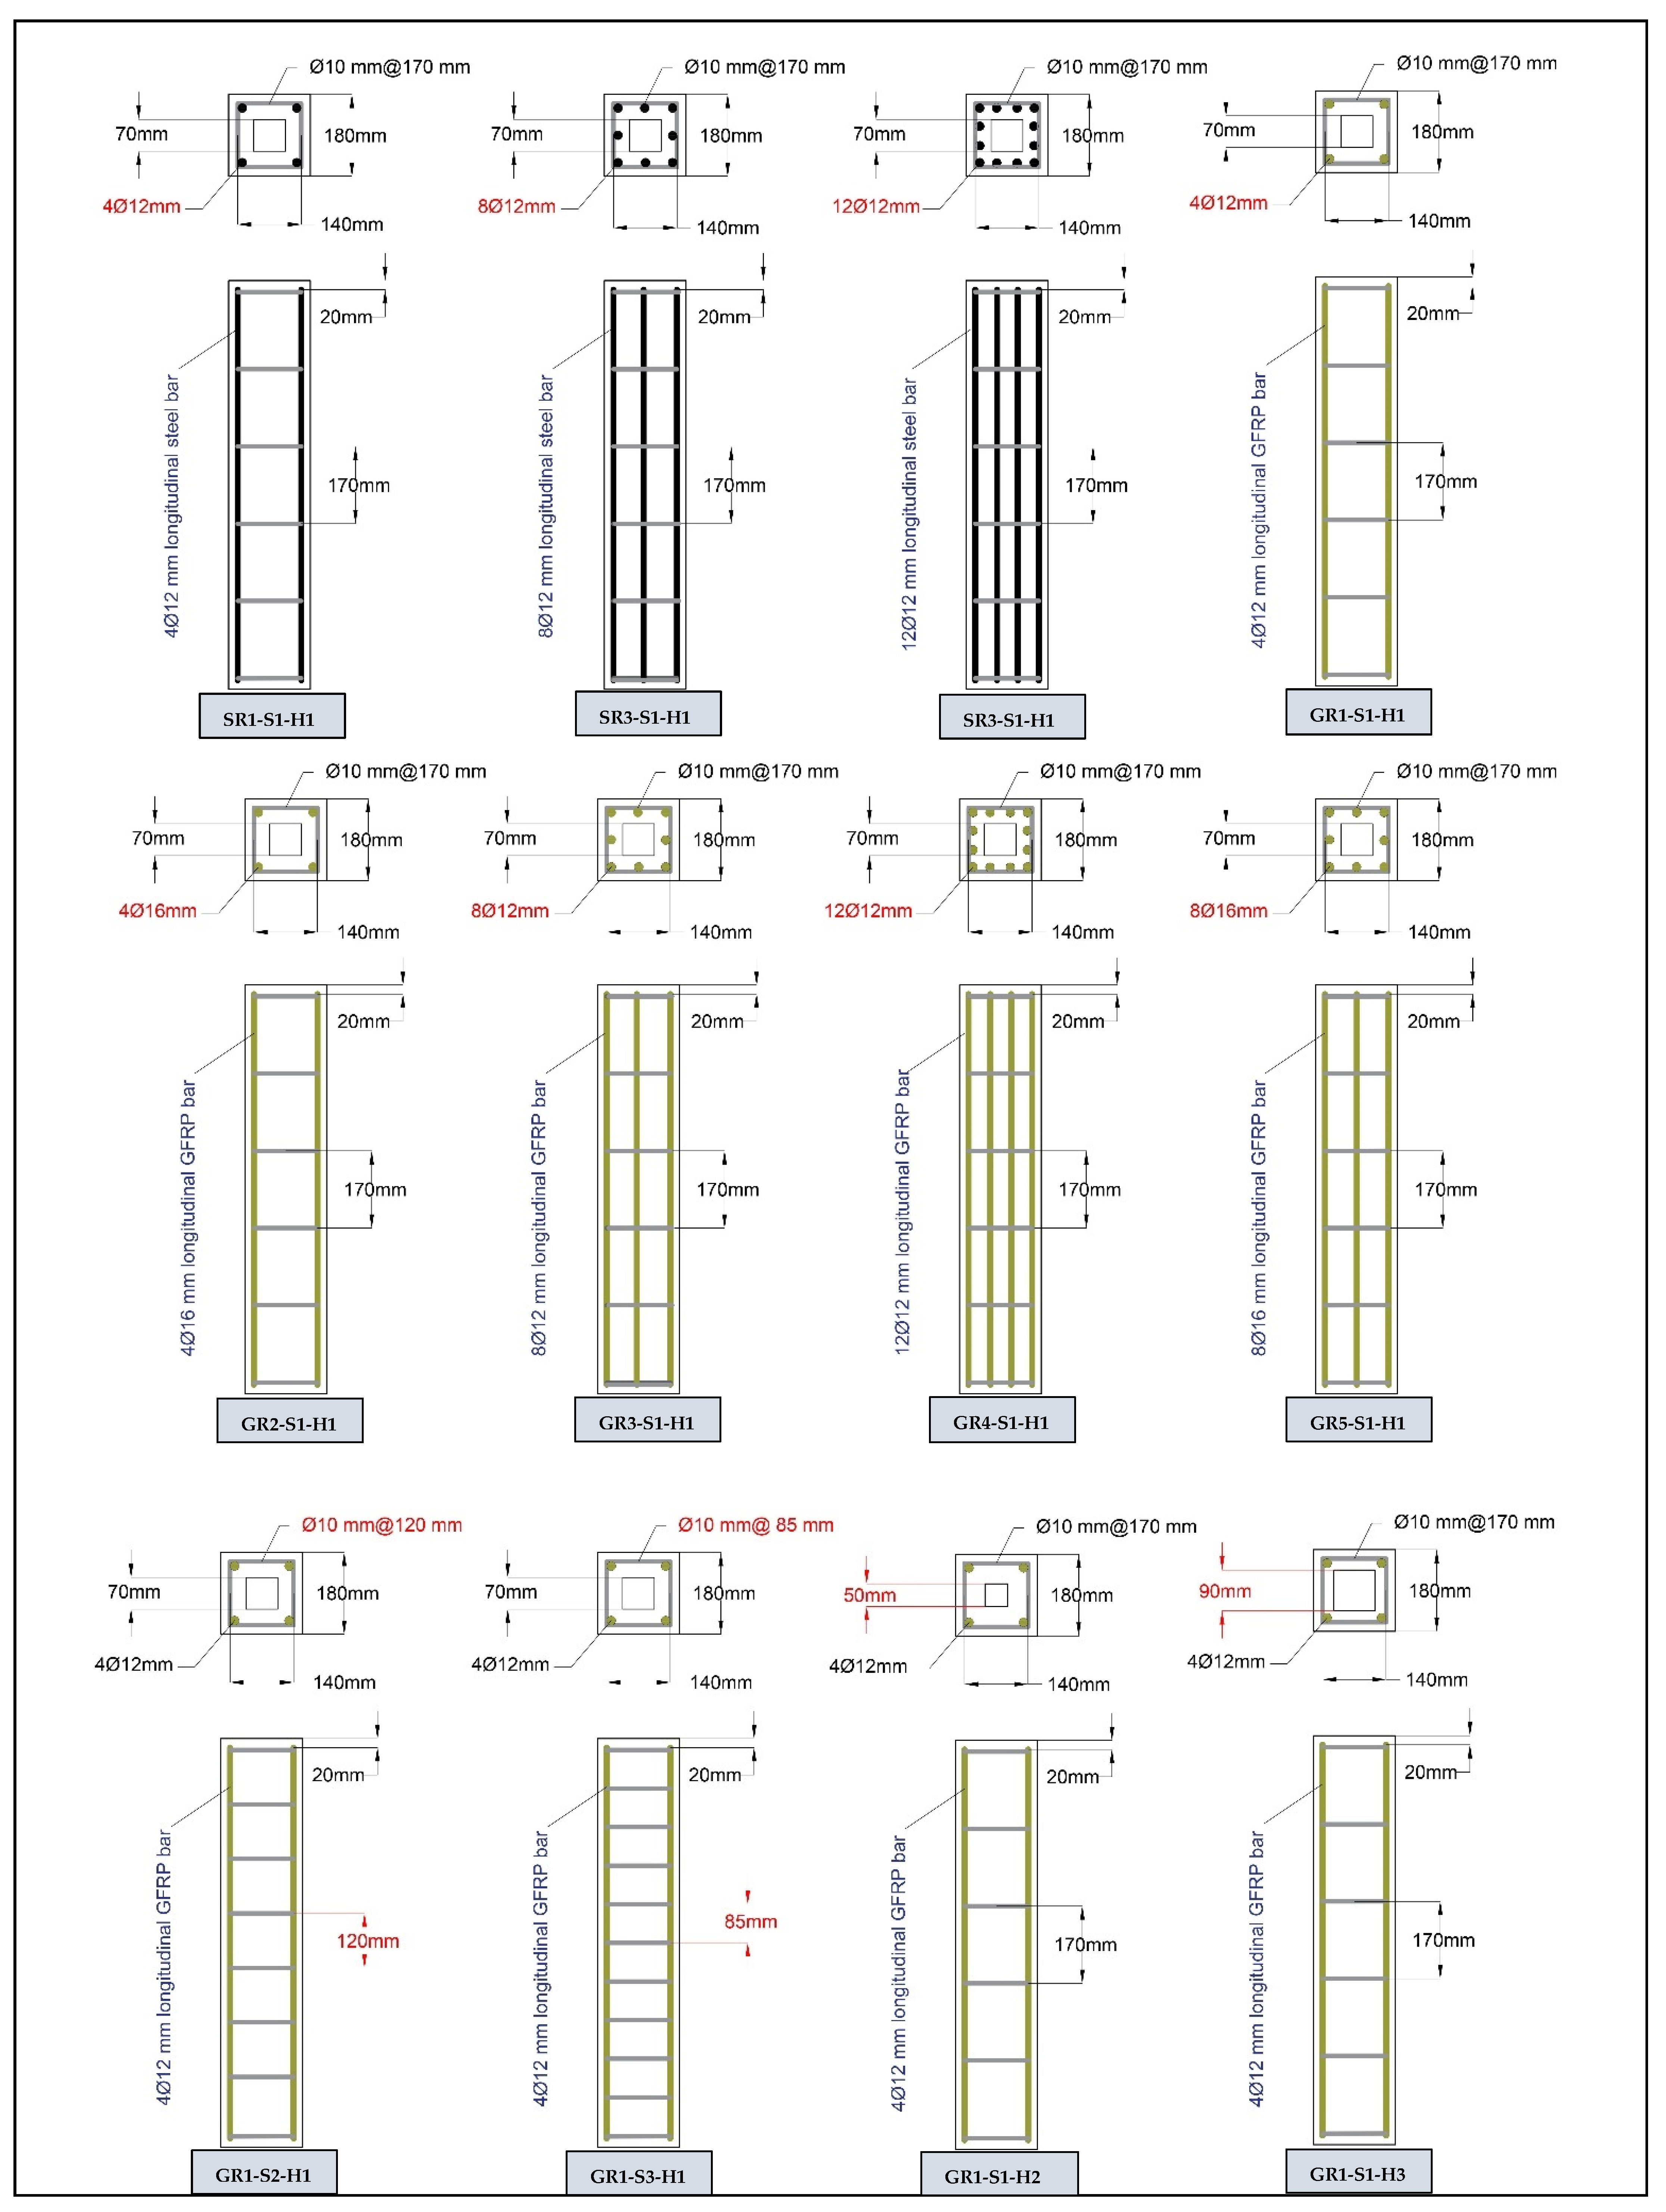
Figure 1. The reinforcement configurations for all columns.
Civileng 05 00047 g001
Figure 2. Preparation of (a) column specimens’ molds and (b) reinforcement bars.
Civileng 05 00047 g002
Figure 3. (a) Test configuration and equipment and (b) column specimens.
Civileng 05 00047 g003
Figure 4. (a) Axial load vs. steel reinforcement ratio, (b) axial load vs. GFRP reinforcement ratio, (c) axial load vs. hollow ratio, (d) axial load vs. ties spacing.
Civileng 05 00047 g004
Figure 5. The impact of varying reinforcement types on the axial load-bearing capacity.
Civileng 05 00047 g005
Figure 6. Failure of the (a) steel reinforcing bars and (b) longitudinal GFRP bars.
Civileng 05 00047 g006
Figure 7. Failure modes of all tested columns.
Civileng 05 00047 g007
Figure 8. (a) Load–steel strain, (b) load–concrete strain (Group 1).
Civileng 05 00047 g008
Figure 9. (a) Load–GFRP strain, (b) load–concrete strain (Group 2).
Civileng 05 00047 g009
Figure 10. (a) Load–GFRP strain, (b) load–concrete strain (Group 3).
Civileng 05 00047 g010
Figure 11. (a) Load–GFRP strain, (b) load–concrete strain (Group 4).
Civileng 05 00047 g011
Figure 12. (a) Load–axial displacement curves, (b) load–lateral displacement curves (Group 1).
Civileng 05 00047 g012
Figure 13. (a) Load–axial displacement curves, (b) Load–lateral displacement curves (Group 2).
Civileng 05 00047 g013
Figure 14. (a) Load–axial displacement curves, (b) load–lateral displacement curves (Group 3).
Civileng 05 00047 g014
Figure 15. (a) Load–axial displacement curves, (b) load–lateral displacement curves (Group 4).
Civileng 05 00047 g015
Figure 16. Numerical and experimental failure pattern.
Civileng 05 00047 g016
Table 1. Specification of the column specimens and parameters.
Group No.Specimens IdentificationReinforcement TypeReinforcement Ratio of Longitudinal Bar %Ties Spacing (mm)Hollow Ratio
Group 1SR1-S1-H1STEEL1.461700.15
SR3-S1-H1STEEL3.291700.15
SR4-S1-H1STEEL4.911700.15
Group 2GR1-S1-H1GFRP1.461700.15
GR2-S1-H1GFRP2.91700.15
GR3-S1-H1GFRP3.291700.15
GR4-S1-H1GFRP4.91700.15
GR5-S1-H1GFRP5.851700.15
Group 3GR1-S1-H2GFRP1.461700.07
GR1-S1-H3GFRP1.461700.25
Group 4GR1-S2-H1GFRP1.461200.15
GR1-S3-H1GFRP1.46850.15
Table 2. The specifics of a normal-strength concrete mix.
IngredientsQuantities
cement370 (kg/m3)
sand645 (kg/m3)
gravel935 (kg/m3)
water167 (kg/m3)
(cement:sand:gravel)1:1.7:2.5
(w/c)0.45
Average compressive strength24.01 (MPa)
Table 3. Properties of GFRP and steel bars.
Bar TypeDiameter (mm)Modulus of Elasticity (GPa)Tensile Strength
(MPa)
GFRP12501205
GFRP16501214
Steel12200532
Steel10200528
Table 4. The study’s outcomes for every concrete column in the survey.
Group No.Column IDUltimate Load (kN)Δaxial
(mm)
Δlateral
(mm)
εconcrete
(με)
εbar
(με)
Group 1SR1-S1-H1785.26.170.511701.12696.5
SR3-S1-H11082.55.880.492107.62970.1
SR4-S1-H11210.35.470.451980.72553.2
Group 2GR1-S1-H1682.65.540.471519.22913.9
GR2-S1-H1903.15.390.511751.62739.1
GR3-S1-H1982.65.280.481938.62854.6
GR4-S1-H11096.25.230.452280.93269.3
GR5-S1-H11172.34.390.412388.73586.2
Group 3GR1-S1-H2882.65.280.441579.23450.1
GR1-S1-H3651.46.30.491763.63424.6
Group 4GR1-S2-H1756.35.160.411886.33126.3
GR1-S3-H1778.44.720.382134.83417.2
Table 5. Longitudinal bar contribution in the ultimate load capacity.
Group No.Column IDPult (kN)Pbar (kN)Pbar/Pult
Group 1SR1-S1-H1785.2243.70.28
SR3-S1-H11082.5536.90.49
SR4-S1-H11210.3692.30.57
Group 2GR1-S1-H1682.665.80.09
GR2-S1-H1903.1110.10.12
GR3-S1-H1982.61290.13
GR4-S1-H11096.2221.60.2
GR5-S1-H11172.3288.30.24
Group 3GR1-S1-H2882.677.90.08
GR1-S1-H3651.477.30.11
Group 4GR1-S2-H1756.370.60.09
GR1-S3-H1778.477.20.1
Table 6. Experimental and analytical results were predicted for the tested columns.
Group No.Column
ID
Experimental
PExp (kN)
Calculated
PCal (kN)
(PExp/PCal)
Group 1SR1-S1-H1785.2731.31.07
SR3-S1-H11082.51021.71.05
SR4-S1-H11210.31252.10.96
Group 2GR1-S1-H1682.6741.60.92
GR2-S1-H1903.1882.31.02
GR3-S1-H1982.6922.21.06
GR4-S1-H11096.21102.90.99
GR5-S1-H11172.31203.60.97
Group 3GR1-S1-H2882.6799.81.1
GR1-S1-H3651.4685.60.95
Group 4GR1-S2-H1756.3741.61.02
GR1-S3-H1778.4741.61.05
Table 7. Comparative of the experiment and numerical result.
Column
ID
Numerical
PNum (kN)
Experimental
PExp (kN)
(PNum/PExp)
SR1-S1-H1803.1785.21.02
SR3-S1-H11074.51082.50.99
SR4-S1-H11168.41210.30.97
GR1-S1-H1685.3682.61.01
GR2-S1-H1889.7903.11.02
GR3-S1-H1945.6982.60.99
GR4-S1-H11080.21096.20.98
GR5-S1-H11142.31172.30.99
GR1-S1-H2857.7882.60.97
GR1-S1-H3637.6651.40.98
GR1-S2-H1748.7756.30.99
GR1-S3-H1739.1778.40.95
Disclaimer/Publisher’s Note: The statements, opinions and data contained in all publications are solely those of the individual author(s) and contributor(s) and not of MDPI and/or the editor(s). MDPI and/or the editor(s) disclaim responsibility for any injury to people or property resulting from any ideas, methods, instructions or products referred to in the content.