Abstract
Seismic isolation is a powerful tool for mitigating seismic risk and improving structural performance. However, some parameters, such as earthquake inputs and soil characteristics, influence the technology’s performance. This research aims to investigate the effects of soil–structure interaction (SSI) with regard to different moderate earthquakes associated with different distances of the source to the site, frequency content, and different soil characteristics on the seismic response of the isolated bridges. Near-fault (NF) and far-field (FF) records are applied to the conventional and isolated bridge with and without considering the underlying soil. For this reason, using the direct and simplified methods, three soil properties representing rock, dense, and stiff soils are modeled in Abaqus software. Nonlinear time history analysis (NLTHA) is carried out, and structural responses of both approaches in terms of maximum deck acceleration, base shear, and displacement of the deck and the isolation system are studied. Results demonstrate that the difference between the two approaches is significant. Using the simplified method is a rather simple approach that roughly captures the important features of the record characteristics and SSI. Furthermore, careful attention should be paid to the base shear responses and the isolator displacement demands, as they are significantly amplified in softer soils. In addition, the peak ground acceleration to peak ground velocity ratio (PGA/PGV) plays a decisive role in all dynamic responses. Records with a lower PGA/PGV ratio cause higher dynamic responses in terms of displacement and acceleration/force, regardless of the distance of the ruptured fault, while NF records show higher dynamic responses compared to FF records.
1. Introduction
Strong earthquakes may create devastating effects on infrastructures in seismic-prone areas. Experiences from past damaging earthquakes have proven that strength alone would not be a sufficient requirement for the safety of the structures and continuity of service. Therefore, researchers have continuously focused on studying various technologies to prevent or minimize the damage caused to structures by severe seismic activities.
Bridges are one of the most critical infrastructures in today’s modern society, being crucial components in transportation systems, especially in times of crisis, such as the period following a major earthquake. Therefore, the seismic design of bridges is carried out to fulfill a set of target seismic performances, typically tuned depending on the bridge’s importance and the earthquake’s probability of exceedance. As a result, the seismic hazard is defined in a set of design spectra associated with different probabilities of exceedance, usually varying between 2% and 40% in 50 years, and associated with different seismic performance levels. The design to reach such performance can be carried out according to a process called force-based design, where the target performances are implicit, and the designer has to apply prescriptive rules to reach them, or a performance-based design, where the target performances are explicitly expressed, and the designer has to prove that the proposed design meets such performances. Two main strategies can be adopted to design bridges for such seismic performances: (1) the conventional design approach where the superstructure is fixed, directly or through fixed bearings, to the foundation unit, herein called a conventional bridge; (2) the base-isolated design where special bearings with controlled lateral stiffness and eventually additional damping devices are inserted between the superstructure and the foundation units, herein called an isolated bridge. For the conventional design, to accommodate strong seismic action, i.e., the 2% in 50 years design earthquake, typically, the design of the bridge relies on the capacity of critical components to accommodate inelastic deformations by a ductile behavior.
One of the rational and fundamental solutions for mitigating the effects of earthquakes is seismic isolation [1]. Seismic isolation is based on reducing the fundamental structural vibration frequency to a value less than the predominant energy-containing frequencies of the earthquakes in order to decrease the seismic force demand to or near the elastic capacity of the structure; thereby, inelastic deformations within the structure will be obliterated or drastically diminished while large inelastic deformations take place within the isolation devices [2,3]. Numerous experimental and numerical research works on seismic responses of conventional and isolated structures have indicated that seismic isolation technology plays a significant positive role in reducing the seismic responses of infrastructures [4,5,6]. The long-term advantage of these innovations is that they preserve the structure’s serviceability following an earthquake, reducing the socioeconomic losses and the cost of reconstruction [7]. Consequently, hysteretic properties of the isolation devices govern the seismic response and performance of isolated bridges. Different isolation devices are commercially available, such as the friction pendulum and the lead rubber bearings, two of the most widely used isolation systems. Their properties are affected by many factors, such as temperature, aging, velocity, and fabrication tolerances [8,9]. Therefore, the design of base-isolated bridges uses a bounding analysis approach to evaluate the performance of the bridge at the upper and lower bound values of the hysteretic properties of the isolation devices. In addition, prototype and control quality testing on the seismic isolation units are typically prescribed to verify that the hysteretic properties and behavior fall within the used values in design [10]. Advancing in laboratory equipment and technology leads to more accurate experimental tests and numerical simulations. Therefore, innovative methods and models using different and new materials and performances, such as unbonded fiber-reinforced elastomeric isolators, high-damping rubber bearings strengthened with glass fiber fabrics, quasi-zero stiffness isolation systems, etc., have been introduced in recent years to introduce a new isolation system with better performance or improve the existing isolation systems to provide more performant, more convenient, and economical solutions for a wide range of structures and ground motion excitations [11,12,13,14]. Other researchers carried out parametric studies to identify the optimal range of hysteretic properties of seismic isolation devices leading to a better compromise between the reduction in seismic forces and the increase in seismic displacement, depending on the characteristics of the area’s seismic records [15].
Among different pivotal parameters on bridges’ structural responses, evidence from past earthquakes has indicated that the earthquake characteristics and the site conditions are two of the most critical parameters affecting the seismic performance of infrastructures [16,17].
Ground motion records within a 10–20 km distance from the ruptured fault are categorized as NF, while source-to-site distances of more than 20 km are classified as FF ground motions [18,19]. Seismic responses of structures between NF and FF records differ considerably. Many research studies reported that NF pulse-like ground motions are more destructive to the structure than ordinary ground motions [20,21,22,23]. NF records often have a higher PGV/PGA ratio. Frequently, they contain intense and long-period velocity pulses, which force the structure to behave in an inelastic range that may require much higher ductility demand and base shear than FF earthquakes, and the impulse effect may intensify the displacement of the isolation bearing [24,25,26,27,28]. Furthermore, in NF pulse-like ground motions, the pulse period (Tp) and peak pulse velocity (Vp), as critical parameters, show a significant influence on seismic responses of the structure [29,30]. Additionally, the variation of the period of structure to the pulse period has been found to show a strong correlation with the structural responses. Researchers showed that NF records particularly amplify the seismic responses of isolated bridges when the pulse period is close to the period of the structure [30,31].
Local sites and SSI can also significantly influence the main characteristics of ground motions, such as amplitude, frequency content, and duration, impacting the seismic responses of isolated bridges. The extent of such influence depends on the dynamic characteristics of the bridge structure, the input ground motion characteristics, and the underlying soil’s properties. [32,33].
In common seismic design practice of bridges, the structures are presumed to be fixed at their foundation where soil or (SSI) effects are ignored or considered separately, misrepresenting results in an erroneous estimation of the seismic demand and the parameters governing the design of the isolation system and the bridge, especially where the underlying soil is soft [34,35,36,37,38,39]. Therefore, isolated bridges on softer soils are particularly vulnerable to severe damage due to the underestimation of SSI effects, while isolation systems provide better performances on rocks or stiff soils [40,41].
Despite many available research studies, there are no consistent, categorized, and definite results regarding the SSI effects on seismically isolated bridges. The reason could be because of the extensive scope of the study containing many details, varieties, and uncertainties in infrastructures and soil properties, so each researcher has tried to cover a related part to their interests and specialties; still, many details have remained uncovered.
Many studies have been conducted by modeling soil through linear springs and dashpots to investigate the SSI effects. Different results have been reported, such as higher isolation system drift due to SSI [1,16,33,37,42,43] and higher base shears [16,44].
In contrast, some studies showed the beneficial aspect of SSI, causing a reduction in design costs and increasing the safety of the bridge [1,45] and a reduction in the base shear was also reported [32,45].
In addition, in some studies, researchers found that isolated bridges are less sensitive to SSI effects than conventional bridges [33,45]. Comparison between linear and nonlinear modeling of springs and dashpots showed that in many situations, nonlinear behavior for the soil model is an essential factor in properly reflecting the dynamic responses of the system [46]. Furthermore, few studies concluded that SSI could be beneficial or detrimental and results in a higher or lower seismic response based on different factors such as structural elements, soil stratum properties, and ground motion characteristics [16,47,48,49,50]. Very limited studies involved comprehensive consideration of the direct method showing that linear modeling of isolators and the soil leads to incorrect evaluation of the structural behavior, and in the case of conventional bridges, SSI has a significant effect on all dynamic responses and considering the soil effects is a crucial matter [51,52].
Aside from various conclusions drawn from the literature, most of these studies have focused on either ground motion characteristics or soil properties with or without isolation systems, with little attention paid to the combined effects of both factors on isolated bridges for earthquake-prone areas. As a result, this research aims to look into the effects of multiple record characteristics, such as NF and FF, and their frequency content and the effect of different soil types on a bridge with and without the isolation system. Actual earthquake records are extracted from rock strata. Each record is passed through various soil properties using the direct method, allowing the seismic responses of the isolated bridge to be studied. Results are compared with responses of the simplified method recommended by the commentary on the Canadian bridge code (CSA S6-19) to study the differences between these methods [10,53]. Furthermore, this research aims to understand how soil and SSI affect the efficiency of isolation systems in different models. Reaching a more advanced comprehension of the responses of isolated bridges leads to better and more optimal bridge designs in future projects. Furthermore, this understanding allows for more precise and effective isolation strategies through the choice of more appropriate methods and models, when necessary, to catch the SSI effects. The following sections will present more details about the records, soil categories, and isolation systems.
2. Numerical Modeling
2.1. Case Study and Modeling of the Bridge
The selected case study bridge model is the typical three-span continuous concrete box girder deck highway bridge studied by Jangid (2003) [1] and Elias (2017) [54], shown schematically in Figure 1. The bridge is symmetric with three equal spans of a box girder deck having a total length of 90 m, 20 m in width, and 1.86 m height. The superstructure is supported by two concrete cylindrical single piers of 2.28 m diameter and two abutments with 10 m height above the natural ground level. The single piers and end abutments are supported by shallow foundations of 4 m by 4 m in the horizontal plane and a depth of 1 m. As shown in Figure 1 for the conventional design, the superstructure connects to the top of the piers through a rigid connection, transmitting moments, and is supported by mobile, friction-free bearings that allow rotation and displacement in the longitudinal direction. The bridge in this configuration has a fundamental period of vibration in the longitudinal direction of 0.54 s, and a damping ratio of 5% is assumed. Table 1 illustrates the geometric and material properties used to model the bridge based on the data presented in the reference studies [1,54]. The bridge’s deck and abutments are all straight, with zero skew, and the lateral flexibility of abutments is neglected. In the present study, the structural modeling of the bridge and NLTHA are performed using Abaqus software [55]. Beam-column elements are defined to model the deck, piers, and abutments. C3D8R solid elements are used for the foundations and the soil stratum. The strategy behind the seismic isolation is to reduce the seismic forces to or near the elastic capacity of the structure and to limit the inelastic deformations within the isolation devices [1,16]. Similarly, for the conventional bridge, it is supposed that the bridge is classified as an essential bridge which is designed to remain essentially elastic under the design earthquake. Consequently, the superstructure and piers are assumed to remain in the elastic state during seismic excitation for both cases of conventional and isolated bridges.

Figure 1.
General elevation of the studied conventional (left) and isolated (right) bridge.

Table 1.
Material and dimension properties of the bridge.
For the isolated bridge, the superstructure is supported by seismic isolation bearings with low lateral flexibility, as described later, at all supports in the longitudinal direction, which is the direction investigated in this study. For the transverse direction, the bearings at piers and abutments, when applicable, are defined as fixed for displacements with rotations free. Vertical supports/connections between the superstructure and foundation are infinitely rigid. For both cases of conventional and isolated bridges, the piers’ bases are fixed in all translation directions and rotations, where the soil effect is not considered.
To validate the original model, a comparison of structural responses of the conventional bridge model and the results of reference papers for the Northridge records (captured at La County fire station component with PGA = 0.58 g) is carried out, and results are presented in Table 2. Good agreements between the results, in terms of vibration period, base shear, and deck acceleration, are obtained with a difference lower than 5%. After validation of the model, as the bridge is assumed to be in Montreal, to consider the frost action, the foundation is considered to be at a depth of D = 1.8 m below the soil surface, and upper soil load is considered in analyses.

Table 2.
Comparison of the responses with current study.
2.2. Isolation System
Considering the bridge is located in Montreal, as a moderate seismicity area, the isolation system is designed using the 6th generation hazard of earthquakes Canada [56] for an effective period of T = 2.5 s and an effective damping of 19% at the design displacement of 60.0 mm. The isolation properties are calculated based on the single-mode spectral analysis, and all the parameters are among the proposed domain by Nguyen and Guizani to design an optimal seismic isolation system [10,15].
The substructure is decoupled from the deck by lead rubber bearings, and the isolation system is lumped between the deck and substructure. Only the longitudinal direction is studied for implementing seismic isolation. Link elements with bilinear behavior based on the multi-plastic model given by Abaqus are used to model the isolation system [55]. The global model of the isolated bridge and soil, used for the direct approach, as well as the bilinear force–displacement relation, used to represent the seismic isolation system (SIS) behavior, are shown in Figure 2. The SIS hysteretic model parameters are presented in Table 3, where Qd is the characteristic strength, Kd represents the post-elastic stiffness, Ku stands for the elastic stiffness, and Keff is the effective stiffness at the maximum displacement in the isolation system, Dmax.
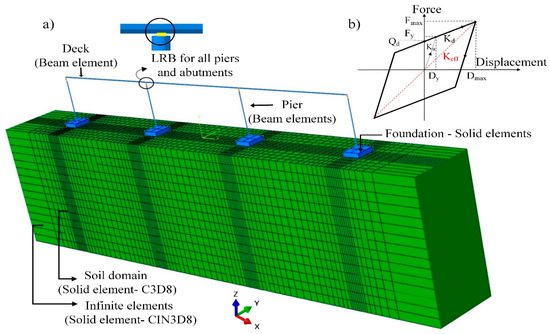
Figure 2.
(a) Isolated bridge model in the direct approach and soil, (b) bilinear force–displacement behavior of SIS.

Table 3.
Isolation properties.
2.3. Direct Approach
2.3.1. Soil Model and Properties
Accounting for the effect of SSI, an elastic-perfectly plastic behavior is assigned for the soil domain using the Mohr–Coulomb yield criterion [57].
The 8-node brick elements (C3D8) are applied to the soil deposit model as a rectangular shape of 130 m in length and 20 m in width. Three different non-liquefiable homogeneous soil profiles are adapted and studied as Rock, Soil-C, and Soil-D in this study based on the site classification in CSA (S6-19) [10]. In addition, considering the fact that most amplifications occur within the first 30 m of the soil profile, soil depth is considered to be 30 m [58,59]. The characteristics of each soil type are presented in Table 4, where E is the elastic modulus, ρ represents the density, C stands for the cohesion stress, ϑ is the Poisson’s ratio, Ø defines the friction angle, Vs is shear wave velocity, Ψ represents dilatancy, and ξ is the damping ratio.

Table 4.
Table 4. The mechanical properties of soils.
2.3.2. Soil Boundary Conditions
Regular boundaries will cause the reflection of waves at the finite boundaries of the soil model, which superimpose with the other waves resulting in an inaccurate simulation of actual motions within the studied domain if the domain is not large enough [60].
For this reason, the 3D solid continuum as CIN3D8 with 8-node linear, one-way infinite brick elements provided by Abaqus software is used in the longitudinal direction, which is the direction of the study, and fixed boundaries for the transverse direction with free rotations are used in this study. For realistic modeling of the bedrock, at the base of the model, the boundary condition is rigid, which is the most appropriate assumption [61]. Therefore, the earthquake acceleration records are directly applied to the grid points along the rigid base of the soil in the longitudinal direction. The surface-to-surface contact between the foundation and the soil surface is modeled as an interaction interfacial behavior following the algorithm implemented by Abaqus [55]. The interface stiffness values control the relative interface movement in the normal and tangential directions. Hard contact is used in the normal direction, and the penalty method is defined for tangential behavior. It should be noted that the foundation rocking effect is not considered in this study as it typically implies non-acceptable damage levels for lifeline bridges with conventional design, except when explicit measures are undertaken to mitigate such damages. It is not expected to occur for efficiently base-isolated bridges.
In tangential behavior, the reduction strength factor (Rinter = 0.7) is implemented in the classical friction model, and this factor has been selected based on practical cases and the suggested domain in the literature intending to calculate a final friction coefficient (µ) of 0.5 [62,63,64,65,66] according to:
A mesh sensitivity process is carried out to select the final mesh size so that the tolerance is less than 1%, in terms of displacement and stresses at control stations for structural and soil elements. As shown in Figure 2, the final mesh pattern shows fine mesh sizes for important areas close to the bridge and large elements at lateral soil boundaries. In addition, all mesh sizes are within the range between 1/8 and 1/35 of the Rayleigh wavelength, a suggested domain in the literature [67]. Overall, 1300 elements for the bridge and 23,520 C3D8R and 480 CIN3D8 elements for the soil domain are used.
2.4. Simplified Approach
The soil–foundation–structure system can be represented using simplified models of soil and foundation. Different methods of using springs or springs and dashpots equivalent to the soil model have been proposed to avoid the direct method’s complications and shorten the analysis time. This study uses the Winkler spring computational model recommended in the commentary on the Canadian bridge code (CSA S6-19) [10,53] to simplify the soil behavior.
As it is shown in Figure 3, to apply the simplified method, in the first step, site response analyses are conducted in the free-field foundation soil for all selected soil properties in order to determine earthquake time histories in the absence of the bridge structure using the computer program Deepsoil [68]. In the second step, the stiffness of the springs is calculated using formulas presented in Table 5. Then, the springs are modeled at the base of the bridge for 3 translational and 3 rocking motions. Finally, in the third step, extracted free-field earthquake records are applied to the base of the springs, and seismic responses of the bridge are obtained and studied from NLTHA.
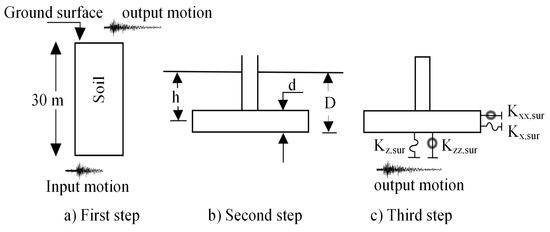
Figure 3.
Steps to create simplified model.

Table 5.
Foundation compliance springs for embedded foundations, adapted from FEMA 356 (2000).
Table 5 shows the expressions for computing the springs’ stiffnesses and the final stiffness values are presented in Table 6, where βx is the embedment factor, G is the shear modulus of the soil, L, B, d stand for the length, width, and height of the foundation footing, h represents depth to the centroid of effective sidewall contact, and D represents the total height of the soil from the bottom of the foundation.

Table 6.
Foundation stiffness.
Studies show that for a small shear strain index (generally under 0.03%), defined as the ratio of input motion peak velocity to time-averaged shear-wave velocity in the top 30 m of the soil profile, equivalent linear and nonlinear analyses results are practically identical [69]. Therefore, shear strain indexes were calculated for all records and soil deposits and are shown in Figure 4. It is shown that the differences between equivalent linear and nonlinear analyses become more pronounced for all records on Soil-C and Soil-D. Therefore, using the equivalent method is not acceptable for the current study. Despite such a fact, the simplified method was also conducted in this study, and all responses were compared with the direct method for the purpose of research and investigations.
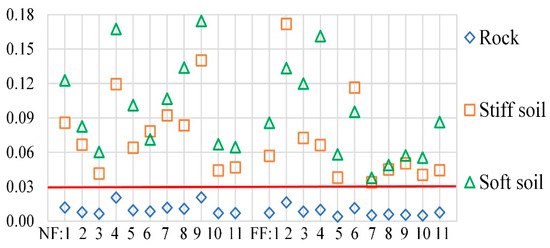
Figure 4.
Strain index for different soil types.
3. Seismic Analyses
3.1. Earthquake Record Selection and Calibration
As the bridge is assumed to be in Montreal, records are selected among moderate earthquakes with the magnitude 4–6 (Richter scale). In this study, 11 NF records with a rupture fault distance within 20 km and 11 FF records with rupture fault distances more than 20 km captured on the rock are selected from the Pacific Earthquake Engineering Research (PEER) strong motion database [55].
The reason for extracting these records on rocks is that minor changes in the ground motions occur in rocks. Therefore, the earthquake ground motions applied at the soil base are closer to the original input ground motions released from their sources.
The second reason for choosing the mentioned records is related to studying the effects of NF and FF sources, to study the effect of the ruptured fault distance, and investigating the effect of the frequency content (PGA/PGV) of the records on the dynamic responses of the bridge with and without SSI effects. It is worth mentioning that all records are selected among crustal earthquakes in active tectonic regimes.
Because most earthquakes result from fault movement in the crust, there is a rich database in accordance with the objectives of this study. In addition, the strength of shaking at the surface from a deep earthquake is considerably less than the same crustal earthquake [70]. To compare the results, all records are scaled to 0.444 g, which is the PGA associated with the uniform hazard design spectrum, 6th generation (CNB2020), recommended for Montreal for a 2% probability of exceedance in 50 years, on class A (average rock) [56,71]. The details of the selected ground motions scaled to 0.444 g are given in Table 7, and spectral accelerations of the scaled NF and FF records are shown in Figure 5.

Table 7.
Earthquake records adopted in the analyses.

Figure 5.
Spectral accelerations of the scaled NF and FF records log scale.
It should be mentioned that the interference of different source mechanisms, such as directivity effects and focal mechanisms (strike-slip, normal, or reversing faulting), is not considered during the selection of records.
Additionally, the vertical component of the ground motions is not considered, and only the longitudinal direction is investigated in this study.
3.2. Analysis Program and Procedure
All calibrated records are input at the base of the conventional and isolated bridge variants, first without considering the presence of soil where the base of the bridge is fixed and then with modeling the soil using the direct approach and simplified method.
The bridge variants are analyzed by NLTHA in Abaqus software, first for the static gravity dead load to obtain initial stress conditions and then for dynamic loading conditions. Dynamic loading is started by attaining the acceleration to the base of the model.
The structural responses of NLTHA, including the maximum acceleration on top of the deck, the maximum displacement of the bridge deck and isolation system, and the maximum base shear, are studied as seismic demands. Results are discussed in the following sections.
4. Results and Discussion
SSI effects on the seismic responses are studied and discussed in the following sections by comparing seismic demands, due to NF and FF records, for the conventional and isolated bridge variants located on Rock, Soil-C, and Soil-D, using the direct and simplified methods.
4.1. Effect of Earthquake Characteristics and SSI on the Acceleration Responses
The spectral accelerations for the higher and lower PGA/PGV ratio in both NF and FF records and for the average of NF and FF records are shown in Figure 6. The spectral acceleration on different soils and earthquake records indicate that the response spectra show amplification in Soil-C and Soil-D in the range of short periods. However, the extent of the amplification faded with increasing the period, leading to a minor difference in the responses at long periods.
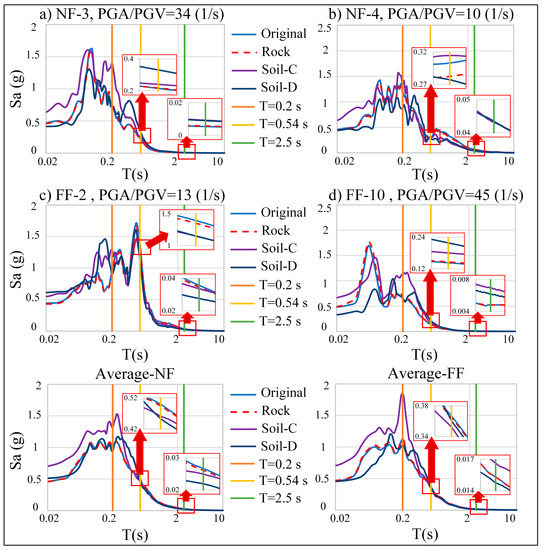
Figure 6.
Spectral accelerations captured in different soils with the maximum and minimum PGA/PGV ratios for NF and FF records and the average spectrum for all records.
In addition, the amplification is observed at the predominant period of each earthquake record, with higher responses for Soil-C and Soil-D in the case of earthquakes with the period close to the conventional bridge. It is worth mentioning that the intensity and the duration of the amplification strongly depend on each individual record carrying its own characteristics and frequency content.
Figure 7 shows the correlation of the maximum spectral acceleration response with the PGA/PGV ratio for different soil conditions for conventional and isolated bridge variants obtained from the direct and simplified approach. The common tendency of the responses is that the maximum acceleration responses in both conventional and isolated bridges decrease with an increasing PGA/PGV ratio.
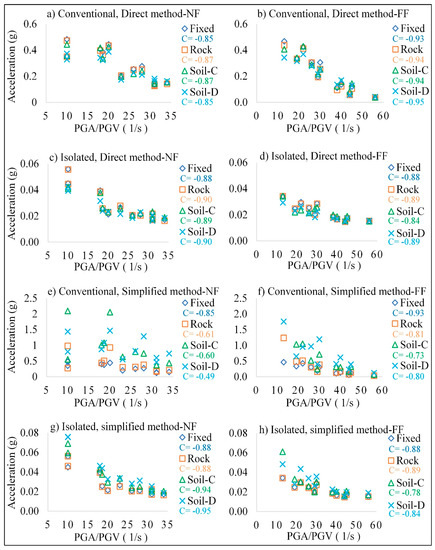
Figure 7.
Absolute maximum acceleration responses vs. PGA/PGV ratios (C = Correlation coefficient from Anova).
In conventional bridges and for the direct method, in the majority of earthquake records, the acceleration responses are decreasing from Rock to Soil-D, and they are less than the fixed-base bridge by an average of 3%, 4%, and 11% for NF records and 6%, 1%, and 8% for FF records, on Rock, Soil-C, and Soil-D, respectively. The differences in responses of the fixed-base bridge and the bridge on rock can be explained by the different behavior of the boundary condition at the base of each bridge.
In the case of the isolated bridge and for the direct method, the responses are attenuated and less scattered despite the fluctuation in acceleration responses for different soils. On average, the acceleration responses are decreasing from the fixed-base bridge to softer soils by 1%, 4%, and 10% for Rock, Soil-C, and Soil-D for NF records and 1%, 2%, and 10% for FF records, respectively. In addition, NF records which mostly have a lower value of PGA/PGV cause higher acceleration responses than FF records by an average of 30%, 32%, 25%, and 25% for the conventional bridge and 28%, 29%, 25%, and 26% for the isolated bridge in case of fixed-base, Rock, Soil-C, and Soil-D, respectively.
In the conventional bridge and for the simplified method, a significant increase in acceleration responses is observed compared to the fixed-base bridge in most cases. The average of the increasing trend in Rock is 46%, but it increases drastically up to about 200% (~3 times) in Soil-C and Soil-D for both NF and FF records.
On average, responses of the simplified method for the isolated bridge show a good agreement on the Rock with a difference of up to 1% and an increasing trend of 23% and 40% for Soil-C and Soil-D in NF records and 20% and 27% for Soil-C and Soil-D in FF records, respectively.
Moreover, NF records cause higher acceleration responses than FF records by an average of 31%, 11%, and 32% for the conventional bridge and 28%, 30%, and 38% for the isolated bridge in Rock, Soil-C, and Soil-D, respectively.
For both conventional and isolated bridges, the PGA/PGV ratio of the records has an important effect on the maximum acceleration responses for all soil types, and the distance of the ruptured fault is not an effective factor. The general trend shows that on softer soils, when the period of the structure increases, in the direct method for both conventional and isolated bridges, there is a reduction in the acceleration responses on the inclusion of SSI, and the reduction is more pronounced for the conventional bridge. This trend is the opposite in the simplified method because no damping is defined in the system. To study the effect of soil, all maximum acceleration responses are normalized by the responses of the fixed-base condition, and the results are shown in Figure 8. By this normalization, if the ratios are close to one, the soil effect is neutral, and SSI does not play a significant role in modifying the responses.
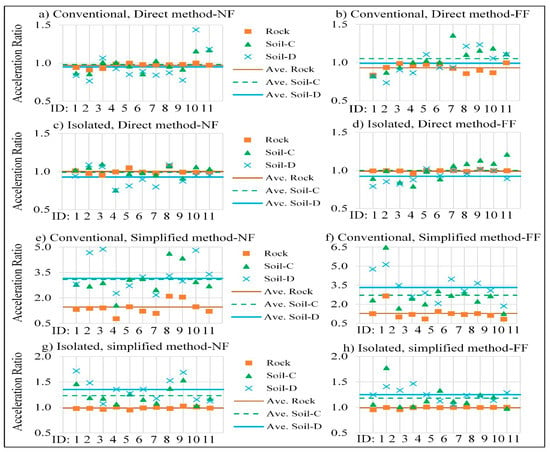
Figure 8.
Acceleration ratio (SSI/Fixed-base).
In the case of a ratio of more than one, responses are amplified, and the effect of SSI is not positive. Conversely, when the ratio is negative, SSI plays a favorable role in modifying and reducing the responses.
In the conventional bridge and the direct method, for most of the NF records, SSI is favorable, and it decreases the acceleration in softer soils. In contrast, there is no constant trend in FF records, and SSI plays a positive and negative role in different records.
In the isolated bridge and the direct method under both NF and FF records, the ratio tends to be close to one or less than one in most records. Therefore, the presence of soil plays a neutral or favorable role in modifying the isolated bridges’ acceleration responses, which agrees with the fact that isolated bridges are less sensitive to the SSI effects [33].
In the simplified method in use in this study and for both conventional and isolated bridges, SSI has a negative effect and amplifies the responses, while the increasing factor is more in conventional bridges. Table 8 shows the differences between the average dynamic responses in the simplified and direct methods for the conventional and isolated bridges. The percentage of the differences shows that the sensitivity of the conventional bridge to the selected method for Soil-C and Soil-D is more than the isolated bridge. At the same time, the isolation system controls the scattering of the responses.

Table 8.
The difference between the average responses of the simplified method compared to the direct method.
Table 9 shows the comparison of site coefficients, F(T), in CSA (S6-19) with the average responses of this study with respect to the fact that in CSA (S6-19), soil C is considered as a reference with F(T) = 1. Results demonstrate that in the conventional bridge, the site coefficients for rocks proposed by CSA (S6-19) could lead to underestimation of responses as the F(T) in the direct method is two times higher than the proposed value in CSA (S6-19).

Table 9.
Comparison of site coefficient F(T).
On the other hand, the site coefficient in Soil-D is less than the factor suggested by CSA (S6-19) by an average of 21% and 19% for NF and FF, respectively. In the case of the simplified method, responses are in good agreement for Rock and Soil-D by the maximum difference of 4 %.
It should be noted that in the isolated bridge, the responses of different soils in the direct method are almost the same for NF and FF records, and all the factors are close to one.
The same pattern of underestimating the responses in Rock more than two times appears in the isolated bridge in both the direct and simplified methods. In addition, the site coefficient in Soil-D is less than the factor suggested by CSA (S6-19) by an average of 31% and 19% for both direct and simplified methods, respectively.
Therefore, the site coefficient proposed for Rock in CSA (S6-19) might lead to underestimating the responses. In contrast, the increasing factor on soft soils is conservative for both NF and FF records.
4.2. Effect of Earthquake Characteristics and SSI on the Displacement Responses
The maximum displacement responses and the effect of PGA/PGV on different soil conditions and bridges are shown in Figure 9 For the conventional bridge and direct method, the maximum deck drift is related to the earthquake records with the lowest PGA/PGV ratio in NF and FF records and earthquake records with the predominant period close to the conventional bridge such as NF:8 and FF:2 with the periods of 0.48 s and 0.46 s, respectively.
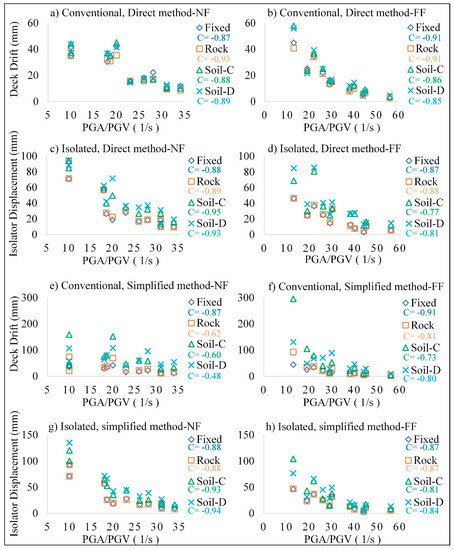
Figure 9.
Absolute maximum displacement responses vs. PGA/PGV ratios (C = Correlation coefficient from Anova).
On average, the deck drift decreases from the fixed-base bridge to Rock by 7% and 5% in NF and FF records, which could be because of the differences in their boundary conditions. With some exceptions, the whole pattern of the maximum deck drift is an increasing trend from Rock to softer soils in both NF and FF records. Compared to the fixed-base bridge, the maximum deck drift is increased by 2% and 3% for Soil-C and Soil-D under NF records and by 15% and 16% for Soil-C and Soil-D under FF records, respectively.
In the conventional bridge and simplified methods, because there is no damping in the system and springs are acting in a linear behavior, the deck drift increases drastically, up to three times more than the fixed-base bridge for both NF and FF records. In addition, NF records cause higher deck displacement than FF records in the conventional bridge by an average of 44%, 40%, 27%, and 28% in the direct method and 44%, 30%, 11%, and 31% for the simplified method in the case of fixed-base, Rock, Soil-C, and Soil-D, respectively.
In the isolated bridge and direct method, the maximum isolator displacements on piers significantly increase from Rock to softer soil compared to the fixed-base bridge for both NF and FF records. On average, there is a 3%, 30%, and 45% increase in NF records and a 3%, 69%, and 90% increase in the direct method in FF records for Rock, Soil-C, and Soil-D, respectively.
In the isolated bridge and simplified method, the same increasing trend in isolator displacement is observed by the average of 1%, 43%, and 67% in NF records and 1%, 63%, and 68% in FF records for Rock, Soil-C, and Soil-D, respectively.
It should be noted that the isolator displacement of two NF records with the lowest PGA/PGV ratio is higher than the designed displacement in all bridge cases, regardless of the presence of the soil in both methods.
In addition, the isolator displacements of NF:7 and NF:8 on Soil-D are higher than the designed displacement. In FF records, the same trend happens in the record with the lowest ratio of PGA/PGV in both methods. Additionally, the isolator displacements of FF:2 and FF:4 on Soil-C and Soil-D are higher than the designed displacement in both methods. The maximum isolator displacement for abutments shows a higher response than piers, up to three times in both methods. The considerable difference between the isolator displacement of the piers and abutments shows the importance of considering the soil effect in the design stage to fulfill the displacement demand based on the records’ characteristics and soil category.
Moreover, NF records cause higher isolator displacement than FF records by an average of 40%, 40%, 23%, and 22% for the direct method and 40%, 40%, 32%, and 41% for the simplified method in the case of fixed-base, Rock, Soil-C, and Soil-D, respectively.
The correlation between PGA/PGV ratios and the maximum displacement responses on both conventional and isolated bridges, as shown in Figure 9, indicates that the PGA/PGV ratio of the records has an important effect on the dynamic responses for both NF and FF records for all soil types and the distance of the ruptured fault is not an effective factor in displacement responses. Furthermore, as in softer soils, the period of the structure increases; in the direct method for both conventional and isolated bridges, there is an increase in the displacement responses on the inclusion of SSI, and the increase is more pronounced for the isolated bridge under NF records. This trend is the same for the simplified method.
The normalized displacement responses ratio presented in Figure 10 shows that soil’s positivity or negativity effects strongly depend on the record characteristics in the conventional bridge and the direct method.
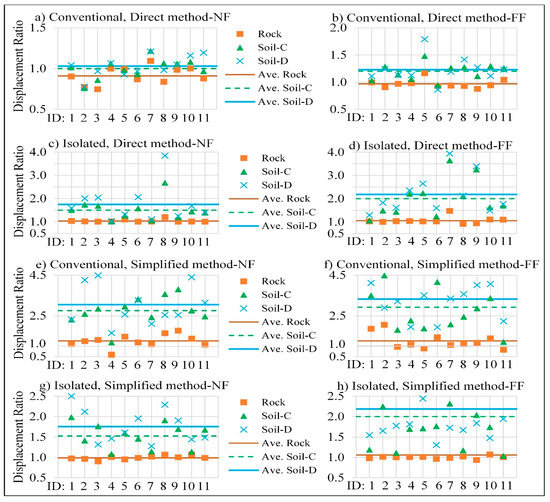
Figure 10.
Displacement ratio (SSI/Fixed-base).
For the isolated bridge and the simplified method, the pattern is almost the same, showing that soil does not play a positive role, and it increases the isolator displacement. Considering the average responses, SSI plays an unfavorable role in the isolator displacement responses, and isolated bridges are sensitive to the SSI effects. Therefore, these results agree with previous studies mentioning that isolated bridges on soft soils have a more significant potential for severe damage, while the isolation systems perform better on rocks during earthquakes [40,41].
4.3. Effect of Earthquake Characteristics and SSI on the Base Shear Responses
The maximum base shear responses and the effect of record characteristics on the responses are shown in Figure 11. In conventional bridges and the direct method, there is no constant trend for the maximum base shear responses, so in a few records, the diminishing of the responses is observed on softer soils, while in other records, responses are increasing and are higher than fixed-base bridges depending on each individual record and its characteristics, especially in the case of Soil-C.
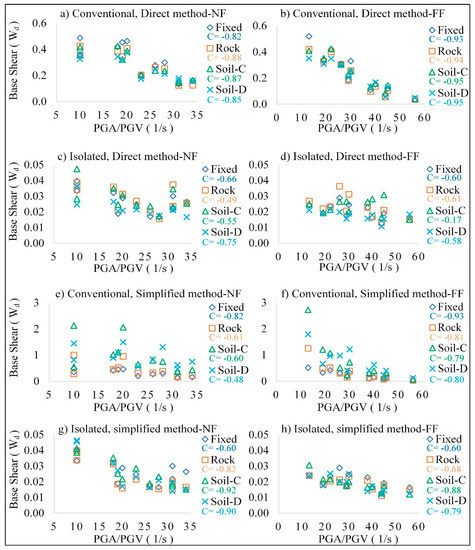
Figure 11.
Absolute maximum base shear responses vs. PGA/PGV ratios (C = Correlation coefficient from Anova).
The maximum base shear is related to the records with the lowest PGA/PGV and records with a predominant period close to the period of the conventional bridge (NF:8 with Tp = 0.48 s and FF:2 with Tp = 0.46 s). In the conventional bridge and the simplified method, as there is no damping in the system and also due to the linear behavior of the springs, an increasing trend is observed from Rock to softer soils in all records.
Considering the average of the base shear responses, there is a reduction in responses of the direct method by 12%, 10%, and 16% for NF records and 10%, 2%, and 11% for FF records on Rock, Soil-C, and Soil-D compared to the fixed-base bridge, respectively. On the other hand, for the simplified method, an increase of 42%, 202%, and 202% is observed for both NF and FF records on Rock, Soil-C, and Soil-D compared to the fixed-base bridge, respectively.
These observations are in agreement with the results of literature showing that depending on the details of the individual ground motions and their correlation to the dynamic properties of the pier and foundation, SSI could increase or decrease the base shear responses, and it should specifically be considered for design purposes as ignoring the observed increases in pier shear due to SSI will cause severe damage to the structure [16,72]. A comparison of responses of the conventional bridge for NF and FF records shows that NF records cause higher base shear responses compared to FF records by an average of 30%, almost in all cases. In addition, some individual records show an increasing trend in their base shear responses, up to 32% in NF records and 43% in FF records in Soil-D compared to the fixed-base bridge.
In the isolated bridge and direct method, maximum base shear responses increase in most of the records in Rock and Soil-C for both NF and FF records. However, it shows a decreasing trend for Soil-D. The average of the maximum base shear responses for NF and FF records show that the base shear is increasing in Rock and Soil-C by 7% and 9% for NF and 11% and 14% for FF, and then it reduces in Soil-D by 15% and 5% for NF and FF records, respectively.
In the isolated bridge and simplified method, there is a reduction of 15%, 2%, and 4% for NF records and 10%, 8%, and 10% for FF records in Rock, Soil-C, and Soil-D, respectively.
In addition, NF records cause higher base shear than FF records in the isolated bridge by an average of 29%, 25%, 23%, and 27% in the direct method and 29%, 20%, 38%, and 37% in the simplified method. It should be mentioned that some individual records show an increase in their base shear responses up to 40% in NF records and 70% in FF records in Soil-C compared to the fixed-base bridge.
As shown in Figure 11, the maximum base shear responses in the conventional and isolated bridges, for both NF and FF records, are related to the record with the lowest PGA/PGV ratio regardless of the soil effect and decrease with the increasing ratio of PGA/PGV.
In addition, the effect of record frequency is less in the isolated bridge, especially for FF records. The normalized base shear ratio in Figure 12 shows that in the conventional bridge and direct method, soil has a positive role in reducing the base shear in the majority of NF records, while soil effect could be favorable or unfavorable in FF records, depending on their characteristics. Base shear responses in the simplified method show that the soil has a negative effect, and softer soils increase the base shear responses. In the isolated bridge and direct method, the base shear responses are more positive in Soil-D, while the trend is unclear for Soil-C. On the other hand, in the isolated bridge and simplified method, soil has an unfavorable effect on NF records, and the soil effect is less pronounced for FF records and has almost a neutral effect.
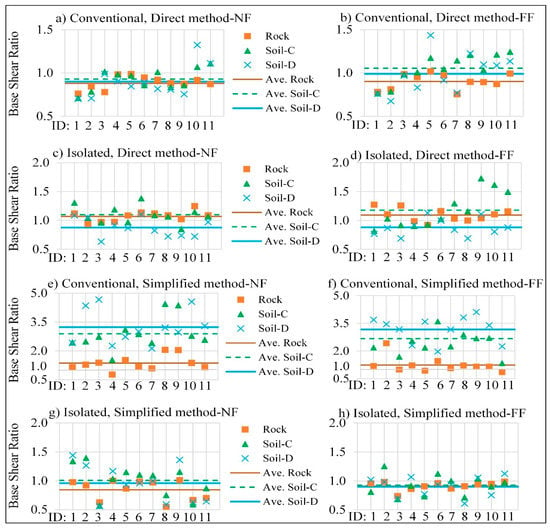
Figure 12.
Base shear ratio (SSI/Fixed-base).
In conclusion, the analysis of variance (ANOVA) was implemented to acquire the effect of PGA/PGV ratios and seismic responses of the bridges by calculating the linear correlation coefficient (shown in Figure 7, Figure 9 and Figure 11) and the probability of error (p-value). As a result, a strong correlation exists between PGA/PGV and maximum deck acceleration and the maximum base shear with the p-values much lower than 0.05 for all soil types and also for both approaches, direct and simplified methods, which is the threshold for the 95% confidence level.
However, depending on the analysis and modeling methods, the correlation between PGA/PGV is divergent for the maximum displacement responses. They are proven to be statistically significant only for Soil-C and Soil-D in the direct method and for fixed-base and Rock in the simplified method.
It should be mentioned that in order to thoroughly investigate the effect of SSI on conventional bridges with different flexibility, a conventional bridge with the period of 0.2 s is modeled using the direct method, and the results are compared with the original conventional bridge with the period of 0.54 s. As it is shown in spectral acceleration in Figure 6, there is a noticeable amplification in Soil-C at the period of 0.2 s in all records, and the responses of the stiffer bridge with the period of 0.2 s, shown in Figure 13, is higher than the bridge with a 0.54 s period except for NF:8 and FF:2 and it can be explained by the fact that the predominant period of the records are at the proximity of the period of the bridge and resonance is taking place in these records. The maximum acceleration and base shear of the bridge with a 0.2 s period is higher than the bridge with the period of 0.54 s by an average of 50% and 70% for NF and FF records. The deck drift of the stiffer conventional bridge is less than the bridge with 0.54 s by an average of 73% and 65% for NF and FF records. The responses of the stiffer conventional bridge are less sensitive to the PGA/PGV ratio. On average, softer soil (Soil-D) plays a positive role in decreasing the acceleration and base shear responses but increases displacement demand.
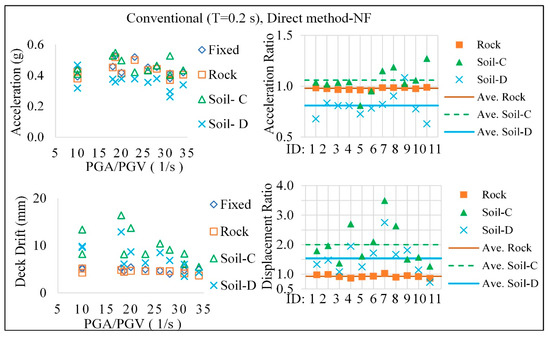
Figure 13.
Responses of the conventional bridge with T = 0.2 s.
5. Conclusions
This paper studied the simultaneous effects of NF and FF record characteristics and SSI effects on a three-span bridge with and without an isolation system. Seismic responses of the fixed-base bridge are compared by considering the soil domain and SSI effects in the direct approach and simplified method. Three different soil properties representing Rock, Soil-C, and Soil-D have been selected. The role of soil characteristics has been evaluated by considering the bridge founded on different soil strata subjected to moderate NF and FF records. Responses of NLTHA lead to the following conclusions:
- The fault distance does not play a decisive role in the dynamic responses of the bridge, and dynamic responses significantly depend on the low- or high-frequency contents of the records, regardless of the soil type, so the lower ratios of PGA/PGV cause the higher dynamic responses, and they diminish with the increasing of this ratio.
- With the same PGA, NF records which generally contain higher values of PGV cause higher dynamic responses compared to FF records for both conventional and isolated bridges on different soils.
- A considerable increase in the base shear response is observed in softer soils in a few individual records. For example, in the conventional bridge, there is a 43% increase in the maximum base share response on Soil-D for FF:5 compared to the fixed-base bridge (increasing by 0.015Wd, from 0.034Wd to 0.049Wd), while there is a 70% increase from the fixed-base isolated bridge to the isolated bridge in Soil-C (increasing by 0.012Wd, from 0.016Wd to 0.028Wd) in the case of FF:9. In fact, the base shear response is dominated by the uncertainty in the ground motion. Therefore, careful attention is needed at the design stage to anticipate the base shear demand depending on the frequency content, bridge condition and the underlying soil properties.
- In the isolated bridge and direct method, the maximum isolator displacements happen in the records with the lowest ratio of PGA/PGV. However, they increase drastically from Rock to Soil-C so that the displacement demand goes beyond the designed displacement. Therefore, ignoring the effect of the flexibility of soil and the SSI effects will result in underestimating the displacement demand of the isolated bridge and the possibility of destruction in the isolation system in earthquake-prone areas.
- The isolator displacement demand at the abutments is higher than the piers by up to three times in some individual records. Therefore, it should be carefully designed considering the soil effects and the characteristics of the records.
- As F(T) in the direct method is higher than the reduction factor proposed by CSA (S6-19) by the factor of 2.5, the site effect could lead to an underestimation of responses for rocks while it is conservative for soft soils.
- Using the simplified method in this study should be carried out alongside careful attention to the validity of using the equivalent linear method instead of the nonlinear method, because all the records with Soil-C and Soil-D were not eligible based on the limitation of the shear strain index (generally under 0.03%), and the responses were very scattered, especially in the conventional method. Therefore, the simplified method of using springs to represent the soil stratum is rather a simple approach to capture all the major mechanisms involved in soil, SSI, and characteristics of each earthquake ground motion.
It should be mentioned that regarding the specific objectives of the current research study and to limit computation and analysis efforts, this study did not consider many aspects, such as spatial variation and non-coherence of the seismic motions, multi-directional seismic excitation, analysis of base-isolated bridges at different levels of the hysteretic properties, notably at lower and upper bound values, and the possibility of inelastic deformations within the bridge foundation units (piers and abutments) for both the fixed-base design and isolated design, that could strongly impact the obtained results in different perspectives. Therefore, considering these aspects is worth further investigation.
Author Contributions
Conceptualization, L.G., N.G. and N.C.; methodology, L.G., N.G. and N.C.; writing, review and editing, L.G., N.C. All authors have read and agreed to the published version of the manuscript.
Funding
This research was conducted with the financial support of Fond de Recherche du Québec- Nature and Technologies (FRQNT).
Data Availability Statement
The data is available from the corresponding author upon request.
Acknowledgments
We acknowledge all the participants in the research for their availability to take part in the study.
Conflicts of Interest
The authors declare no conflict of interest.
References
- Tongaonkar, N.; Jangid, R. Seismic response of isolated bridges with soil–structure interaction. Soil Dyn. Earthq. Eng. 2003, 23, 287–302. [Google Scholar] [CrossRef]
- De Domenico, D.; Gandelli, E.; Quaglini, V. Adaptive isolation system combining low-friction sliding pendulum bearings and SMA-based gap dampers. Eng. Struct. 2020, 212, 110536. [Google Scholar] [CrossRef]
- Di Cesare, A.; Ponzo, F.C.; Telesca, A. Improving the earthquake resilience of isolated buildings with double concave curved surface sliders. Eng. Struct. 2020, 228, 111498. [Google Scholar] [CrossRef]
- Cardone, D.; Viggiani, L.; Perrone, G.; Telesca, A.; Di Cesare, A.; Ponzo, F.; Ragni, L.; Micozzi, F.; Dall’asta, A.; Furinghetti, M.; et al. Modelling and Seismic Response Analysis of Existing Italian Residential RC Buildings Retrofitted by Seismic Isolation. J. Earthq. Eng. 2022, 27, 1069–1093. [Google Scholar] [CrossRef]
- De Luca, A.; Guidi, L.G. State of art in the worldwide evolution of base isolation design. Soil Dyn. Earthq. Eng. 2019, 125, 105722. [Google Scholar] [CrossRef]
- Tsopelas, P.; Constantinou, M.; Okamoto, S.; Fujii, S.; Ozaki, D. Experimental study of bridge seismic sliding isolation systems. Eng. Struct. 1996, 18, 301–310. [Google Scholar] [CrossRef]
- Guizani, L.; Chaallal, O. Mise en conformité sismique des ponts par isolation de la base—Application au pont Madrid au Québec. Can. J. Civ. Eng. 2011, 38, 1–10. [Google Scholar] [CrossRef]
- Buckle, I.; Constantinou, M.; Dicleli, M.; Ghasemi, H. Seismic Isolation of Highway Bridges; MCEER-06-SP07; University at Buffalo: Buffalo, NY, USA; The State University of New York: New York, NY, USA, 2006; p. 190. [Google Scholar]
- Nassar, M.; Guizani, L.; Nollet, M.-J.; Tahan, A. Effects of temperature, analysis and modelling uncertainties on the reliability of base-isolated bridges in Eastern Canada. Structure 2022, 37, 295–304. [Google Scholar] [CrossRef]
- CSA. Canadian Highway Bridge Design Code(CHBDC), S6-19; Canadian Standards Association: Toronto, CA, Canada, 2019. [Google Scholar]
- De Domenico, D.; Losanno, D.; Vaiana, N. Experimental tests and numerical modeling of full-scale unbonded fiber reinforced elastomeric isolators (UFREIs) under bidirectional excitation. Eng. Struct. 2023, 274, 115118. [Google Scholar] [CrossRef]
- Nguyen, X.D.; Guizani, L. Analytical and numerical investigation of natural rubber bearings incorporating U-shaped dampers behaviour for seismic isolation. Eng. Struct. 2021, 243, 112647. [Google Scholar] [CrossRef]
- Ye, K.; Ji, J.; Brown, T. Design of a quasi-zero stiffness isolation system for supporting different loads. J. Sound Vib. 2020, 471, 115198. [Google Scholar] [CrossRef]
- Mordini, A.; Strauss, A. An innovative earthquake isolation system using fibre reinforced rubber bearings. Eng. Struct. 2008, 30, 2739–2751. [Google Scholar] [CrossRef]
- Nguyen, X.-D.; Guizani, L. Optimal seismic isolation characteristics for bridges in moderate and high seismicity areas. Can. J. Civ. Eng. 2021, 48, 642–655. [Google Scholar] [CrossRef]
- Ucak, A.; Tsopelas, P. Effect of Soil–Structure Interaction on Seismic Isolated Bridges. J. Struct. Eng. 2008, 134, 1154–1164. [Google Scholar] [CrossRef]
- Roussis, P.C.; Constantinou, M.C.; Erdik, M.; Durukal, E.; Dicleli, M. Assessment of Performance of Seismic Isolation System of Bolu Viaduct. J. Bridg. Eng. 2003, 8, 182–190. [Google Scholar] [CrossRef]
- Billah, A.H.M.M.; Alam, M.S.; Bhuiyan, M.A.R. Fragility Analysis of Retrofitted Multicolumn Bridge Bent Subjected to Near-Fault and Far-Field Ground Motion. J. Bridg. Eng. 2013, 18, 992–1004. [Google Scholar] [CrossRef]
- Bray, J.D.; Rodriguez-Marek, A. Characterization of forward-directivity ground motions in the near-fault region. Soil Dyn. Earthq. Eng. 2004, 24, 815–828. [Google Scholar] [CrossRef]
- Jia, H.; Liu, Z.; Xu, L.; Bai, H.; Bi, K.; Zhang, C.; Zheng, S. Dynamic response analyses of long-span cable-stayed bridges subjected to pulse-type ground motions. Soil Dyn. Earthq. Eng. 2023, 164, 107591. [Google Scholar] [CrossRef]
- Jiao, C.; Liu, W.; Wu, S.; Gui, X.; Huang, J.; Long, P.; Li, W. Shake table experimental study of curved bridges with consideration of girder-to-girder collision. Eng. Struct. 2021, 237, 112216. [Google Scholar] [CrossRef]
- Jiang, L.; Zhong, J.; Yuan, W. The pulse effect on the isolation device optimization of simply supported bridges in near-fault regions. Structures 2020, 27, 853–867. [Google Scholar] [CrossRef]
- Mangalathu, S.; Jeon, J.-S.; Jiang, J. Skew Adjustment Factors for Fragilities of California Box-Girder Bridges Subjected to near-Fault and Far-Field Ground Motions. J. Bridg. Eng. 2019, 24, 04018109. [Google Scholar] [CrossRef]
- Neethu, B.; Das, D. Effect of dynamic soil–structure interaction on the seismic response of bridges with elastomeric bearings. Asian J. Civ. Eng. 2018, 20, 197–207. [Google Scholar] [CrossRef]
- Ismail, M.; Rodellar, J.; Pozo, F. An isolation device for near-fault ground motions. Struct. Control Health Monit. 2014, 21, 249–268. [Google Scholar] [CrossRef]
- Chouw, N.; Hao, H. Study of SSI and non-uniform ground motion effect on pounding between bridge girders. Soil Dyn. Earthq. Eng. 2005, 25, 717–728. [Google Scholar] [CrossRef]
- Shen, J.; Tsai, M.-H.; Chang, K.-C.; Lee, G.C. Performance of a Seismically Isolated Bridge under Near-Fault Earthquake Ground Motions. J. Struct. Eng. 2004, 130, 861–868. [Google Scholar] [CrossRef]
- Liao, W.; Loh, C.; Wan, S.; Jean, W.; Chai, J. Dynamic responses of bridges subjected to near-fault ground motions. J. Chin. Inst. Eng. 2000, 23, 455–464. [Google Scholar] [CrossRef]
- Yang, T.; Yuan, X.; Zhong, J.; Yuan, W. Near-fault pulse seismic ductility spectra for bridge columns based on machine learning. Soil Dyn. Earthq. Eng. 2023, 164, 107582. [Google Scholar] [CrossRef]
- Zhong, J.; Yang, T.; Wang, W. Quantifying the impact of normalized period on seismic demand model of ductile columns under pulse-like ground motions. Bull. Earthq. Eng. 2022, 20, 6789–6812. [Google Scholar] [CrossRef]
- Yang, D.; Guo, G.; Liu, Y.; Zhang, J. Dimensional response analysis of bilinear SDOF systems under near-fault ground motions with intrinsic length scale. Soil Dyn. Earthq. Eng. 2019, 116, 397–408. [Google Scholar] [CrossRef]
- Tochaei, E.N.; Taylor, T.; Ansari, F. Effects of near-field ground motions and soil-structure interaction on dynamic response of a cable-stayed bridge. Soil Dyn. Earthq. Eng. 2020, 133, 106115. [Google Scholar] [CrossRef]
- Dezi, F.; Carbonari, S.; Tombari, A.; Leoni, G. Soil-structure interaction in the seismic response of an isolated three span motorway overcrossing founded on piles. Soil Dyn. Earthq. Eng. 2012, 41, 151–163. [Google Scholar] [CrossRef]
- Fatahi, B.; Tabatabaiefar, S.H.R.; Samali, B. Soil-structure interaction vs Site effect for seismic design of tall buildings on soft soil. Géoméch. Eng. 2014, 6, 293–320. [Google Scholar] [CrossRef]
- Saritaş, F.; Hasgür, Z. Dynamic behavior of an isolated bridge pier under earthquake effects for different soil layers and support conditions. Tek. Dergi 2014, 25, 1733–1756. [Google Scholar]
- Worku, A. Soil-structure-interaction provisions: A potential tool to consider for economical seismic design of buildings? J. South Afr. Inst. Civ. Eng. 2014, 56, 54–62. [Google Scholar]
- Stehmeyer, E.H.; Rizos, D.C. Considering dynamic soil structure interaction (SSI) effects on seismic isolation retrofit efficiency and the importance of natural frequency ratio. Soil Dyn. Earthq. Eng. 2008, 28, 468–479. [Google Scholar] [CrossRef]
- Kulkarni, J.A.; Jangid, R. Effects of Superstructure Flexibility on the Response of Base-Isolated Structures. Shock. Vib. 2003, 10, 1–13. [Google Scholar] [CrossRef]
- Chaudhary, M.; Abé, M.; Fujino, Y. Identification of soil–structure interaction effect in base-isolated bridges from earthquake records. Soil Dyn. Earthq. Eng. 2001, 21, 713–725. [Google Scholar] [CrossRef]
- Alam, A.; Bhuiyan, M. Effect of soil–structure interaction on seismic response of a seismically isolated highway bridge pier. J. Civ. Eng. 2013, 41, 179–199. [Google Scholar]
- Dicleli, M.; Buddaram, S. Effect of isolator and ground motion characteristics on the performance of seismic-isolated bridges. Earthq. Eng. Struct. Dyn. 2005, 35, 233–250. [Google Scholar] [CrossRef]
- Ates, S.; Constantinou, M.C. Example of application of response spectrum analysis for seismically isolated curved bridges including soil-foundation effects. Soil Dyn. Earthq. Eng. 2011, 31, 648–661. [Google Scholar] [CrossRef]
- Bi, K.; Hao, H.; Chouw, N. Influence of ground motion spatial variation, site condition and SSI on the required separation distances of bridge structures to avoid seismic pounding. Earthq. Eng. Struct. Dyn. 2010, 40, 1027–1043. [Google Scholar] [CrossRef]
- Hoseini, S.S.; Ghanbari, A.; Davoodi, M. A new approach to soil-pile-structure modeling of long-span bridges subjected to spatially varying earthquake ground motion. Bridg. Struct. 2019, 14, 63–79. [Google Scholar] [CrossRef]
- Vlassis, A.; Spyrakos, C. Seismically isolated bridge piers on shallow soil stratum with soil–structure interaction. Comput. Struct. 2001, 79, 2847–2861. [Google Scholar] [CrossRef]
- Soneji, B.; Jangid, R. Influence of soil–structure interaction on the response of seismically isolated cable-stayed bridge. Soil Dyn. Earthq. Eng. 2008, 28, 245–257. [Google Scholar] [CrossRef]
- Carbonari, S.; Dezi, F.; Leoni, G. Seismic soil-structure interaction in multi-span bridges: Application to a railway bridge. Earthq. Eng. Struct. Dyn. 2011, 40, 1219–1239. [Google Scholar] [CrossRef]
- Jeremić, B.; Kunnath, S.; Xiong, F. Influence of soil–foundation–structure interaction on seismic response of the I-880 viaduct. Eng. Struct. 2004, 26, 391–402. [Google Scholar] [CrossRef]
- Mylonakis, G.; Gazetas, G. Seismic soil-structure interaction: Beneficial or detrimental? J. Earthq. Eng. 2000, 4, 277–301. [Google Scholar] [CrossRef]
- Betti, R.; Abdel-Ghaffar, A.; Niazy, A. Kinematic soil–structure interaction for long-span cable-supported bridges. Earthq. Eng. Struct. Dyn. 1993, 22, 415–430. [Google Scholar] [CrossRef]
- Forcellini, D. Cost assessment of isolation technique applied to a benchmark bridge with soil structure interaction. Bull. Earthq. Eng. 2017, 15, 51–69. [Google Scholar] [CrossRef]
- Güllü, H.; Jaf, H.S. Full 3D nonlinear time history analysis of dynamic soil–structure interaction for a historical masonry arch bridge. Environ. Earth Sci. 2016, 75, 1421. [Google Scholar] [CrossRef]
- Canadian Standards Association. Commentary on CSA S6-19, Canadian, Highway Bridge Design Code; CSA Group: Toronto, CA, Canada, 2019. [Google Scholar]
- Elias, S.; Matsagar, V. Effectiveness of Tuned Mass Dampers in Seismic Response Control of Isolated Bridges Including Soil-Structure Interaction. Lat. Am. J. Solids Struct. 2017, 14, 2324–2341. [Google Scholar] [CrossRef]
- ABAQUS. Analysis User’s Manual, Version 6.14; Dassault Systemes Simulia, Inc.: Johnston, RI, USA, 2014. [Google Scholar]
- Earthquakes Canada. Earthquakes Canada, GSC, Earthquake Search (On-line Bulletin). 2022. Available online: http://earthquakescanada.nrcan.gc.ca/stndon/NEDB-BNDS/bulletin-en.php (accessed on 25 August 2022).
- Labuz, J.F.; Zang, A. Mohr–Coulomb failure criterion. Rock Mech. Rock Eng. 2012, 45, 975–979. [Google Scholar] [CrossRef]
- Tabatabaiefar, H.R.; Fatahi, B. Idealisation of soil–structure system to determine inelastic seismic response of mid-rise building frames. Soil Dyn. Earthq. Eng. 2014, 66, 339–351. [Google Scholar] [CrossRef]
- Rayhani, M.H.; El Naggar, M.H. Numerical Modeling of Seismic Response of Rigid Foundation on Soft Soil. Int. J. Géoméch. 2008, 8, 336–346. [Google Scholar] [CrossRef]
- Liu, G.R.; Quek Jerry, S.S. A non-reflecting boundary for analyzing wave propagation using the finite element method. Finite Elem. Anal. Des. 2003, 39, 403–417. [Google Scholar] [CrossRef]
- Tabatabaiefar, S.H.R.; Fatahi, B.; Samali, B. Seismic Behavior of Building Frames Considering Dynamic Soil-Structure Interaction. Int. J. Géoméch. 2013, 13, 409–420. [Google Scholar] [CrossRef]
- Dehghanpoor, A.; Thambiratnam, D.; Taciroglu, E.; Chan, T. Soil-pile-superstructure interaction effects in seismically isolated bridges under combined vertical and horizontal strong ground motions. Soil Dyn. Earthq. Eng. 2019, 126, 105753. [Google Scholar] [CrossRef]
- Khazaei, J.; Amiri, A.; Khalilpour, M. Seismic evaluation of soil-foundation-structure interaction: Direct and Cone model. Earthq. Struct. 2017, 12, 251–262. [Google Scholar] [CrossRef]
- Pando, M.A.; Ealy, C.D.; Filz, G.M.; Lesko, J.J.; Hoppe, E.J. A Laboratory and Field Study of Composite Piles for Bridge Substructures; Federal Highway Administration, Office of Infrastructure: Washington, DC, USA, 2006. [Google Scholar]
- Kimmerling, R. Geotechnical Engineering Circular No. 6 Shallow Foundations; Federal Highway Administration, Office of Bridge Technology: Washington, DC, USA, 2002. [Google Scholar]
- Manual, N.D.; Mechanics, S. Foundations and Earth Structures. NAVFAC DM-7; Department of the Navy, Naval Facilities Engineering Command: Washington, DC, USA, 1986; p. 982. [Google Scholar]
- Jesmani, M.; Fallahi, A.M.; Kashani, H.F. Effects of Geometrical Properties of Rectangular Trenches Intended for Passive Isolation in Sandy Soils. Earth Sci. Res. 2012, 1, 137. [Google Scholar] [CrossRef]
- Hashash, Y.M.A.; Musgrove, M.I.; Harmon, J.A.; Groholski, D.R.; Phillips, C.A.; Park, D. DEEPSOIL 6.1, User Manual; Board of Trustees of University of Illinois at Urbana-Champaign: Urbana, IL, USA, 2016. [Google Scholar]
- Kim, B.; Hashash, Y.M.A.; Stewart, J.P.; Rathje, E.M.; Harmon, J.A.; Musgrove, M.I.; Campbell, K.W.; Silva, W.J. Relative Differences between Nonlinear and Equivalent-Linear 1-D Site Response Analyses. Earthq. Spectra 2016, 32, 1845–1865. [Google Scholar] [CrossRef]
- United States Geological Survey “USGS”. Available online: https://www.usgs.gov/ (accessed on 25 August 2022).
- National Research Council of Canada. Fire, National Building Code of Canada: 2020; National Research Council of Canada: Montreal, QC, Canada, 2022. [Google Scholar]
- Makris, N.; Zhang, J. Seismic Response Analysis of a Highway Overcrossing Equipped with Elastomeric Bearings and Fluid Dampers. J. Struct. Eng. 2004, 130, 830–845. [Google Scholar] [CrossRef]
Disclaimer/Publisher’s Note: The statements, opinions and data contained in all publications are solely those of the individual author(s) and contributor(s) and not of MDPI and/or the editor(s). MDPI and/or the editor(s) disclaim responsibility for any injury to people or property resulting from any ideas, methods, instructions or products referred to in the content. |
© 2023 by the authors. Licensee MDPI, Basel, Switzerland. This article is an open access article distributed under the terms and conditions of the Creative Commons Attribution (CC BY) license (https://creativecommons.org/licenses/by/4.0/).