Article

Priority Criteria (PC) Based Particle Swarm Optimization of Reinforced Concrete Frames (PCPSO)

1
Institute of Structural Mechanics, Bauhaus University, 99423 Weimar, Germany
2
School of Civil and Environmental Engineering, Addis Ababa Institute of Technology, Addis Ababa 1000, Ethiopia
3
Department of Civil, Environmental and Infrastructure Engineering, George Mason University, Fairfax, VA 22030, USA
*
Author to whom correspondence should be addressed.
CivilEng 2023, 4(2), 679-701; https://doi.org/10.3390/civileng4020039
Submission received: 30 March 2023 / Revised: 3 June 2023 / Accepted: 9 June 2023 / Published: 16 June 2023
(This article belongs to the Special Issue Feature Papers in CivilEng)

Abstract

:
Simplicity and optimality are commonly associated with the particle swarm optimization (PSO) algorithm. As a result, numerous variants and hybrids of PSO have been developed and implemented to address structural optimization problems. The undeniable importance of the initialization technique in determining the overall performance of a given optimization algorithm cannot be overstated. Optimization algorithms, such as PSO, typically rely on a random, uniformly distributed initialization. Through multiple iterations and updates, these algorithms aim to achieve optimal results. The underlying assumption behind such an initialization approach is that a fair or reasonable arrangement of particles is best accomplished through randomization, and thus the entire optimization process is iterated based on this assumption. However, this initialization technique raises concerns regarding the attainment of optimality and convergence, leaving room for further examination. In this paper, we challenge this assumption by introducing a priority concept. The key idea is that particles should not be initialized randomly since randomness alone does not guarantee a reasonable allocation of design variable values in iterative optimization. This can lead to misguided velocity updates and ultimately, a time-consuming pursuit of optimality. To address this issue, we formulate priority criteria (PC) and propose an enhanced PSO variant called Priority Criteria PSO (PCPSO). The PC can be incorporated into any PSO variant or hybrid without impacting the parameter settings, constraints, and penalty approaches of the respective algorithms. A case study involving 2D reinforced concrete frames was conducted to compare the performance of the ordinary PSO algorithm with the PCPSO. The results clearly demonstrate that the introduction of the PC leads to a significant cost reduction when compared to PSO with an inertia damping factor. Additionally, the PCPSO algorithm exhibits accelerated convergence. Furthermore, to alleviate the computational burden associated with structural analysis at each iteration, a reanalysis approach called Combined Approximations (CA) is mathematically formulated and implemented.

1. Introduction and State of the Art

Structural optimization problems, such as those involving reinforced concrete (RC), are inherently challenging due to their properties. These problems exhibit various characteristics that contribute to their complexity, including multi-objective optimization, multiple variables, complex constraints, and large search spaces [1].
Nature-inspired algorithms have experienced a surge in popularity in recent years for tackling optimization problems in structural engineering. Genetic Algorithm [2], Ant Colony Optimization [3], Particle Swarm Optimization (PSO) [4], Evolutionary Optimization [5], and Simulated Annealing [6] are some popular algorithms to be mentioned. Additional works can also be found in Refs. [7,8,9,10].
The optimization of RC structures has been approached by using various algorithms, each with its own advantages and drawbacks. Among these algorithms, Particle Swarm Optimization (PSO) has gained recognition for its simplicity and ease of implementation [11,12,13,14].
Literature testifies that there are plenty of optimization works on truss [15,16,17,18] and steel-frame structures [19,20,21,22] while the RC structures are not as widely dealt with [23]. In this regard, the minimum cost design of concrete slabs using Particle Swarm Optimization with time-varying acceleration coefficients [24], design optimization of reinforced concrete beams [25], evaluation of enhanced particle swarm techniques for the design of RC structural elements [26], and the optimum design of 3D reinforced concrete frames using Decision Making PSO algorithm [27] can be mentioned.
While PSO offers several advantages, it is not without limitations. One drawback of PSO is the potential for premature convergence, where the algorithm may converge to a suboptimal solution before reaching the global optimum. Additionally, PSO can be susceptible to becoming trapped in local optima, failing to explore the entire search space effectively [28,29]. Studies have been conducted to overcome such drawbacks by developing PSO variants [30,31,32] and hybrids [33,34,35,36].
It is however customary to initialize and to update the positions of PSO particles in a randomly uniform distributed manner [37,38]. In PSO, its variants, hybrids, and initial positions of the design variables are typically randomized, as well as in other optimization algorithms. This approach assumes that either all design variables are of the same type or that they have equal contributions in influencing the overall optimization process. The entire population is subjected to this randomization process, and subsequent iterations are carried out accordingly.
However, such an approach is not accurate when it comes to structural optimization, particularly in the case of RC structures. For instance, the depths of cross-sections, which act as arm length, have a much greater influence on sectional capacity compared to the widths. Furthermore, this random initialization approach does not guarantee the generation of reasonable combinations of positions for the variables involved, potentially leading to a delay in achieving true convergence and optimality.
In this study, a priority concept named Priority Criteria (PC) is introduced and integrated into the main PSO velocity updater. The aim is to incorporate criteria-based priority throughout the RC structural members and variables involved in the optimization problem. PSO will thus be equipped with the ability to purposely allocate positions of particles with the help of priority criteria so as to develop a PSO augmentation named Priority Criteria Particle Swarm Optimization (PCPSO). This introduces reasonable rearrangement of the randomly generated positions of the particles.
In the case of the three considered case study frames, the newly formulated PCPSO resulted in a minimum cost saving of 6.5% per frame. The convergence graphs corresponding to the optimization process also demonstrated accelerated convergence. Additionally, the study implemented a combined approximations method of reanalysis to avoid reliance on software-based structural analysis, instead utilizing mathematical formulations.
The rest of this article is organized into three main sections. The first section deals with why priority is required, the priority criteria formulation, defining an objective function, and setting constraints accompanied by a flowchart of the proposed PCPSO algorithm. In the second section, the structural analysis approach is discussed and it is also supported by a flowchart describing the main steps throughout the analysis. Thirdly, a case study is conducted to evaluate and compare the performance of the newly developed augmented PCPSO with the standard PSO (without augmentation). The results of the case study are presented and discussed in this section as well.

2. Study Approach

In this section, we will describe how we approached [39,40] our research problem. While conducting this research, we initially examined several nature-inspired optimization algorithms, including their variants and hybrids. Our focus was also on the initialization approach they employed. The most commonly used type of initialization is uniformly distributed random allocation [41,42]. Positions are randomly generated with a uniform distribution and then allocated randomly to design variables. Due to the varied effect of design variables on the cross-sectional capacity of RC structures, it is reasonable to develop priority criteria as a comparable initialization approach.
We formulated priority criteria (PC) for frame-forming structural members, specifically beams and columns. Subsequently, we designed the incorporation of PC into the selected Particle Swarm Optimization (PSO) algorithm. Additionally, we developed a comprehensive flow chart outlining the proposed method. Objective functions were formulated, along with their respective constraints.
Given that structural analysis requires computational software such as SAP2000, and optimization inherently involves iteration, we discuss these approaches separately. After extracting the relevant inputs and outputs from SAP2000, v24, we utilized a reanalysis approach called Combined Approximations (CA). This approach fully replaces the SAP2000 computations with Matlab 2021a, providing a simpler iterative approach.
Finally, we conducted a case study to compare and examine the performance of the developed approach. The following steps summarize our approach.
  • Discussing the need for priority criteria (PC) and PC formulation;
  • Integrating PC to basic PSO formulation;
  • Defining objective functions, constraints, and penalty function;
  • Formulation of procedure and approach for the SAP 2000, v24 structural analysis, and Matlab 2021a computation, and writing several Matlab functions and scripts;
  • Conducting case study for comparison and verification.

3. Priority Criteria (PC) and Priority Criteria PSO (PCPSO)

3.1. The Need for Priority

Typically, in PSO, the initialization process involves assigning uniformly generated random values to the design variables of interest [43]. This type of initialization can be beneficial for problems where the variables have similar impacts on the objective function or are not strongly interdependent. It is also applicable to cases where the members can be assumed to have an equal distribution of variables and where the position of each member within the problem system does not significantly influence the optimization process.
In the context of Reinforced Concrete (RC) structures, design variables exhibit significant interdependencies, and it is crucial to consider that not all design variables impact the objective function equally. For instance, when determining the moment capacity of structural members, the depth of cross-sections plays a more substantial role compared to the widths. This is because the effective depth acts as the arm length, affecting the structural capacity. Therefore, it is essential to account for these dependencies and variable contributions in RC structural optimization problems.
Furthermore, when using randomization alone, the probability of obtaining reasonably allocated values of design variables among structural members of the same type remains low. Moreover, this approach necessitates a larger number of iterations, consequently consuming significant time and effort.
Therefore, a systematic allocation of the randomly generated values to member variables is necessary for such tasks. The criteria developed in this study are derived from the specific characteristics of the structures, including the assigned loading, length, and position of each type of member within the structure.
In the PCPSO algorithm, replacement is made on the velocity updater by using a priority parameter. The objective of incorporating the priority criteria in the PCPSO algorithm is to enhance the performance of PSO by intelligently allocating the randomly generated values of design variables to their respective structural members. This modification aims to improve the optimization process for reinforced concrete structures. The priority-based allocation of design variables to their corresponding members is performed after every iteration throughout the entire optimization process. This ensures that the allocation is continuously adjusted based on the priority criteria, leading to improved optimization outcomes for the reinforced concrete structures.
As a result, this approach leads to properly assigned combinations of values for design variables and structural members in each iteration and population. This facilitates convergence and enables the attainment of optimal results in the optimization process.
The priority criteria (PC) can be easily incorporated into various PSO variants and hybrids without the need to modify all settings of the existing algorithm. Its main focus is on generating a criteria-based distribution of the randomly generated variables prior to deploying the algorithm. This allows for the seamless integration of the PCPSO approach into different PSO algorithms without significant changes to their overall structure and configuration.

3.2. Priority Criteria (PC) Formulation

The priority criteria developed can be categorized as beam priority criteria and column priority criteria. Two criteria are formulated for each category. All the considered criteria play the main role in governing the cost of structural members.
For the sake of practical workability, the sizes of the sections are usually rounded up to their following higher five sizes (in centimeters). The next formulation assumes the workable size difference among sections as f w , given in mm.
Beam Criterion 1: For the beam design, two main criteria are taken into account. The first criterion dictates that, among the randomly generated cross-sectional values, a greater cross-sectional depth should be assigned to the member experiencing a higher moment. To fulfill this requirement, two parameters are taken into account: the span length and the external loading.
R b , i = W b , i L b , i 2 , i = 1 , , n b ,
where R b , i is rank of beam i for priority, while W b , i is the externally applied load on beam i, L b , i is the length of beam i and n b is the number of beams. A greater depth will be assigned to a beam member with a higher rank R b , i .
If the initial analysis is conducted using analysis software such as SAP2000 and the loading remains relatively unchanged during the iteration, the ranking R b , i can be easily computed without considering the length and loading parameters.
Beam Criterion 2: The second criterion states that the two beam members with design moments M b , i and M b , j , and if the former is larger than the latter, shall not be assigned with the same depth D b , i if the condition below is satisfied. The beam with smaller moment M b , j shall be assigned with a depth of at least f w mm less than the depth of the beam with a larger moment D b , i as far as its depth D b , j is not the least possible according to the size bound limits.
From the difference of the effective depths of the respective beams a b s ( d b , i d b , j ) f w , the following criterion is formulated. It is assumed that the concrete cover is the same and the reinforcement to section area ratio ρ is the maximum possible, the balanced ratio ρ b ( ρ b = 0.75 ρ ).
M b , d i f f > f w 0.8 f c d b b , i ρ m ( 1 0.4 ρ m ) , f o r M b , d i f f = M b , i M b , j ,
where, M b , d i f f is the beam moment difference as given above, b b , i is the width of M b , i , f c d is the design strength of concrete, and m is the ratio of the bar to concrete design strengths divided by 0.8 .
Column Criterion 1: Similarly, columns are evaluated using two main criteria. The first criterion categorizes columns based on their position within the frame as interior, intermediate, and outer. In the case of 2D reinforced concrete (RC) columns, the outer columns are located at the edges, while half of the frame length is designated as interior and the remaining portion as intermediate. Consequently, the column priority rank is established as interior, intermediate, and outer, respectively.
R c , i = C i n t , C i m , C o u t ,
where, R C , i is the rank of column i, C i n t , C i m , and C o u t respectively, represent the interior, intermediate, and outer columns.
Figure 1 shows the classification of six columns as interior, intermediate, and outer based on their locations. The grouping is achieved by dividing the length of the column axis, L x , into quarters. The two end columns are always classified as outer columns. Columns within the subsequent quarter length, L x / 4 , from both ends are categorized as intermediate. The most interior column, located at L x / 2 , is designated as the interior column.
Similar to the ranking criterion for beams, this criterion can also easily be computed if the initial analysis is performed using analysis software such as SAP2000 and if the loading remains relatively unchanged during the iteration.
Column Criterion 2: Assuming a balanced reinforcement to section area ratio ρ b , the priority for uniaxial columns shall be determined based on an equal contribution from the column axial load and moment.
From the difference of the effective depths of the respective columns a b s ( d c , i d c , j ) f w , two column members with axial design force P c , i and P c , j , in which P c , i is the largest and shall not be assigned to the same depth D c , i if the condition below is satisfied.
P c , d i f f > f w b c , i f c d 1 ρ 1 f y d f c d , f o r P c , d i f f = P c , i P c , j .
where, P c , d i f f is the column axial force difference, f y d is the design strength of the reinforcement, and f c d is the design strength of concrete, P c , d i f f in N.
For both beam and column cases, the members that are grouped together and assigned the same depth D c , i will also receive the same width b c , i .
The mathematical model for PCPSO is given below.
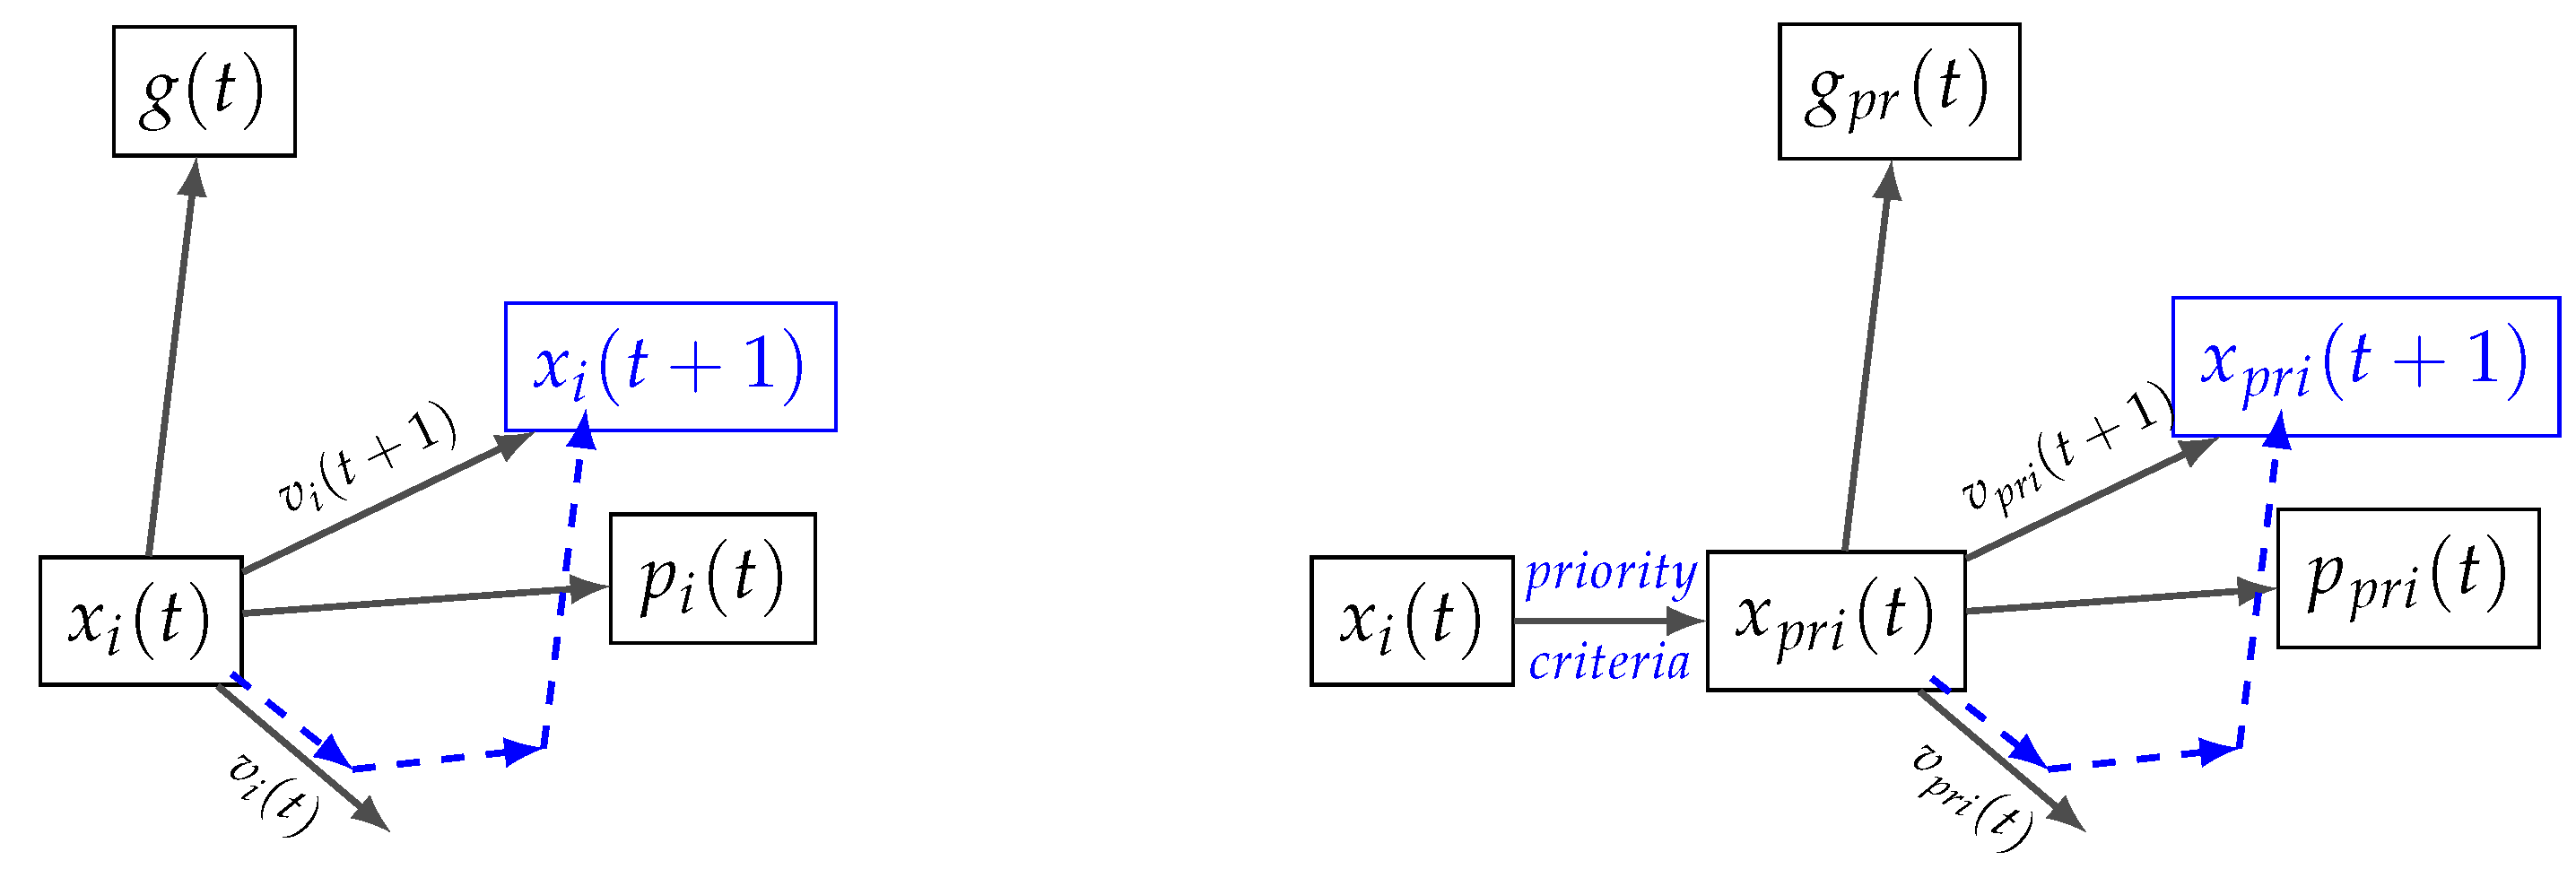
v p r ( t + 1 ) = w v p r ( t ) + c 1 r 1 ( p p r i ( t ) x p r i ( t ) ) + c 2 r 2 ( g p r ( t ) x p r i ( t ) ) , x p r i ( t + 1 ) = x p r i ( t ) + v p r ( t + 1 ) ,
where v p r ( t + 1 ) is the updated priority velocity for the particle, v p r ( t ) is the initial priority velocity, p p r i ( t ) is the priority personal best position, g p r ( t ) is the the global best position, x p r i ( t + 1 ) is the updated priority position, x p r i ( t ) is the priority initial position, w , c 1 and c 2 represent the inertia weight, local acceleration, and social acceleration, respectively, and r 1 and r 2 are the random numbers generated between 0 and 1.
Figure 2 above shows the graphic representations of PSO and its newly formed augmentation PCPSO. The PSO starts from a randomly located swarm of position x i while the PCPSO applies priority criteria on x i to generate x p r i ( t ) . Their respective velocities are also updated from these two different initialization approaches.

3.3. Objective Function Formulation

The objective function for cost minimization optimization is represented as follows.
m i n f ( x ) , f o r g ( x ) 0 , x L x x U , a n d f ( x ) = C b + C c ,
where x is the design variable, f ( x ) is the objective function, g ( x ) is the constraint function, x L and x U are the lower and upper bounds of the design variable, C b is the cost of beams, and C c is the cost of columns.
The cost of the beam and the cost of the column are expressed in terms of the respective concrete volume, reinforcement weight, and formwork area, multiplied by their respective unit weights.
C b = C c V c b + C r W r b + C f A f b ,
where C b is the cost of beams, C c , C r , C f is the cost of concrete per cubic meter, cost of reinforcement per kilogram, and the cost of formwork per square meter, respectively. V c b , W r b , and A f b respectively represent the volume of concrete of beams in a cubic meter, the weight of reinforcement of beams in kilograms, and the area of formwork of beams per square meter.
C c = C c V c c + C r W r c + C f A f c ,
where, C c is the cost of columns, V c c , W r c and A f c , respectively represent the volume of concrete of columns in a cubic meter, weight of reinforcement of columns in kilograms, and area of formwork of columns per square meter.
The required area of reinforcement in a given reinforced concrete cross-section can be computed using the following formula.
A s t = ρ b d ,
where A s t is an area of reinforcement, ρ is the reinforcement to concrete area ratio, which is the effective depth considered, b is the width, and d is the effective depth of the respective structural members.
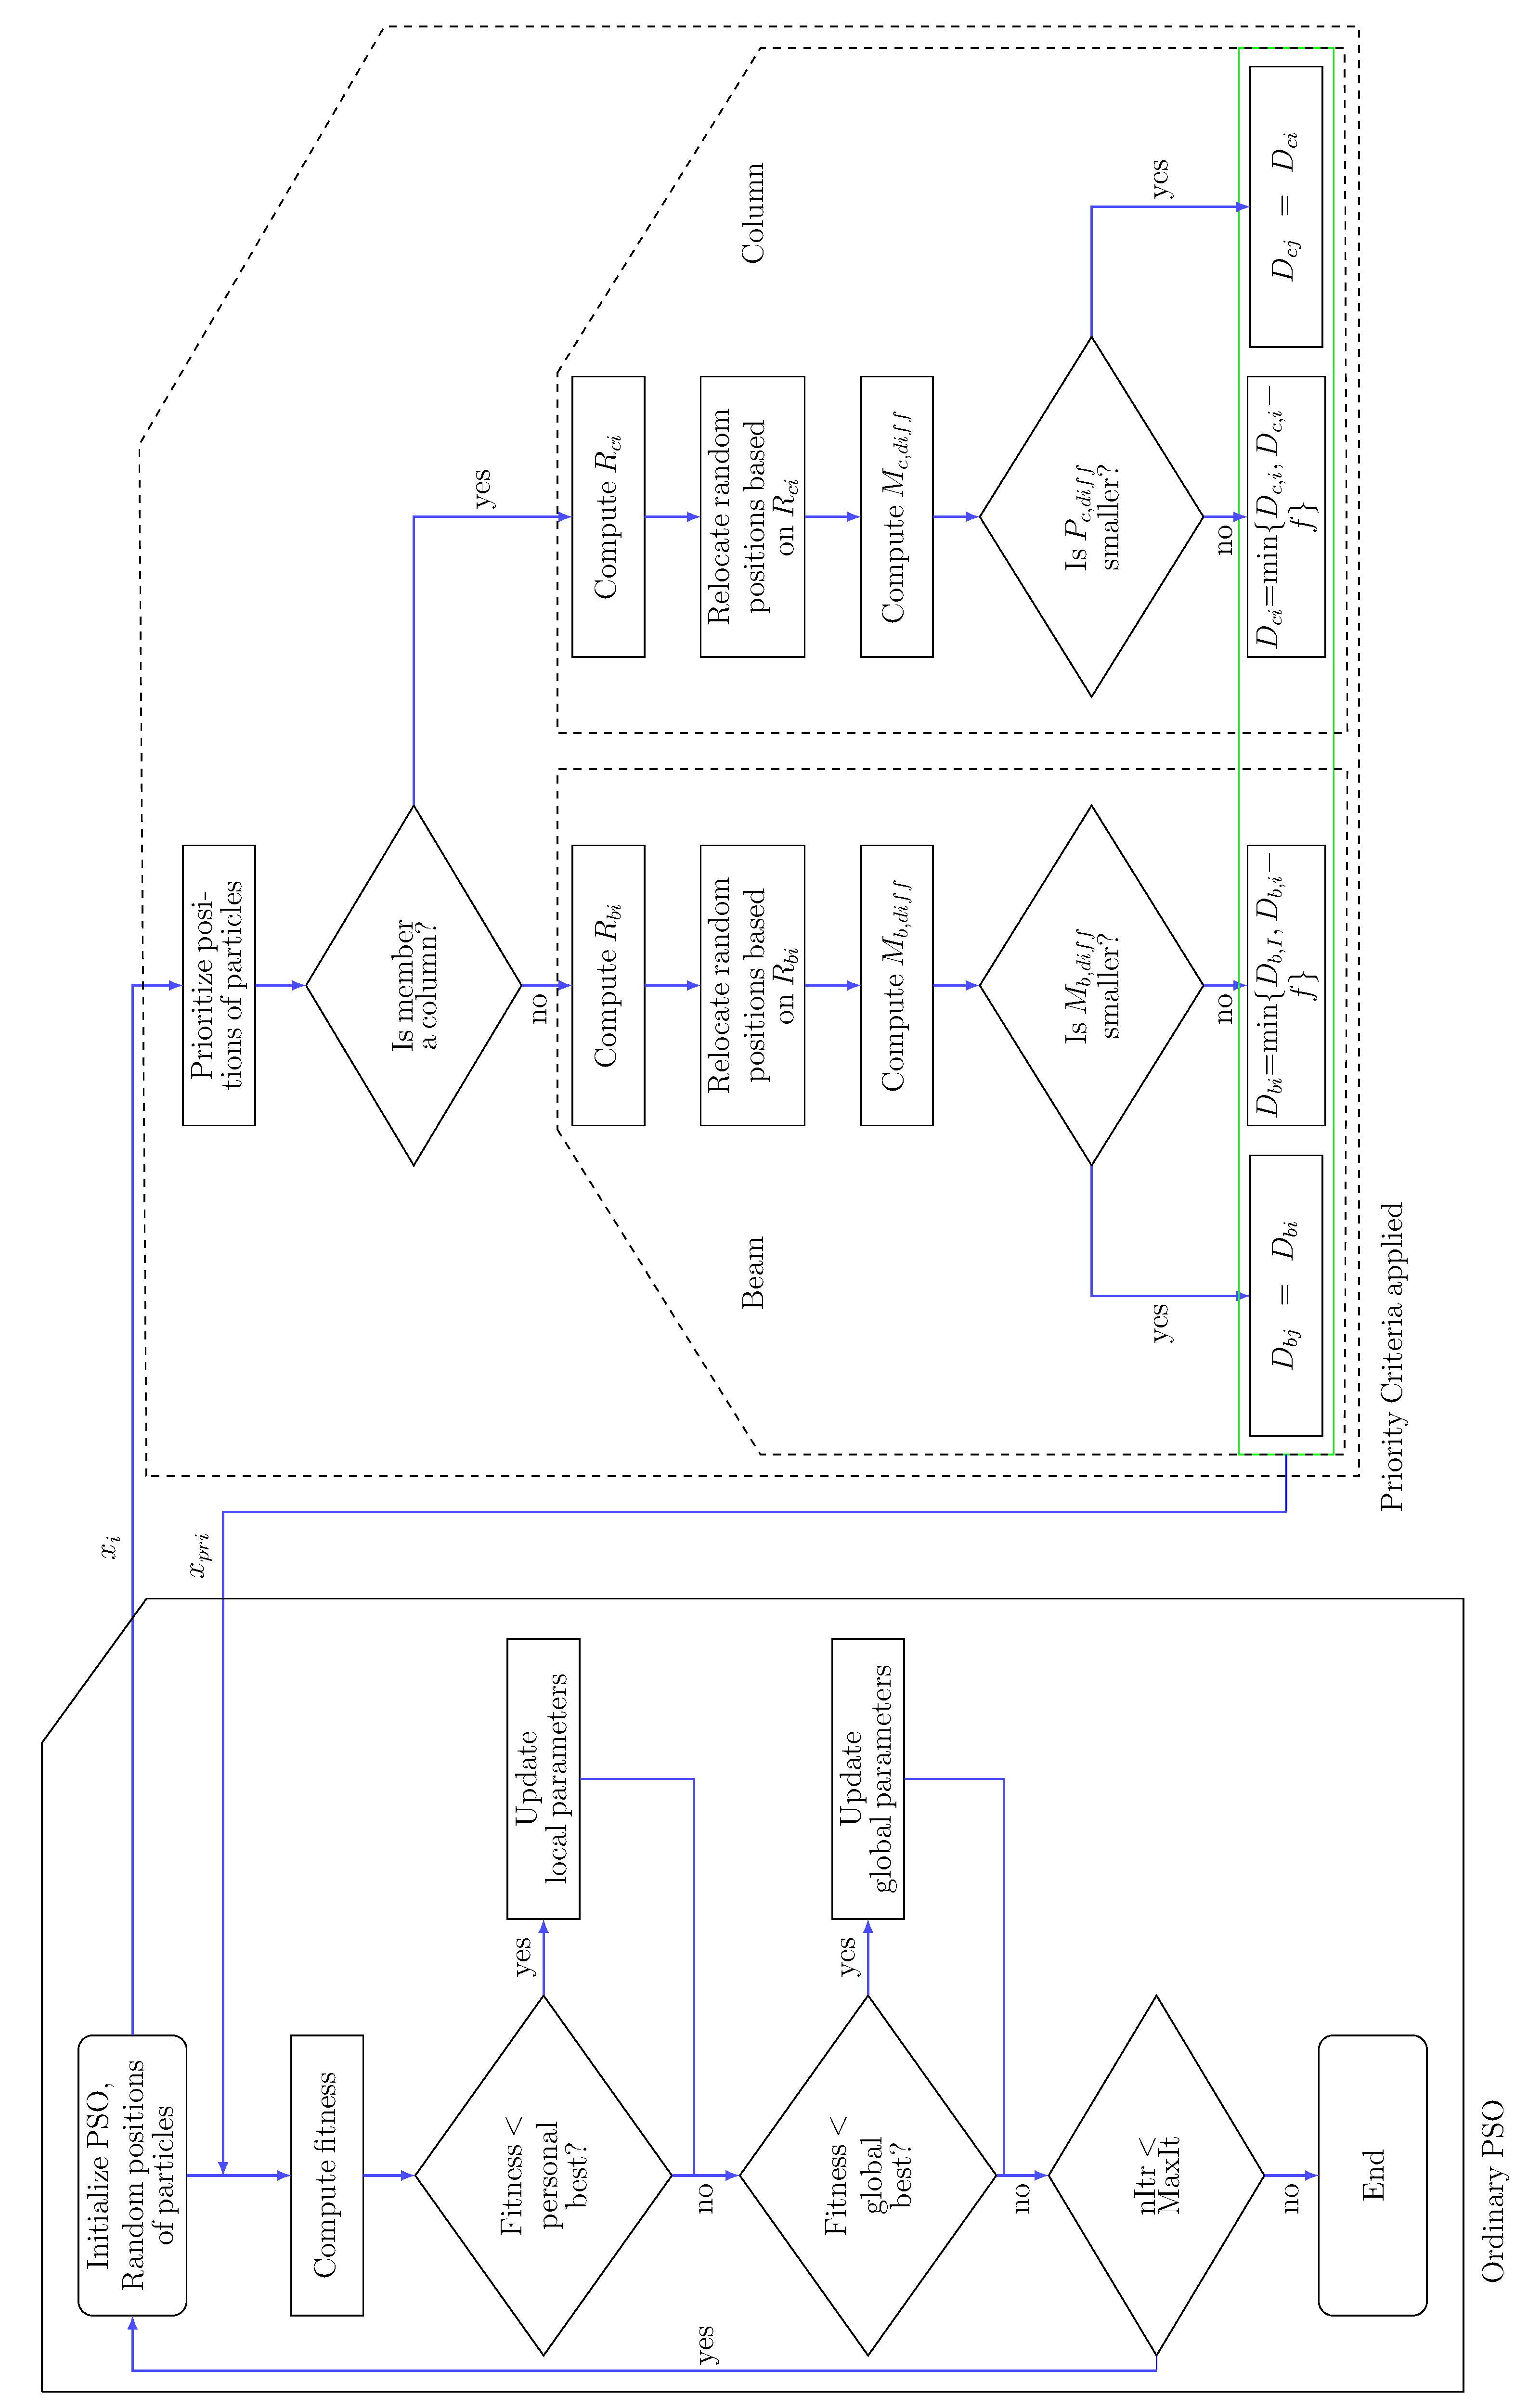
Figure 3 shows the flow chart for the proposed augmentation, PCPSO. The left part is the ordinary PSO, while in the right part the priority criteria for both beams and columns are included.
Once random positions are generated to the defined design variables, they are ranked, compared, and then allocated based on the priority criteria. As a result, the design variables assume the newly reallocated position. The fitness comparisons for both the local and global bests, as well as their corresponding updates, are executed with consideration of these priority criteria. These priority criteria can be easily incorporated into any PSO-based algorithms, thereby enhancing their performance. Due to the fundamental concept that the priority criteria are derived (i.e., allocating values of design variables to their corresponding structural members based on conceptual criteria than random), the advantage of this approach persists.

3.4. Setting Constraints

Constraints are formulated below based on the Euro Code [44] and from a practical point of view. All constraints are normalized to minimize the differences in the scale among them, which typically leads the objective function towards the dominant constraint. This normalization also helps simplify the computation load [27,45]. Every internal response must be less than or equal to the factored resistance of the material used. The constraints are grouped as beam and column constraints.

3.4.1. Beam Constraints

Beam criterion, shear, moment, and reinforcement
The length of a beam shall not be less than three times its depth.
g b , 1 = 3 D b L b 1 0 ,
where g b , 1 stands for the beam constraint 1, L b is the beam length, and D b is the beam depth.
The moment shall not be larger than the factored cross-sectional moment resistance.
g b , 2 = M b γ m M b , r e s 1 0 ,
where M b is the maximum of the span and support moments, γ m is the moment reduction factor, and M b , r e s is the moment amount that can be resisted by the given cross-section.
The design shear across any cross-section shall not exceed the factored shear resistance.
g b , 3 = V b γ v V b , r e s 1 0 ,
where, V b is the design shear, γ v is the shear reduction factor, and V b , r e s is the shear amount that can be resisted by the given cross-section.
The longitudinal reinforcement area provided shall not be less than the minimum area.
g b , 4 = A s b , m i n A s b 1 0 ,
where A s b , m i n is the minimum area of reinforcement that shall be provided and A s b is the computed area of reinforcement.
Longitudinal reinforcement shall not be greater than the code-provided maximum area.
g b , 5 = A s b A s b , m a x 1 0 ,
where A s b is the computed area of reinforcement and A s b , m a x is the maximum area of reinforcement that can be provided.
Longitudinal spacing for shear reinforcement shall not be greater than the allowed maximum spacing according to the code.
g b , 6 = S b l S b l , m a x 1 0 ,
where S b l is the calculated shear reinforcement spacing longitudinally and S b l , m a x is the maximum allowed spacing of shear reinforcement in the longitudinal direction of the member.
Minimum shear reinforcement shall be provided according to the code that is given in terms of minimum area ratio where shear reinforcement is not required.
g b , 7 = A v b , m i n A v b 1 0 ,
where A v b , m i n is the minimum area of shear reinforcement and A v b is the computed design shear.
Deflection, section, and crack
Deflection due to quasi-permanent loads shall not exceed the code provided.
g b , 8 = δ b δ b , m a x 1 0 ,
where δ b is the computed beam deflection and δ b , m a x is the maximum allowed beam deflection.
Width and height of a beam, each shall not be less than the respective minimum values.
g b , 9 = b b , m i n b b 1 0 ,
g b , 10 = D b , m i n D b 1 0 ,
where, b b and D b are the computed width and depth of a beam and b b , m i n and D b , m i n are the minimum width and depth that shall be provided.
In order to control the crack width, the tensile reinforcement shall not be less than the minimum crack controlling value.
g b , 11 = A s b , m i n A s b 1 0 ,
where A s b , m i n is the minimum reinforcement area to be provided to a beam to control the crack width and A s b is the computed area of beam reinforcement.

3.4.2. Column Constraints

Column criteria, axial, shear, moment, and reinforcement
The depth D c shall not exceed four times its width b c . The length L c of the column shall not be less than three times the depth.
g c , 1 = D c 4 b c 1 0 .
g c , 2 = 3 D c L c 1 0 .
where, g c , 1 represents the column constraint 1.
The computed axial compression P c shall not exceed the factored axial resistance P c , r e s of the cross-section with an axial compression reduction factor of γ p .
g c , 3 = P c γ p P c , r e s 1 0 .
Computed moments M c shall not exceed factored cross-sectional moment resistance M c , r e s moment resistance of the column cross-section γ m .
g c , 4 = M c γ m M c , r e s 1 0 .
Shear V c shall not be greater than the factored cross-sectional shear resistance V c , r e s for γ v the shear reduction factor.
g c , 5 = V c γ v V c , r e s 1 0 .
Area A s c , l for longitudinal reinforcement shall not be less than the minimum code provision A s c , m i n . Additionally, an area for longitudinal reinforcement shall not be greater than the maximum code provision A s c , m a x .
g c , 6 = A s c , m i n A s c , l 1 0 .
g c , 7 = A s c , l / A s c , m a x 1 0 .
The minimum diameter φ for longitudinal reinforcement shall not be less than 8 mm.
g c , 10 = 8 φ 1 0 .
The diameter for shear reinforcement φ v c shall not be less than the minimum value provided in code, φ v c , m i n . Additionally, the diameter for shear reinforcement shall not be greater than the maximum value provided in code, φ v c , m a x .
g c , 11 = φ v c , m i n φ v c 1 0 .
g c , 12 = φ v c φ v c , m a x 1 0 .
Slenderness and section
In order to avoid the second-order effect for simplicity, the slenderness ratio for sway frames λ s shall not exceed the slenderness limit λ s , a l l .
g c , 8 = λ s λ s , a l l 1 0 .
The slenderness ratio for non-sway frames λ n s shall not exceed the slenderness limits λ s n , a l l to avoid the second order effect.
g c , 9 = λ n s λ n s , a l l 1 0 .
The provided width b c of the cross-section shall not be less than minimum width b c , m i n specified in the code.
g c , 13 = b c , m i n b c 1 0 .

3.5. Constraint Handling

One of the most affecting factors in optimization is constraint handling. The better the handling approach, the better the optimization efficiency will be [46].
PSO itself is designed for solving unconstrained problems. However, to handle real-world constraints, a mechanism needs to be incorporated. One common approach is the penalty method, which transforms the constrained objective function into an unconstrained one by introducing penalties for constraint violations. Several penalty approaches have been developed and implemented, each with its own merits and limitations [46]. The suitability of penalty approaches can vary depending on the type of problem. In this paper, a quadratic penalty function is preferred, and an unconstrained objective function is formulated accordingly.
F ( x ) = f ( x ) + i = 1 n c i g i 2 ; c i = 0 , f o r g i 0 . ε , f o r g i > 0 .
where F ( x ) is the unconstrained objective function, f ( x ) is the constrained objective function, g i is the inequality constraint, n is the number of constraints, c i is the penalty factor, and ε is the allowed constraint limit. ε can be chosen to be 0.001 .

4. Analysis Approach

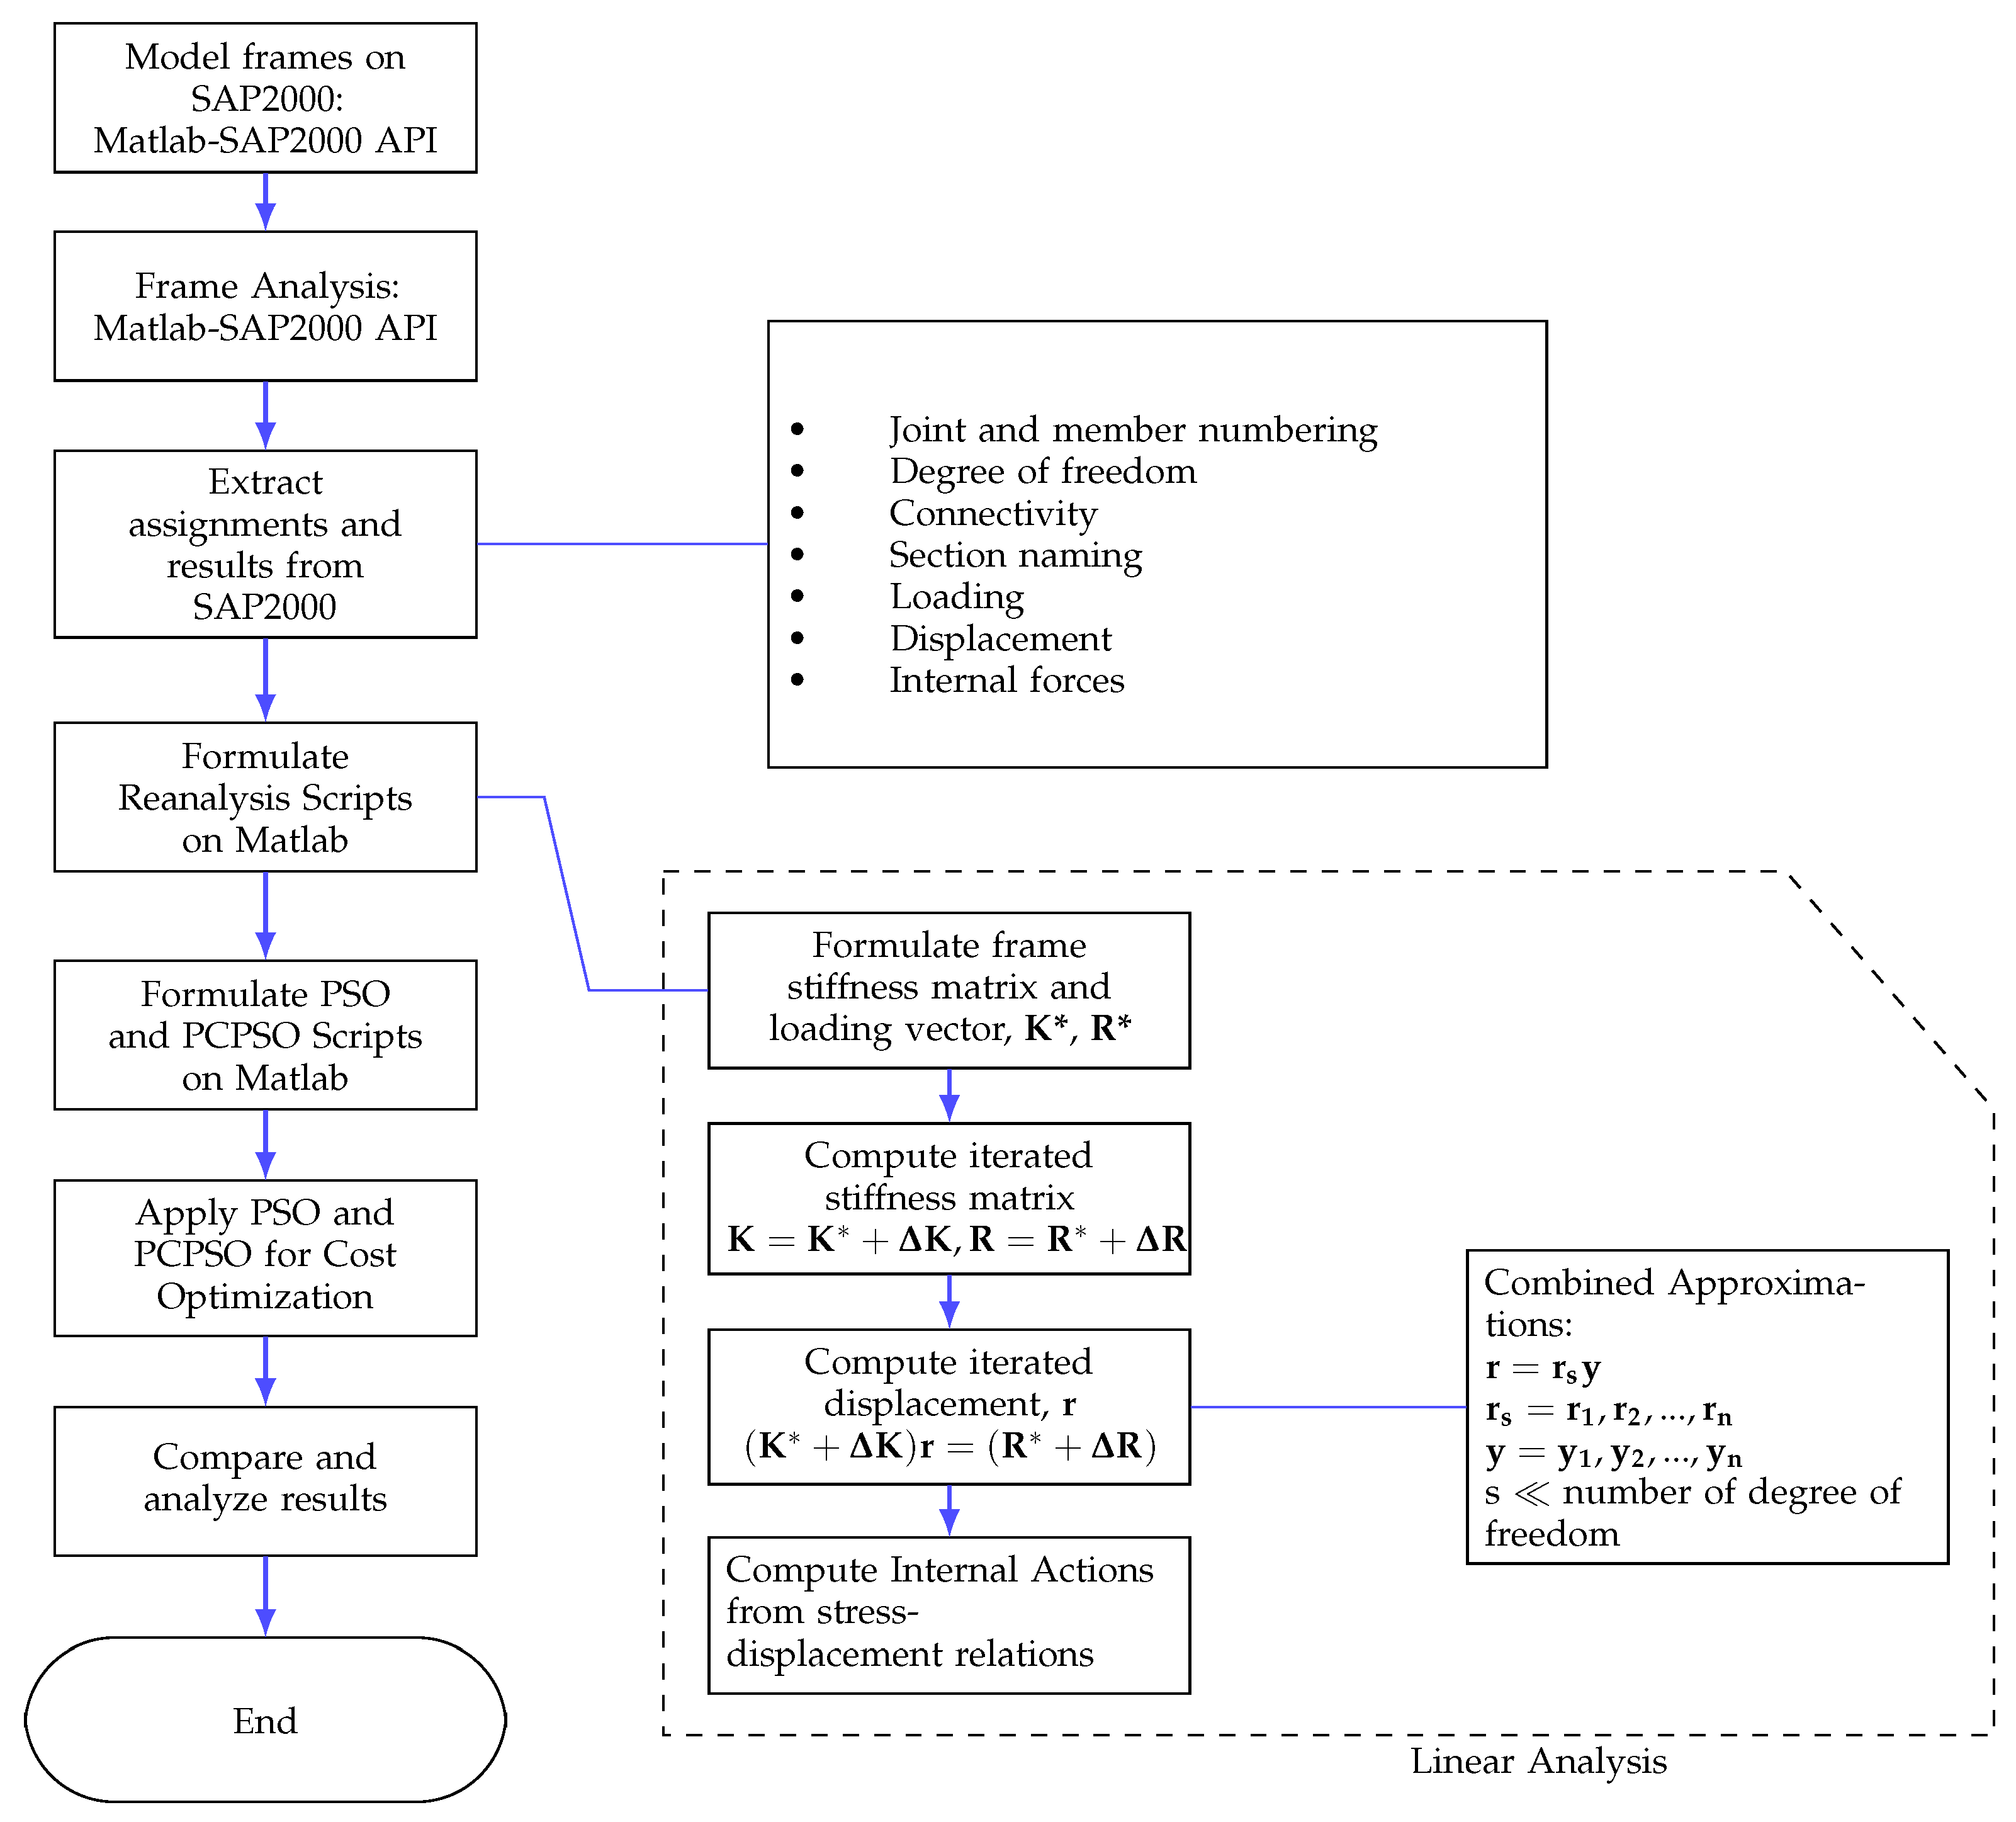
Firstly, framed structures are modeled, loaded, and analyzed using software such as SAP2000 to determine the design load combination. Subsequently, a Matlab script is developed to utilize the Matlab-SAP API.
Secondly, a re-analysis approach is implemented to effectively estimate further analysis without relying on software such as SAP2000. In this regard, the Combined Approximations (CA) method, developed by Kirsch [47], is utilized. Matlab scripts are then written to implement the CA method.
Next, multiple scripts and functions are developed to define the PSO and PCPSO algorithms, which are capable of handling any 2D RC frame optimization problem.
Finally, the cost minimization is implemented for the 2D frame cases at hand, and a comparison between the performance of PSO and PCPSO is conducted.
Combined Approximation method: After extracting relevant outputs, such as displacement, section naming, internal force, connectivity, loading, joint and frame numbering, and degree of freedom from the initial analysis, the mathematical reanalysis approach, known as the Combined Approximations method, is formulated and implemented using Matlab. This eliminates the need for structural analysis software in every iteration, making the process more efficient.
With the linear analysis approach, given a stiffness matrix K and a loading vector R from the initial analysis, for assumed changes in the stiffness matrix Δ K and loading vector Δ R , the modified stiffness matrix and load vector are given as K = K + Δ K and R = R + Δ R . Thus, the displacement vector r for the same structure that undergoes such changes is determined from ( K + Δ K ) r = ( R + R ) . The stresses can thus be determined from well-known stress-displacement relations [48].
With the help of the so-called combined approximation, the displacement vector of a new design can then be approximated by a linear combination of linearly independent basis vectors. r = r B y where: r B = r 1 , r 2 , . . . , r s and y = y 1 , y 2 , . . . , y s . Additionally, s is much smaller than the number of degrees of freedom. Figure 4 above shows the detailed procedure for the application of PSO and PCPSO.

5. Case Study

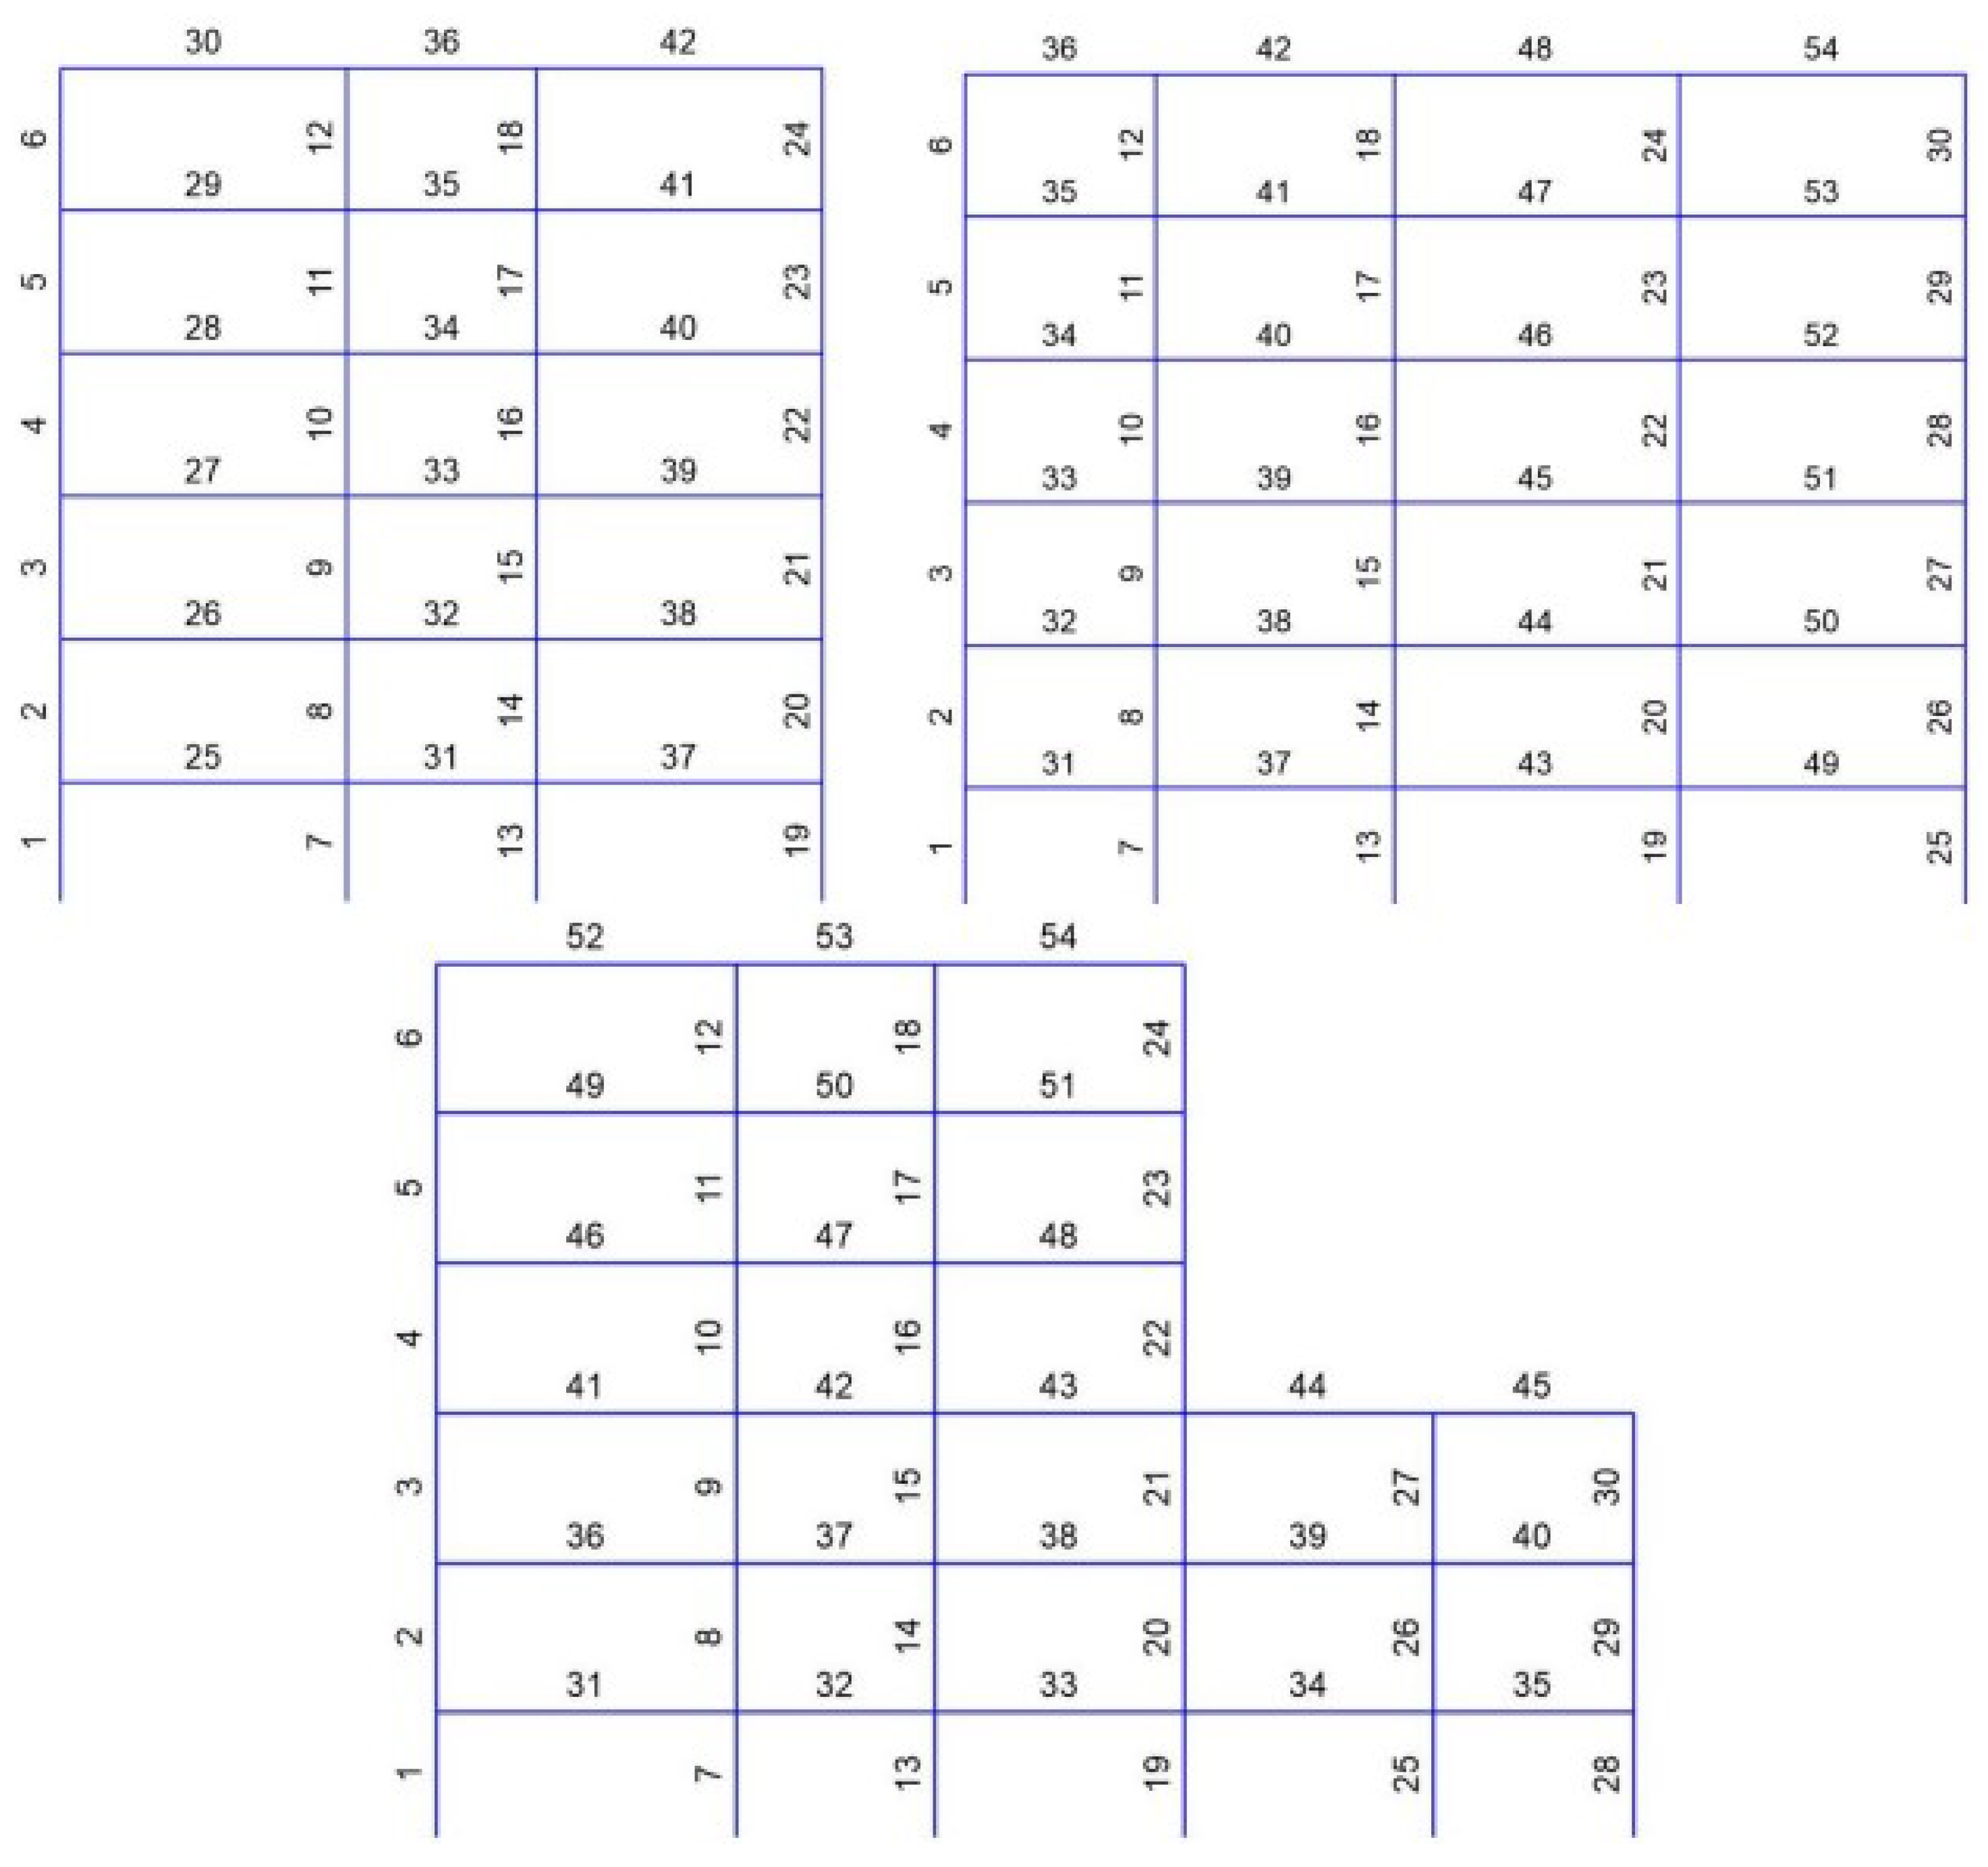
In this section, a case study is conducted to test and verify the performance of the Priority Criteria (PC) developed in Section 2. The PC is incorporated into the PSO algorithm, resulting in a modified version called PCPSO. The performance of PCPSO is then compared to the standard PSO algorithm without the inclusion of the PC. Six-story reinforced concrete frames with three, four, and five bays are investigated in the case study. The three-bay frame is symmetric, the four-bay frame has incrementally varying bay sizes, and the five-bay frame has randomly sized bays. In the five-bay frame, the two outermost columns extend only up to the third story. The frames are assumed to be external frames to a given 3D framing system.
In Figure 5, the spacing of columns from left to right for the three-bay frame is 6 m, 4 m, and 6 m. Whereas, the four-bay frame columns are spaced at 4 m, 5 m, 6 m, and 6 m. The five-bay frame in turn has 6 m, 4 m, 5 m, 5 m, and 4 m random column spacing. All story heights are set to 3 m, except for the foundation column levels, which have a height of 2.5 m. A fully fixed foundation is assumed during the modeling of each frame using SAP2000, version 24, for the initial analysis.
The three-bay frame is composed of 42 members, including 18 beams and 24 columns. The four-bay and five-bay frames each consist of 54 members, with 24 beams and 30 columns.
The design actions taken into consideration are the factored gravity loads. These loads include the loads transferred from square floor slabs assumed to be of size 6 m, partition walls resting on the beams, and self-weight. Variable loads are also considered and combined with the gravity loads for the design analysis (Table 1).
Values for variable actions and unit weights are read from [49]. Accordingly, the unit weight for concrete is 25 kNm 3 and the unit weight for reinforcing bar is 78 kNm 3 .
E d = γ G G k + γ Q Q k ,
where E d , G k , Q k are the design value, permanent actions, and variable actions, respectively. γ G and γ Q are their respective action factors.
Loads are combined according to Ref. [50]. The recommended action factors used in this case study are 1.35 for γ G and 1.5 γ Q .
C30/37 concrete and reinforcing bar of strength f y k 500 are used. Properties such as the design value for concrete modulus of elasticity E c d and thermal coefficient are computed and read, respectively, as 27.5 MPa and 10 5 K 1 [44]. Costs are computed considering concrete, reinforcement, and form-work with the respective unit rates taken as 130 €m 3 , 4 €kg 1 , and 20 €m 2 , respectively.
For each case, utilizing separate scripts and functions developed in Matlab 2021a, a complete analysis and optimization of the frames are performed. The cost minimization optimization is carried out using both PSO and PCPSO algorithms, and the resulting values are compared. The design variables for beam and column sections have a search space of [ 0.2 , 1 ] m.
The PSO parameters used for all the cases are: inertia weight w = 1 , inertia weight damping ratio w d a m p = 0.99 , local acceleration c 1 = 1.5 , global acceleration c 2 = 2.0 and the velocity limit, which is 10% of the difference of the maximum and minimum velocities. Every case undergoes 1000 iterations with 20 population sizes. Every case is also subjected to 5 runs in which the optimal run is preferred. A constraint penalty factor ε of value 10 3 is used. The convergence plots of both optimization types are computed for each case. It should be noted that the costs associated with foundation design are excluded from both the PSO and PCPSO cases. Since PSO-optimized internal responses (axial and moment) are relatively larger than the PCPSO optimized, excluding the foundation design for both optimization approaches makes the PCPSO more conservative.
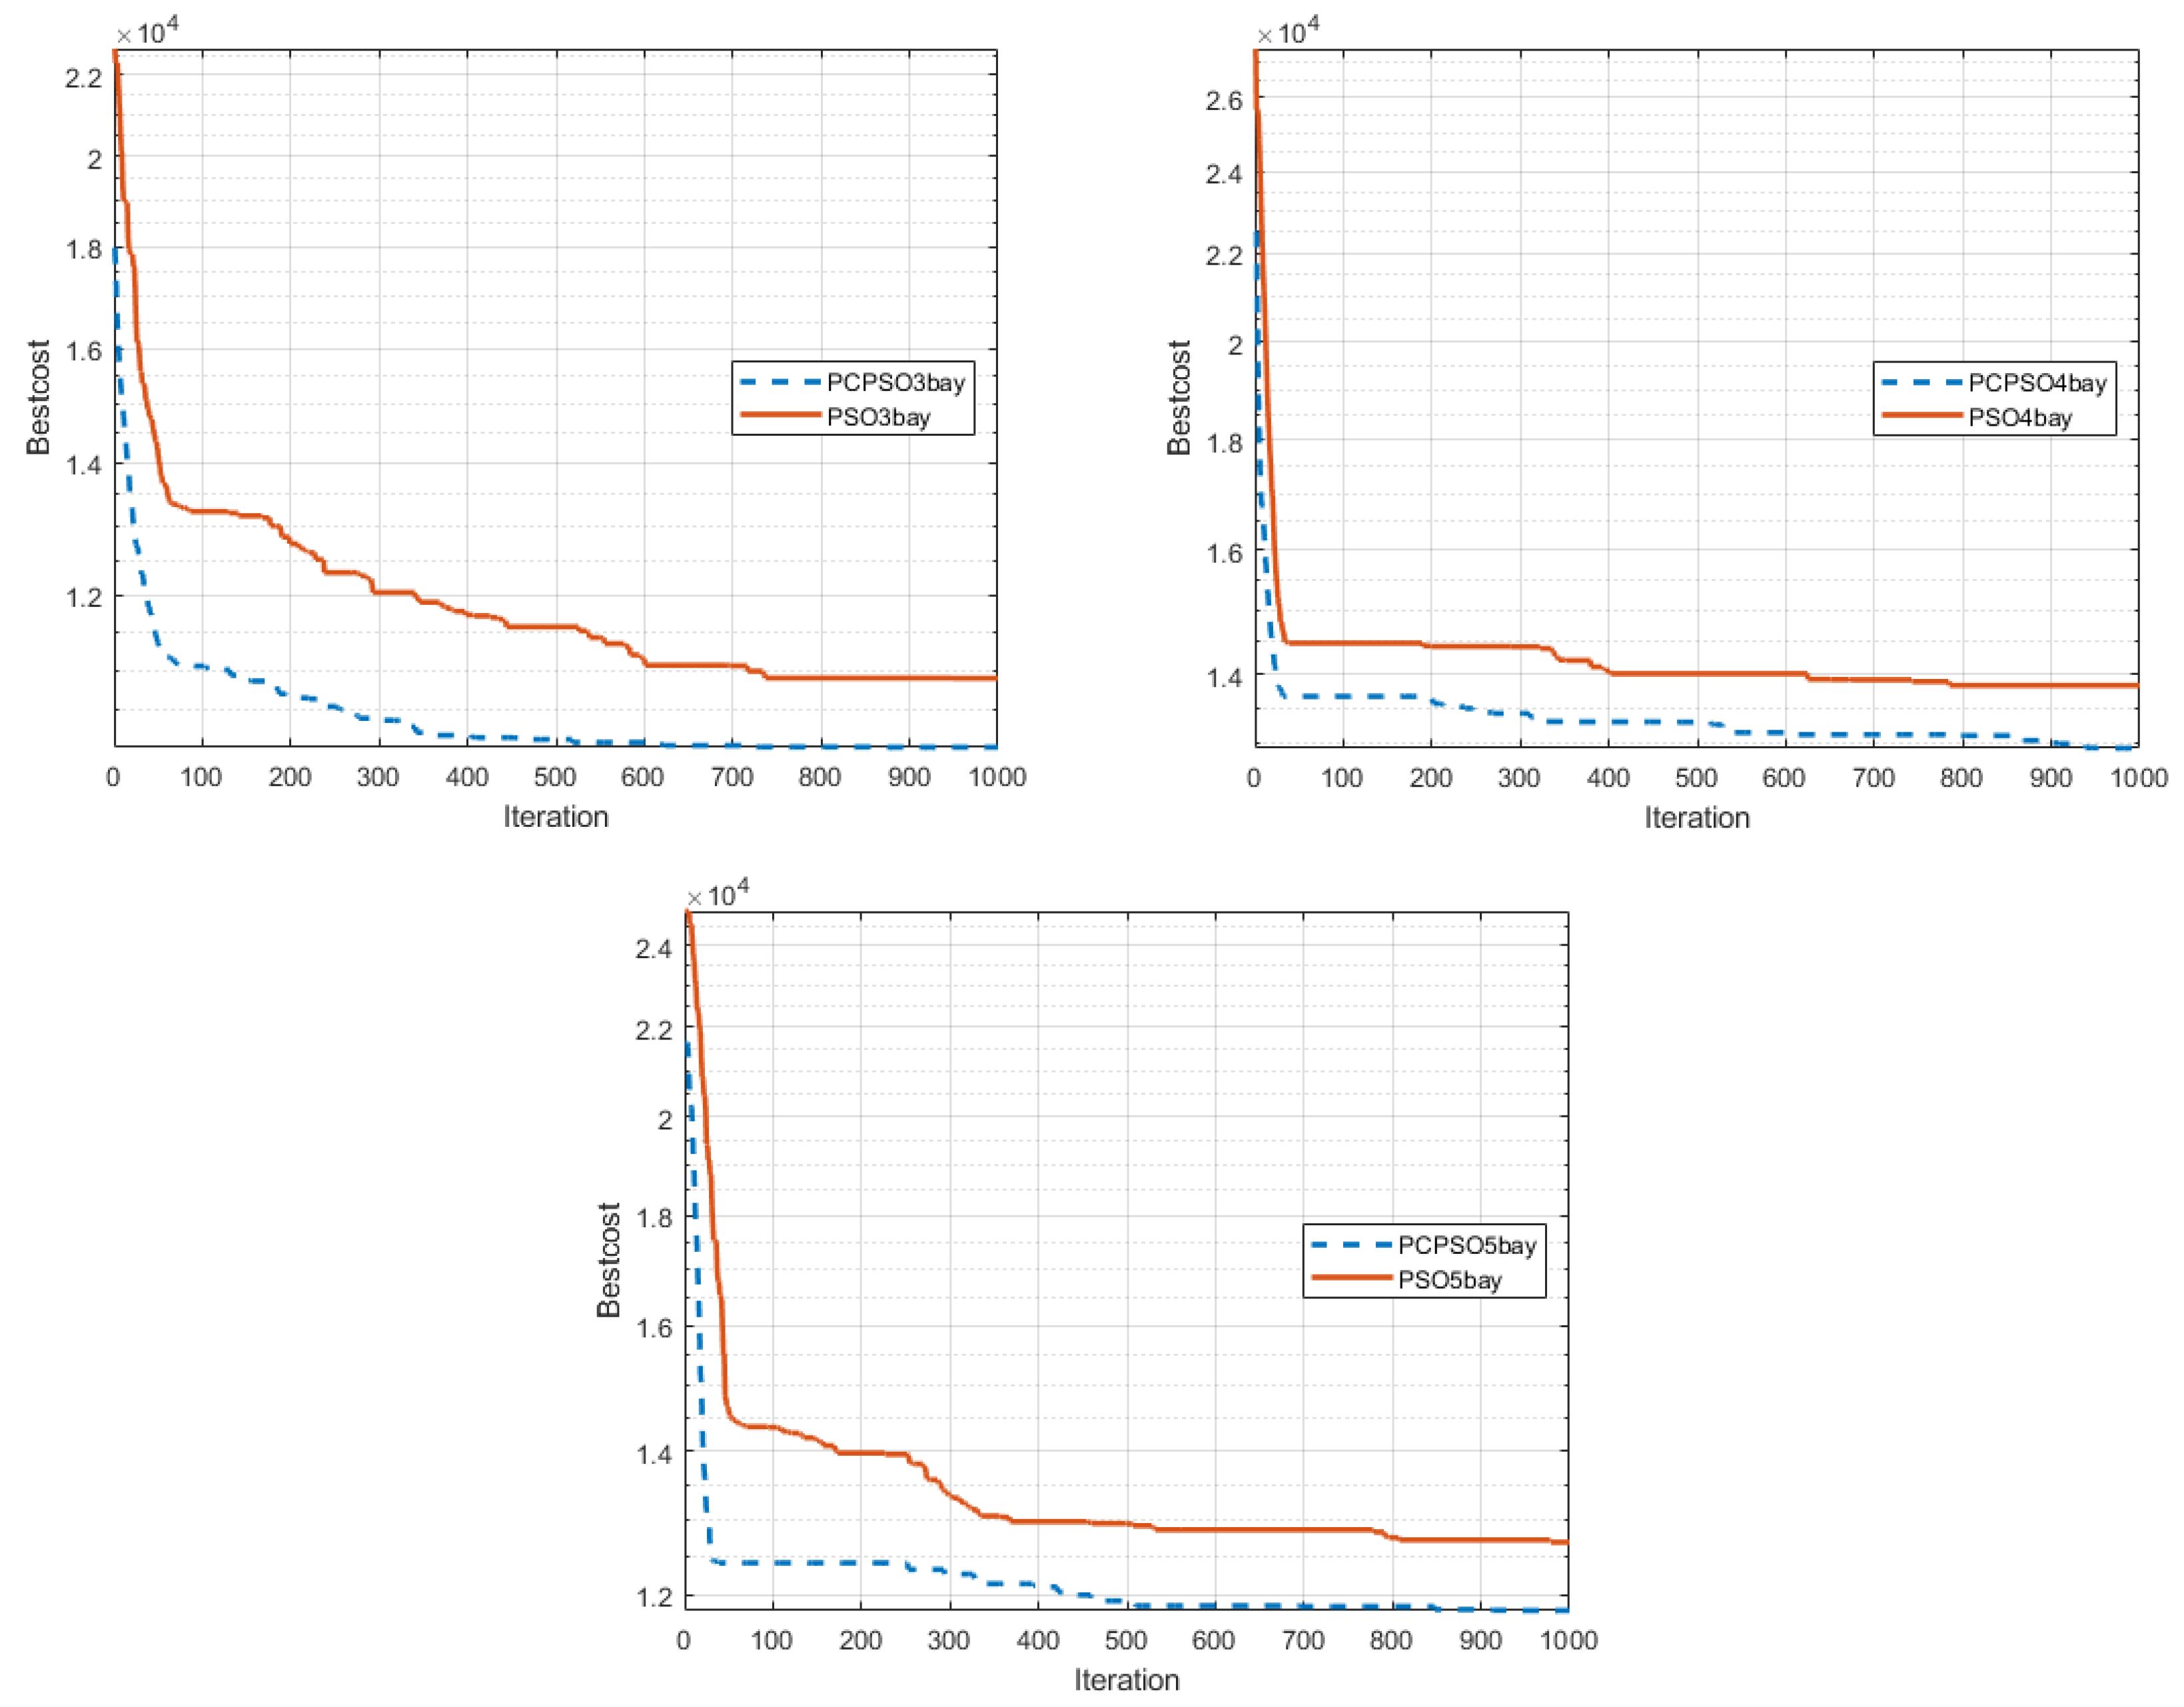
The results obtained from the case study clearly demonstrate that the priority-based algorithm developed in this paper outperforms the traditional optimization approaches in terms of both the initial assignment of design variable values and the overall minimum cost. Additionally, the convergence of the priority-based algorithm required a relatively smaller number of iterations, indicating its efficiency and effectiveness in optimizing the structural design of all three frames considered in the study.
The cost of the three, four, and five-bay frames computed for the first iteration in the case of PSO are above EUR 22,000, EUR 26,000, and EUR 25,000, respectively. Whereas, in the case of PCPSO, the initial results are much lower than that of PSO, being EUR 18,000, EUR 23,000, and EUR 21,000, respectively. This facilitates convergence towards better optimal values. After approximately half of the iterations, the cost gap widens, allowing the PCPSO algorithm to achieve the minimum cost faster than PSO (Figure 6).
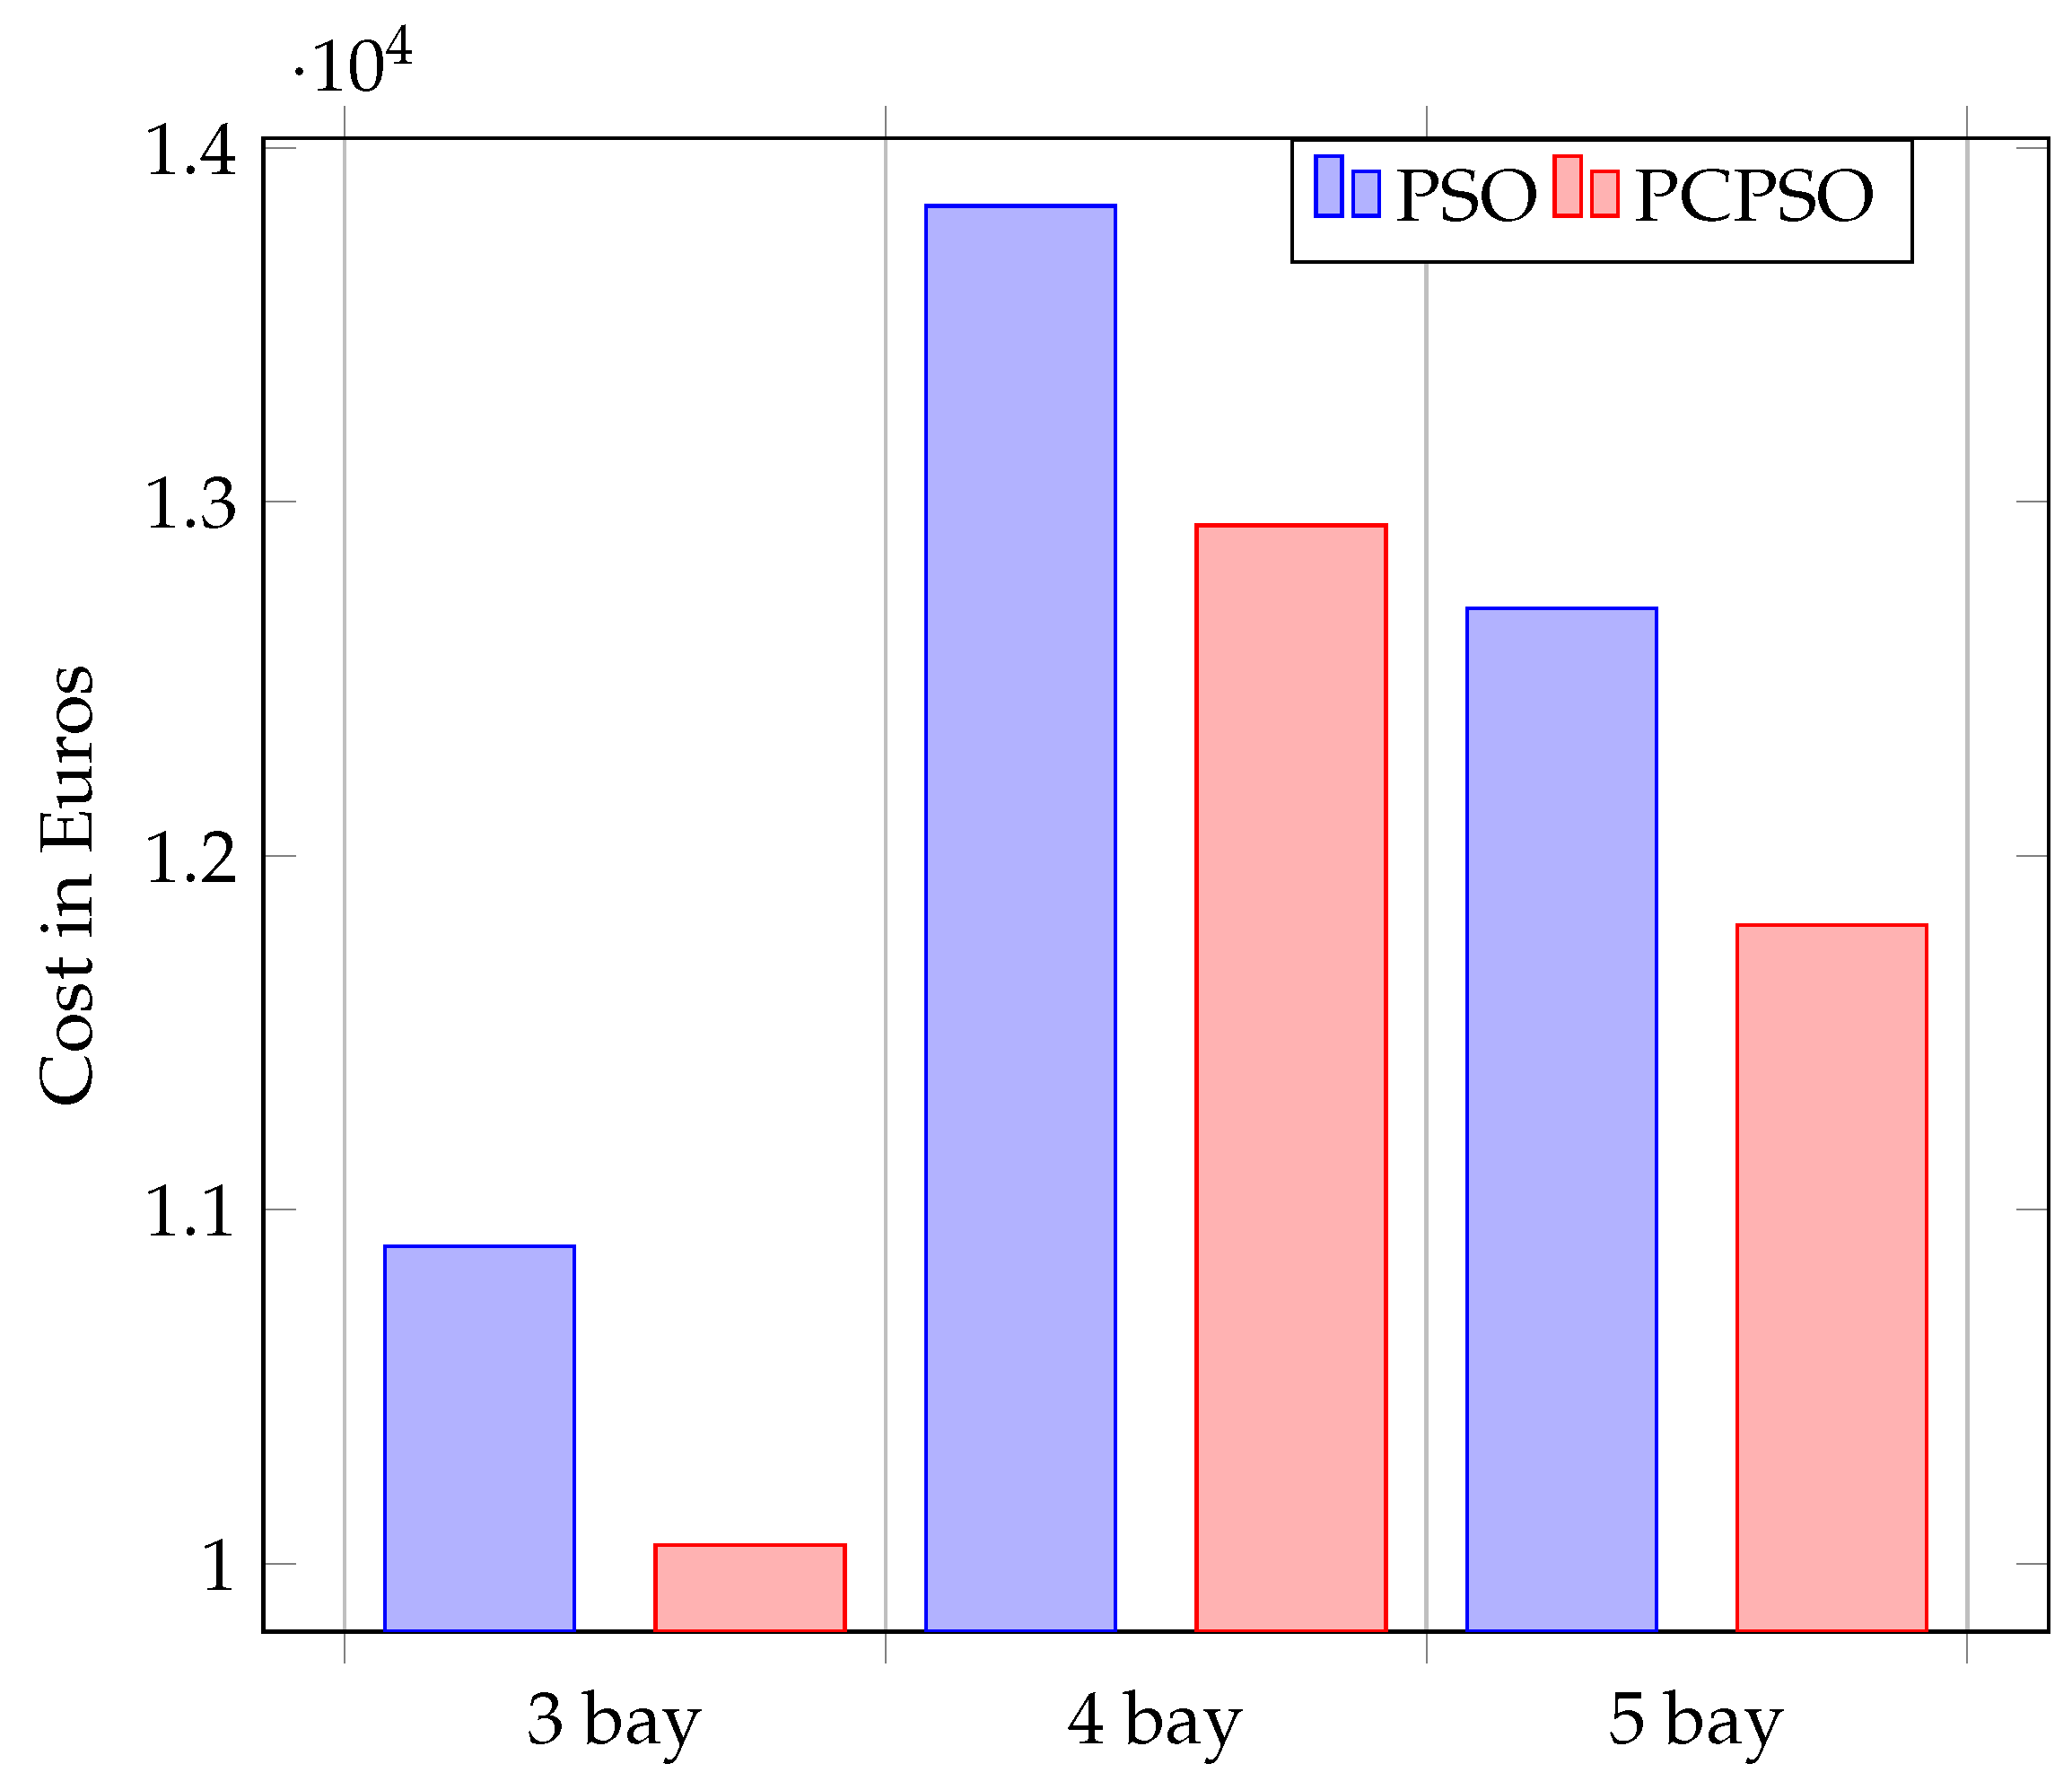
The optimal costs for the three, four, and five bays are EUR 10,052, EUR 12,933, and EUR 11,805, respectively. The PCPSO method thus indicated 7.7%, 6.5%, and 7.0% of cost savings for the respective three frames.
In the frames above, the columns are initially named and numbered from bottom to top, and from left to right. Subsequently, the beams are named and numbered, also following a bottom-to-top and left-to-right sequence.
Optimal cross-sectional sizes for beams and columns of the above-stated three frames are compared according to PSO and PCPSO output. Member reinforcements are computed and expressed in terms of workable sizes and numbers.
Every beam member is designed and detailed based on the moment and shear requirements. Positive and negative moments are first determined and thus designed. The length of negative or top-support reinforcement is one-third of its respective beam length. Meanwhile, positive or bottom reinforcements run throughout the span length.
Since the reinforcement detailing shown is not exhaustive, nominal reinforcements that run along the top level of a beam throughout its span are not included for both the PSO and PCPSO cases, and thus fair comparison remains in place. The whole span of members is also designed for maximum shear forces developed at d b distances away from their supports. An eight millimeters diameter shear reinforcement is used for all beam and column members.
In each output table, the following abbreviations are used. D is a beam or column cross-sectional depth, W is a beam or column cross-sectional width, the word reinforcement is also abbreviated as Reinft, Neg stands for top or negative reinforcement at beam supports, Pos stands for bottom or positive reinforcement along the span, Axial stands for column reinforcement, and C/C refers to the spacing of eight mm diameter reinforcement for shear resistance.
D under the reinforcement sections of the tables stands for the diameter of the reinforcement used. For example, 3D16 means 3 reinforcing bars, each with a diameter of 16 mm.
In Table 2, it is shown that all the beams and columns of the three-bay frame used reduced cross-sectional size when optimized using the PCPSO rather than the PSO. Reinforcements provided to the beams and columns are also slightly lower when computed using the PCPSO algorithm. Whereas, stirrups do not show such significant differences. The total PSO optimized cost of this frame is EUR 10,896.27, whereas the total PCPSO optimized cost is EUR 10,052.56. This indicates a 7.7% cost reduction with the newly developed augmentation.
Similarly, in Table 3, it is shown that the cross-sections for all the beams and columns of the four-bay frame are reduced when optimized using the PCPSO rather than the PSO. Reinforcements provided to the beams and columns are also slightly fewer when computed with the PCPSO algorithm. Whereas, stirrups do not show such significant differences. The total cost of this frame after optimization using PSO is EUR 13,835.95, whereas its cost after the PCPSO optimization carried out is EUR 12,933.51, which means a 6.5% cost save.
The third frame has the same number of beams and columns as the second case. Although it has more bays, some stories from the right side of the frame do not run throughout its full height. Thus, its cost differs from the cost incremental trend shown between the first two frame cases.
Table 4, summarizes the output for the five-bay frame. Here also it remains true that all respective sections of beams and columns optimized by PCPSO are smaller than that computed by PSO. In terms of longitudinal reinforcements, the PCPSO performs slightly better than the PSO. The stirrups still do not show such significant differences. The total cost of this frame after PSO optimization is EUR 12,699.22, whereas its cost after PCPSO optimization is EUR 11,804.69. Here it also achieved a 7.0% cost reduction.
The optimal cost trend is shown in Figure 7 for five consecutive runs. Each run consists of 20 population and 1000 iterations. The value of each run represents the optimal value obtained through 20 populations and 1000 iterations for the specified algorithms. It can be seen that for almost all the runs, PCPSO performed better.
Out of the five runs in Figure 7, the optimal values are selected for each frame and each algorithm. Figure 8 summarizes these optimal costs. In both cases, for all three frames, PCPSO scored optimal costs.

6. Conclusions

In this paper, the initialization technique, which is a crucial step in an optimization algorithm, is the central point of focus. A priority concept is thus introduced to challenge the random initialization approach in the case of population-based algorithms such as PSO. The aim is to investigate the convergence and optimality of the algorithm by incorporating priority criteria during initialization. The conducted case study verified the hypothesis, as the PCPSO algorithm demonstrated relatively accelerated convergence and achieved optimal cost compared to the traditional PSO algorithm.
The priority criteria can be classified into two groups: beam criteria and column criteria. These criteria are derived from parameters that play a significant role in the structural design, such as member lengths, loading conditions, and column locations. In addition to these factors, the initial internal responses obtained from SAP2000 analysis can also be used as criteria for assigning data to the design variables.
A comparison of optimization is conducted between the traditional Particle Swarm Optimization (PSO) and the PSO augmented with Priority Criteria (PCPSO) proposed in this article. Each method is configured with a population size of 20, 1000 iterations, and 5 runs. The optimal run is selected for each frame and optimization method to assess the performance.
The results demonstrate that the developed algorithm is cost-effective in all three considered cases, with a minimum cost reduction of 6.5% compared to the corresponding PSO optimization. Convergence graphs are compared, and the cross-sectional sizes for beams and columns in the frames are tabulated to verify the algorithm’s performance. Furthermore, it is observed that by using PCPSO with a reduced population size of 10 while keeping the number of iterations unchanged, over 10% cost savings can be achieved. This reduction in population size significantly reduces the required computational time.
Significant cost reduction is observed in all three cases due to the optimal sizing of member cross-sections. While the impact on cost reduction from reinforcements is relatively smaller, it still contributes to overall savings. This can be attributed to the fact that member cross-sections are the primary and direct design variables considered in this study. As future work, it would be valuable to explore the interchangeability of design variables and compare the resulting optimizations.
The priority criteria (PC) developed in this study can be easily integrated into various PSO variants or hybrid algorithms, leading to improved performance. The main concept behind the priority criteria is the distribution of randomly generated variable values based on conceptual criteria before the algorithm is fully implemented. This approach offers advantages, as it allocates values to structural members based on conceptual criteria rather than random allocation. As a result, the benefits of this approach intuitively extend to other algorithms that utilize random initialization techniques, allowing for enhanced performance in those cases as well.
While the priority concept introduced in this study can be applied to structural optimization in materials other than reinforced concrete (RC) and potentially extended to other disciplines, there are certain limitations that need to be addressed. One drawback is the need to derive formulations for important design variables specific to the problem at hand, which may require additional effort.
Additionally, the case study conducted in this paper is limited to three frames with six stories, which may not fully capture the complexity and variability of high-rise and multi-bay structures. Future works could focus on expanding the study to include such cases, taking into account considerations such as different loadings, analysis variabilities, and other factors that may impact the optimization process.
By addressing these limitations and exploring broader application domains, further advancements can be made in utilizing the priority criteria approach for structural optimization.

Author Contributions

Conceptualization, Y.L.A.; methodology, Y.L.A.; resources, Y.L.A., B.H., T.L. and G.U.; software, Y.L.A.; validation, Y.L.A.; writing—original draft preparation, Y.L.A.; writing—review and editing, Y.L.A., B.H., T.L. and G.U.; supervision, B.H., T.L. and G.U. All authors have read and agreed to the published version of the manuscript.

Funding

This research was funded by Bauhaus University [ThürLHO, 2022], Weimar, Germany; Swedish International Development Agency [SIDA project 2022]; Addis Ababa University [2020], Addis Ababa, Ethiopia.

Institutional Review Board Statement

Not applicable.

Informed Consent Statement

Not applicable.

Data Availability Statement

Data are included in Table 2, Table 3 and Table 4 of this paper.

Acknowledgments

The Bauhaus University, Weimar, Germany is acknowledged for providing office facilities and software access.

Conflicts of Interest

The authors declare no conflict of interest. The funders had no role in the design of the study; in the collection, analyses, or interpretation of data; in the writing of the manuscript; or in the decision to publish the results.

Abbreviations

The following abbreviations are used in this manuscript:
CACombined Approximations
PCPSOPriority Criteria Particle Swarm Optimization
PSOParticle Swarm Optimization
RCReinforced Concrete
A f b , A f c area of formwork for beam, column
A s t Area of reinforcement
b b , b c width of beam, column
C b , C c cost of beam, column
C c , C f , C r unit rate of concrete, formwork, reinforcement
C i , C i m , C o interior, intermediate, outer column
c i penalty factor
D b , D c depth of beam, column
d b , d c effective depth of beam, column
E d design load
f w workable size difference of sections
F ( x ) , f ( x ) objective function unconstrained, constrained
f c d , f y d design strength of concrete, reinforcement
G b , G c constraint of beam, column
G i inequality constraint
G k permanent actions
g ( x ) constraint function
L b , L c length of a beam, column
mdesign strength ratio of reinforcement to concrete divided by 0.8
M b , M c design moment of beam, column
M b , d i f f beam moment difference
M b , r e s , M c , r e s moment capacity of beam, column
n b number of beams
P c design axial of a column
P c , d i f f column moment difference
P c , r e s axial capacity of a column
Q k variable actions
R b , R c priority rank of beam, column
V b design shear of a beam
V b , r e s shear capacity of a beam
V c b , V c c volume of concrete for beam, column
W b externally applied load on a beam
W r b , W r c weight of reinforcement for beam, column
ε allowed constraint limit
λ s , λ n s slenderness ratio for sway, non sway frames
δ b beam deflection
φ v , φ v c column reinforcement diameter longitudinal shear
ρ reinforcement to section ratio
ρ b balanced reinforcement to section ratio
γ G , γ Q actions factors for permanent, variable actions
γ m , γ v , γ p moment, shear, axial reduction factor

References

  1. McCarthy, T.J.; McCluskey, S. A particle swarm optimisation approach to reinforced concrete beam design according to AS3600. In Proceedings of the 1st International Conference on Soft Computing Technology in Civil, Structural and Environmental Engineering, Orlando, FL, USA, 12–14 September 2021; University of Wollongong: Wollongong, Australia, 2009. [Google Scholar]
  2. Qin, H.; Guo, Y.; Liu, Z.; Liu, Y.; Zhong, H. Shape optimization of automotive body frame using an improved genetic algorithm optimizer. Adv. Eng. Softw. 2018, 121, 235–249. [Google Scholar] [CrossRef]
  3. Greco, A.; Pluchino, A.; Cannizzaro, F. An improved ant colony optimization algorithm and its applications to limit analysis of frame structures. Eng. Optim. 2019, 51, 1867–1883. [Google Scholar] [CrossRef]
  4. Doğan, E.; Saka, M.P. Optimum design of unbraced steel frames to LRFD–AISC using particle swarm optimization. Adv. Eng. Softw. 2012, 46, 27–34. [Google Scholar] [CrossRef]
  5. Yildiz, A.R. Comparison of evolutionary-based optimization algorithms for structural design optimization. Eng. Appl. Artif. Intell. 2013, 26, 327–333. [Google Scholar] [CrossRef]
  6. Paya, I.; Yepes, V.; González-Vidosa, F.; Hospitaler, A. Multiobjective optimization of concrete frames by simulated annealing. Comput.-Aided Civ. Infrastruct. Eng. 2008, 23, 596–610. [Google Scholar] [CrossRef]
  7. Zamani, H.; Nadimi-Shahraki, M.H.; Gandomi, A.H. QANA: Quantum-based avian navigation optimizer algorithm. Eng. Appl. Artif. Intell. 2021, 104, 104314. [Google Scholar] [CrossRef]
  8. Zamani, H.; Nadimi-Shahraki, M.H.; Gandomi, A.H. Starling murmuration optimizer: A novel bio-inspired algorithm for global and engineering optimization. Comput. Methods Appl. Mech. Eng. 2022, 392, 114616. [Google Scholar] [CrossRef]
  9. Huynh, N.T.; Nguyen, T.V.; Nguyen, Q.M. Optimum Design for the Magnification Mechanisms Employing Fuzzy Logic-ANFIS. Comput. Mater. Contin. 2022, 73, 5961–5983. [Google Scholar]
  10. Huynh, N.T.; Nguyen, T.V.; Tam, N.T.; Nguyen, Q.M. Optimizing Magnification Ratio for the Flexible Hinge Displacement Amplifier Mechanism Design. In Proceedings of the 2nd Annual International Conference on Material, Machines and Methods for Sustainable Development (MMMS2020), Nha Trang, Vietnam, 12–15 November 2021; Springer: Berlin/Heidelberg, Germany, 2021; pp. 769–778. [Google Scholar]
  11. Tsiptsis, I.N.; Liimatainen, L.; Kotnik, T.; Niiranen, J. Structural optimization employing isogeometric tools in Particle Swarm Optimizer. J. Build. Eng. 2019, 24, 100761. [Google Scholar] [CrossRef]
  12. Perez, R.E.; Behdinan, K. Particle swarm optimization in structural design. Swarm Intell. Focus Ant Part. Swarm Optim. 2007, 532, 1579–1588. [Google Scholar] [CrossRef]
  13. Elbes, M.; Alzubi, S.; Kanan, T.; Al-Fuqaha, A.; Hawashin, B. A survey on particle swarm optimization with emphasis on engineering and network applications. Evol. Intell. 2019, 12, 113–129. [Google Scholar] [CrossRef]
  14. Jain, N.; Nangia, U.; Jain, J. A review of particle swarm optimization. J. Inst. Eng. Ser. B 2018, 99, 407–411. [Google Scholar] [CrossRef]
  15. Barman, S.K.; Maiti, D.K.; Maity, D. Damage detection of truss employing swarm-based optimization techniques: A comparison. In Advanced Engineering Optimization through Intelligent Techniques; Springer: Berlin/Heidelberg, Germany, 2020; pp. 21–37. [Google Scholar]
  16. Omidinasab, F.; Goodarzimehr, V. A hybrid particle swarm optimization and genetic algorithm for truss structures with discrete variables. J. Appl. Comput. Mech. 2020, 6, 593–604. [Google Scholar]
  17. Sun, Y.; Li, H.; Shabaz, M.; Sharma, A. Research on building truss design based on particle swarm intelligence optimization algorithm. Int. J. Syst. Assur. Eng. Manag. 2022, 13, 38–48. [Google Scholar] [CrossRef]
  18. Cheng, M.Y.; Prayogo, D.; Wu, Y.W.; Lukito, M.M. A Hybrid Harmony Search algorithm for discrete sizing optimization of truss structure. Autom. Constr. 2016, 69, 21–33. [Google Scholar] [CrossRef]
  19. Khaledy, N.; Habibi, A.; Memarzadeh, P. A Comparison between different techniques for optimum design of steel frames subjected to blast. Lat. Am. J. Solids Struct. 2018, 15, 9. [Google Scholar] [CrossRef] [Green Version]
  20. Aloysius, J.; Sumito, J.; Prayogo, D.; Santoso, H. Optimization of concentrically braced steel frame structures based on SNI 1726: 2019, SNI 1727: 2020, SNI 1729: 2020, and AISC 341-16. In Proceedings of the IOP Conference Series: Earth and Environmental Science; IOP Publishing: Bristol, UK, 2021; Volume 907, p. 012010. [Google Scholar]
  21. Van, T.H.; Tangaramvong, S.; Limkatanyu, S.; Xuan, H.N. Two-phase ESO and comprehensive learning PSO method for structural optimization with discrete steel sections. Adv. Eng. Softw. 2022, 167, 103102. [Google Scholar] [CrossRef]
  22. Barg, S.; Flager, F.; Fischer, M. A design-focused, cost-ranked, structural-frame sizing optimization. J. Build. Eng. 2020, 30, 101269. [Google Scholar] [CrossRef]
  23. Boscardin, J.T.; Yepes, V.; Kripka, M. Optimization of reinforced concrete building frames with automated grouping of columns. Autom. Constr. 2019, 104, 331–340. [Google Scholar] [CrossRef]
  24. Varaee, H.; Ahmadi-Nedushan, B. Minimum cost design of concrete slabs using particle swarm optimization with time varying acceleration coefficients. World Appl. Sci. J. 2011, 13, 2484–2494. [Google Scholar]
  25. Chutani, S.; Singh, J. Design optimization of reinforced concrete beams. J. Inst. Eng. Ser. A 2017, 98, 429–435. [Google Scholar] [CrossRef]
  26. Chutani, S.; Singh, J. Evaluation of enhanced particle swarm optimization techniques for design of RC structural elements. J. Mater. Eng. Struct. JMES 2017, 4, 65–78. [Google Scholar]
  27. Esfandiari, M.J.; Urgessa, G.S.; Sheikholarefin, S.; Manshadi, S.D. Optimum design of 3D reinforced concrete frames using DMPSO algorithm. Adv. Eng. Softw. 2018, 115, 149–160. [Google Scholar] [CrossRef]
  28. Chegini, S.N.; Bagheri, A.; Najafi, F. PSOSCALF: A new hybrid PSO based on Sine Cosine Algorithm and Levy flight for solving optimization problems. Appl. Soft Comput. 2018, 73, 697–726. [Google Scholar] [CrossRef]
  29. Aote, S.S.; Raghuwanshi, M.; Malik, L. A brief review on particle swarm optimization: Limitations & future directions. Int. J. Comput. Sci. Eng. 2013, 14, 196–200. [Google Scholar]
  30. Peng, J.; Li, Y.; Kang, H.; Shen, Y.; Sun, X.; Chen, Q. Impact of population topology on particle swarm optimization and its variants: An information propagation perspective. Swarm Evol. Comput. 2022, 69, 100990. [Google Scholar] [CrossRef]
  31. Piotrowski, A.P.; Napiorkowski, J.J.; Piotrowska, A.E. Population size in particle swarm optimization. Swarm Evol. Comput. 2020, 58, 100718. [Google Scholar] [CrossRef]
  32. Ghasemi, M.; Akbari, E.; Rahimnejad, A.; Razavi, S.E.; Ghavidel, S.; Li, L. Phasor particle swarm optimization: A simple and efficient variant of PSO. Soft Comput. 2019, 23, 9701–9718. [Google Scholar] [CrossRef]
  33. Kaveh, A.; Talatahari, S. Particle swarm optimizer, ant colony strategy and harmony search scheme hybridized for optimization of truss structures. Comput. Struct. 2009, 87, 267–283. [Google Scholar] [CrossRef]
  34. Devi, S.; Garg, D. Hybrid genetic and particle swarm algorithm: Redundancy allocation problem. Int. J. Syst. Assur. Eng. Manag. 2020, 11, 313–319. [Google Scholar] [CrossRef]
  35. Niu, W.J.; Feng, Z.K.; Cheng, C.T.; Zhou, J.Z. Forecasting daily runoff by extreme learning machine based on quantum-behaved particle swarm optimization. J. Hydrol. Eng. 2018, 23, 04018002. [Google Scholar] [CrossRef]
  36. Wang, R.; Hao, K.; Chen, L.; Wang, T.; Jiang, C. A novel hybrid particle swarm optimization using adaptive strategy. Inf. Sci. 2021, 579, 231–250. [Google Scholar] [CrossRef]
  37. Wang, Y.; Li, B.; Weise, T.; Wang, J.; Yuan, B.; Tian, Q. Self-adaptive learning based particle swarm optimization. Inf. Sci. 2011, 181, 4515–4538. [Google Scholar] [CrossRef]
  38. Poli, R.; Kennedy, J.; Blackwell, T. Particle swarm optimization. Swarm Intell. 2007, 1, 33–57. [Google Scholar] [CrossRef]
  39. Umar, T.; Tahir, A.; Umeokafor, N.; Nawarathna, A.; Zia, A.; Vali, M. An experimental investigation on strength characteristics of concrete using Wastepaper Sludge Ash (WPSA). In Proceedings of the 12th International Conference on Construction in the 21st Century (CITC-12), CITC Global, Amman, Jordan, 16–19 May 2022; pp. 130–137. [Google Scholar]
  40. Zia, A.; Pu, Z.; Holly, I.; Umar, T.; Tariq, M.A.U.R.; Sufian, M. A comprehensive review of incorporating steel fibers of waste tires in cement composites and its applications. Materials 2022, 15, 7420. [Google Scholar] [CrossRef] [PubMed]
  41. Ramírez-Ochoa, D.D.; Pérez-Domínguez, L.A.; Martínez-Gómez, E.A.; Luviano-Cruz, D. PSO, a swarm intelligence-based evolutionary algorithm as a decision-making strategy: A review. Symmetry 2022, 14, 455. [Google Scholar] [CrossRef]
  42. Marini, F.; Walczak, B. Particle swarm optimization (PSO). A tutorial. Chemom. Intell. Lab. Syst. 2015, 149, 153–165. [Google Scholar] [CrossRef]
  43. Jaouadi, Z.; Abbas, T.; Morgenthal, G.; Lahmer, T. Single and multi-objective shape optimization of streamlined bridge decks. Struct. Multidiscip. Optim. 2020, 61, 1495–1514. [Google Scholar] [CrossRef]
  44. Standard, B. Eurocode 2: Design of Concrete Structures. Part 1; European Commission: Singapore, 2004; Volume 1, p. 230. [Google Scholar]
  45. Datta, R.; Deb, K. An adaptive normalization based constrained handling methodology with hybrid bi-objective and penalty function approach. In Proceedings of the 2012 IEEE Congress on Evolutionary Computation, Brisbane, Australia, 10–15 June 2012; pp. 1–8. [Google Scholar]
  46. Coello, C.A.C. Theoretical and numerical constraint-handling techniques used with evolutionary algorithms: A survey of the state of the art. Comput. Methods Appl. Mech. Eng. 2002, 191, 1245–1287. [Google Scholar] [CrossRef]
  47. Kirsch, U. Reanalysis and sensitivity reanalysis by combined approximations. Struct. Multidiscip. Optim. 2010, 40, 1–15. [Google Scholar] [CrossRef]
  48. Kirsch, U. Combined approximations—A general reanalysis approach for structural optimization. Struct. Multidiscip. Optim. 2000, 20, 97–106. [Google Scholar] [CrossRef]
  49. The European Union. 1-1: 2002 Eurocode 1. Actions on Structures. General Actions. Densities, Self-Weight, Imposed Loads for Buildings BSI. 1991. Available online: https://www.phd.eng.br/wp-content/uploads/2015/12/en.1991.1.1.2002.pdf (accessed on 2 June 2023).
  50. Standard, B. Eurocode—Basis of Structural Design. Eurocode 0. 2002. Available online: https://www.diies.unirc.it/documentazione/materiale_didattico/599_2010_260_7481.pdf (accessed on 2 June 2023).
Figure 1. Column priority rank R c , i based on location.
Civileng 04 00039 g001
Figure 2. Graphical model for PSO (left) and PCPSO (right).
Civileng 04 00039 g002
Figure 3. Flow chart for the PCPSO algorithm.
Civileng 04 00039 g003
Figure 4. Flow chart for PSO and PCPSO Implementation.
Civileng 04 00039 g004
Figure 5. Frames with three, four, and five bays.
Civileng 04 00039 g005
Figure 6. Convergence comparison for three, four, and five-bay frames.
Civileng 04 00039 g006
Figure 7. Optimal costs in five successive runs.
Civileng 04 00039 g007
Figure 8. Optimal cost summary for the three frames.
Civileng 04 00039 g008
Table 1. Actions applied on the frames.
Type of ActionDescriptionAmount in kNm 2 Amount in kNm 1
Transferred from a 6 m square slab3.755.625
Transferred from a floor finish1.151.725
PermanentPartition wall on the beam-7.5
Beam and Column self-weights-Program Computed
VariableAction on the slab23
Table 2. Optimal sections for the three-bay frame.
Section (m)Reinft (D in mm, Stirrup D8) Section (m)Reinft (D in mm)
Beam
ID
PSOPCPSOPSOPCPSOCol.
ID
PSOPCPSOPSOPCPSO
DWDWNegPosC/CNegPosC/C DWDWAxialC/CAxialC/C
250.50.350.40.33D162D161003D162D1610010.450.30.350.36D82506D10200
260.50.30.40.33D162D161003D162D1610020.40.30.350.34D81604D8230
270.450.30.40.253D162D161003D162D1610030.40.30.350.254D81004D8220
280.450.30.350.253D162D161203D162D1413040.40.30.350.254D81004D8200
290.450.30.30.253D162D161003D162D1412050.40.30.350.254D81604D8210
300.40.30.350.254D162D161003D162D1413060.40.30.30.254D81604D8210
310.40.30.30.252D122D122002D162D1210070.350.250.40.36D81606D8160
320.40.30.30.252D142D121302D162D1210080.350.250.350.36D81604D8160
330.40.250.30.252D122D121902D122D1216090.350.250.350.36D82304D8240
340.350.250.30.252D122D121202D162D12100100.350.250.350.254D82204D8210
350.350.250.30.253D122D121902D162D12100110.350.250.350.254D82504D8220
360.350.250.30.252D122D121902D162D12100120.350.250.350.254D81604D8210
370.350.250.30.253D203D161002D203D16100130.350.250.350.36D81904D8250
380.350.250.30.253D203D161004D162D16100140.350.250.350.36D82204D8250
390.350.250.30.253D164D201004D204D20240150.350.250.350.34D82204D8230
400.350.250.30.254D203D161004D162D16100160.350.250.350.254D82104D8220
410.350.250.350.254D203D161004D162D16100170.350.250.350.254D82104D8210
420.350.250.30.253D162D161003D162D16100180.350.250.30.254D82104D8210
190.350.250.350.36D82006D8230
200.350.250.350.256D82004D8230
210.350.250.350.254D81404D8190
220.30.250.350.254D81404D8120
230.30.250.350.254D82104D8210
240.30.250.30.254D82104D8200
Table 3. Optimal sections for the four-bay frame.
Section (m)Reinft (D in mm, Stirrup D8) Section (m)Reinft (D in mm)
Beam
ID
PSOPCPSOPSOPCPSOCol.
ID
PSOPCPSOPSOPCPSO
DWDWNegPosC/CNegPosC/C DWDWAxialC/CAxialC/C
310.50.30.30.252D122D121702D142D1612010.450.350.350.256D102704D8220
320.450.30.30.252D142D121602D162D1410020.450.30.350.256D101804D8210
330.40.30.30.252D142D121702D162D1410030.450.30.350.256D101604D8200
340.40.30.30.252D122D122102D162D1410040.450.30.350.254D81004D8180
350.40.30.30.252D142D121602D162D1410050.40.30.30.254D81804D8210
360.40.30.30.252D143D121602D162D1410060.40.30.30.254D82704D8210
370.40.30.350.253D142D141104D143D1410070.40.30.350.256D101706D8230
380.40.30.350.252D162D141304D143D1410080.40.30.350.256D101604D8230
390.40.250.350.253D142D141104D142D1410090.40.30.350.256D101604D8220
400.40.250.350.252D162D141403D162D16100100.40.30.350.254D82104D8220
410.40.250.30.253D162D161003D162D16100110.40.30.350.254D82504D8210
420.40.250.350.252D162D141403D162D16100120.350.30.30.254D82504D8210
430.350.250.40.253D203D161002D202D16100130.350.30.40.36D81606D8240
440.350.250.350.253D142D161103D162D16100140.350.30.350.36D82504D8160
450.350.250.350.253D203D161003D203D16100150.350.30.350.36D82404D8230
460.350.250.40.253D203D161003D162D16100160.350.250.350.254D81904D8220
470.350.250.350.253D203D161003D162D16100170.350.250.350.254D82304D8220
480.350.250.40.253D203D161002D202D16100180.350.250.30.254D82304D8210
490.350.250.350.254D203D161003D203D16100190.350.250.40.256D82306D8250
500.350.250.350.254D203D161003D203D16100200.350.250.350.256D82304D8160
510.350.250.350.253D162D161003D203D16100210.350.250.350.256D82004D8230
520.30.250.350.253D203D201003D164D20100220.350.250.350.254D82104D8220
530.30.250.350.254D203D161003D162D16100230.350.250.350.254D82004D8220
540.30.250.350.254D203D161003D162D16100240.350.250.30.254D82104D8190
250.350.250.350.36D82106D8210
260.350.250.350.256D82106D8210
270.350.250.350.256D82106D8170
280.350.250.350.254D81404D8210
290.350.250.30.254D82104D8200
300.350.250.30.254D82104D8190
Table 4. Optimal sections for the five-bay frame.
Section (m)Reinft (D in mm, Stirrup D8) Section (m)Reinft (D in mm)
Beam
ID
PSOPCPSOPSOPCPSOCol.
ID
PSOPCPSOPSOPCPSO
DWDWNegPosC/CNegPosC/C DWDWAxialC/CAxialC/C
310.450.30.40.33D162D161003D162D1610010.450.350.350.256D81604D8230
320.40.30.350.252D142D141402D162D1410020.40.350.350.256D81604D8220
330.40.30.350.253D142D141002D142D1413030.40.350.350.254D81604D8220
340.40.30.350.253D162D141003D162D1410040.40.350.350.254D82604D8220
350.40.250.350.252D142D141802D162D1410050.40.350.30.254D82604D8200
360.350.250.40.34D163D141004D162D1410060.40.350.30.254D81604D8210
370.350.250.350.252D162D141102D142D1416070.40.30.350.256D81604D8230
380.350.250.350.253D162D141002D162D1414080.350.30.350.256D82504D8230
390.350.250.350.253D142D141404D142D1410090.350.30.350.256D81604D8230
400.350.250.350.252D162D141102D162D14110100.350.30.350.256D82504D8220
410.350.250.40.33D203D141003D202D14100110.350.30.350.254D81604D8200
420.350.250.350.253D163D161002D163D16100120.350.30.30.254D81704D8210
430.350.250.40.252D162D141202D162D14200130.350.30.350.256D81604D8230
440.350.250.350.253D162D141003D162D14100140.350.250.350.256D82404D8230
450.350.250.30.252D162D141002D162D14100150.350.250.350.256D81004D8110
460.350.250.40.33D203D161002D202D14100160.350.250.350.254D81204D8110
470.350.250.350.252D162D141002D142D14110170.350.250.350.254D81904D8210
480.350.250.350.254D162D141004D162D14100180.350.250.30.254D82304D8210
490.30.250.40.254D203D161004D162D14100190.350.250.350.256D81604D8230
500.30.250.350.252D162D141002D122D14160200.350.250.350.254D82204D8190
510.30.250.350.252D162D141203D162D14100210.350.250.350.254D82204D8220
520.30.250.40.33D162D141003D162D14100220.350.250.350.254D81004D8170
530.30.250.350.252D162D141002D122D14160230.350.250.30.254D82004D8210
540.30.250.350.253D162D141003D162D14100240.350.250.30.254D82004D8210
250.350.250.350.256D82004D8220
260.350.250.350.256D82004D8220
270.350.250.30.254D82004D8210
280.350.250.30.256D82204D8190
290.350.250.30.256D81904D8210
300.350.250.30.256D82104D8210
Disclaimer/Publisher’s Note: The statements, opinions and data contained in all publications are solely those of the individual author(s) and contributor(s) and not of MDPI and/or the editor(s). MDPI and/or the editor(s) disclaim responsibility for any injury to people or property resulting from any ideas, methods, instructions or products referred to in the content.