Abstract
Damage assessment of corroded steel members due to severe exposure conditions, has been a vital component for determining the strengthening requirements of existing deteriorated structures, to overcome possible devastating failures. This article mainly focuses on steel angle members, which are mostly used as axially loaded members in different types of applications. In this study, the strategy of thickness reduction at corroded locations was demonstrated as a simple, convenient, and accurate method to represent the corrosion-equivalent properties of steel angles under axial compression. Further, the viability of the thickness reduction approach was evaluated in code-based and numerical approaches. Four standards, BS 5950-1:2000, BS EN 1993-1-1:2005, ASCE 10-15 and ANSI/AISC 360-16 were investigated to identify their applicability to obtain the residual compression capacities of corroded members. The capacity estimations of codes were compared with experimental data to demonstrate that the estimations of codes are not accurate when the level of corrosion is high. Finally, 39 corroded steel angle members of 10 different corrosion patterns were numerically modeled and analyzed to demonstrate the impact of different corrosion patterns on the compression capacity.
1. Introduction
Since rapid industrial development occurred during the early 1900′s, steel structures have been a significant component in the infrastructure, ranging from transmission towers and warehouses to large bridges and many other iconic structures. Even though designs and constructions are precisely completed, the structures undergo failures due to corrosion. During the last few decades, there have been a number of occasions where steel structures have collapsed, resulting in fatal damages, such as the Silver Bridge in the USA in 1967. Therefore, damage assessment is important to identify the level of deterioration of structures and determine the restoration measures. According to Cantero and Gonzalez [1], the requirement of structural health monitoring and assessment of the level of deterioration has surpassed the contributions required for the design of structures.
According to previous studies, there are several causes for the failure of steel structures. Fatigue and environmental effects have been the two major factors. When the structures are exposed to severe environmental conditions, the structures are highly prone to corrosion and related consequences [2]. Even though there have been studies on surface corrosion of structural members [3,4], it is reported that the numerical modeling techniques (i.e., finite element models) for the strength assessment of corroded members are extremely difficult. Therefore, it is important to study the available numerical techniques and propose simplified finite element modeling techniques for the strength assessment of corroded steel members. Further, steel angle members are largely used in structures where they are mostly used as axially loaded members. Accordingly, this study was formulated to investigate simplified numerical techniques to model structural members with thickness reductions due to corrosion and validate such techniques. As the compression behavior of angle members is very important, this study focused to observe the behavior of corroded steel angle members under axial compression loading, having bolted connections at one leg and much more susceptible to buckling. Then, simplified and validated finite element models were used to investigate the compressive capacity variation of steel angle members with different corrosion patterns.
Many researchers have conducted various studies on corrosion over the past years including publications by Safiuddin [5], Wang et al. [6] and El Aghoury [7] who have elaborated on the different types and various factors influencing corrosion. Moreover, there have been several attempts such as the studies by Shaheen et al. [8] and Abdulla and Menzemar [9] to numerically investigate the properties of steel members using finite element applications.
In the area of damage assessment of corroded members, Leroux [10], Xiao et al. [11] and Andrade and Alonso [12] have emphasized the applicability of modern techniques such as 3D profilometry, optical scanning and polarization resistance method to measure the corrosion degree of steel elements. Even though they are highly accurate, except for the polarization method, which requires a lot of interpretation to make a prediction of corrosion, it can be observed in most of the previous experimental studies that the corrosion degree is estimated using the average thickness measured with commonly available measuring tools such as vernier calipers and micrometers [13]. Regarding compressive strength determination, Ostapenko et al. [14], Hebor and Ricles, [15], Nazari et al. [16] and Ahn, et al. [17] have conducted several experimental and numerical studies to assess the residual compressive strength of tubular sections and introduced expressions for the calculation.
Since the focus of this study is corroded angle members under axial compressive loading, experimental and numerical studies on this scenario were referred to in detail. Shu et al. [18] have carried out an experimental study and a finite element analysis to understand the behavior of corroded steel angle members under compression. For the experimental analysis in their study, 90 samples of steel angle members have been experimentally tested under compressive loading, where 72 of them have been artificially corroded employing an electrochemically accelerated corrosion method, and the other 18 have been kept uncorroded and tested to use as benchmark specimens to assess the corrosion damage. Beaulieu et al. [19] in their study, have also conducted a similar experimental study, but with a different test assembly, to assess the residual capacity of steel angle members. Ozvald and Dunai [20] also have conducted an experimental study to investigate the effect of corrosion on the buckling of steel angle members. In their study, 24 steel angle members, with the same original size of 40 mm × 40 mm × 4 mm and length of 790 mm, have been tested, where 2 of them have been in original conditions and the other 22 specimens have been with reduced thicknesses to represent different corrosion patterns. The thicknesses of those specimens have been reduced by the milling process to represent the thickness reduction. Furthermore, Chen et al. [21] have showcased that compression elements with uniform corrosion losses, whether they are artificially or naturally corroded, have similar buckling capacities and failure modes as real compression elements, in their study using square steel columns.
Based on the above studies, the thickness reduction approach at corroded locations was identified as a simple and convenient method for demonstrating corrosion-equivalent properties and measuring accurate residual capacities. Then, the thickness reduction concept was evaluated using design codes where the corrosion effect is not directly addressed, as well as using numerical finite element models. In the numerical analysis, the effect of corrosion patterns, which have not been numerically analyzed before, was evaluated to identify the impact on the residual axial compression capacity of corroded steel angles.
2. Methods
The methodology of the study consists of two main phases. The first phase is studying the compressive capacity of uniformly corroded steel angle members using experimental work and design codes targeting code-based capacity predictions against the degree of corrosion. The second phase is to show the possibility of using the thickness reduction method to numerically model steel angle members with non-uniform corrosions and, to show the impact of different non-uniform corrosion patterns on the compression capacity of steel angles.
2.1. Code-Based Prediction of Compressive Capacity of Steel Angles
The aim of this phase is to investigate the code-based estimations of the compressive capacity of uniformly corroded steel angles. Approaches of four different design codes, i.e., former BS 5950-1:2000 code [22], BSEN 1993-1-1:2005 code [23], ANSI/AISC 360-16 code [24] and ASCE 10-15 code [25] were studied and the design approaches are elaborated in Table 1.

Table 1.
Design approaches of four standards: BS 5950-1:2000, BSEN 1993-1-1:2005, ANSI/AISC 360-16 and ASCE 10-15, used to estimate the compression capacity of angle members.
According to the four standards, there are several factors such as elastic modulus, yield strength, thickness, and slenderness, considered for the calculation of the compressive strength of steel structural members. Since this study is based on the strategy of thickness reduction to demonstrate the corrosion equivalent properties, it was assumed that the mechanical properties remain constant with the degree of corrosion.
However, according to the provisions of the codes, it can be identified that the codes do not allow applying local thickness values for corroded locations. The applicable method is to apply an average thickness throughout the member as a uniformly corroded member. Therefore, if different local corrosion patterns with similar mass losses are considered, a uniform thickness reduction is not effective since it gives the same thickness reduction, which would result in the same compressive strength contrasting with the actual results. Hence, code-based approaches could not be considered viable for members with nonuniform corrosion or local corrosion patches, etc. Therefore, in this study, it was decided to consider only uniformly corroded members to assess the applicability of code-based approaches for corrosion damage assessment. The experimental results by Shu et al. [18] were considered for this analysis since the test has been based on uniformly corroded members, obtained with an accelerated corrosion method. Material properties of steel mentioned in their study were used in calculations while the measured average thickness and width measurements were taken as geometric data. Then, the capacity estimations obtained from the four different codes were graphically plotted with the experimental data to compare.
2.2. Numerical Model
Since it was identified that the code-based approaches are not convenient for damage assessment of locally corroded or nonuniformly corroded members, an experimental and numerical approach was used to accomplish reliable results. It was found that sufficient experimental data is available to obtain a validated finite element model so that the model can be used for further analyses. In this study, finite element models were developed based on the experimental study by Shu et al. [18]. First, finite element models were developed using thickness reduction. Then, the finite element model results were compared with the experimental results to verify the possibility of using the thickness reduction method as a simple method to numerically model corroded structural members. This step was the validation step of the finite element model. Then, the reduction in the compression capacity of corroded members with different corrosion patterns was investigated using validated simplified finite element models. Figure 1a,b shows the geometrical properties of the uncorroded member used in this study. Table 2 gives the properties of the steel used for the analysis.
Since the effect of rolling radius on the cross-sectional area, I value and the radius of gyration of a cross-section, is assumed to be negligible in both code-based and numerical analyses.
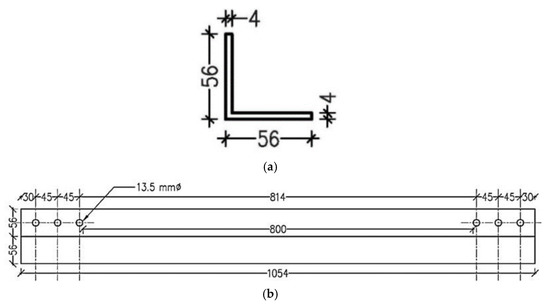
Figure 1.
(a) Cross sectional detail of uncorroded specimen, (b) Longitudinal dimensions of uncorroded steel angle specimen.
Figure 2 is an illustration of the finite element model of the uncorroded angle specimen developed for the study. The model was created using shell elements extruded to the required length. Material nonlinearity was achieved by providing the bi-linear stress-strain relationship for the elastic and plastic properties of steel as shown in Figure 3. Geometric nonlinearity was achieved by second order analysis of the model.

Table 2.
Material properties of steel.
Table 2.
Material properties of steel.
| Property | Value |
|---|---|
| Elastic Modulus | 206 GPa |
| Density | 7850 kg/m3 |
| Yield Strength | 350 MPa |
| Ultimate Strength | 468 MPa |
| Ultimate Strain | 0.15 |

Figure 2.
Illustration of the finite element model developed for numerical analysis.
Uniform and local thickness reduction strategies were used for corrosion modeling. In this method, the element was divided into several partitions depending on the proposed corrosion pattern. Reduced thickness values were assigned to represent the corroded areas as illustrated in Figure 4.
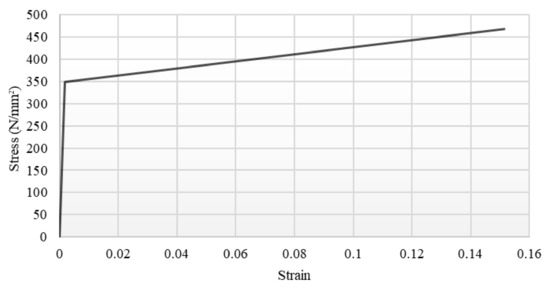
Figure 3.
Bilinear stress–strain relationship applied for material properties of steel in the finite element model.
To obtain the fixed end conditions at one end of the element, three relevant reference points were restrained for displacements and rotations in all directions. To apply an increasing load from the other end, the rotations and displacement along all the other directions, except displacement along the longitudinal direction, were restrained. To estimate an appropriate mesh size, a mesh convergence study was performed with different finite element mesh sizes.
For the validation of the finite element model, previous experimental test data from the literature were considered. Clear and well-defined experimental results by Shu et al. [18] of 90 specimens, which were divided into nine groups based on their section sizes and slenderness ratios, were compared with results obtained by FE models created using measured dimensions in the study.
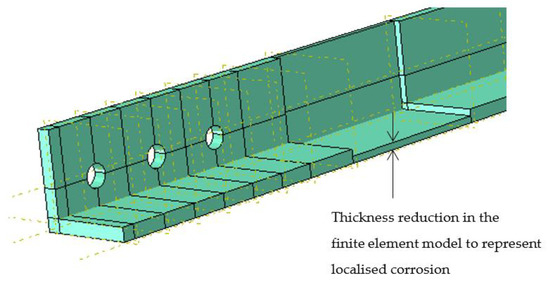
Figure 4.
3-dimensional visualization of corrosion modeling technique by thickness reduction.
Initially, two groups of these nine were taken and five and four specimens of each group were modeled such that the range of degree of corrosion values within the group is represented by the finite element models. The experimental and numerical results of those two groups have been elaborated in Figure 5, where notations, FEX and FFEM represent the experimental and numerical compression capacity values, respectively. Then, for the other seven groups of specimens, one to three finite element models were developed from each group such that the finite element models cover the degree of corrosion range within each group. All those finite element analysis results were also close to experimental results confirming the validity of the finite element models.
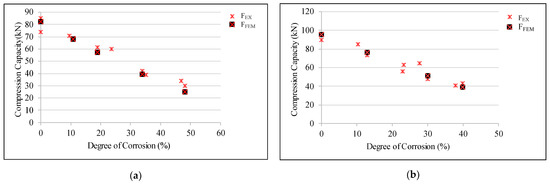
Figure 5.
Comparison of finite element model (FEM) results with the experimental results by Shu et al. [18] (a) Section, L50 × 50 × 4 and L/r = 120; (b) Section, L56 × 56 × 4 and L/r = 90. (Note: FEX and FFEM represent the experimental and numerical compression capacity values respectively).
Figure 6 shows the experimental compression capacity versus the numerical compressive capacity of 23 specimens. According to Figure 5 and Figure 6, it was observed that the finite element models give very close predictions of the compressive capacity when compared with the experimental results, suggesting that the finite element analysis using the thickness reduction method is viable.
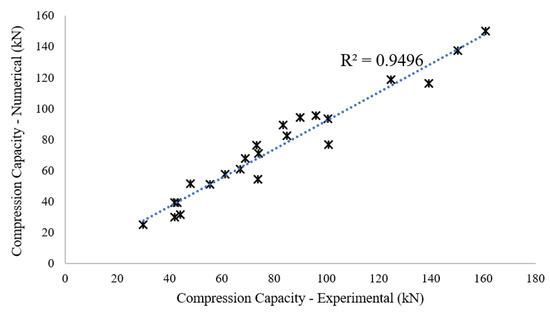
Figure 6.
Comparison of finite element model (FEM) results with the experimental results for the compressive capacity of steel angle members with different corrosion degrees.
The corrosion patterns used for further analysis of the compressive capacity, represented in ten groups depending on the expected outcomes, are shown in Table 3. When these groups are considered, some of them, which are Groups 2, 3, 5 and 6, were based on the experimental study conducted by Ozvald and Dunai [20].
While quantitatively comparing the strength reductions, the results of those groups could be considered as a validation process for irregular corrosion models. Even though the exact values could not be compared due to the deviations in the load application method and section sizes, the variations in the strength reduction showcased a similar variation as in the experimental study, which is further elaborated in the discussion.
The other six groups have been designed based on different hypotheses representing different corrosion patterns to further investigate the effects of corrosion patterns on the compression capacity. These hypotheses have not been experimentally tested in previous studies.

Table 3.
Numerically studied steel angle member details and corrosion patterns.
Table 3.
Numerically studied steel angle member details and corrosion patterns.
| Group No. | Specimen ID | Longitudinal Illustration | Cross Section | Corrosion Details | Assessment |
|---|---|---|---|---|---|
| 1 | 1A |  |  | Lcorr = 1054 mm tcorr = 1 mm | Identify the most critical leg (bolted or not) and side (outer or inner) of corrosion on the compression capacity |
| 1B |  |  | Lcorr = 1054 mm tcorr = 1 mm | ||
| 1C |  |  | Lcorr = 1054 mm tcorr = 1 mm | ||
| 1D |  |  | Lcorr = 1054 mm tcorr = 1 mm | ||
| 2 | 2A |  |   | Lcorr = 400 mm × 2 tcorr = 1 mm | The impact of rapidity of varying the corroded leg on the compression capacity. Similar patterns are experimentally tested by Ozvald and Dunai [20]. |
| 2B |  | Lcorr = 200 mm × 4 tcorr = 1 mm | |||
| 2C |  | Lcorr = 100 mm × 8 tcorr = 1 mm | |||
| 3 | 3A |  |  | Lcorr = 800 mm tcorr = 1 mm | Impact comparison of corner of the angle corrosion and edge of the width corrosion on the compression capacity. Similar patterns are experimentally tested by Ozvald and Dunai [20]. |
| 3B |  |  | Lcorr = 800 mm tcorr = 1 mm | ||
| 3C |  |  | Lcorr = 800 mm tcorr = 1 mm | ||
| 3D |  |  | Lcorr = 800 mm tcorr = 1 mm | ||
| 4 | 4A |  |  | Lcorr = 300 mm tcorr = 1 mm | Impact comparison of buckling area corrosion and bolted area corrosion on the compression capacity. |
| 4B |  |  | Lcorr = 150 mm × 2 tcorr = 1 mm | ||
| 5 | 5A |  |  | Lcorr = 100 mm tcorr = 3 mm | Impact of the concentration of the corroded volume on the compression capacity. Similar patterns are experimentally tested by Ozvald and Dunai [20]. |
| 5B |  |  | Lcorr = 200 mm tcorr = 1.5 mm | ||
| 5C |  |  | Lcorr = 300 mm tcorr = 1 mm | ||
| 5D |  |  | Lcorr = 600 mm tcorr = 0.5 mm | ||
| 6 | 6A |  |  | Lcorr = 100 mm tcorr = 1 mm | Impact of the local corrosion location on the compression capacity. Similar patterns are experimentally tested by Ozvald and Dunai [20]. |
| 6B |  | Lcorr = 100 mm tcorr = 1 mm | |||
| 6C |  | Lcorr = 100 mm tcorr = 1 mm | |||
| 6D |  | Lcorr = 100 mm tcorr = 1 mm | |||
| 7 | 7A |  |  | D = 10 mm nper = 15 | The impact of perforated corrosion on the compression capacity. |
| 7B |  |  | Lcorr = 43 mm tcorr = 2 mm | ||
| 7C |  |  | Lcorr = 800 mm tcorr = 0.1053 mm | ||
| 8 | 8A |  |  | D = 8.66 mm nper = 8 | The impact of perforation pattern on the compression capacity. |
| 8B |  |  | D = 10 mm nper = 6 | ||
| 8C |  |  | D = 12.25 mm nper = 4 | ||
| 8D |  |  | D = 17.32 mm nper = 2 | ||
| 9 | 9A |  |  | D = 8.66 mm nper = 6 | The impact of perforation location on the compression capacity. |
| 9B |  | D = 8.66 mm nper = 6 | |||
| 9C |  | D = 8.66 mm nper = 6 | |||
| 9D |  | D = 8.66 mm nper = 6 | |||
| 10 | 10A1 |  |  | D = 15 mm npit = 66 tcorr = 1 mm | The impact of pitting corrosion compared to uniform corrosion on the compression capacity. |
| 10A2 |  |  | D = 15 mm npit = 66 tcorr = 2 mm | ||
| 10A3 |  |  | D = 15 mm npit = 66 tcorr = 3 mm | ||
| 10B1 |  |  | Lcorr = 768.5 mm tcorr = 0.292 mm | ||
| 10B2 |  |  | Lcorr = 768.5 mm tcorr = 0.58 4mm | ||
| 10B3 |  |  | Lcorr = 768.5 mm tcorr = 0.876 mm | ||
| 10C |  |  | Lcorr = 768.5 mm tcorr = 1 mm |
Note: Dark-colored locations are corroded locations represented by reducing thickness. Lcorr—Corroded length, tcorr—Corroded thickness, D—Diameter of pits or perforations, nper—number of perforations, npit—number of pits.
3. Results and Discussion
The results of the study are discussed in two sections based on code-based and numerical analyses.
3.1. Code-Based Analysis
The results of the nine groups of specimens, divided based on the original cross-section and the slenderness ratio (L/r), in the experimental study by Shu et al. [18], were separately plotted against the degree of corrosion to evaluate the applicability of design codes to calculate the residual compression capacity. The percentage of thickness reduction was taken as the degree of corrosion.
Three graphs relevant to three groups of specimens of size L50 × 50 × 4 with three different slenderness ratios of 60, 90 and 120, are illustrated in Figure 7. The other six groups of specimens also showcased a similar variation (Note: results of those six groups are not graphically presented in this paper).
When Figure 7 is examined, it can be clearly observed that ANSI/AISC 360-16 standard has given the lowest compression capacity values of all standards and the BS 5950-1:2000 standard has given the highest compression capacity values. In most cases, the design values given by ANSI/AISC 360-16 have been 20% to 50% lower than the experimental values, but BS 5950-1:2000 has given values within a 15% difference from the experimental values, especially when the slenderness ratio and degree of corrosion are low. Even though BS 5950-1:2000 has given a lower value than the actual compression capacity, which is acceptable, it has given values less than the actual compression capacity on some occasions, when the degree of corrosion increases. When the slenderness ratio is low, the estimated compression capacity given by BSEN1993-1-1:2005 is within a 10% difference from the experimental value but when the slenderness ratio increases this difference has increased up to 30% to 50% of the experimental value. Further, ANSI/AISC 360-16 and ASCE 10-15 codes have given capacity values always lower than the actual capacity almost always. Therefore, it is safe to estimate the compressive capacity of steel angles when corrosion exists using ANSI/AISC 360-16 or ASCE 10-15 standards.
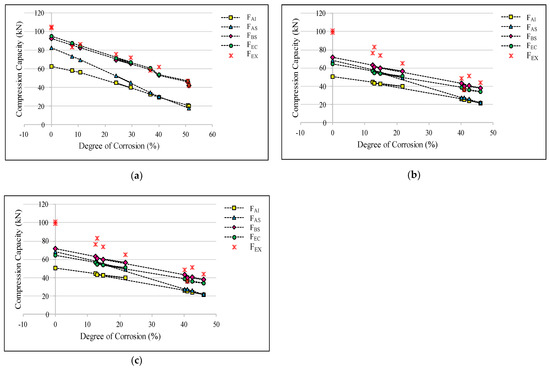
Figure 7.
Code-based and experimental compression capacity variation of the L50 × 50 × 4 angle members against the degree of corrosion (a) L/r = 60; (b) L/r = 90; (c) L/r = 120. (Note: FAI, FAS, FBS, FEC and FEX denote the capacities obtained from ANSI/AISC 360-16, ASCE 10-15, BS 5950-1:2000, BSEN1993-1-1:2005 and experimental values respectively).
When the experimental results are compared with the code-based compressive capacities of the same cross-section, it can be observed that the conservativeness of the code-based values increases with the slenderness ratio. Overall, none of these standards has consistently predicted the actual experimental compression capacities of corroded members which suggests that the corrosion effects on the compression capacity of steel angle members are not accurately demonstrated by any of these four design codes.
3.2. Numerical Analysis
At the validation stage, it was emphasized that the finite element models developed with the thickness reduction demonstrate the actual compression capacities well. It was highlighted that these simple finite element models are viable for the prediction of the compression capacity. Thirty-nine steel angle specimens were numerically modeled to investigate the impact of the corrosion pattern on the compression capacity. The reference compression capacity used for the analysis is the capacity of the non-corroded member which is 105.16 kN. The residual compression capacities of the corroded members are plotted separately based on their groups (i.e., groups as per Table 3) and illustrated in Figure 8 and Figure 9. The magnitude of damage or the percentage reduction in compression capacity caused by corrosion is mentioned within brackets next to the specific plot of the member.
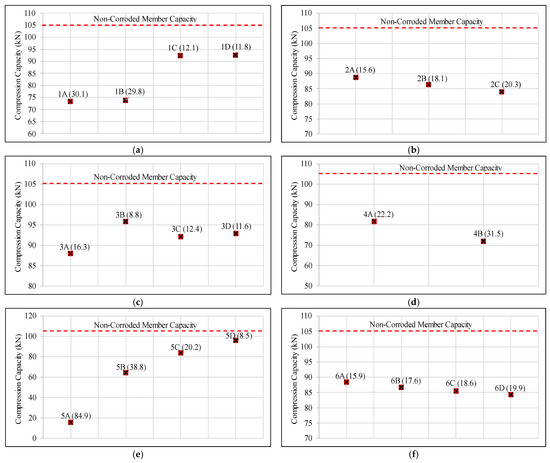
Figure 8.
Illustration of the finite element analysis results for the residual compression capacities of the hypothetical corroded members separated based on their groups (a) Group 1; (b) Group 2; (c) Group 3; (d) Group 4; (e) Group 5; (f) Group 6. (Note: the reference compression capacity is shown in dotted lines).
The finite element analysis results of Group 1 clearly emphasize that the impact of corrosion is more severe when the corrosion occurs on the bolted leg of the member, where the compression force is applied. The corrosion damage on the compression capacity is considerably low when the leg, which is free from bolt holes, is corroded. When the residual capacities of 1A and 1B specimens are compared separately, there is a very low difference between them. Similarly, there is not much difference between the residual capacities of 1C and 1D specimens. This behavior emphasizes that there is not much difference in corrosion damage either if the corrosion happens in the inner face or outer face, until the degree of corrosion remains the same. The reason behind the slight difference between these values is the minor difference between the second moment of area values when the side of corrosion changes.
According to the results of Group 2, the residual compression capacity is decreased with the increase in the rapidity of changing the corroded side. Therefore, it can be suggested that even though the degree of corrosion is similar, the corrosion damage is higher, when the corroded leg rapidly changes, than having a uniformly distributed corrosion pattern in a single leg. Similar variation has been observed in the experimental results of A9, A10 and A11 specimens in the study by Ozvald and Dunai [20].
According to the finite element results of Group 3, it could be observed that the residual compression capacity of the 3A specimen is considerably lower than that of the 3B specimen, which indicates that the corrosion of the corner of the specimen is more critical than the corrosion on the edge of the leg in the specimen. The specimens A4(I) and A5(I) in the experimental study by Ozvald and Dunai [20] also have shown a similar variation.
In this numerical study, 3C and 3D specimens, which have intermediate conditions of 3A and 3B, have shown compression capacities between the capacity values of 3A and 3B, as theoretically expected. However, this variation has not been showcased in the results of the experimental study by Ozvald and Dunai [20].
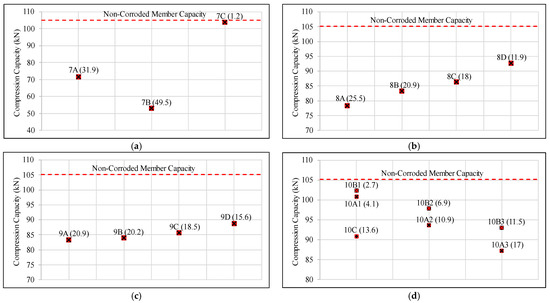
Figure 9.
Illustration of the finite element analysis results for the residual compression capacities of the hypothetical corroded members separated based on their groups (a) Group 7; (b) Group 8; (c) Group 9; (d) Group 10. (Note: the reference compression capacity is show in dotted lines).
As identified in Group 4 results, the compression capacity of the specimen with corrosion surrounding the bolt holes has a considerably lower value than that of the specimen with corrosion in the middle. Hence it can be suggested that the corrosion surrounding the connection is more critical than the corrosion in the middle.
As mentioned in Table 3, Group 5 specimens are designed to examine the impact of the loss of thickness due to corrosion, when the mass loss remains the same. As expected in this analysis, higher amounts of damage could be identified in the specimens where higher thickness losses are applied. A similar variation can be observed in the experimental results of L4(II) and L5(II) specimens by Ozvald and Dunai [20] as well.
According to Group 6 results, it can be observed that the residual compression capacity decreases when the local corrosion location moves from the middle of the specimen to the edge. This gradual decrease in the compression capacity of the specimens can also be observed in the experimental results of L1, L2 and L3 specimens in the study conducted by Ozvald and Dunai [20].
As seen in the results of Group 7 specimens in Figure 9, the perforation has caused a damage percentage of about 32%. However, for the specimens with similar mass loss and uniform corrosion throughout the buckling length, the capacity value is just close to that of the uncorroded specimen. When these two values are compared, it can be suggested that perforation creates a critical impact on the compression strength of the specimen. In specimen 7B, the same mass loss has been provided as local corrosion on the length of 43 mm which is considerably a very low value with respect to the buckling length. In this scenario, the compression capacity has been lower than that of the perforated specimen. Even though the corrosion has not gone throughout the length, the available corrosion spreads through the full width of the specimen to a considerable amount of depth (2 mm), which can be suggested as the reason for this low value. Therefore, it can be suggested that, if the corrosion is distributed through the full width to a large thickness, the damage can be higher than perforation concentrated in a small area.
The numerical results of Group 8 specimens showcase that the specimen with a greater number of perforations with lower diameter has been given a lower compression capacity value than the specimens with a smaller number of perforations with higher diameters. This behavior can also be justified by the area loss of the most critical cross-section. The 8A specimen has the maximum sectional area loss in the middle of the specimens and has given the smallest compression capacity.
According to the results of Group 9, the specimens have showcased a lower compression capacity when the perforation is in the middle and a higher compression capacity when the location of the perforation is close to the edge of the specimen.
In the above results of Group 10 specimens elaborated in Figure 9, the mass loss of the members differs in the order of 10A1 < 10A2 < 10A3 and 10B1 < 10B2 < 10B3. According to the residual capacities, there is a gradual reduction in the compression capacity with the mass loss either it is pitting corrosion or uniform corrosion. When the results of 10A1, 10A2 and 10A3 are compared, respectively, with 10B1, 10B2 and 10B3, it can be observed that always the specimen with pitting corrosion showcases the lesser value of the two, which means that even with the same mass loss, pitting corrosion is more severe than uniform corrosion. In addition to that, the difference between the two values related to pitting corrosion and uniform corrosion increases with the increase in the degree of corrosion, suggesting that mass loss due to pitting corrosion more severely reduces the compression capacity than uniform corrosion.
When the compression capacity of 10A1 and 10C are compared, there is a considerably lower value in 10C than 10A1. This difference implies that the thickness loss due to pitting corrosion is less critical than the same thickness loss within the whole cross-section throughout the specimen.
It can be identified that the local cross-sectional area reduction in the critical section due to pitting corrosion is higher than uniform corrosion with the same degree of corrosion. When the same uniform thickness reduction is applied as in the 10C specimen, the cross-sectional area reduction is more severe than in the above two occasions. The variations in the compression capacity can be justified by the severity of local effects on the most critical cross-section along the specimen.
4. Conclusions
When BS EN 1993-1-1, BS 5950, ASCE 10-15 and ANSI/AISC 360-16 standards are evaluated for estimating the residual compression capacity of corroded angle members, ANSI/AISC 360-16 gives the safest and most conservative values. All four standards give more conservative values when the degree of corrosion and the slenderness ratio increases provided that the corrosion is uniformly distributed over the member. Even though the four standards have showcased acceptable deviations of residual compression capacity values when the concept of thickness reduction is applied, the values are not compatible with the experimental values. Therefore, it is not recommended to use any of these codes to calculate the exact compressive capacities of corroded members.
When the thickness reduction method is applied for the numerical analysis of the corroded members, the results complied with the experimentally tested values. Therefore, it can be concluded that the thickness reduction technique is a viable approach to numerically demonstrate the residual compression capacity of corroded steel angle members.
For uniformly corroded members, the corrosion behavior in the bolted leg, at the corner of the angle and within the bolted area is more critical than in the unbolted leg, at the edge of the width and within the middle area. When there are rapid variations in corrosion legs, the impact on the compression capacity is higher.
In locally corroded members, the corrosion to the edge of the buckling length is more critical than the corrosion in the middle. Finite element analysis results prove that the loss of thickness governs the residual compression capacity if the mass loss due to local corrosion is similar.
When perforated conditions occur due to corrosion, the impact is much more severe than the occurrence of a similar mass loss due to uniform corrosion. The impact of perforation on the residual compression capacity increases when the perforation goes to the middle of the member and creates more cross-section loss at one location.
It can be concluded that mass loss due to pitting corrosion is more critical than mass loss due to uniform corrosion. However, the thickness loss due to uniform corrosion is more critical than the thickness loss due to pitting corrosion.
The findings of this research can be used to visually observe and identify similar corrosion patterns in real structures and directly predict the residual compression capacity without removing or testing the member. Furthermore, the random corrosion patterns also can be evaluated closely, and the corroded areas can be idealized like studied corrosion patterns to predict the strength reduction. For such an evaluation, this type of research is going to be important and convenient. Moreover, the findings of this work are suggested to be used as a framework for further studies and applications.
Author Contributions
Conceptualization, C.R.S.; methodology, C.R.S. and C.S.B.; software, C.R.S.; validation, C.R.S.; formal analysis, C.R.S. and C.S.B.; investigation, C.R.S.; resources, C.R.S. and C.S.B.; data curation, C.R.S.; writing—original draft preparation, C.R.S.; writing—review and editing, C.S.B.; visualization, C.R.S.; supervision, C.S.B. and S.C.S.; project administration, C.S.B. and S.C.S. All authors have read and agreed to the published version of the manuscript.
Funding
This research received no external funding.
Data Availability Statement
The data presented in this study are available in the article and mentioned references.
Acknowledgments
The knowledge shared by all the lecturers in the Department of Civil Engineering in University of Peradeniya is acknowledged. The administrative and technical collaboration of all the fellow staff members of ICB (Pvt) Ltd. is also highly appreciated.
Conflicts of Interest
The authors declare no conflict of interest.
References
- Cantero, D.; Gonzalez, A. Bridge damage detection using weigh-in-motion technology. ASCE J. Bridge Eng. 2015, 20, 04014078. [Google Scholar] [CrossRef]
- Bandara, C.S.; Siriwardane, S.C.; Dissanayake, U.I.; Dissanayake, R. Full range S-N curves for fatigue life evaluation of steels using hardness measurements. Int. J. Fatigue 2016, 82, 325–331. [Google Scholar] [CrossRef]
- Shojai, S.; Schaumann, P.; Braun, M.; Ehlers, S. Influence of pitting corrosion on the fatigue strength of offshore steel structures based on 3D surface scans. Int. J. Fatigue 2022, 164, 107128. [Google Scholar] [CrossRef]
- Han, Q.; Zhao, N.; Xu, J. Recognition and location of steel structure surface corrosion based on unmanned aerial vehicle images. J. Civ. Struct. Health Monit. 2021, 11, 1375–1392. [Google Scholar] [CrossRef]
- Safiuddin, M. Occurrences of corrosion: Causes and prevention. BRAC Univ. J. 2006, III, 71–74. [Google Scholar]
- Wang, R.; Guo, H.; Shenoi, R.A. Experimental and numerical study of localized pitting effect on compressive behavior of tubular members. Mar. Struct. 2020, 72, 102784. [Google Scholar] [CrossRef]
- Aghoury, I.M.E. Numerical Tool for Fatigue Life Prediction of Corroded Steel Riveted Connections Using Various Damage Models. Ph.D. Thesis, Ain Shams University, Cairo, Egypt, April 2012. [Google Scholar]
- Abdulla, W.; Menzemer, C. Finite element analysis of heavy-duty riveted steel grating bridge deck. CivilEng 2021, 2, 485–501. [Google Scholar] [CrossRef]
- Shaheen, M.A.; Galal, M.A.; Cunningham, L.S.; Foster, A.S. New technique to improve the ductility of steel beam to column bolted connections: A numerical investigation. CivilEng 2021, 2, 929–942. [Google Scholar] [CrossRef]
- Leroux, P. Pitting Corrosion Measurement Using 3D Profilometry; Nanovea: Irvine, CA, USA, 2014. [Google Scholar]
- Xiao, L.F.; Peng, J.X.; Zhang, J.R. Mechanical properties of corroded high performance steel specimens based on 3d scanning. Adv. Steel Constr. 2019, 15, 129–136. [Google Scholar]
- Andrade, C.; Alonso, C. Test methods for on-site corrosion rate measurement of steel reinforcement in concrete by means of the polarization resistance method. Mater. Struct. 2004, 37, 623–643. [Google Scholar] [CrossRef]
- Chaminda, S.S.; Ohga, M.; Dissanayake, R.; Taniwaki, K. Different approaches for remaining fatigue life estimation of critical members in railway bridges. Steel Struct. 2007, 7, 263–276. [Google Scholar]
- Ostapenko, A.; Berger, T.W.; Chambers, S.L.; Hebor, M.F. Corrosion Damage Effect on Strength of Tubular Columns with Patch Corrosion; ATLSS: Bethlehem, Palestine, 1996. [Google Scholar]
- Hebor, M.F.; Ricles, J.M. Local buckling strength of patch corrosion damaged steel tubular bracing. Int. J. Steel Struct. 2002, 2, 59–70. [Google Scholar]
- Nazari, M.; Khedmati, M.R.; Khalaj, A.F. A numerical investigation into ultimate strength and buckling behavior of locally corroded steel tubular members. Lat. Am. J. Solids Struct. 2014, 11, 1063–1076. [Google Scholar] [CrossRef]
- Ahn, J.H.; Choi, W.R.; Jeon, S.H.; Kim, S.H.; Kim, I.T. Residual compressive strength of inclined steel tubular members with local corrosion. Appl. Ocean Res. 2016, 59, 498–509. [Google Scholar] [CrossRef]
- Shu, Q.; Wang, K.; Yuan, G.; Zhang, Y.; Lu, L.; Liu, Z. Assessing capacity of corroded angle members in steel structures based on experiment and simulation. Constr. Build. Mater. 2020, 244, 118210. [Google Scholar] [CrossRef]
- Beaulieu, L.V.; Legeron, F.; Langlois, S. Compression strength of corroded steel angle members. J. Constr. Steel Res. 2010, 66, 1366–1373. [Google Scholar] [CrossRef]
- Ozvald, K.; Dunai, L. Effect of corrosion on the buckling of steel angle members. Period. Polytech. Civ. Eng. 2012, 56, 175–183. [Google Scholar] [CrossRef]
- Chen, Z.; Li, J.; Liu, Y.; Wang, Y. Experimental study on axial compression behavior of square steel columns with artificial corrosion damage. J. Constr. Steel Res. 2017, 134, 78–86. [Google Scholar]
- BS5950-1; Structural Use of Steelwork in Building—Part 1: Code of Practice for Design Rolled and Welded Sections. British Standards Institution: London, UK, 2000.
- BS EN1993-1; Design of Steel Structures—Part 1: Design of Steel Structures. British Standards Institution: London, UK, 2000.
- ANSI/AISC 360-16; Specification for Structural Steel Buildings. American Institute of Steel Construction: Chicago, IL, USA, 2016.
- ASCE 10-15; Design of Latticed Steel Transmission Structures. American Society of Civil Engineering: Reston, VI, USA, 2015.
Disclaimer/Publisher’s Note: The statements, opinions and data contained in all publications are solely those of the individual author(s) and contributor(s) and not of MDPI and/or the editor(s). MDPI and/or the editor(s) disclaim responsibility for any injury to people or property resulting from any ideas, methods, instructions or products referred to in the content. |
© 2023 by the authors. Licensee MDPI, Basel, Switzerland. This article is an open access article distributed under the terms and conditions of the Creative Commons Attribution (CC BY) license (https://creativecommons.org/licenses/by/4.0/).