Article

Consideration of Unidirectional Cyclic Loading on Bond in Reinforced Lightweight Concrete in Standards

1
Department of Construction Materials and Technologies, Budapest University of Technology and Economics, Műegyetem rkp. 3, 1111 Budapest, Hungary
2
Department of Structural Engineering, Budapest University of Technology and Economics, Műegyetem rkp. 3, 1111 Budapest, Hungary
*
Author to whom correspondence should be addressed.
CivilEng 2023, 4(1), 68-82; https://doi.org/10.3390/civileng4010006
Submission received: 15 September 2022 / Revised: 27 December 2022 / Accepted: 13 January 2023 / Published: 20 January 2023
(This article belongs to the Special Issue Advances in Steel-Concrete Composite Structures)

Abstract

:
The present research deals with the cyclic and standard pull-out resistance of deformed steel bars embedded in lightweight and normal concrete. This paper is a continuation of a previous paper, where the experimental results are detailed. In the present paper, the experimental results are set against the formulas and the diagrams provided by the Eurocode standard and the Model Code 1990, and then a comparative discussion is performed. In the case of cyclic loading, the damage defined by the Palmgren–Miner hypothesis, as well based on the recommendations of various national annexes of Eurocode and the Model Code, is calculated. A multiplier corresponding to the maximum load is calculated, which indicates by how much the applied load should be multiplied to obtain a damage value equal to 1.

1. Introduction

The interaction of steel and concrete in a reinforced concrete member is a widely studied area that has inspired numerous researchers [1,2,3,4]. This interaction is mostly described by the bond strength–slip relation of the concrete and the reinforcing bar. There are many parameters that have an effect on this interaction [1]. However, most of the researches deal with the bond strength in ordinary concrete, and there is only a limited number of studies dealing with the bond behavior in lightweight concrete [5,6,7]. Refs. [8,9] investigated in detail the substitution of normal-weight aggregate with lightweight aggregate, but they did not test their specimen for cyclic loading. It was observed that the compressive strength and the bond strength of concrete decreased with the increase in lightweight aggregate content. Besides this, the bond strength decreased in proportion to the decrease in the density of the samples; thus, these two factors cannot be separated from each other. In the present research, the effect of lightweight aggregate and cyclic loading on bonds is considered. In [10], it was found that the lightweight concrete–steel bond strength was 35% greater than the ordinary concrete–steel bond strength for plain bars, while, in the case of deformed steel bars, the performance of the ordinary concrete was better. The composition of the compared recipes was identical, and only the aggregate was changed. Because of this, the strength of LWAC was lower than the strength of NWC. In [10], cyclic loading was applied as a constant-amplitude load in every cycle, while, in our study, the load level was increased step by step, similarly to [11,12]. However, in these studies, heavyweight concrete or complete structures were investigated, rather than lightweight concrete. Similar studies were conducted on lightweight aggregate concretes by [8,13], who investigated the replaceability of the steel bars with FRP. There are different approaches based on which the bond strength can be determined. In [14], a cyclic beam bending test is used for this purpose. In [15], a novel calculation method is introduced to determine the bond strength from the maximum pull-out force. In our investigations, the recommendation of [16] is used for the test setup and for the calculation of the bond strength. The recommendations of [16] are only valid for non-cracked concrete samples; for cracked concrete, the approach presented in [17] can be used. For practising designers, considering these effects in standards is of great significance. In [18], it is highlighted that the consideration of bond strength in the Canadian standard should be modified in the case of high-strength concretes. These bending tests are important from the point of view of practical design, but uniaxial tension is also necessary to understand the material behavior. For static calculations, the input data are the strength classes of concrete. Thus, a test where concrete compositions of the same strength class but with different aggregates are tested is the most useful. The calculation of the bond strength of normal concrete is relatively well covered in the standards, but the effect of cyclic loading (in the case of a pull-out test) is not included. For lightweight concretes, even less information is available; meanwhile, their application is becoming more and more widespread. In the present paper, the different calculation methods of bond strength in various standards are reviewed and compared to experimental results for lightweight and normal concretes.

2. Materials and Methods

In this section, the results of our research are summarized, and they can be found in detail in [1]; below, a short summary is given about the tests and their results. The aim of the research was to investigate the effect of lightweight concrete on the standard and cyclic bond strength. Lightweight and normal-weight concrete samples were cast. Between the mixes of the two concretes, the only difference was the type of coarse aggregate, which was changed from quartz to Liapor HD 7N-type expanded clay. The applied type and amount of cement, fine aggregate and water-to-cement ratio were the same for both mixes. It is important that the strength class (C or LC) is the same for the compared mixes and the density of the LWAC is above 1600 kg/m3, because then it can be calculated according to EC 2. The introduction of Liapor in the mix reduced the density from 2357 kg/m3 to 1770 kg/m3. At least three specimens were cast for each test from both materials. The pull-out tests were completed on a Zwick/Roell Z400 testing machine with a 0.005 mm/s loading rate. The displacement of the steel bar inside the concrete sample was measured with inductive transmitters. Two transmitters were placed on the unloaded surface and two on the loaded surface of the concrete test cube. A Ø8 standard ribbed reinforcing bar was placed at the center of the 150 × 150 × 150 mm cube specimens and was pulled out during the test. The effect of different rib configurations is detailed in [19]. First, the compressive and the splitting tensile strength of the two concretes were determined by standard tests. The compressive strength was measured on four (LWAC) and five (NWC) 150 × 150 × 150 mm cubes, and the splitting tensile strength on three 300 × 150 mm cylinders. As shown in Table 1, the compressive strength was 20% smaller in the case of the lightweight concrete, and the tensile strength of normal concrete was 29% higher.
The standard monotonic pull-out tests were performed following the recommendations of the International Federation for Structural Concrete [16,20,21]. During the pull-out test, the loading force and the relative displacements were monitored and the bond stress was calculated as follows [22]:
τ b = F π · · l b · 2 · ( d 1 + d 2 ) d 1 + 2 · d 2
where:
  • F is the pull-out force;
  • lb is the bonding length;
  • is the diameter of the reinforcing bar;
  • π is a constant (=3.14);
  • d1 is the displacement on the loaded end of the bonded length (after subtraction of the elongation of the steel bar);
  • and d2 is the displacement on the unloaded end of the bonded length.
The test was completed for normal and lightweight concrete specimens and the results were concluded as follows (see Figure 1):
  • the phenomenon was similar in both cases;
  • the bond stress of the normal concrete was higher (on average, approximately 5 N/mm 2 );
  • the slip at the unloaded end was in the range of 0.5–1.0 mm for both concretes;
  • the initial slope of the τ b s diagram was higher in case of the normal concrete;
  • the residual stresses were in the range of 5–10 N/mm2 for both concretes.
The bond strength of lightweight concrete was found to be 24% lower compared to the normal concrete, and the normal concrete showed larger standard deviations in the case of bond strength. It could also be observed that the lightweight to normal concrete ratio of the bond strength occurred between the values corresponding to the compressive strength and tensile strength. In the literature, the bond strength is considered to be proportional to the tensile strength. The experiments showed a higher ratio in the case of bond strength (than in the case of tensile strength), which can be explained by the different contact zones between the steel and the aggregates of normal and lightweight concrete.
Lastly, the cyclic pull-out tests were performed. Cyclic loading was applied as a proportion of the maximum loading capacity (see [1]), and the relative displacements were analyzed in each cycle. During the cyclic tests, the following intended numbers of cycles were applied at load levels corresponding to the given ratios of the maximum load attained for the standard pull-out tests:
  • at 43% (8594 kN): 3;
  • at 56% (11,172 N): 3;
  • at 69% (13,750 N): 5;
  • at 77% (15,468 N): 5;
  • at 86% (17,187 N): 10;
  • at 93% (18,500 N): 20 (if any);
  • at 100% (20,000 N): 20 (if any).
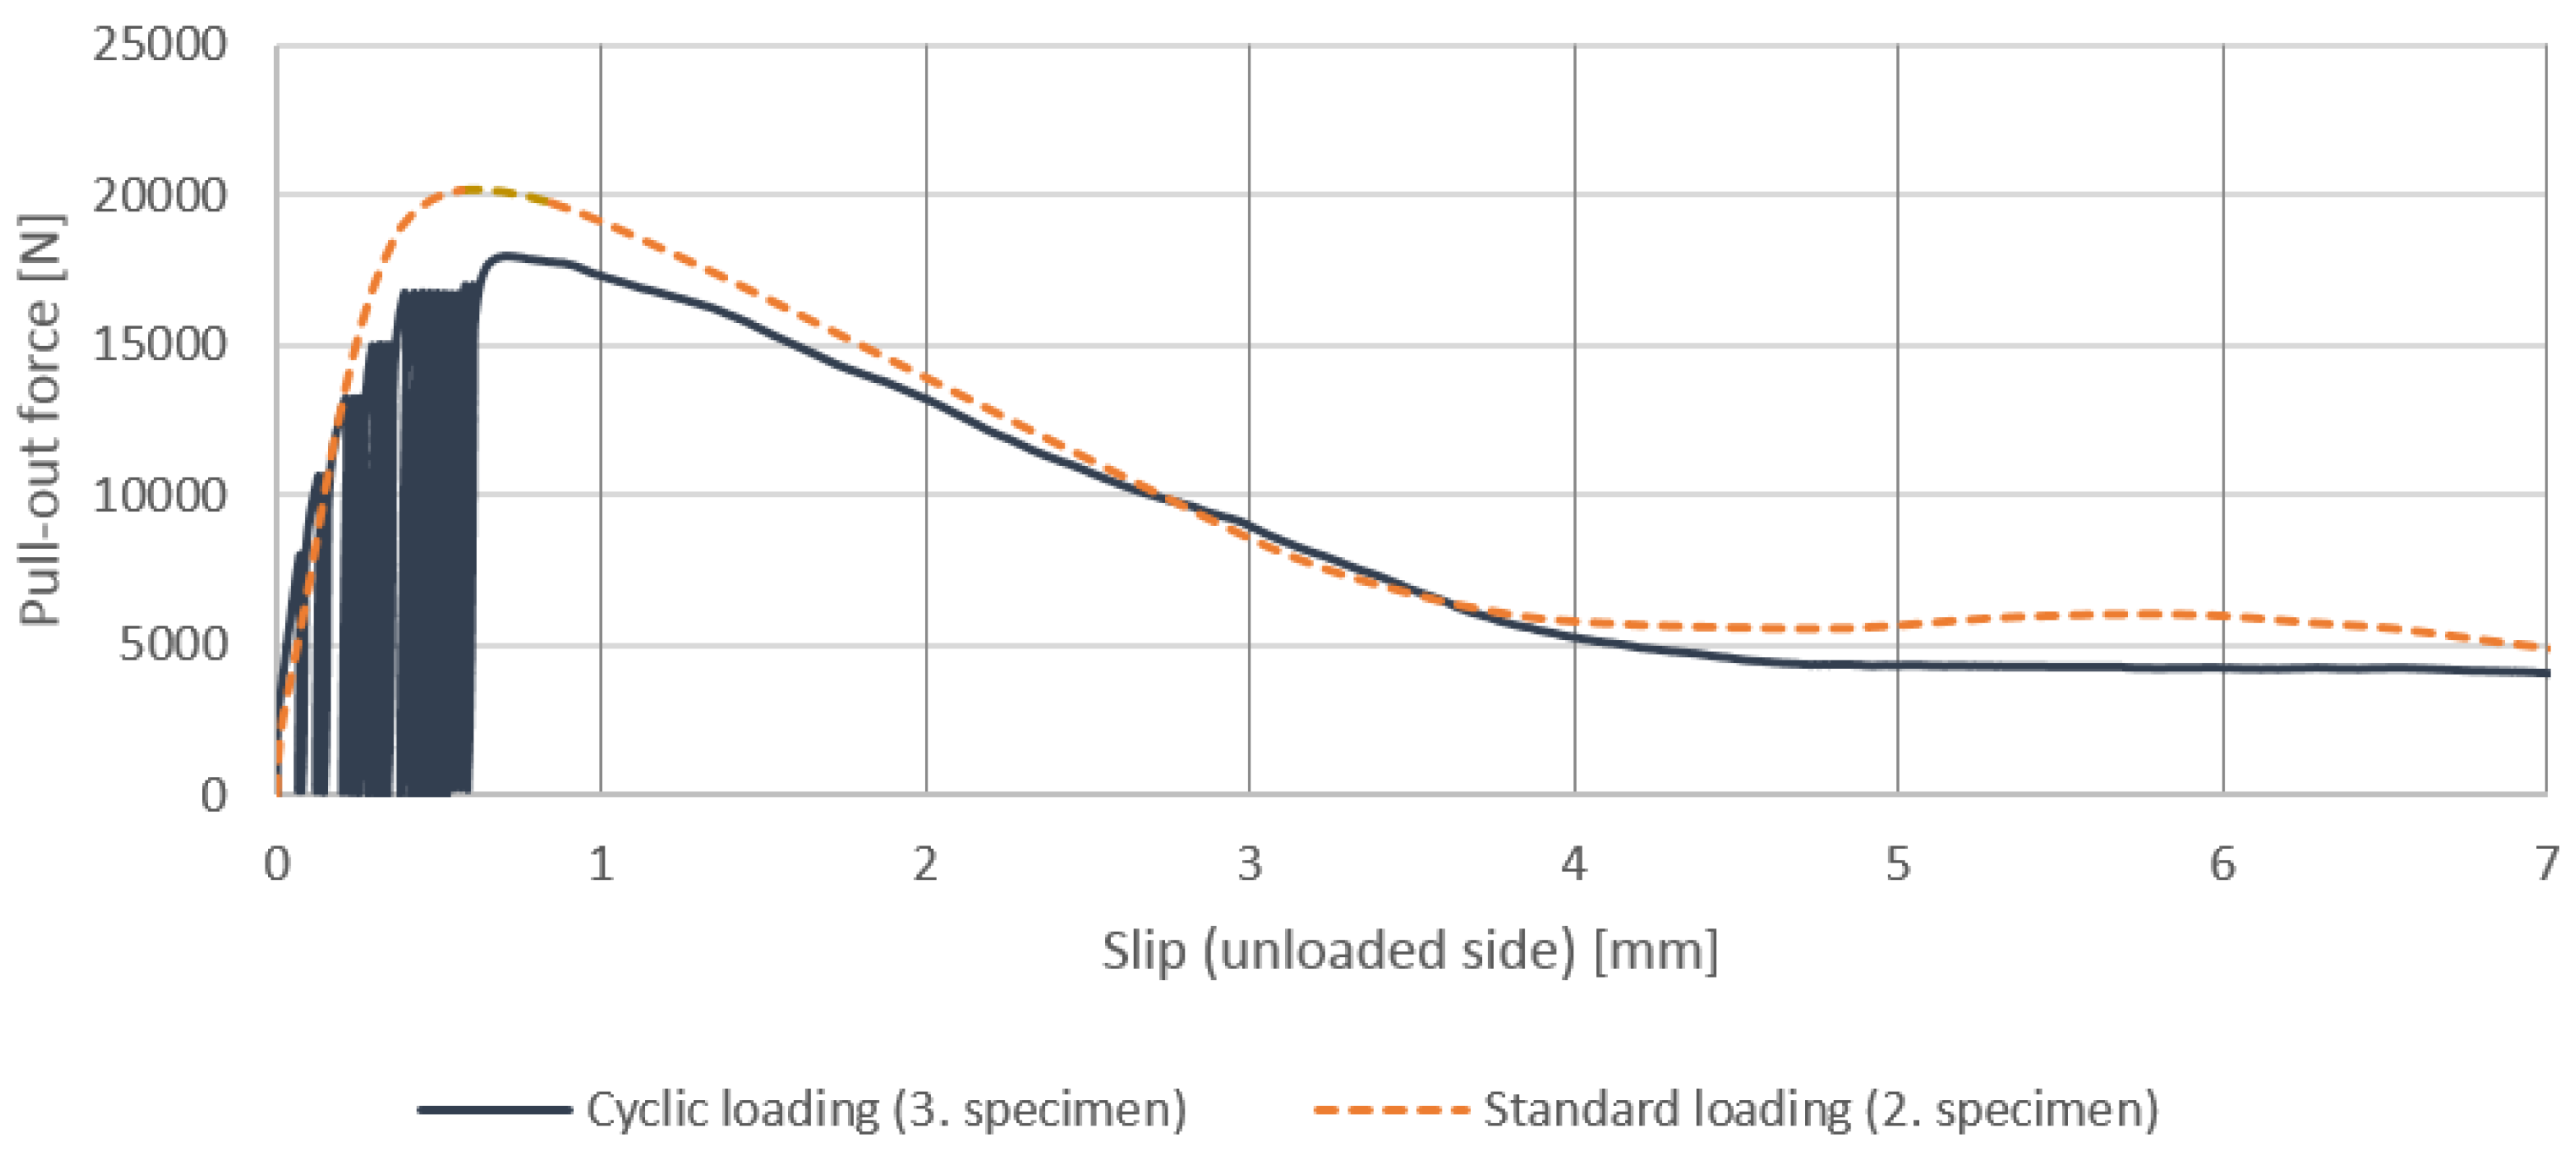
Based on the results, the following conclusions could be drawn (see Figure 2):
  • For both concretes, the envelope curve of the cyclic loading was similar to the standard pull-out test, but in the case of the maximum load-bearing capacity, significant differences were observed. In conclusion, it could be stated that the envelope curve of the cyclic load always remained below the diagram of the corresponding standard pull-out test. In the case of normal concrete, the envelope curve ran closer to the standard diagram.
  • At the unloaded end, until a given load level, no displacement was observed.
  • It could be seen for the lightweight concrete that always the first cycle of the given load level produced the largest slip. After the first one, the cycles following under a given load level were similar to each other.
  • The descending part of the cyclic load curve was similar to the standard one, as can be seen in Figure 2. This similarity is not surprising if considering that only the coarse aggregate fraction differed between the LWAC and NWC mixes and that the average density of LWAC (1770 kg/m3) was not too far below that of NWC [1]. This may indicate that simply changing the normal-weight coarse aggregate to a lightweight one does not influence the softening branch in the bond stress–slip curve so intensively as expected for usual LWAC (of less density) and also that the ductility in the bond is linked more to the paste rather than simply to the type of coarse aggregate.
  • In the case of the normal concrete specimens, it was observed that the specimens could resist a maximum 26,000 N load multiple times without failure. This was due to the short time period, which was insufficient for the development of microcracks. It could lead us to the conclusion that the applicable number of cycles was a function of the loading rate; if one decreases the loading rate, the number of cycles (necessary for the failure) decreases in the case of the same concrete.
  • Similar to lightweight concrete, for normal concrete, the first cycle of the given load level always produced the largest slip. However, after the first cycle, the following cycles in a given load level always became smaller and smaller. This was true only until the maximum bond stress was reached; after this, the first loop under the given load level became the smallest.
  • The slip belonging to the maximum bond stress shifted relative to the standard diagram.
  • The residual bond stress and the descending part of the diagrams were not affected by the loading scenario; they were similar to the standard diagram.
  • The slope of the (re)loading paths was always the same, independently of the load level.
  • The cyclic pull-out test caused plastic displacements (for both normal and lightweight concrete).
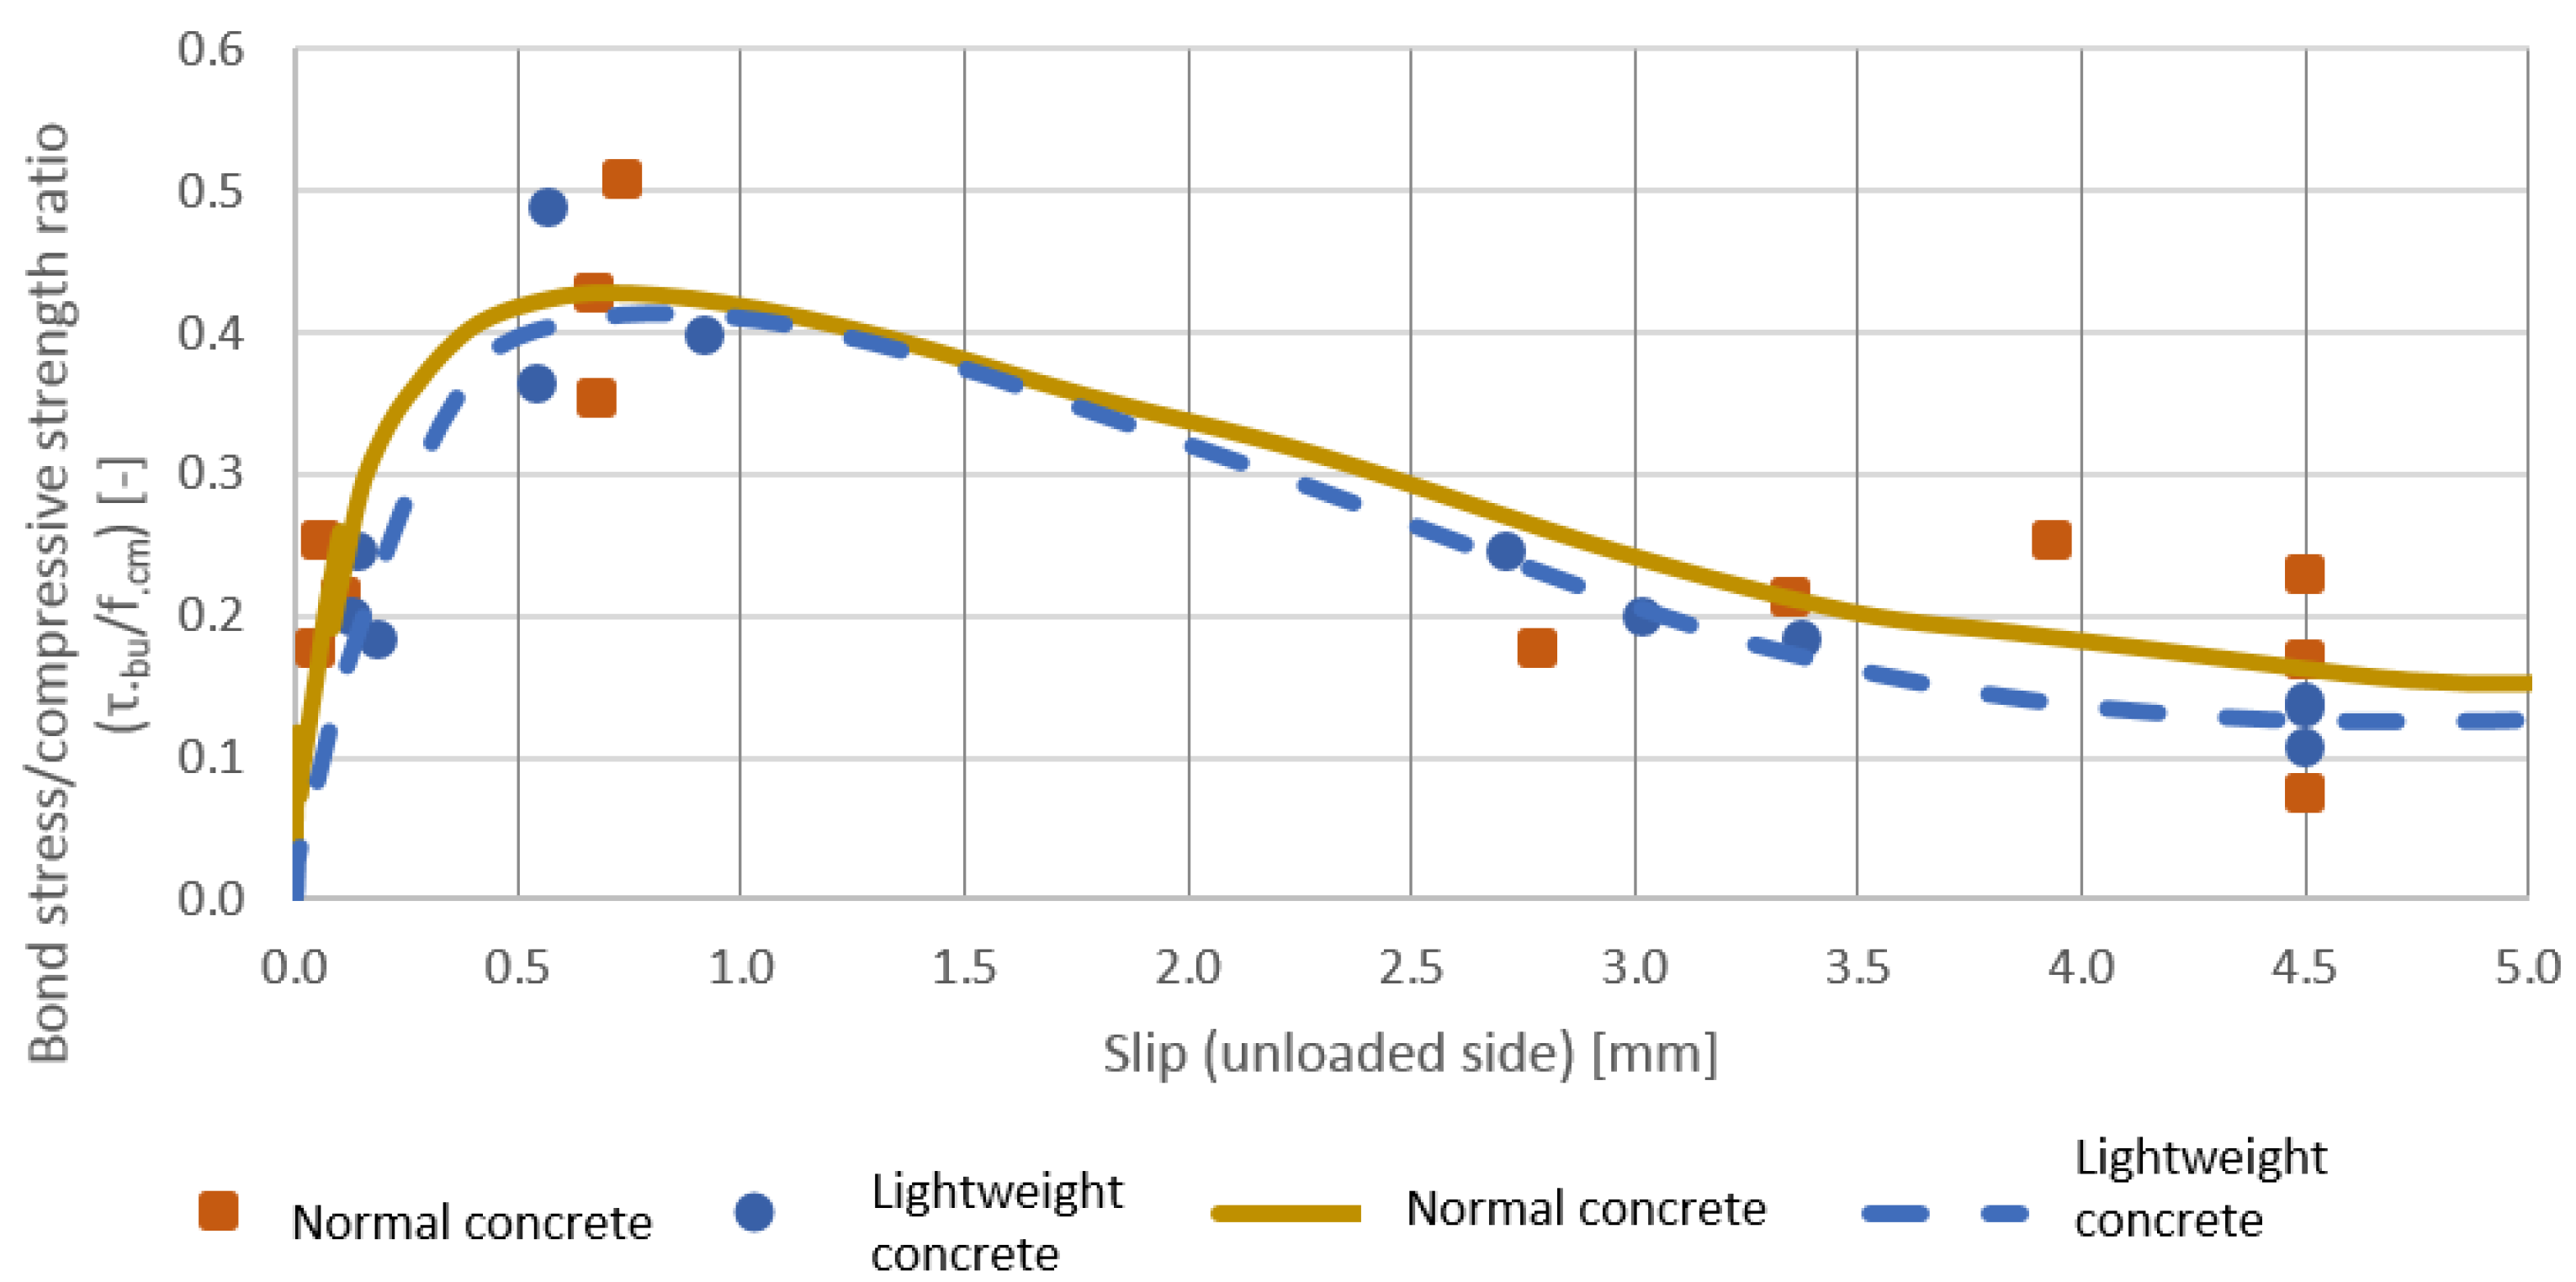
The results of the standard tests for lightweight and normal concrete were compared to each other in the second part of [1]. The comparison of two concretes with a different type of aggregate was a challenging task. As was expected, the normal concrete had higher bond strength values and performed better in the pull-out test. The comparison of the two materials in the case of the standard pull-out test focused on specific characteristic points, such as the maximum bond stress, the half of the maximum stress on the ascending and the descending part of the curve, and the stress belonging to the 4.5 mm slip value to represent the residual stress. (The value of the slip was chosen arbitrarily based on the figures).
Based on Figure 3, the following observations could be made:
  • in the case of bond stress, the normal concrete had a larger standard deviation;
  • the initial slope of the diagram was smaller in the case of the lightweight concrete;
  • the average curve of the normal concrete always enveloped the curve of the lightweight concrete, but the difference between the two curves was quite small; this indicated that the energy absorption capacity of the normal concrete was higher;
  • the difference in the maximum stress was less than 3%;
  • the fact that the lightweight concrete reached a given stress level at a larger slip than normal concrete indicated less favorable behavior in serviceability limit states.
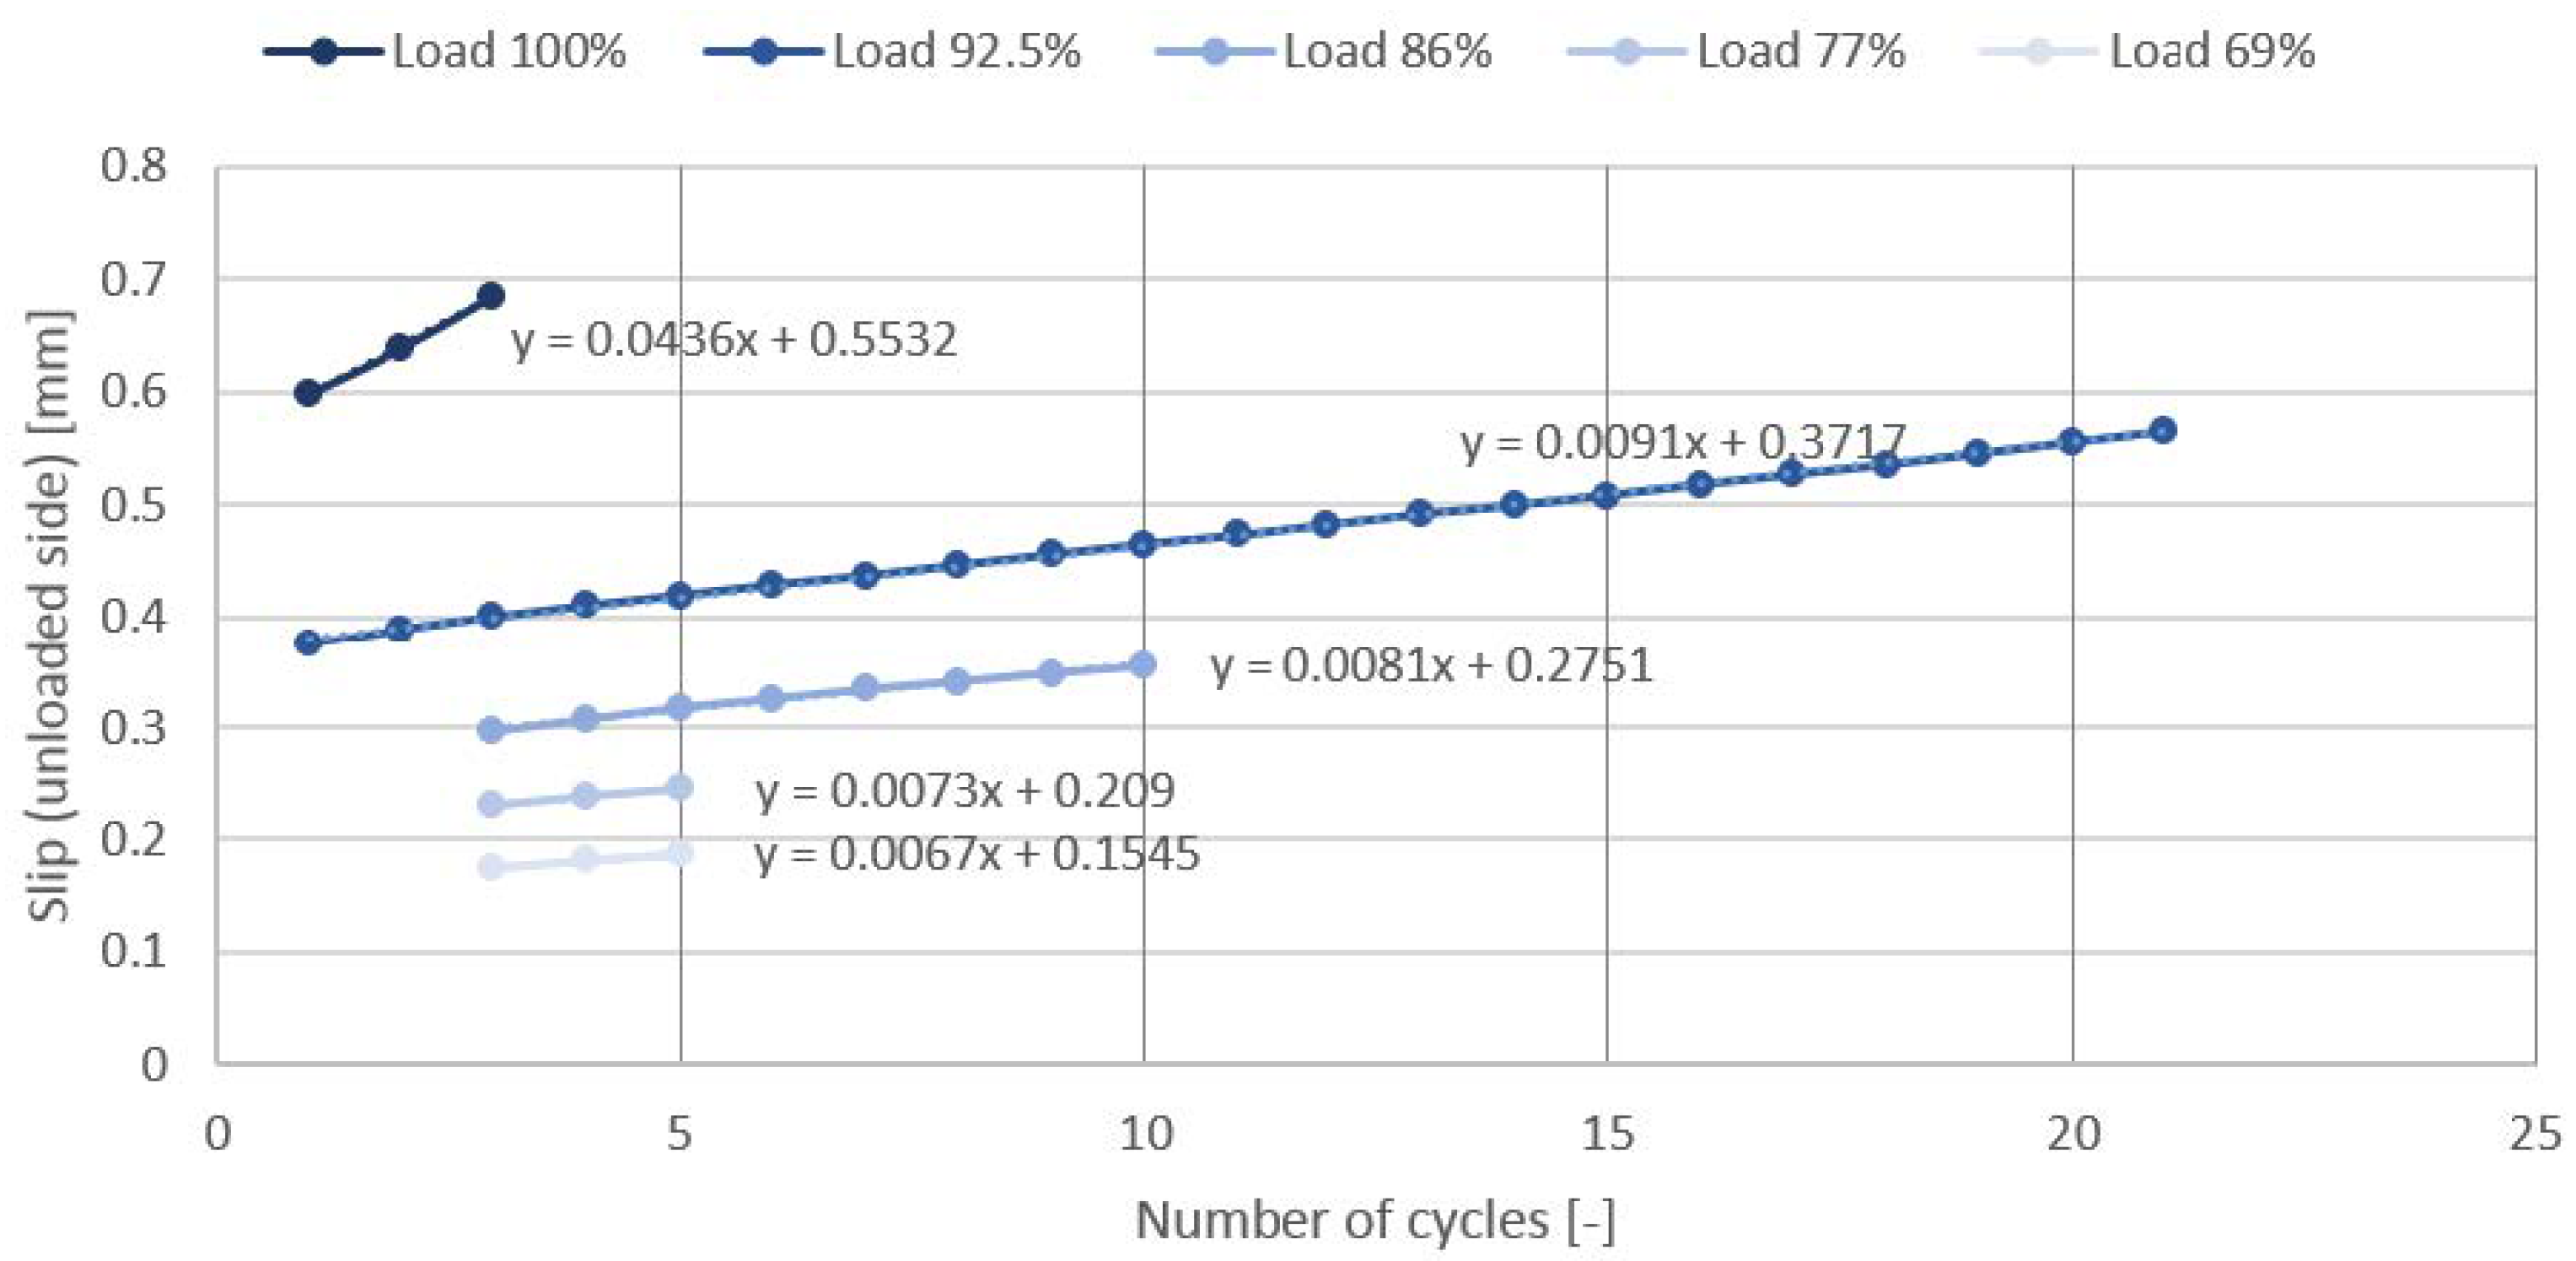
For the comparison of the two materials in the case of the cyclic pull-out tests, the Balázs [23] principle was used, which states linear damage development with the cycle number until the maximum point of the envelope curve. Based on the literature, the maximum number of cycles can be approximated, which belongs to this maximum point, as can be seen in Figure 4.
The figure shows that the higher the load, the steeper the slope of the lines, as was already observed on the bond stress–slip diagrams. Based on the parameters of the lines, the maximum number of cycles can be calculated, and the fatigue curve can be drawn.
As final conclusions of [1], the following observations were described:
  • The standard pull-out test did not show a significant difference between the normal and lightweight aggregate concrete mixes until the maximum bond stress was reached. After this, the difference remained small and, in contrast to our expectations, the lightweight concrete did not show a more rigid behavior.
  • The bond stress–slip curve of the standard pull-out test enveloped properly the same curve of the cyclic pull-out test for both concrete types.
  • Both concrete mixes were able to resist the maximum pull-out force multiple times in the case of cyclic loading. This was possible because there was no time for the formation/further development of cracks or the rearrangement of the stresses. In the case of cyclic loading, not only the loading rate is important, but the time for which the maximum load was applied on the sample also influenced the results.
  • In the case of low cycle number fatigue, there was no significant difference in the pull-out bond test results of the normal and lightweight aggregate concrete.

3. Results and Discussion

3.1. Standard Pull-Out Test

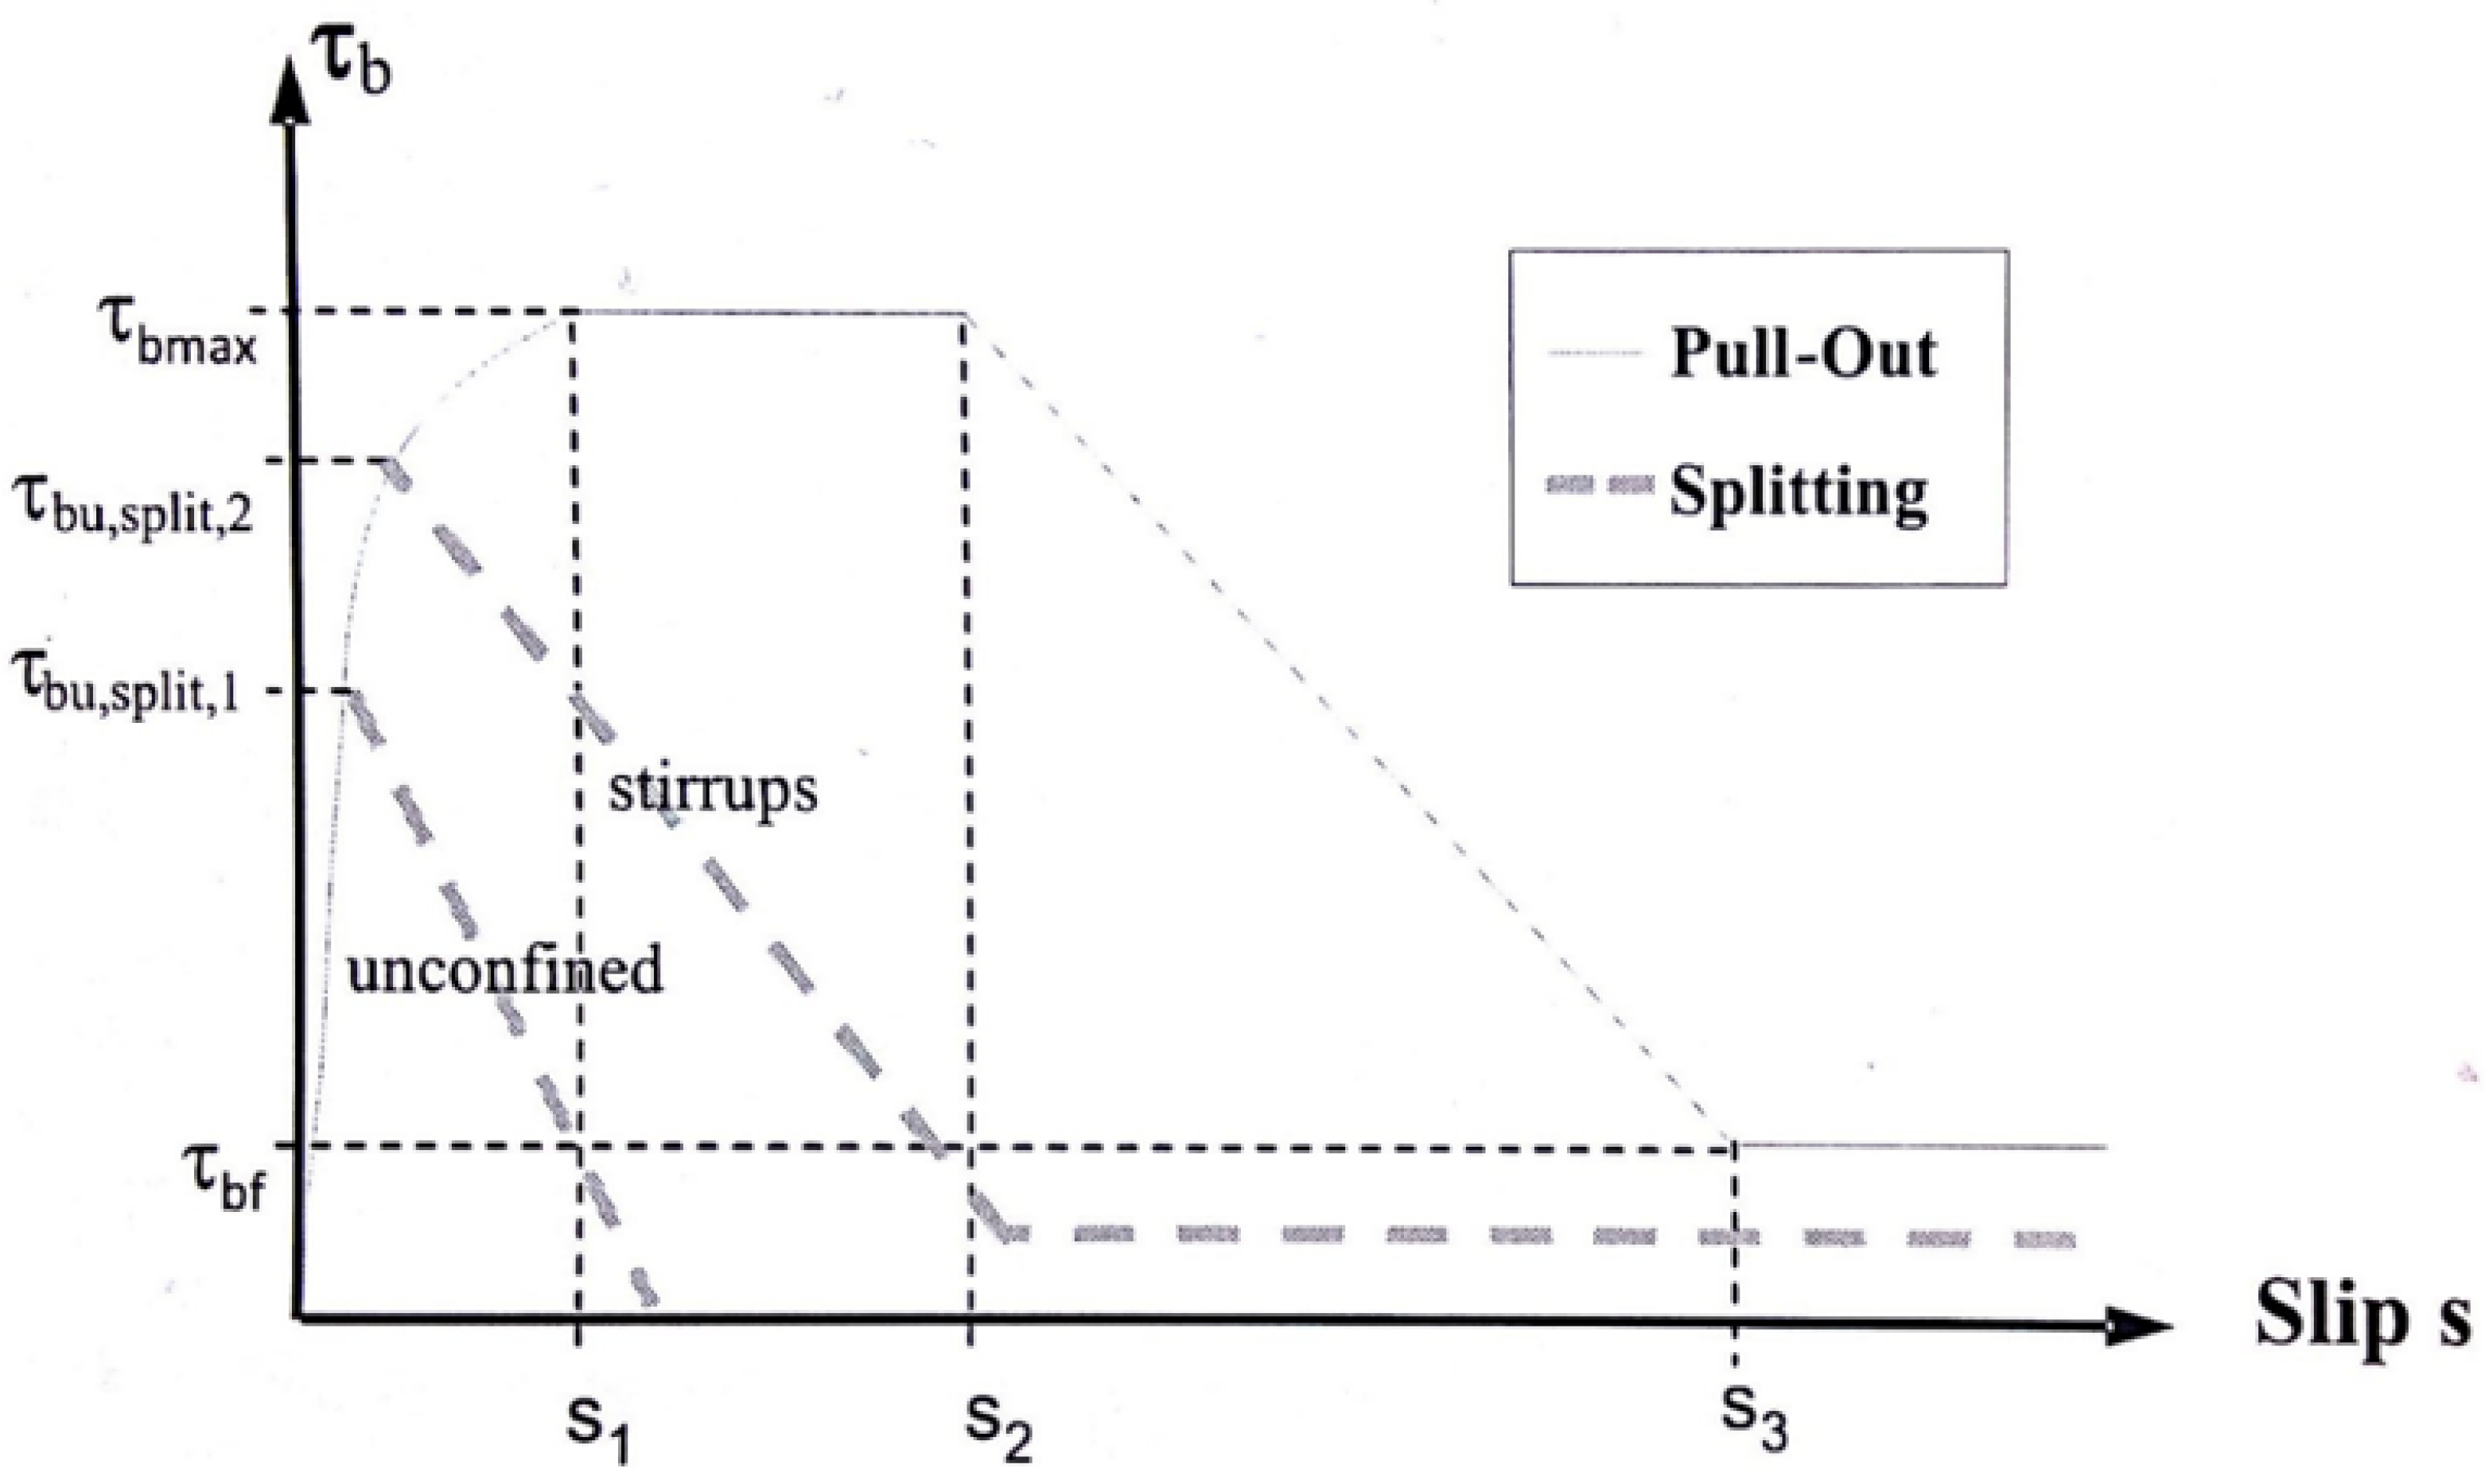
The results of the experiments are compared to the corresponding formulae of the MSZ EN 1992-1:2002 [21] and the fib Model Code 1990 [16] and 2010 [20]. In the later part of the present paper, we refer to them as standards for simplification. First, the compressive and tensile strength results were inserted into the expressions of the standards, and, based on them, the concretes were classified. The concrete mix with lightweight aggregate falls into the LC25/28 class, while the reference mix falls within the C25/30 class. As a next step, the bond stress–slip relations of the standard pull-out tests were compared to the recommendations of the standards. The Model Code 1990 represents two failure behaviors, namely the pull-out of the reinforcement bar and the splitting of the concrete, as can be seen in Figure 5. The figure distinguishes four major sections of the slip range. The first is a quadratic curve and then a constant plateau, followed by a linearly decreasing part and a constant section representing residual bond strength.
Figure 5 is described by the following expressions:
τ b = τ b , m a x ( s s 1 ) α 0 s s 1
τ b = τ b , m a x s 1 s s 2
τ b = τ b , m a x ( τ b , m a x τ b f ) ( s s 2 ) / ( s 3 s 2 ) s 2 s s 3
τ b = τ b f s 3 s
where:
  • τ b , m a x : maximum bond stress τ b , m a x = 2 . 5 × ( f c m ) ;
  • τ b , f : residual bond stress τ b , f = 0.40 × τ b , m a x ;
  • s 1 , s 2 , s 3 : slip values separating the slip ranges s 1 = 1 mm;
  • s 2 = 2 or 3 mm (3 mm in Model Code 1990; 2 mm in Model Code 2010);
  • s 3 = c c l e a r clear distance between the ribs;
  • α : constant α = 0.4 .
The experimental results based on the Model Code in tabulated form can be seen in Table 2.
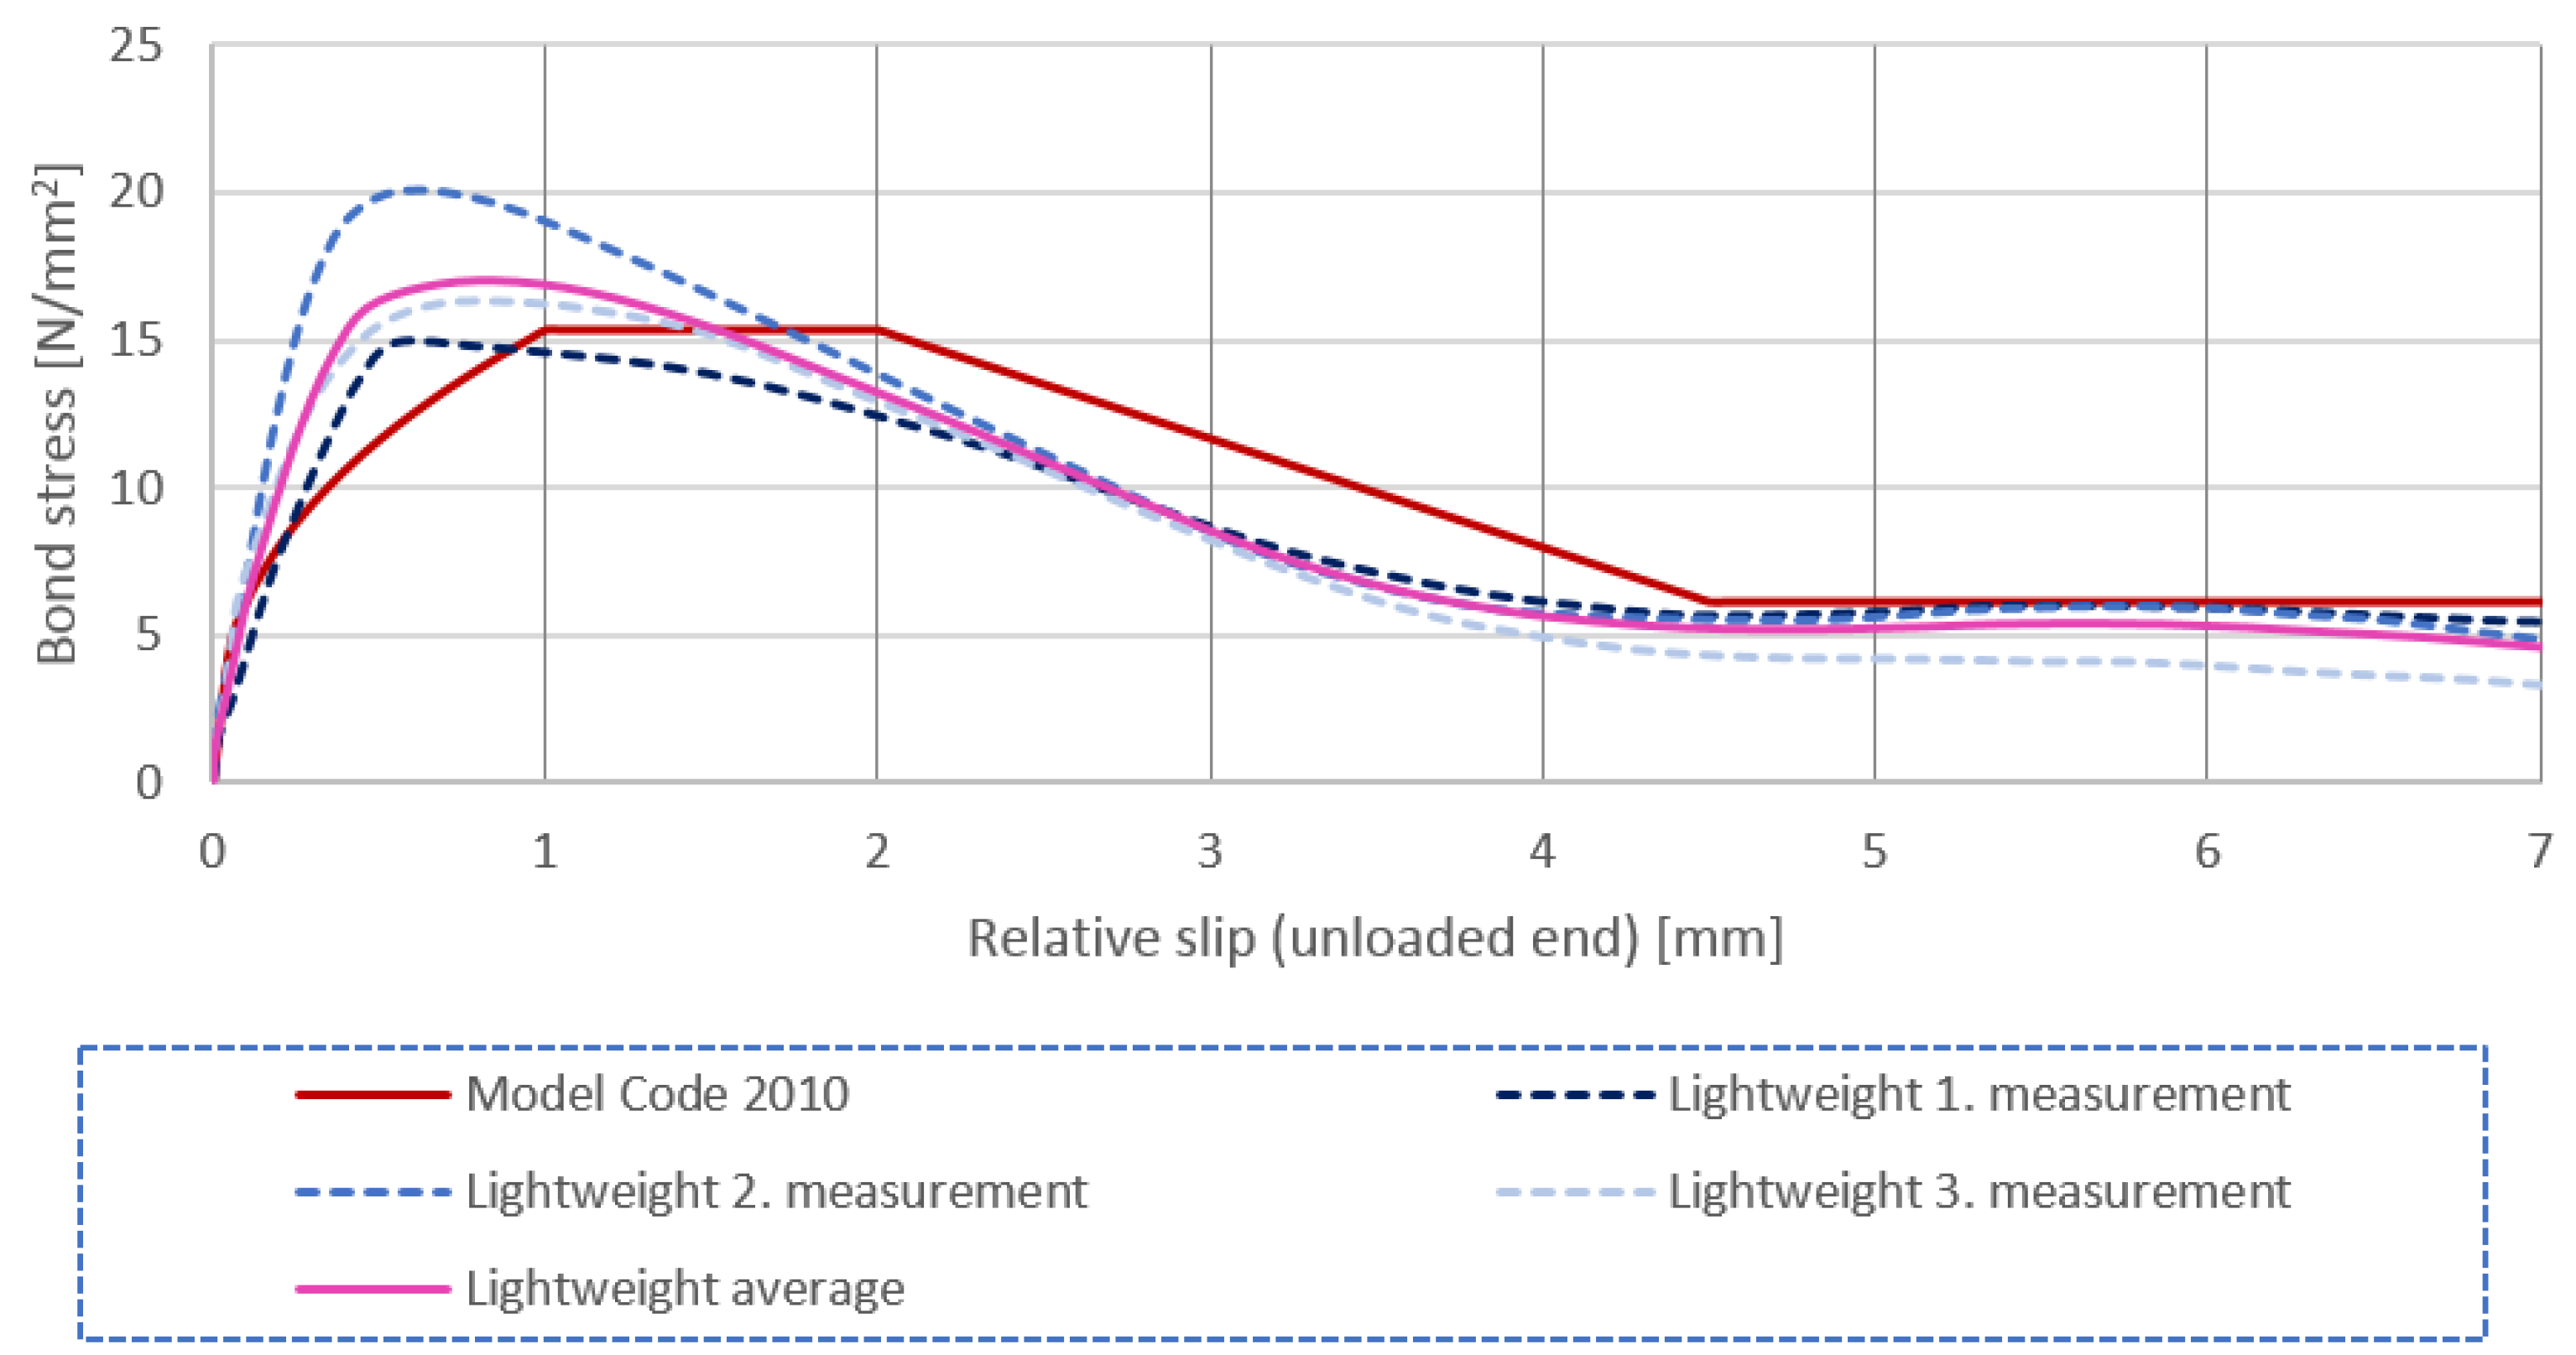
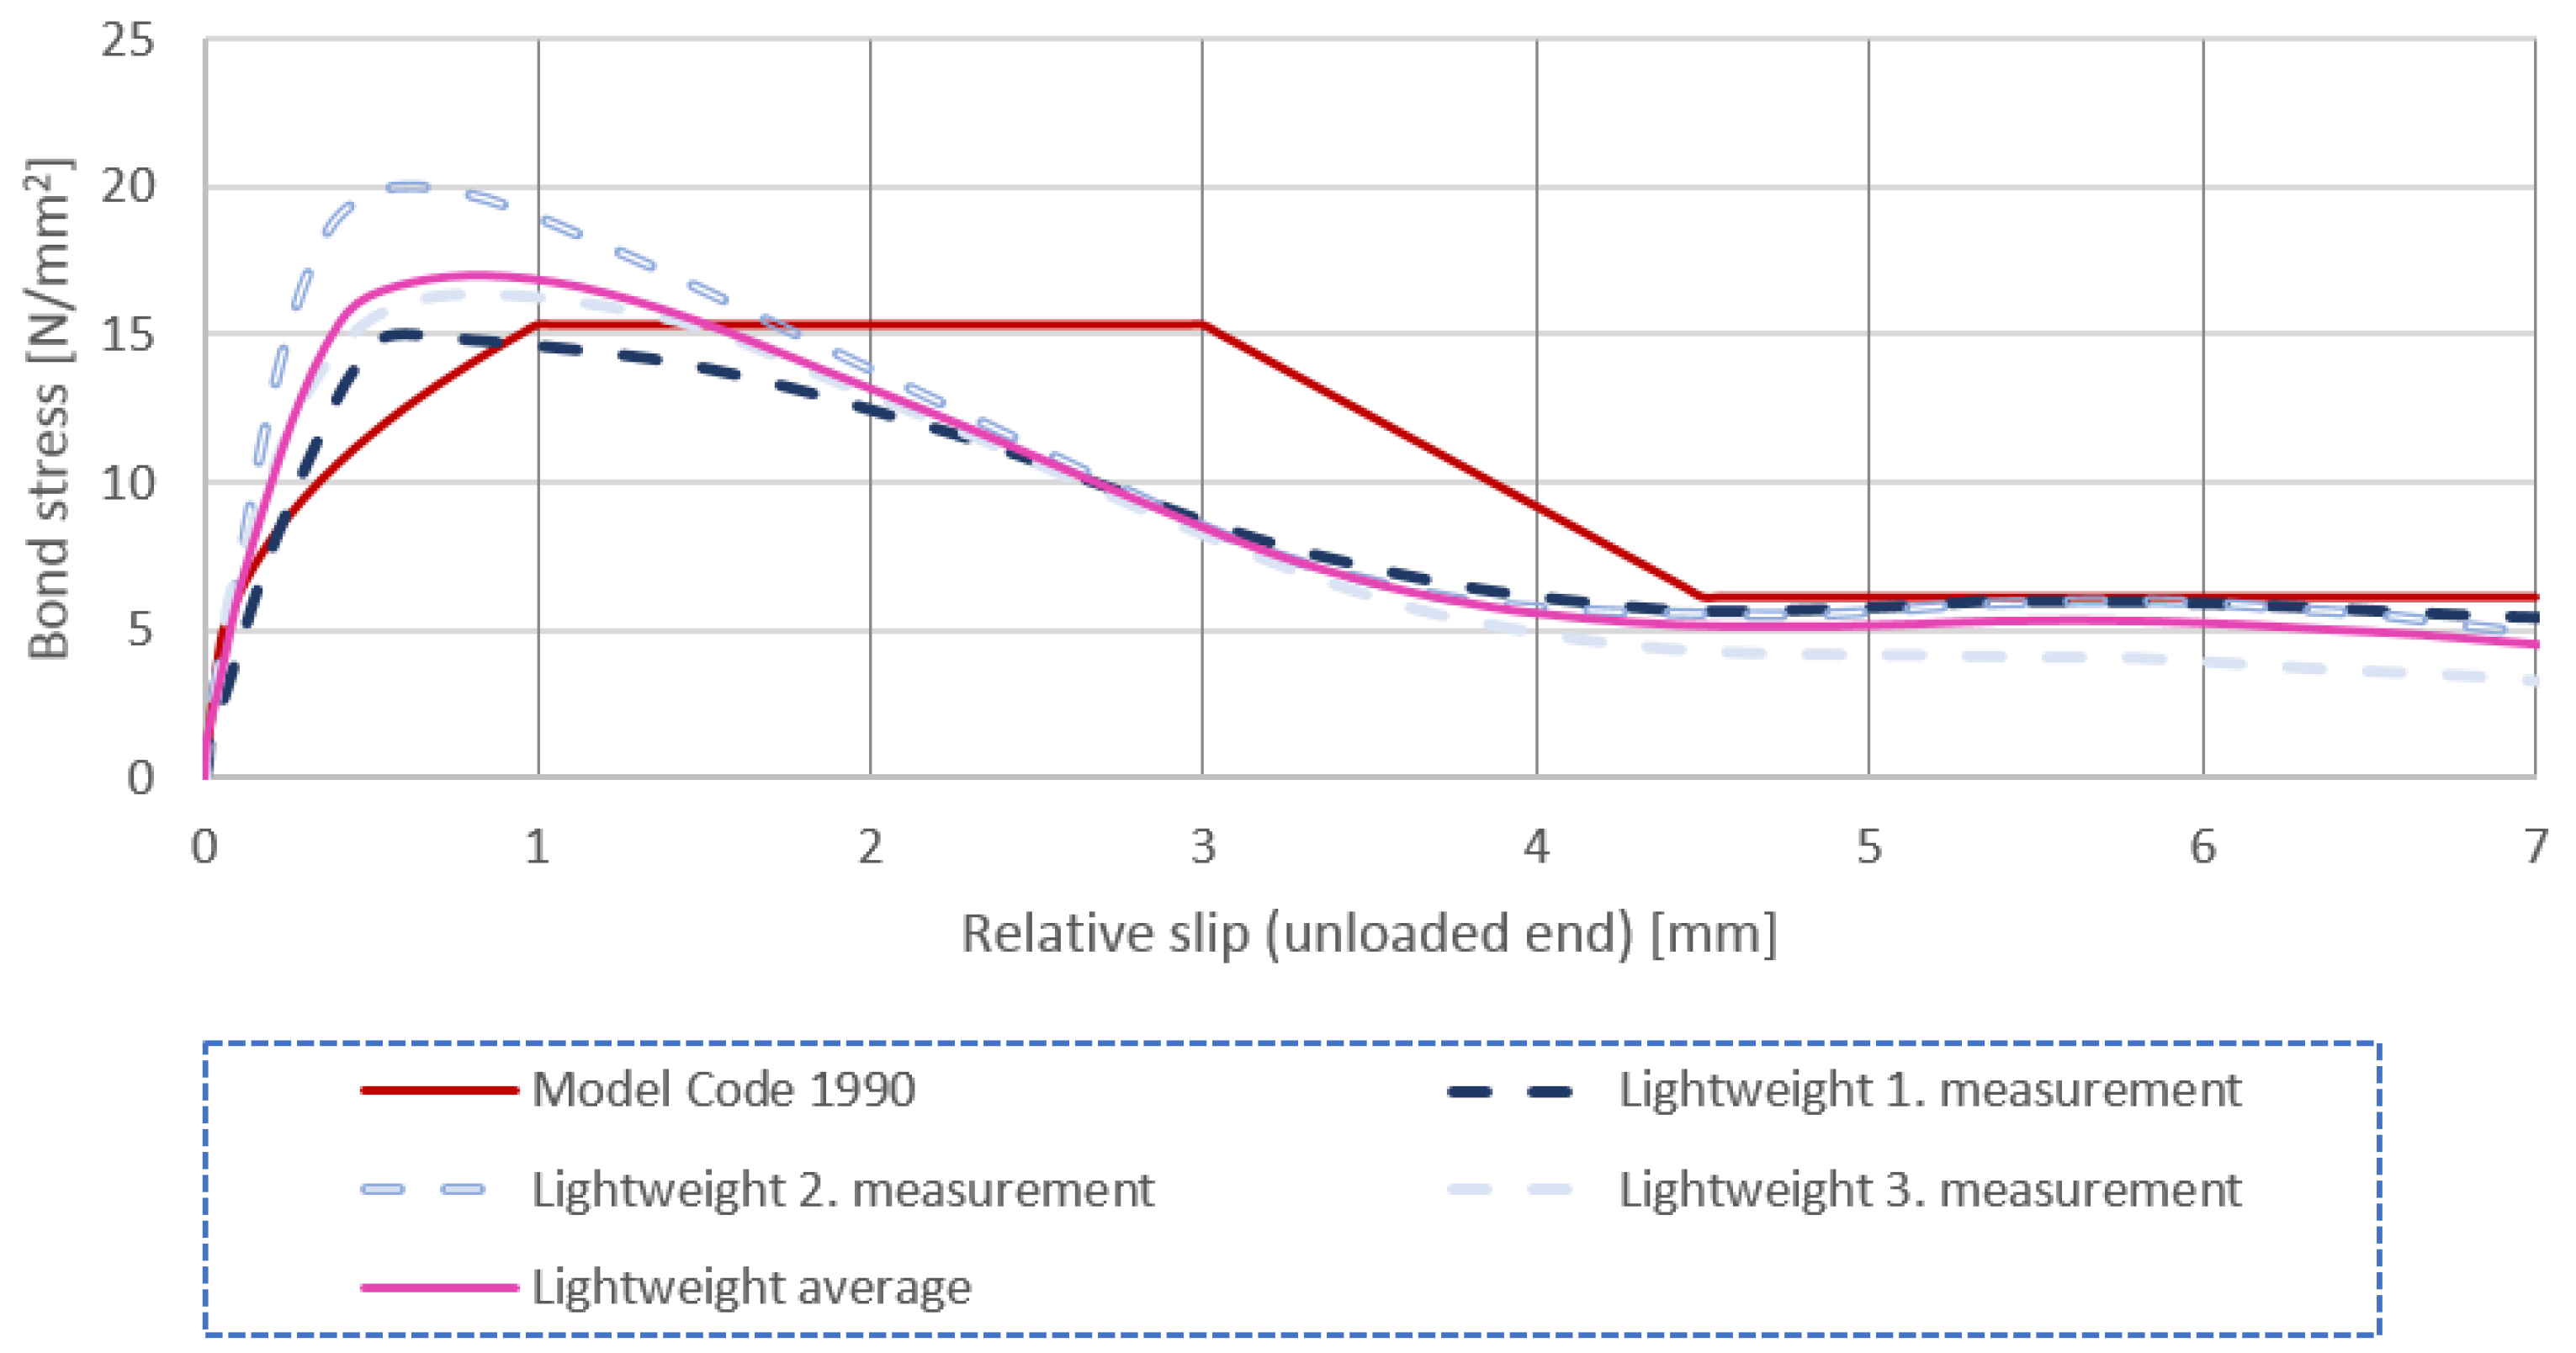
The only difference between the two versions of the Model Code is the length of the plateau, corresponding to the maximum bond stress. In Figure 6 and Figure 7, the experimental results of the lightweight concrete (and their average) can be seen, as well as the function based on the Model Code for 2010 and 1990. The stress values of all curves in Figure 6 and Figure 7 represent mean values.
It can be observed in the figures that the highest τ b , m a x value of the Model Code curve is around the smallest of the maximum bond stress values coming from the measurements, which are ideal from a design point of view. It also can be seen that the measurement data in the decreasing section of the figures are closer to the Model Code 2010 (which assumes a shorter plateau). As shown, the Model Code underestimates the stiffness of the bond behavior at the initial stage before τ b , m a x is reached. Besides this, the residual stresses are always lower than the recommendation of the Model Code, which is on the unsafe side. It should be noted, however, that from a design point of view, slip values above 1–2 mm are not relevant when considering the serviceability criteria; thus, the ranges described by Equations (3)–(5) play a role in clearly indicating the initiating failure mechanism close to ultimate limit states.

Comparison of Bond Strength Based on the Standard Pull-Out Test

In this section, the bond strengths derived from the experiments and calculated from the standards are compared to each other. The Model Code 2010 [20] derives the bond strength of the material based on its compressive strength, as follows:
f b d , 0 = η 1 · η 2 · η 3 · η 4 · ( f c k 25 ) 0.5 / γ c b
where:
  • η 1 : factor taking into account the surface characteristics (in case of ribbed steel, η 1 = 1.75 );
  • η 2 : factor taking into account the position of reinforcing bar during casting ( η 2 = 0.7 ) ;
  • η 3 : factor taking into account the diameter of the reinforcing bar for d < 25 mm: ( η 3 = 1 ) ;
  • η 4 : factor taking into account the yield strength of the steel bar for f y k = 500 MPa: ( η 4 = 1 ) ;
  • γ c b : safety factor: 1.5;
  • f c k : characteristic value of the compressive strength of concrete [N/mm 2 ].
The design value of the bond strength can be calculated from the basic value f b d , 0 considering the effect of concrete cover, the lateral reinforcement, and the lateral stresses, as follows:
f b d = ( α 2 + α 3 ) · f b d , 0 2 · p t r / γ c b < 2.0 · f b d , 0 0.4 · p t r < ( 1.5 / γ c b ) · f c k
where:
  • α 2 : effect of concrete covering α 2 = ( c m i n / ) 0.5 · ( c m a x / 2 · c m i n ) 0.15 ;
  • α 3 : effect of lateral reinforcement; if there is no reinforcement, α 3 = 0 ;
  • p t r : effect of lateral stresses; in the present case, α 3 = 0 .
For comparison, the calculation of the design value of the bond strength based on the Eurocode [21] (MSZ EN 1992-1:2002) is
f b d = 2.25 · η 1 · η 2 · f c t d
where:
  • η 1 : factor taking into account the position of the reinforcing bar (for “good” bond conditions, η 1 = 1; in other cases, η 1 = 0.7);
  • η 2 : factor taking into account the diameter of the reinforcing bar (for d < 32 mm, η 2 = 1);
  • f c t d : design value of the tensile strength of concrete [N/mm 2 ], limited above C60/75;
Based on the expressions of the Model Code 2010 and the Eurocode, the characteristic bond strengths f b m were calculated and compared to the measurement results, as is shown in Table 3. Note that for the calculation of f b k , the material partial factor was taken as 1.0 and the 5% characteristic compressive f c k and tensile f c t k strengths were used. In terms of the measurements, the characteristic value τ b k has been calculated as the 5% quantile value (from the measured τ b m values).
It can be seen in Table 4 that the two standards are fairly close to each other in the characteristic bond strength f b k ; however, they are far from the results of the measurements. The standards highly underestimate the actual bond strength of the material (3–4-times higher results were deduced from the measurements). The ratios of characteristic bond strengths determined from tests and proposed by the MC2010 and EC can be found in Table 4.
Table 4 clearly shows how far the characteristic bond strengths determined from experiments and proposed by the current standards for the same steel–concrete interface differ from each other. Theoretically, all reliability components (related to uncertainties in parameters and test conditions) are covered by the safety parameters (partial factors); thus, the difference between τ b k and f b k may be explained simply by the lack of relevant test data, especially for lightweight concrete.

3.2. Consideration of Cyclic Pull-Out Test in Standards (Bond Fatigue)

It is a challenging task to determine the bond strength of a lightweight concrete because the Eurocode does not contain any S-N (Wöhler) curves for any concrete. Thus, the fatigue bond strength was investigated on the basis of the fatigue compressive and tensile strengths.

3.2.1. Bond Fatigue Calculation Based on Cyclic Pull-Out Tests According to the Eurocode

The bond strength shows a strong linear correlation with the tensile strength of concrete; thus, the S-N curves for tensile strength were used to estimate the fatigue bond strength. The S-N curves for tensile strength can be found in particular national annexes to the Eurocode, such as the Swedish, Spanish, Italian, Belgian and Dutch annexes. All of these national annexes consider the fatigue tensile strength as a function of the logarithm of the number of load cycles. Other proposals define the fatigue bond strength as a portion of the compressive strength, as presented in [24].
The Swedish national annex provides the following formula:
σ m a x f t = 1 0.0685 · ( 1 R ) · log N
where:
  • f t : tensile strength of concrete (N = 1);
  • N: number of cycles;
  • R: minimum and maximum stress ratio of the cycle R = σ m i n / σ m a x ;
  • σ m a x : maximum stress level (after N cycles) in all load cycles;
  • σ m i n : minimum stress level after N cycles (present case: σ m i n = 0 ).
Based on our experiments, Table 5 can be obtained (the maximum value of the bond stress from the standard pull-out test was used to calculate the proportion of the bond strength ratio).
Because the applied load cycles significantly differed between the specimens at load levels close to fatigue, it was decided to use the average cycle number in further calculations. Based on the above-mentioned Swedish method, the maximum number of load cycles, N i , belonging to the applied load level’s fatigue could be calculated for any load level. After this, the proportions of the applied and the maximum number of cycles could be summarized to calculate the damage value (based on the Palmgren–Miner linear hypothesis [25]).
n i N i = D d
where:
  • n i : measured number of cycles at a given “i” load level;
  • N i : possible maximum number of cycles at a given “i” load level resulting in fatigue failure;
  • D d : damage (adequate if D d 1 ).
The value D 1 = 6.523 > 1.0 in Table 6 means that the tested steel–concrete interface was more resistant against fatigue than that proposed by the Swedish S-N curve. Based on this, it would be quite straightforward to conclude that the Swedish S-N curve underestimates the actual fatigue capacity. If assuming a higher standard pull-out force (e.g., only by 6.04%), then the D d value decreases dramatically. In Table 7, the standard pull-out force is increased by 6.04%, as also shown in Table 8.
Similarly to the Swedish method, the value of damage can be calculated based on other national annexes [21]. The formulae shown in Table 9 are very similar to each other and slightly differ in the included parameters.
As a conclusion, it can be seen from Table 10 that the value of the damage is always above 1 for the applied S-N curves, which means that the application of these fatigue curves is safe. The load multiplying factors belonging to D d = 1.0 were calculated iteratively for each expression and are summarized in Table 10.
All multipliers remain below 1.1 (10% increase), which means that it is an overestimation of the standard (static) bond strength and may intensify the risk of bond fatigue. The lowest multiplier (above the Swedish method) is obtained by the expression of the Belgian annex, while the highest is given by the Italian one.

3.2.2. Bond Fatigue Calculation Based on Cyclic Pull-Out Test According to the Model Code 2010

The Model Code 2010 contains an expression that was derived from [26]. Here, the approximation is also linear and a logarithmic expression is given between the fatigue bond strength and the number of cycles. The expression is as follows:
τ b , m a x f b = 1 0.04375 · log N
where:
  • N: number of cycles;
  • τ b , m a x : bond strength of concrete after N (constant) cycles of loading;
  • f b : bond strength of concrete based on standard (static, monotonic) loading.
After summarizing the results (similarly to those in Section 3.2.1 for the Eurocode), Table 11 is obtained.
It can be seen that the measured standard bond stresses remained below the calculated value, resulting in D d = 1.0 (standard is safe). The approximation is more accurate than in the Eurocode in the case of lightweight concrete (only a 4.69% increase in the standard pull-out force).

4. Conclusions

In our research, the cyclic bond strength of structural lightweight aggregate concrete was investigated. Our previous paper [1] deals in detail with the results of the experiments, while this paper focuses especially on the comparison of the cyclic test results with the corresponding code proposals. The primary motivation behind this research was the fact that even widely used standards provide only limited data on the bond strength of concrete under cyclic loading. After comparing our test results with the expressions of several national annexes to the Eurocode and of the Model Code 2010, the following conclusions can be drawn:
  • The applied lightweight aggregate concrete was designed for structural applications fulfilling all the requirements of at least the LC30/33 strength class. Thus, its mix contained lightweight aggregates only in the coarse aggregate (4/8) fraction and resulted in an average dry density of 1770 kg/m3.
  • The results of the compressive and splitting tensile strength tests showed sufficient correlations with the values calculated from the expressions of the Eurocode and the Model Code 2010.
  • The pull-out test results showed a higher standard deviation than those obtained from the compression and the splitting tensile strength tests.
  • It was observed, for lightweight mixes, that the bond stress–slip diagram showed a good correlation with the corresponding one of the Model Code (especially with the Model Code 2010); however, the Model Code 2010 formula for the characteristic bond strength highly underestimates the actual characteristic bond strength of the material. There is a huge margin in the standard for the bond strength.
  • The bond stress–slip figure of the Model Code 2010 approximates higher slips compared to our measurements in the ascending range.
  • The expressions to calculate the fatigue bond strength in the Model Code 2010 and in several Eurocode national annexes were analyzed. While these expressions are fairly similar to each other, it was concluded the Model Code 2010 gave the most accurate estimation of the S-N curve. In this case, the difference between the measured and calculated pull-out force values was found to be only 4.69%.
  • Both types of concretes were able to withstand the maximum pull-out force in the case of cyclic loading. This was explained by the higher loading rate during cycle tests, which retarded crack propagation and the following stress redistribution in the specimens.

Author Contributions

Conceptualization, T.K. and R.N.; methodology, T.K. and R.N.; validation, L.J., T.K. and R.N.; formal analysis, T.K. and R.N.; investigation, L.J., T.K. and R.N.; resources, R.N.; data curation, L.J. and Z.G.; writing—original draft preparation, Z.G.; writing—review and editing, T.K. and R.N.; visualization, L.J. and Z.G.; supervision, T.K. and R.N. All authors have read and agreed to the published version of the manuscript.

Funding

This research received no external funding.

Institutional Review Board Statement

Not applicable.

Informed Consent Statement

Not applicable.

Data Availability Statement

Not applicable.

Acknowledgments

Special thanks to the colleagues of the laboratories of the Department of Construction Materials and Technologies and the Department of Structural Engineering for their help in the preparation and execution of the experiments presented in this paper.

Conflicts of Interest

The authors declare no conflict of interest.

References

  1. Kovács, T.; Gyurkó, Z.; Jakab, L.; Nemes, R. Influence of Unidirectional Cyclic Loading on Bond between Steel Bars Embedded in Lightweight Aggregate Concrete. Solids 2022, 3, 28. [Google Scholar] [CrossRef]
  2. Kovács, T.; Nemes, R. Bond between strands and high-strength lightweight aggregate concrete. In Proceedings of the CCC 2015 Hainburg, 11th Central European Congress on Concrete Engineering, Hainburg an der Donau, Austria, 1–2 October 2015. [Google Scholar]
  3. Ganesan, N.; Indira, P.V.; Sabeena, M.V. Bond stress slip response of bars embedded in hybrid fibre reinforced high performance concrete. Constr. Build. Mater. 2014, 50, 108–115. [Google Scholar] [CrossRef]
  4. Wang, L.; Yi, J.; Xi, H.; Fan, L. Experimental study of a pull-out test of corroded steel and concrete using the acoustic emission monitoring method. Constr. Build. Mater. 2016, 122, 163–170. [Google Scholar] [CrossRef]
  5. Mitchell, D.W.; Marzouk, H. Bond characteristics of high-strength lightweight concrete. ACI Struct. J. 2003, 104, 22–29. [Google Scholar]
  6. Campione, G.; Cucchiara, L.; La Mendola, L.; Papia, M. Steel–concrete bond in lightweight fiber reinforced concrete under monotonic and cyclic actions. Eng. Struct. 2005, 27, 881–890. [Google Scholar] [CrossRef]
  7. Chen, H.J.; Huang, C.H.; Kao, Z.Y. Experimental investigation on steel–concrete bond in lightweight and normal weight concrete. Struct. Eng. Mech. 2004, 17, 141–152. [Google Scholar] [CrossRef]
  8. Abed, M.A.; Alkurdi, Z.; Fort, J.; Cerny, R.; Sólyom, S. Bond Behavior of FRP Bars in Lightweight SCC under Direct Pull-Out Conditions: Experimental and Numerical Investigation. Materials 2022, 15, 3555. [Google Scholar] [CrossRef] [PubMed]
  9. Al-Fouadi, W.K.A.; Mohammed, A.H.; Abdullah, K. Experimental and analytical study on behavior of pull-out failure of reinforcing bar embedded in concrete blocks. Struct. Concr. 2019, 20, 171–184. [Google Scholar] [CrossRef]
  10. Pul, S. Loss of concrete-steel bond strength under monotonic and cyclic loading of lightweight and ordinary concretes. Iran. J. Sci. Technol. Trans. B Eng. 2010, 34, 397–406. [Google Scholar]
  11. Faleschini, F.; Hofer, L.; Zanini, M.A.; dalla Benetta, M.; Pellegrino, C. Experimental behavior of beam-column joints made with EAF concrete under cyclic loading. Eng. Struct. 2017, 139, 81–95. [Google Scholar] [CrossRef]
  12. Qu, Z.; Xie, J.; Wang, T.; Kishiki, S. Cyclic loading test of double K-braced reinforced concrete frame subassemblies with buckling restrained braces. Eng. Struct. 2017, 127, 1–14. [Google Scholar] [CrossRef]
  13. El-Mandouh, M.A.; Omar, M.S.; Elnaggar, M.A.; El-Maula, A.S.A. Cyclic Behavior of High-Strength Lightweight Concrete Exterior Beam-Column Connections Reinforced with GFRP. Buildings 2022, 12, 179. [Google Scholar] [CrossRef]
  14. Ashtiani, M.S.; Dhaka, R.P.; Scott, A.N.; Bull, D.K. Cyclic beam bending test for assessment of bond slip behavior. Eng. Struct. 2013, 56, 1684–1697. [Google Scholar] [CrossRef]
  15. Zhandarov, S.; Mäder, E. Determining the interfacial toughness from force–displacement curves in the pull-out and microbond tests using the alternative method. Int. J. Adhes. Adhes. 2016, 65, 11–18. [Google Scholar] [CrossRef]
  16. CEB-FIP Model Code 1990 for Concrete Structures; Ernst and Sohn: Lausanne, Switzerland, 1990.
  17. Desnerck, P.; Lee, J.M.; Morley, C.T. Bond behaviour of reinforcing bars in cracked concrete. Constr. Build. Mater. 2015, 94, 126–136. [Google Scholar] [CrossRef]
  18. Alavi-Fard, M.; Marzouk, H. Bond of high strength concrete under monotonic pull out loading. Mag. Concr. Res. 2004, 56, 545–557. [Google Scholar] [CrossRef]
  19. Patel, V.J.; Van, B.C.; Henry, R.S.; Clifton, G.C. Effect of reinforcing steel bond on the cracking behaviour of lightly reinforced concrete members. Constr. Build. Mater. 2015, 96, 238–247. [Google Scholar] [CrossRef]
  20. CEB-FIP Model Code 2010 for Concrete Structures; Internation Federation for Structural Concrete (fib): Lausanne, Switzerland, 2010.
  21. European Committee for Standardization. Eurocode 2: Design of Concrete Structures—Part 1-1: General Rules and Rules for Buildings; CEN: Brussels, Belgium, 2004; 225p. [Google Scholar]
  22. Windisch, A. A Modified Pull-out Test and New Evaluation Methods for a More Real Local Bond-Slip Relationship. Mater. Struct. 1985, 18, 181–184. [Google Scholar] [CrossRef]
  23. Balázs, G.L.; Koch, R.; Harre, W. Verbund von Stahl in Beton unter Betriebsbeanspruchung. In Deutscher Ausschuss für Stahlbeton-30; Forschungskolloquium: Sttutgart, Germany, 1994; pp. 167–176. [Google Scholar]
  24. Song, X.; Wu, Y.; Gu, X.; Chen, C. Bond behaviour of reinforcing steel bars in early age concrete. Constr. Build. Mater. 2015, 94, 209–217. [Google Scholar] [CrossRef]
  25. Miner, M.A. Cumulative damage in fatigue. J. Appl. Mech. 1945, 67, 159–164. [Google Scholar] [CrossRef]
  26. Tepfers, R. A Theory of Bond Applied to Overlapped Tensile Reinforcement Splices for Deformed Bars; Division of Concrete Structures, Chalmers University of Technology: Göteborg, Sweden, 1973; p. 328. [Google Scholar]
Figure 1. Bond stress–slip diagram of normal and lightweight concrete.
Civileng 04 00006 g001
Figure 2. Comparison of standard and cyclic loading force for lightweight concrete.
Civileng 04 00006 g002
Figure 3. Bond strength ratio for normal and lightweight concrete and their average curves.
Civileng 04 00006 g003
Figure 4. Linear slip (damage) development with the number of cycles under different load levels.
Civileng 04 00006 g004
Figure 5. Bond stress–slip curve based on Model Code 1990 [16].
Civileng 04 00006 g005
Figure 6. Bond stress–slip curves based on our measurements and the Model Code 2010.
Civileng 04 00006 g006
Figure 7. Bond stress–slip curves based on our measurements and the Model Code 1990.
Civileng 04 00006 g007
Table 1. Density, compressive and splitting tensile strength of the normal and lightweight concrete.
Type of ConcreteAverage Density [kg/m3]Strength ClassAverage Compressive Strength [N/mm2]Std. Deviation of Compressive Strength [N/mm2]Average Splitting Tensile Strength [N/mm2]Std. Deviation of Splitting Tensile Strength [N/mm2]
Normal weight concrete2357C30/3751.191.043.630.11
Lightweight concrete1770LC30/3341.093.102.580.13
Table 2. Comparison of the 2010 and 1990 versions of Model Code.
NotationDimensionModel Code 1990Model Code 2010
f c m [N/mm 2 ]37.5737.57
c c l e a r [mm]4.504.50
τ b , m a x [N/mm 2 ]15.3215.32
s 1 [mm]1.001.00
s 2 [mm]3.002.00
s 3 [mm]4.504.50
α [−]0.400.40
τ b , f [N/mm 2 ]6.136.13
Table 3. Comparison of the characteristic values of the standards and our measurements.
#Measured Strength ValuesModel Code (Compressive and Bond Strength)EN (Tensile and Bond Strength)Measured Bond Strength
f cm , cube f ctm f ck f b 0 f bk f ctk f bk τ bm
N/mm 2
142.032.6236.151.473.962.3573.7114.93
241.092.72 20.04
341.832.40 16.32
439.402.31 15.43
Characteristic value ( f b k ):3.96 3.7113.60 = τ b k
Table 4. Characteristic bond stress ratios.
Model CodeEurocode
f h k N/mm 2 3.963.71
τ b m N/mm 2 13.60
τ b k / f b k -3.443.66
Table 5. Maximum number of cycles at a given load level.
Load IntensityBond Strength RatioApplied Number of Cycles, n i
1. Specimen2. Specimen3. SpecimenAverage
[kN][-][-][-][-][-]
8.5940.433333.0
11.1720.563333.0
13.7500.695555.0
15.4680.775555.0
17.1870.8610101010.0
18.5000.932020113.7
20.0001.0061005.3
Table 6. Values of damage at different load levels (based on linear damage hypothesis).
Standard Pull-Out ForceLoading StepLoad Ratio ( n i ) Applied Number of Load Cycles ( N i ) Calculated Possible Number of Load Cycles (Swedish)Damage
[kN][kN][-][-][-][-]
20.0008.5940.433.0211,793,3931.41647 × 10 8
11.1720.563.02,780,5081.07894 × 10 6
13.7500.695.036,5040.00014
15.4680.775.020310.002
17.1870.8610.01130.088
18.5000.9313.7121.098
20.0001.005.315.333
Σ :6.523
Table 7. Values of damage at different load levels (based on linear damage hypothesis)).
Standard Pull-Out ForceLoading StepLoad Ratio ( n i ) Applied Number of Load Cycles ( N i ) Calculated Possible Max Number of Load Cycles (Swedish)Damage
[kN][kN][-][-][-][-]
21.2098.5940.413.0482,449,8666.22 × 10 9
11.1720.533.08,108,2253.70 × 10 7
13.7500.655.0136,2703.67 × 10 5
15.4680.735.089410.001
17.1870.8110.05870.017
18.5000.8713.7730.188
20.0000.945.370.757
Σ :0.962 ∼ 1.0
Table 8. Comparison of the assumed standard pull-out forces.
Standard Pull-Out Force (Table 6)Multiplier (Ratio)Standard Pull-Out Force II (Table 7)
[N][-][N]
20,0001.060421,209
Table 9. Damage calculation according to different national annexes.
ItalianSpanish
σ m a x f t = ( 1 0.09542 ) · ( 1 σ m i n σ m a x ) · log N σ m a x f t = ( 1 0.091 ) · ( 1 σ m i n σ m a x ) · log N
DutchBelgian
Δ σ f t = ( 1.25 0.0992 · log N ) · ( 0.8 σ m i n f t ) σ m a x f t = ( 1 0.05 · log N ) · X
where Δ σ : stress amplitude ( Δ σ = σ m a x σ m i n )where X: factor dependent on the risk of error ( X = 0.69 ÷ 1.00 )
Table 10. Values of damage at different load levels (based on linear damage hypothesis) according to different national annexes.
Std. Pull-Out ForceLoad StepsDamage
SwedishItalianSpanishDutchBelgian
[kN][kN][-][-][-][-][-]
20.0008.5941.41647 × 10 8 3.16 × 10 6 1.62 × 10 6 1.95 × 10 7 1.177 × 10 11
11.1721.07894 × 10 6 7.1 × 10 5 4.23 × 10 5 8.22 × 10 6 4.453 × 10 9
13.7500.000140.002650.001840.000580.0000028
15.4680.0020.0210.0160.0070.00015
17.1870.0880.3360.2850.1690.015
18.5001.0982.2372.0491.5510.432
20.0005.3335.3335.3335.3335.333
Σ Damage ( D d ):6.5237.9307.6857.0615.781
Multiplier:1.06041.09771.09051.07411.0718
Std. Pull-Out Force II:2120921.95421.81021.48221.436
Modified Σ Damage ( D d ):0.9620.9870.9970.9961.009
Table 11. Damage calculation according to MC2010.
Std. Pull-Out ForceLoad StepsDamage
Model Code
[kN][kN][-]
20.0008.5942.76135 × 10 13
11.1722.44042 × 10 10
13.7503.59464 × 10 7
15.4680.000033
17.1870.0061
18.5000.264
20.0005.333
Σ Damage ( D d ):5.603
Multiplier:1.0469
Std. Pull-Out Force II:20937
Modified Σ Damage ( D d ):1.047
Disclaimer/Publisher’s Note: The statements, opinions and data contained in all publications are solely those of the individual author(s) and contributor(s) and not of MDPI and/or the editor(s). MDPI and/or the editor(s) disclaim responsibility for any injury to people or property resulting from any ideas, methods, instructions or products referred to in the content.