Article

Site-Specific Response Spectra and Accelerograms on Bedrock and Soil Surface

1
Department of Infrastructure Engineering, The University of Melbourne, Parkville, VIC 3010, Australia
2
Department of Civil and Construction Engineering, Swinburne University of Technology, Hawthorn, VIC 3122, Australia
*
Author to whom correspondence should be addressed.
CivilEng 2023, 4(1), 311-332; https://doi.org/10.3390/civileng4010018
Submission received: 31 December 2022 / Revised: 23 February 2023 / Accepted: 8 March 2023 / Published: 16 March 2023
(This article belongs to the Special Issue Site-Specific Seismic Design of Buildings)

Abstract

:
This paper is aimed at serving the needs of structural engineering researchers who are seeking accelerograms that realistically represent the time histories of earthquake ground in support of their own investigations. Every record is identified with a specific earthquake scenario defined by the magnitude–distance combination and site conditions; the intensity of the presented records is consistent with ultimate limit state design requirements for important structures in an intraplate region. Presented in this article are accelerograms that were generated on the soil surface of two example class Ce sites and two example class De sites based on site response analyses of the respective soil column models utilizing bedrock excitations as derived from the conditional mean spectrum (CMS) methodology. The CMS that were developed on rock sites were based on matching with the code spectrum model stipulated by the Australian standard for seismic actions for class Be sites at reference periods of 0.2, 0.5, 1 and 2 s for return periods ranging from 500 to 2500 years. The reference to Australian regulatory documents does not preclude the adoption of the presented materials for engineering applications outside Australia. To reduce modeling uncertainties, the simulation of the soil surface ground motion is specific to the site of interest and is based on information provided by the borelogs. The site-specific simulation of the strong motion is separate to the CMS-based accelerogram selection–scaling for obtaining the bedrock accelerograms (utilizing strong motion data provided by the PEER). The decoupling of the two processes is a departure from the use of the code site response spectrum models and has the merit of reducing modeling uncertainties and achieving more realistic representation of the seismic actions.

1. Introduction

The selection of accelerograms that are suitable for use in intraplate regions of low to moderate seismicity represents a challenge to civil engineers and researchers in the field in view of the very limited number of strong motion accelerograms that have been recorded in these regions. Research into stochastic ground motion modeling has managed to resolve a great deal of unknowns by means of seismological modeling which makes use of low-intensity recordings from well-studied stable regions, such as Central and Eastern North America (CENA) to help develop credible ground motion models without relying on a large database of strong motion records [1,2,3,4,5,6,7,8]. Seismological modeling serves the purpose of scaling ground motions recorded from small magnitude earthquake events to a much larger magnitude event, in addition to modifying the frequency behavior of the ground motion to take into account variations in crustal conditions within intraplate regions around the globe, provided that relevant geophysical parameters of the targeted region have been determined [9,10,11,12,13,14].
The development of the conditional mean spectrum (CMS) methodology enables a large number of strong motion accelerograms that were originally recorded in an active region to be scaled to conform to the modeled frequency behavior of intraplate earthquakes of a targeted region by incorporating suitable ground motion models into the scaling process [15,16,17]. The strong motion accelerogram database and the associated scaling facility hosted by the Pacific Earthquake Engineering Research (PEER) Center can be made use of to obtain accelerograms that conform to a user-defined CMS, with intensities corresponding to that estimated for the targeted area for a specified return period [18].
The accelerogram selection and scaling facility, as described, has been in place for free public access for many years. The default user-defined spectrum that has been built into the facility for the selection and scaling of accelerograms is to match with a code specified response spectrum model. This basic approach to scaling, which is simple and straightforward, is introduced in Section 2. The shortcoming of using a code spectrum (or a UHS) in scaling accelerograms is the built-in conservatism of a conventional response spectrum model, which is typically based on aggregating contributions from a multitude of earthquake events [15].
A more advanced approach to specifying a target spectrum for scaling is the use of a CMS. A CMS is based on a specific earthquake scenario as defined by the magnitude–distance (M-R) combination of the earthquake and is specific to a particular reference period at which the spectral ordinate of the CMS matches the code (or the UHS) spectrum. The seismic demand, as determined from analysis based on the use of CMS, is much less conservative than that derived from a code spectrum. The approach to scaling incorporating the use of CMS is introduced in Section 3.
This article was aimed at presenting ground motion records as sourced from the PEER database [18]. The accelerograms have been selected and scaled to a suite of CMS that were developed by the authors for use in southeastern Australia [19]. The need of the reader to go through these complex processes is therefore eliminated. The CMS that are presented herein have been derived for four reference periods, 0.2, 0.5, 1 and 2 s, and for return periods of 500, 1500 and 2500 years. The CMS and accelerograms presented in this section are based on rock site conditions. The identity of an ensemble of twenty-four accelerograms that were selected and scaled to a CMS for a return period of 2500 years are summarized in a table (as presented in Section 3). Out of the twenty-four rock site ground motion records for each of the considered return periods, the response spectra and acceleration time histories for the four sample accelerograms (one for every CMS at a return period of 2500 years) are presented. This ensemble of rock site accelerograms, as described, may be used to serve as a reference when dealing with other stable non-cratonic regions in a generic sense as a geological description [20]. Thus, what is presented can be applied in any landmass that fits with the description irrespective of continent or country.
Strong motions transmitted from the bedrock can be modified significantly by the filtering mechanisms occurring in the overlying soil sediments. The extent of the modification can be determined by subjecting soil column models to one-dimensional (1D) site response analyses using borelog records taken from the targeted site as input information [21,22]. Four example soil column models are presented in Section 4. Each of these soil column models was subjected to 1D site response analysis using four CMS compatible bedrock motions, as presented in Section 3, for a return period of 2500 years as input into the analyses. The example accelerograms and response spectra corresponding to the 16 (= 4 × 4) combinations of earthquake scenarios and soil column models are presented for direct use in structural design or for research into the seismic performance behavior of structures.

2. Accelerograms on Rock Sites: Datasets, Selection and Scaling

The Pacific Earthquake Engineering Research (PEER) Center hosts an international database (PEER NGA West 2 database) for sourcing strong ground motions along with a built-in accelerogram scaling facility for supporting research and engineering practice [18]. The other international strong motion databases are the GeoNet database of New Zealand [23,24] and the ORFEUS database of the European–Mediterranean region [25]. A total of 1238 pairs of strong motion records were retrieved from these databases by the authors.
When operating the user interface of the PEER database, it is required to specify the style of the faulting, range of the magnitude, distance and site conditions. Table 1 lists the recommended range of these parameters for retrieving strong motions that have been recorded on soil sites in stable (intraplate) regions that are away from the tectonic plate boundaries. The recommended ranges of the input parameters aim at retrieving ground motions that are typical in intraplate regions and are of interest to engineering practitioners for structural design and assessment.
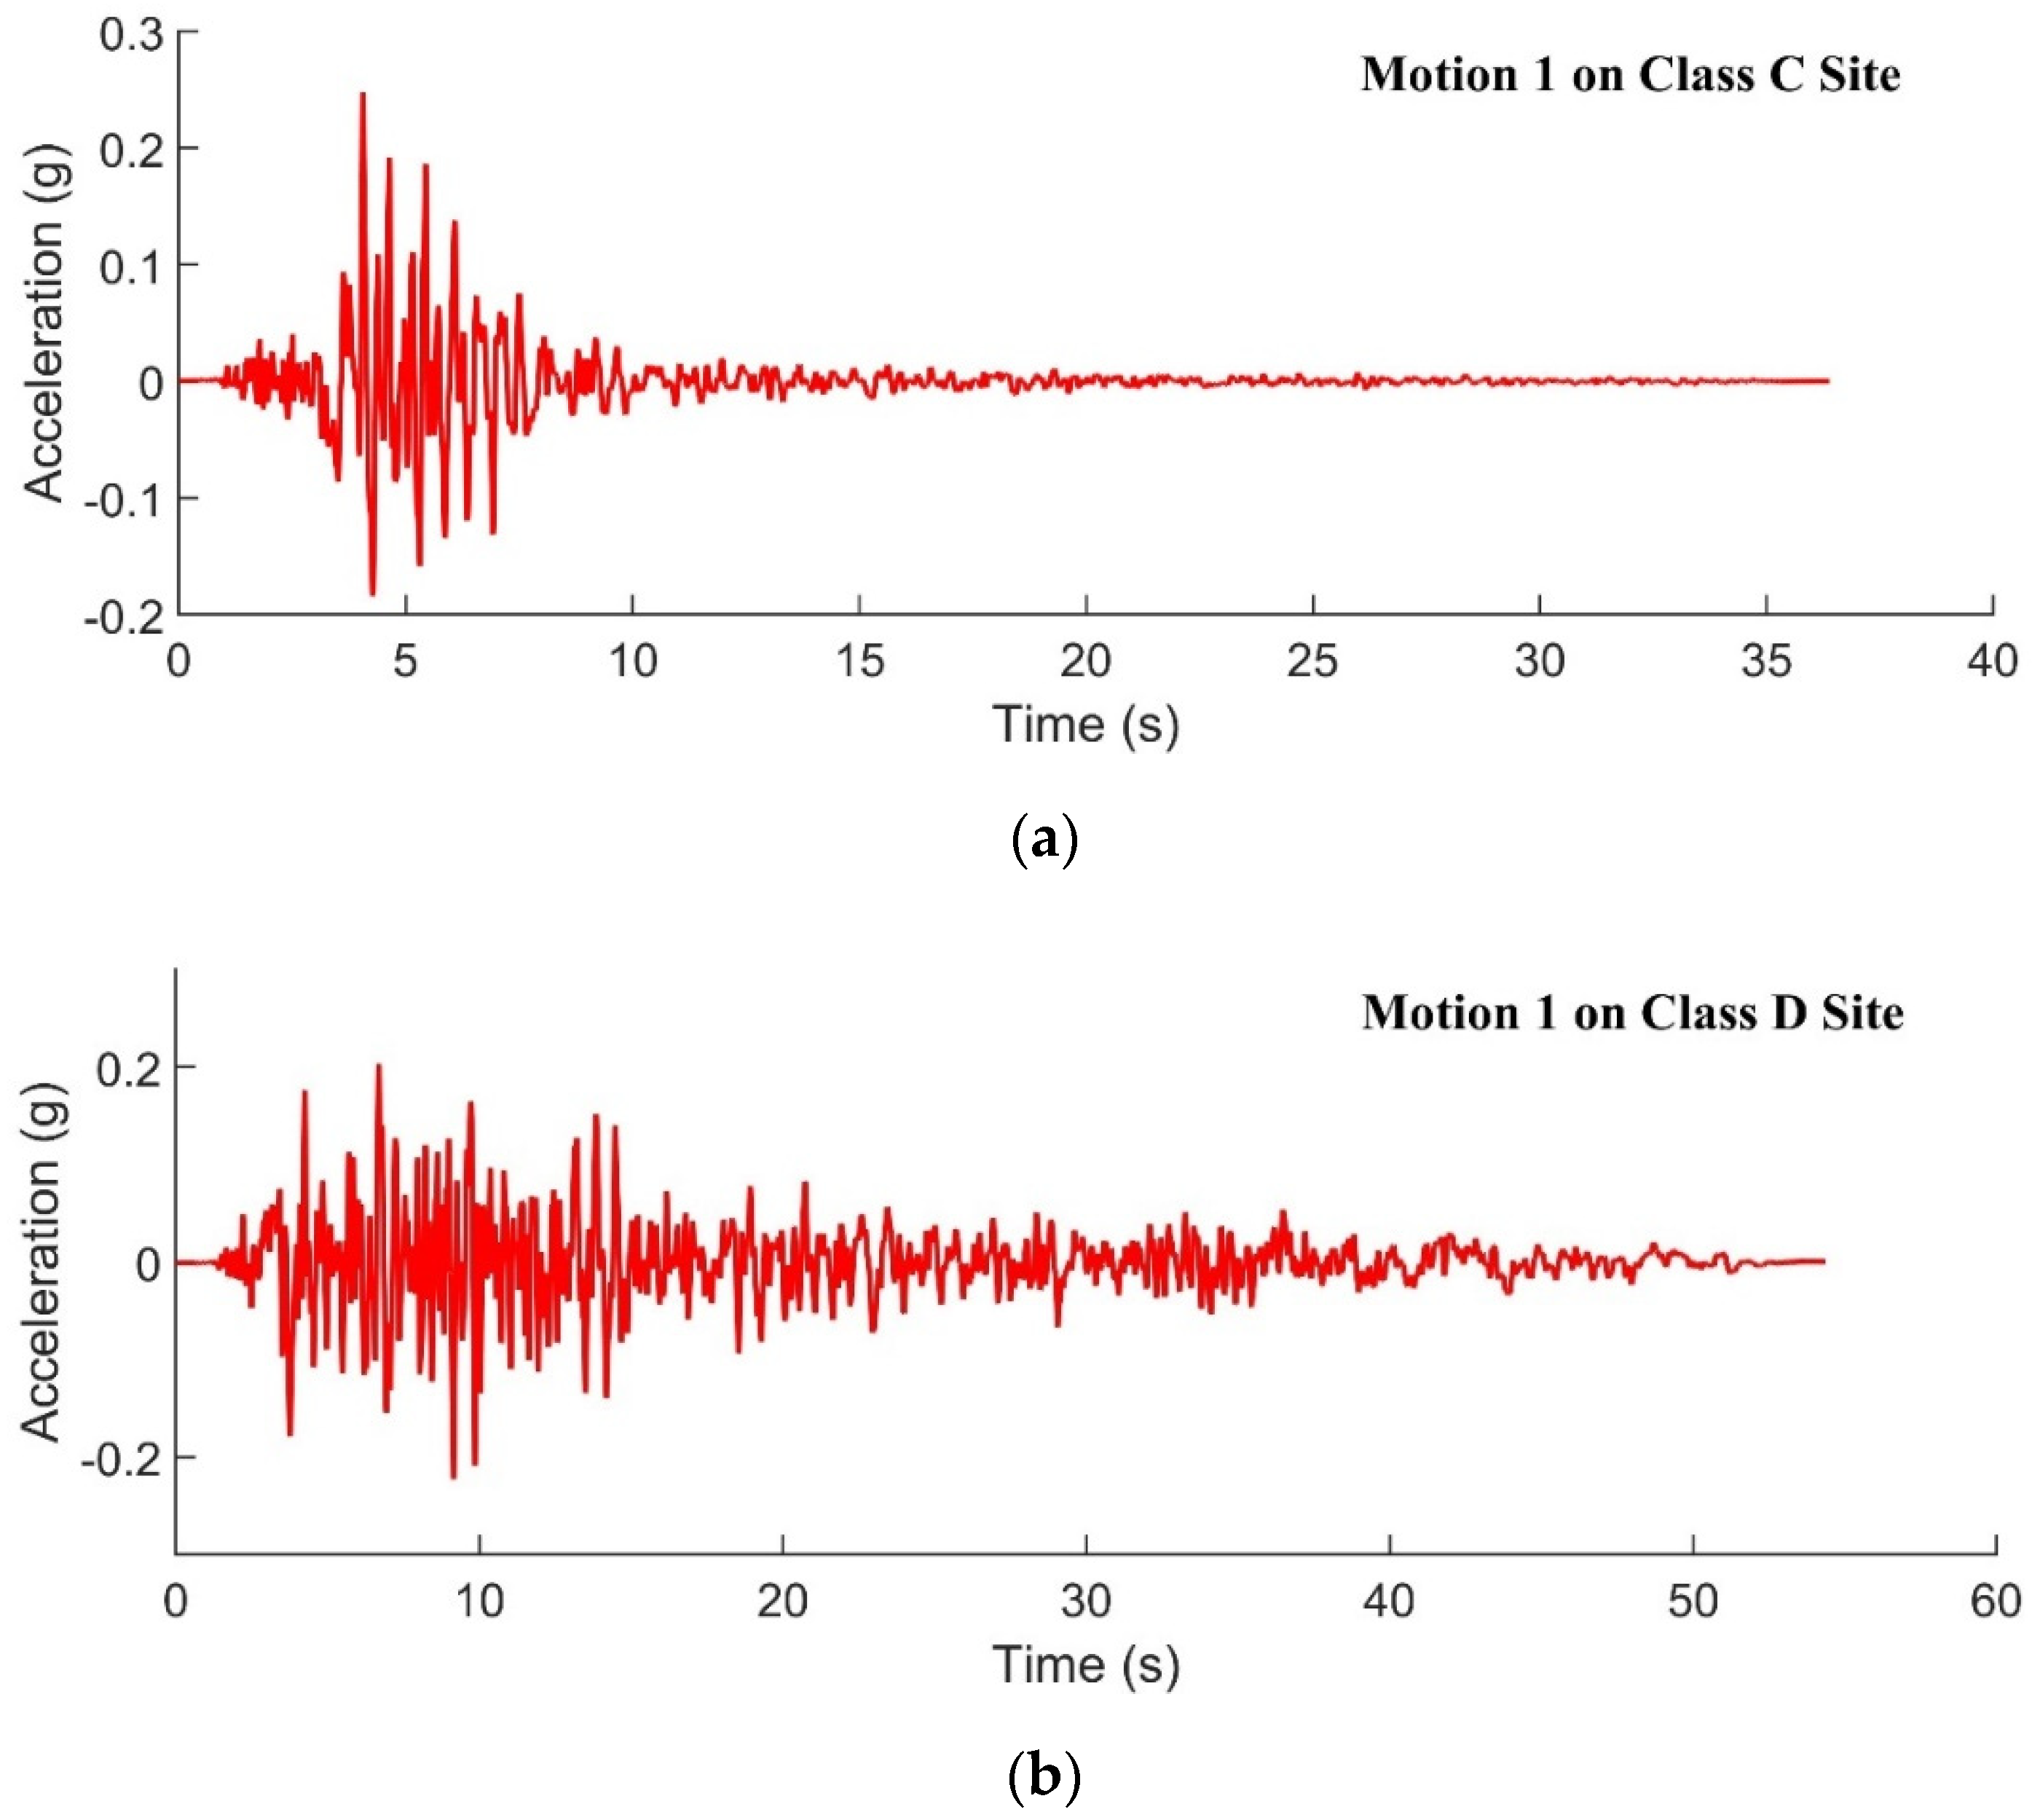
The selected accelerogram records are to be scaled to have the response spectra matching a user-defined target spectrum. Traditionally, a code response spectrum is used as the target spectrum. The two horizontal components of a ground motion record can be scaled by a single factor to minimize misfits between the response spectral values of the target (code) spectrum and that of the square root sum of the squares (SRSS) of the record components. The scaling is to be applied over a user-defined period range, and the value of the factor is to be constrained to the range of 0.5–2.0 to avoid introducing excessive distortion to the records. The mean squared error (MSE) between the targeted and the selected and scaled response spectra are to be calculated to identify the extent of the misfit for each record. The suite of scaled ground motion records to be employed for use can be selected by identifying ground motion records with the smallest misfit as quantified by their respective MSE values [16]. Ground motion records that have been scaled to match the target spectra for Class Ce and De sites for return period of 2500 years as per the Australian standard for seismic actions AS1170.4 R2018 [26] were selected on this basis over a period range of 0.1 s–1 s. These two site classes are used for illustration, as they are the more common site classes. Refer to Figure 1a,b for their respective response spectra, and Table 2 for the listing of the selected records that match with their respective code spectrum. An example acceleration time history of one of the selected–scaled records for a Class Ce and De site is presented in Figure 2a,b, respectively. The ground motions presented in this study were scaled to an intensity consistent with a return period of 2500 years to serve as reference. The design seismic actions corresponding to a different return period can be determined from analysis of these ground motions by applying a scaling factor to take into account the change in intensity.
Code spectrum models are typically derived from probabilistic seismic hazard assessment (PSHA) [27,28]. This type of response spectrum is known as the uniform hazard spectrum (UHS) [27]. The shortcoming of targeting a code spectrum, or a UHS, in the selection and scaling of accelerograms is the built-in conservatism caused by aggregating contributions by a multitude of earthquake scenarios in the integrating procedure of PSHA [15].

3. Event-Specific Spectra and Conditional Mean Spectra

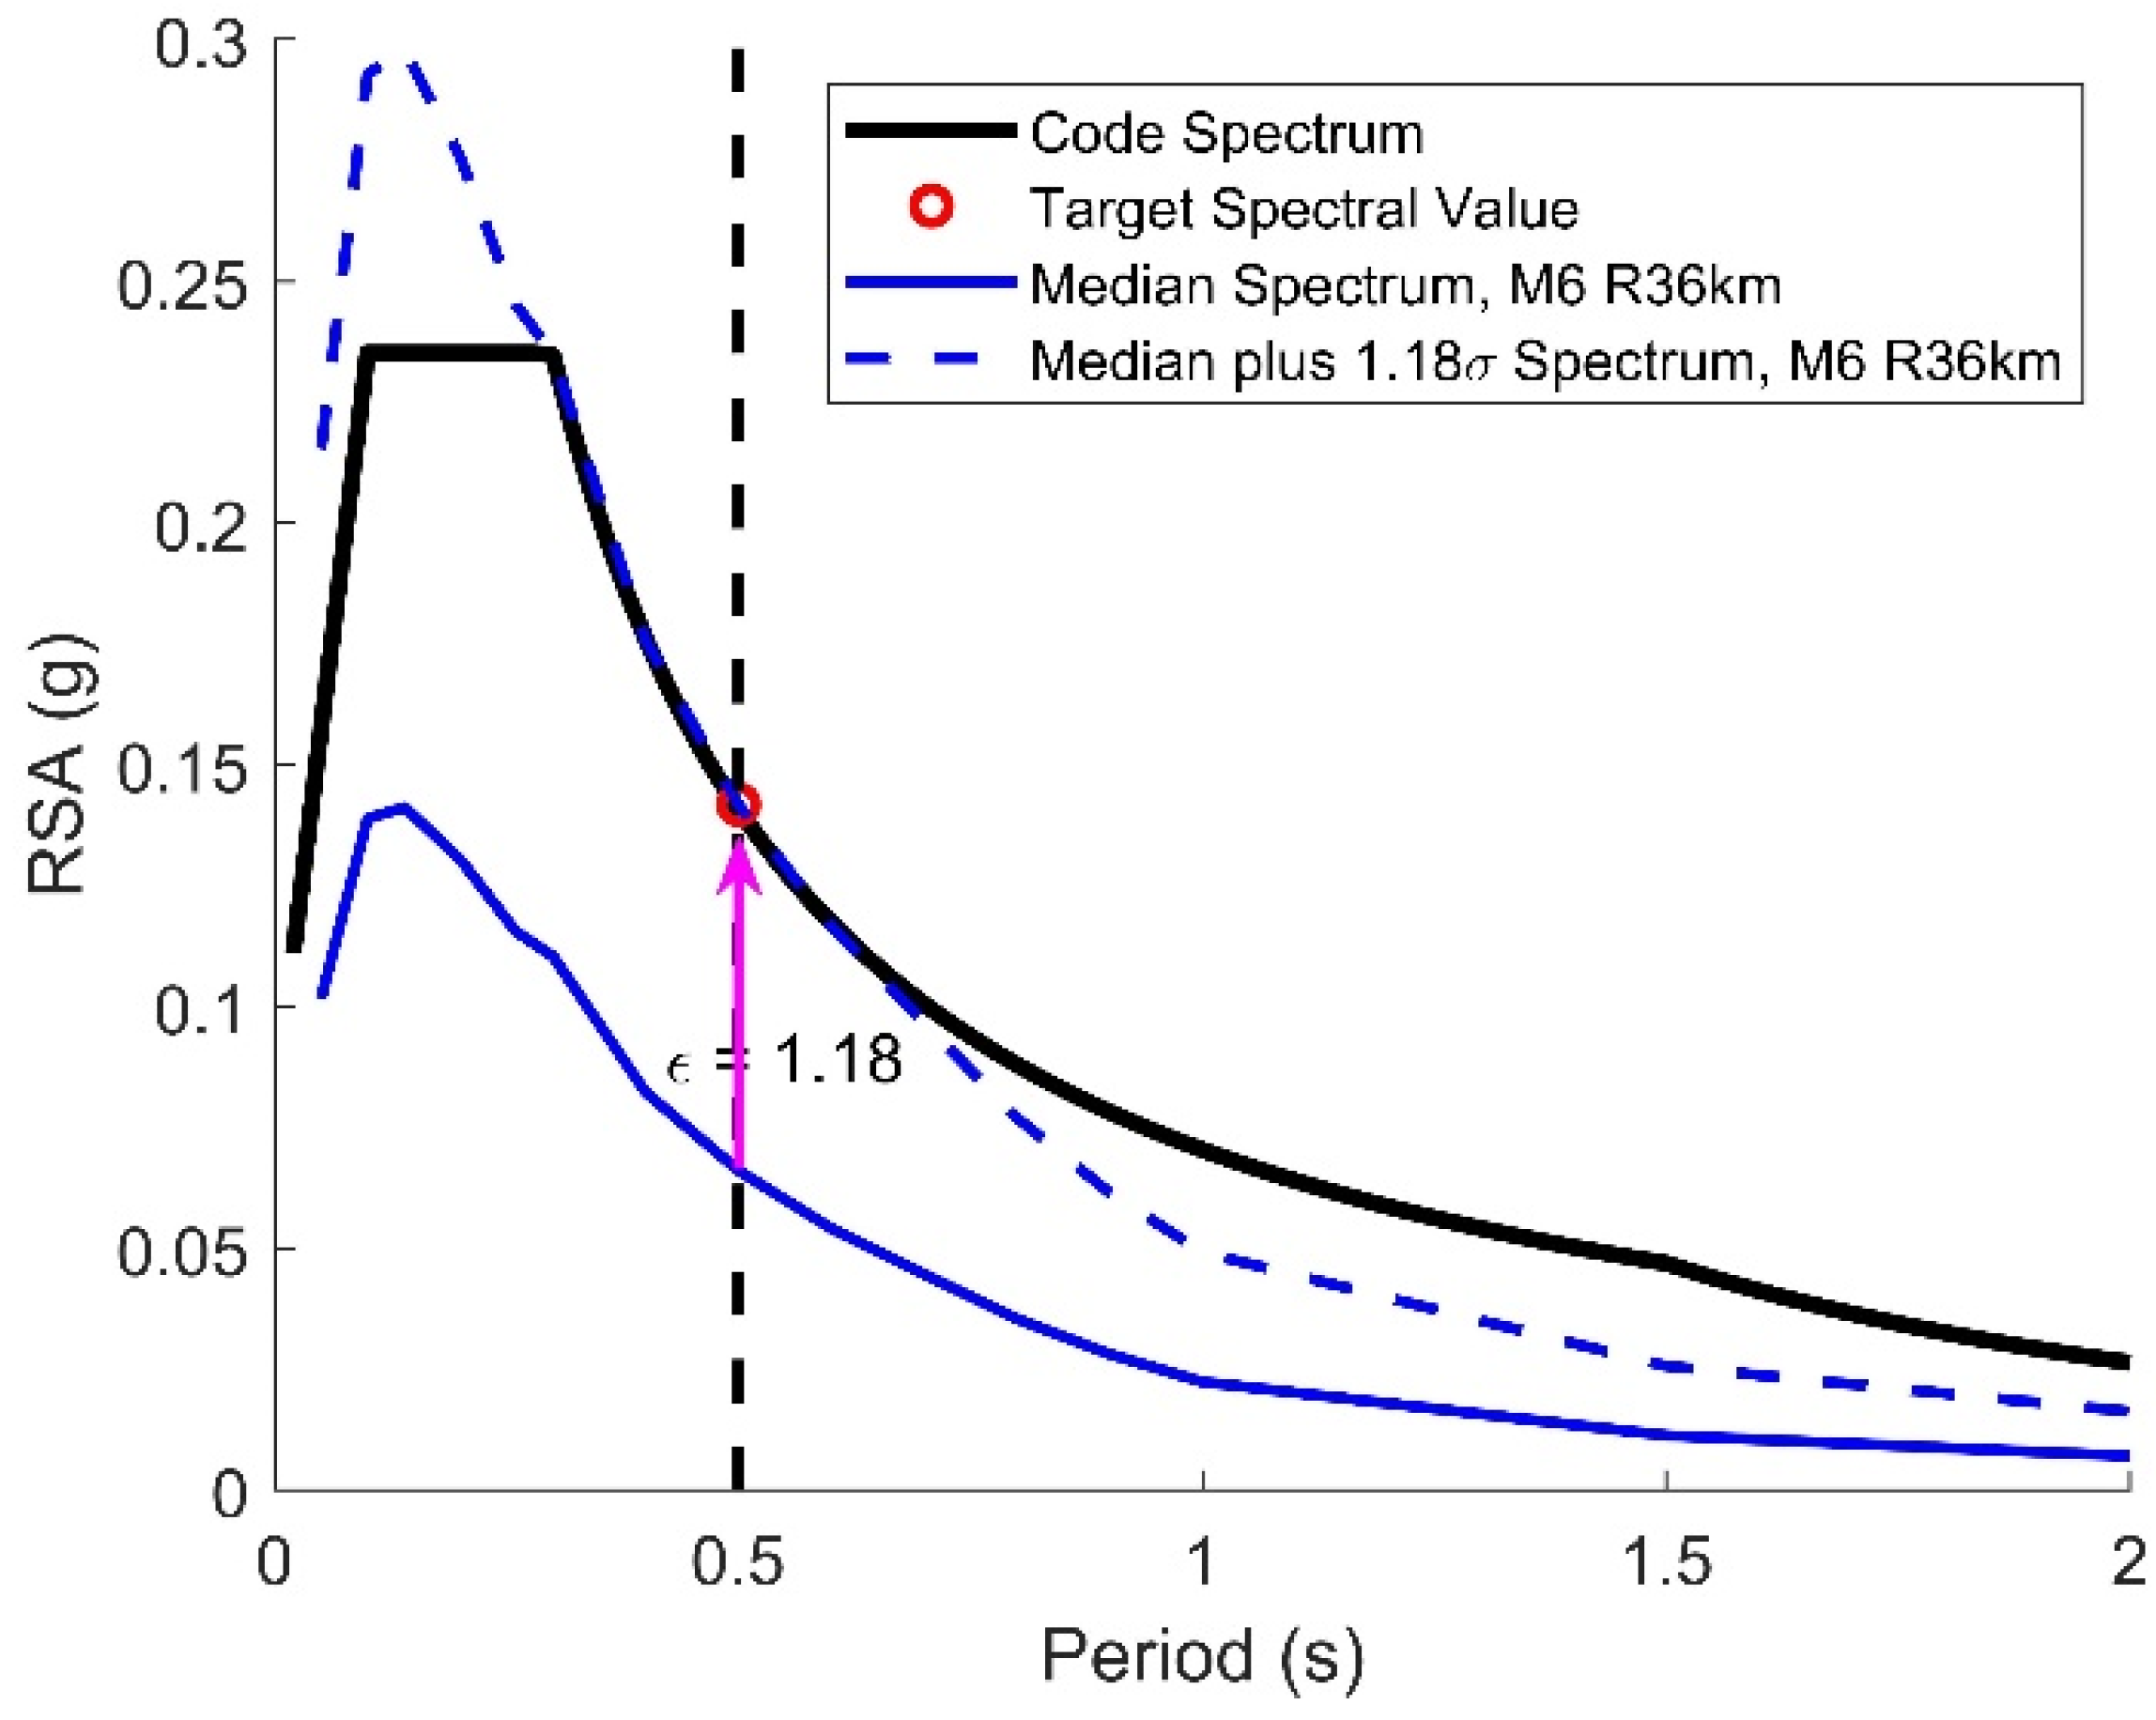
This section deals with motions on rock for input into site response analyses. The target spectrum is based on a specific earthquake event and is, therefore, much less conservative than the code spectrum (or a UHS) when used as the target spectrum for the selection and scaling of accelerograms. An example event-specific response spectrum based on a magnitude 6 earthquake at a site-source distance of 36 km (abbreviated herein as M6 R36 km) is presented in Figure 3.
The event-specific response spectrum has been scaled to match the code spectrum (or UHS) at one point with a natural period, which is known as the reference period (with notation: T * ). The median estimate of the earth scenario of M6 R36 km is significantly lower than the event-specific response spectrum because of the variability of events with the same scenario description. In this example, the record of the event would need to be scaled up by a factor (which is equal to 1.18 times the standard deviation ( σ ) of the response spectral quantities) to achieve a match with the code spectrum at T * = 0.5 s. The 1.18 multiplier is period dependent and has a maximum value at T * . Thus, the mean spectrum of earthquake events (Figure 4) that matches with the code spectrum at T * is known as the conditional mean spectrum (CMS). It is shown that the response spectral acceleration (RSA) of the CMS is lower than that of the uniformly scaled up event-specific response spectrum at periods other than the reference period. The scaling factor for determining the margin from the median spectrum is, therefore, a product of the standard deviation, epsilon and a period-dependent correlation coefficient (denoted as ρ ), which is equal to 1.0 at T = T * and values less than 1.0 at other values of T . The value of ρ is defined by Equation (1), which was empirically derived from the nonlinear regression of recorded earthquake data [29]. The various values of ρ as calculated from the use of the equation are presented in Table 3.
ρ T , T * = 1 c o s π 2 0.359 + 0.163 I T m i n < 0.189 ln T m i n 0.189 ln T m a x T m i n
where T m i n is the smaller value of T * and T ; T m a x is the larger value of T * and T .
The construction of the CMS is summarized below in a five-step procedure [16]:
  • Step 1—Identify the reference period ( T * ) where matching with the code spectrum is to occur;
  • Step 2—Identify the response spectral value of the code spectrum at T * or S a ( T * ) ;
  • Step 3—Determine the earthquake scenario as expressed in terms of the M-R combination through hazard deaggregation analysis [19], the corresponding estimated median spectral values μ ( T ) , and the standard deviation σ ( T ) for the considered earthquake scenario;
  • Step 4—Calculate the value of epsilon, ε , to achieve the response spectral value of the CMS at the reference period T * (which is defined as the sum of the median μ ( T * ) and the product of two factors: (i) standard deviation σ ( T * ) and (ii) epsilon, ε, matching the value of S a ( T * ) , as stipulated by the code;
  • Step 5—Construct the CMS for a range of periods based on taking the sum of the median μ ( T ) and product of three factors: (i) standard deviation σ ( T ) , (ii) epsilon, ε, as determined in Step 4, and (iii) period-dependent correlation coefficient ρ T , T * .
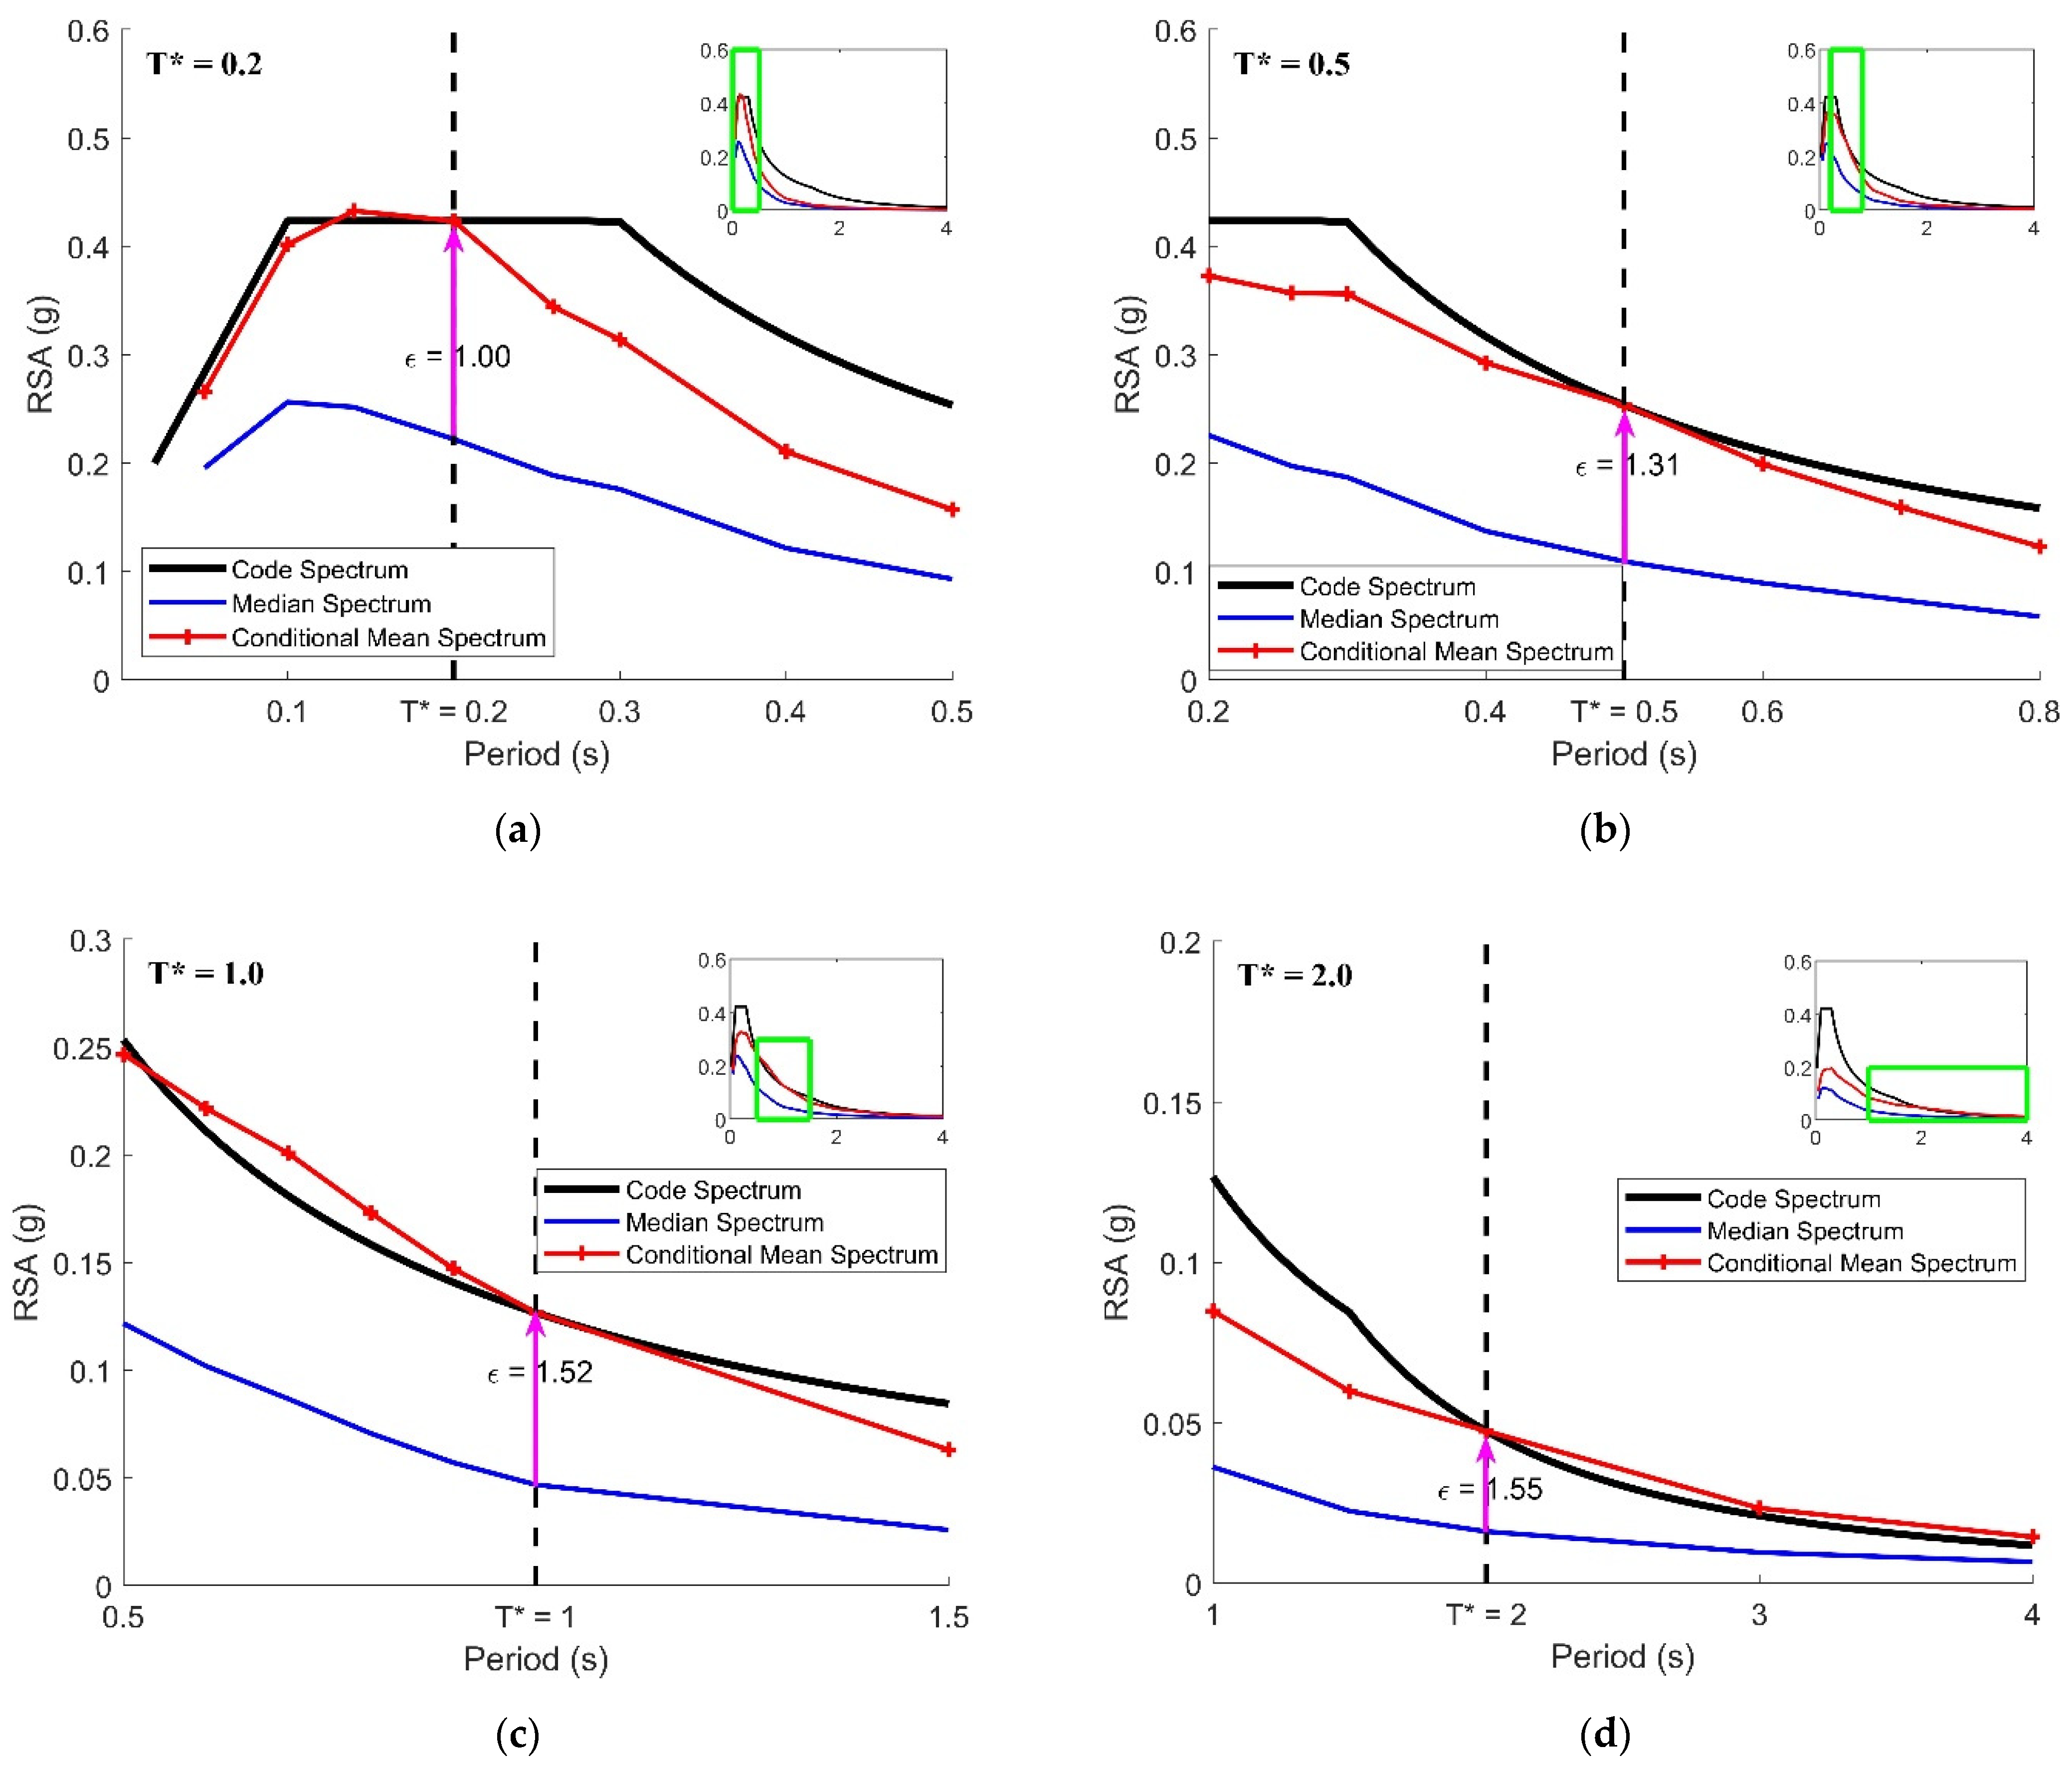
The authors developed the CMS for T * = 0.2, 0.5, 1 and 2 s and for return periods of 500, 1500 and 2500 years. Different earthquake scenarios (i.e., M-R combinations) ranging between M5.5 and M7 were identified for each case, as listed in Table 4. The CMS so constructed by employing the five-step procedure as outlined above are presented in Figure 5a–d.
When applying the scaling of individual accelerograms to target at a CMS, the range of the earthquake magnitude to be specified can be ±0.3 M centered at the magnitude listed in Table 3; ±30 km centered at the distance listed in Table 4 (the ±30 km is to be increased to ±50 km for any distance exceeding 100 km). The scaling is applied to the stronger of the two horizontal components [19]. The weaker component that has been scaled by the same factor can be employed in the dynamic analysis of a structure involving bidirectional excitations. The scaling factor adopted for each of the selected records was calculated using Equation (2) [16].
S F = S a C M S T i S a 0 T i
where S a 0 ( T ) is the amplitude of the individual spectrum prior to scaling, and the summation is over the period range of 0.2 T * –2 T * .
The mean squared error (MSE) between the targeted and the recorded and scaled response spectra are to be calculated for each record to identify the extent of the misfit. The suite of scaled ground motion records to be employed for use can be selected by identifying ground motion records with the smallest misfit, as quantified by their respective MSE value.
Six accelerograms that were recorded on rock sites for each reference period (totaling twenty-four accelerograms for the four reference periods for a return period of 2500 years) were then selected and scaled to match their respective CMS by employing the calculation methodology described above. The listing of the twenty-four accelerograms is presented in Table 5.
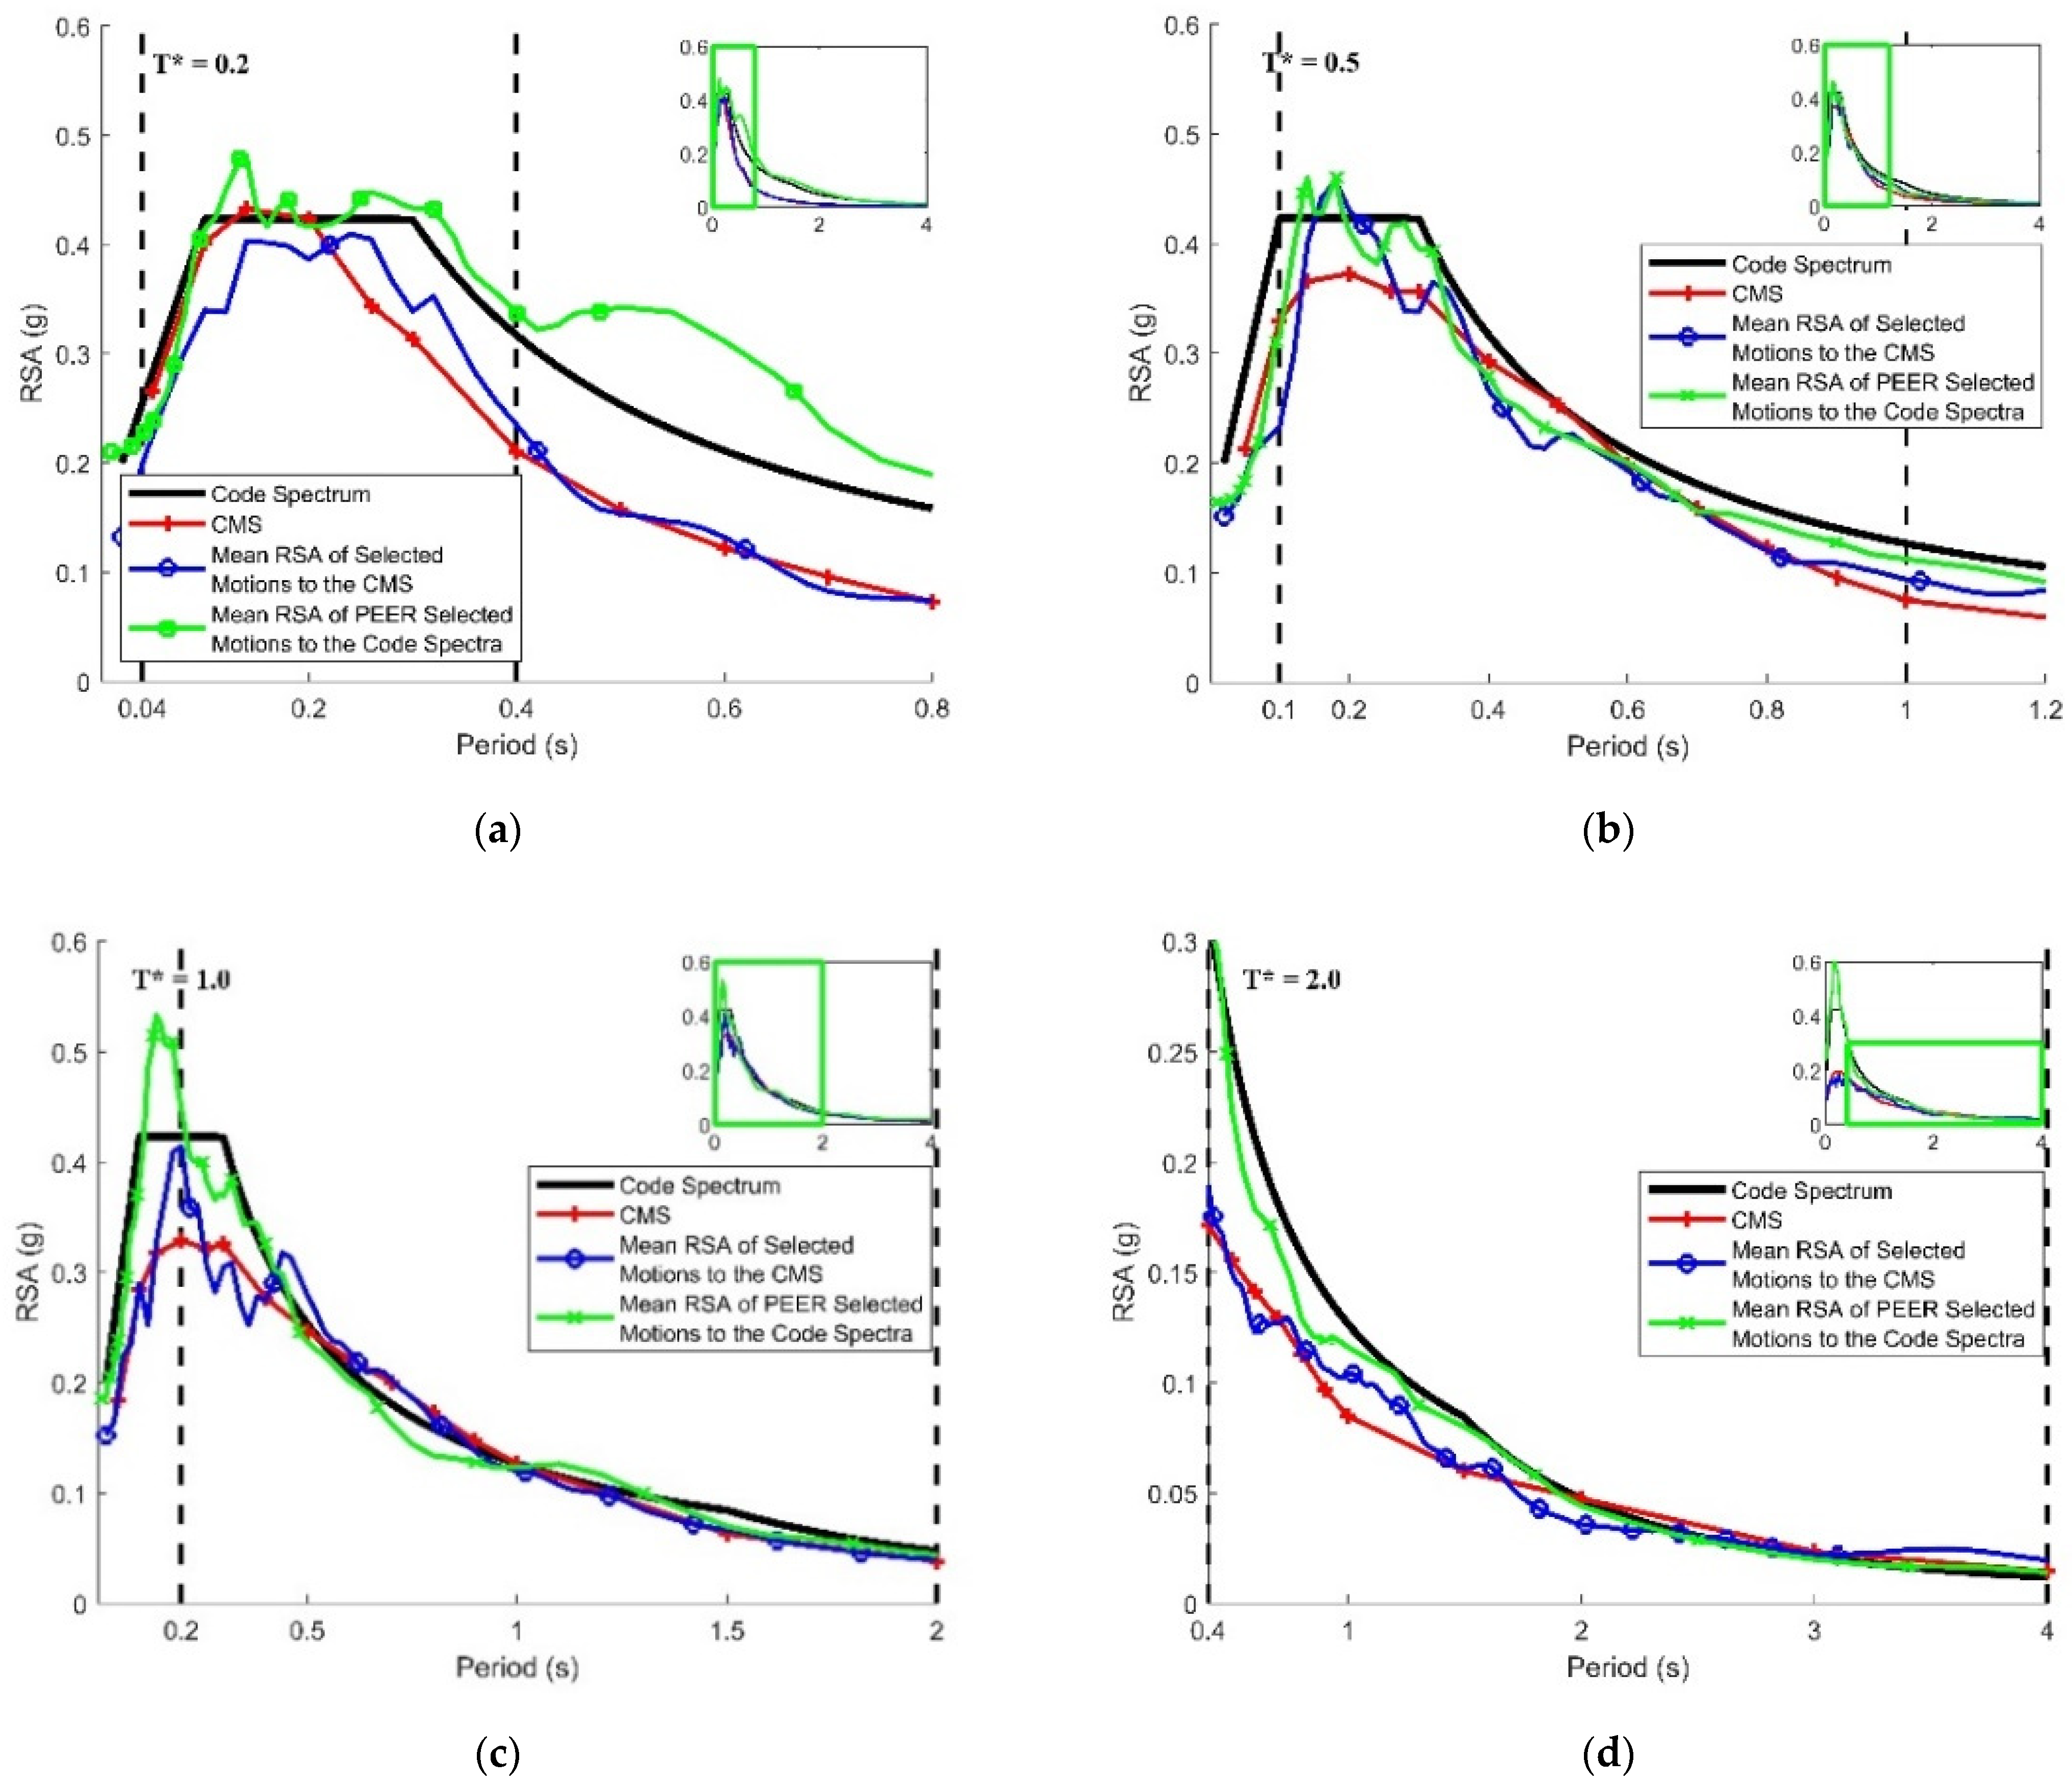
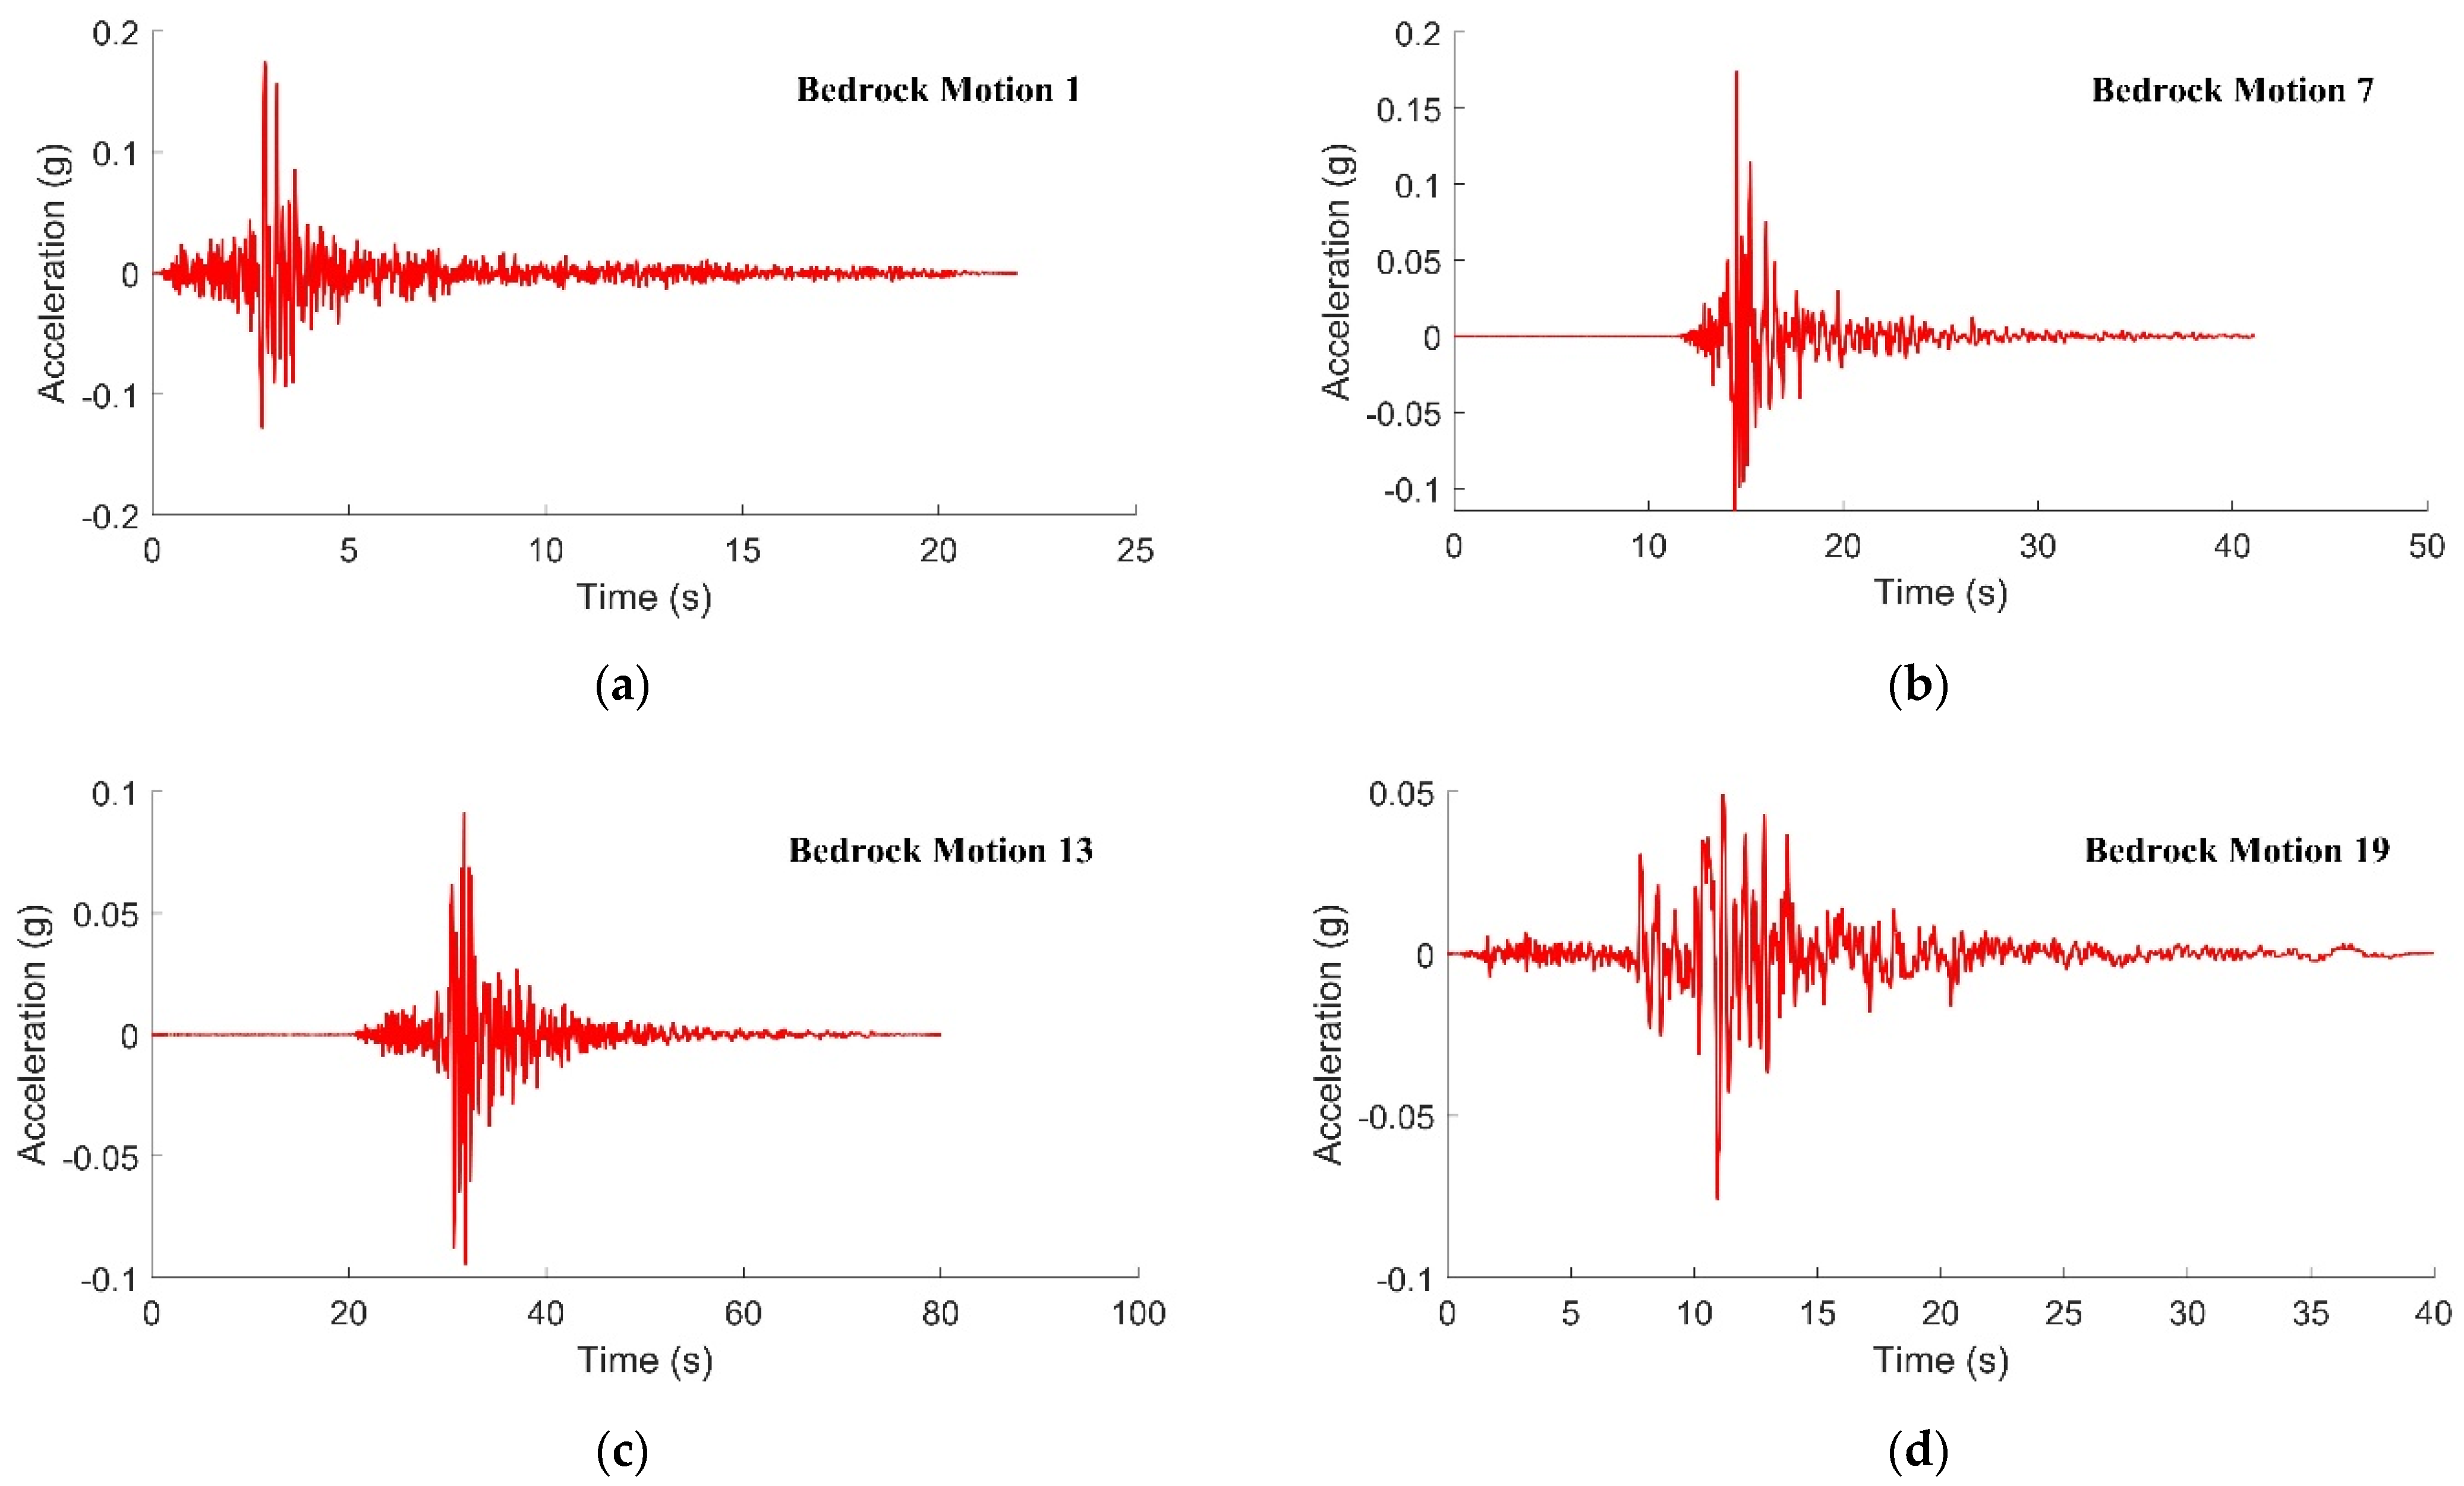
The mean response spectra of the scaled accelerograms for matching with each of the conditional mean spectra, along with the mean response spectra of the scaled accelerograms for matching with the code spectrum, are presented in Figure 6a–d. Four example acceleration time histories of the scaled records are presented in Figure 7a–d.

4. Accelerograms and Response Spectra on the Soil Surface

The scaling of the ground motion records, as presented in Section 3, is for the surface of rock sites or rock outcrops, which are considered to be the least onerous site condition. It is recommended to neither employ these rock accelerograms for research nor for guiding the design of a structure unless the ground condition of the targeted structure is found on a rock site. The more common site conditions are of classification Ce, as per the Australian Standard for seismic actions [26]. In areas with deep and/or soft sedimentation including delta areas, sites of classification De or Ee can be found. This section is aimed at providing some soil surface accelerograms that were derived from site response analyses of some example soil columns that are consistent with these site classes. The standard approach to obtaining subsoil properties and site information in engineering projects is to record borelogs. The authors collected 20 borelogs that are of classification Ce (10 borelogs), De (8 borelogs) and Ee (2 borelogs), as listed in Table 5. Other noninvasive seismic techniques are available, such as the spatial autocorrelation (SPAC) method [30,31], multichannel analysis of surface waves (MASW) [32] and the horizontal-to-vertical spectral ratio (HVSR) method [33,34]. Detailed discussions of these methods are outside the scope of this paper.
In this section, soil surface accelerograms were generated through the well-established one-dimensional equivalent linear analysis [35]. This method considers ground motions at the bedrock level as a finite sum of harmonic waves, each of which propagates vertically through the soil column following the wave equation of equilibrium. Changes in seismic wave amplitudes at the rock–soil interface and soil layer interfaces are computed based on the boundary conditions, namely, equal displacement and equal shear stress at layer interfaces. The soil nonlinearity, represented by the shear strain-related stiffness degradation and damping ratio, is accounted for through an iterative process under the equivalent linear assumption. The widely accepted method has merits in simplicity and computational efficiency, and its performance has been extensively studied in comparison to the nonlinear time history site response analysis and documented data [36,37,38,39,40]. Previous studies have demonstrated that the discrepancies are minor if a threshold on the maximum value of shear strain is not exceeded, which is 1% for clayey soils and 0.5% for sandy soils [41]. The shear strains of the ground motions presented in this section were within these limits; thus, the 1D equivalent linear analysis method was considered valid.
This section employed four example borelogs for characterizing the soil sedimentation and the selected-scaled accelerograms on rock sites as input excitations. Two of the selected borelogs are Class Ce sites (borelogs #1 and #7), and the other two are Class De sites (borelogs #4 and #8). The input site information consists of soil shear wave velocity (SWV) profiles and material curves. The conversion from standard penetration (SPT) blow counts, as reported in the borelog, to SWV values is based on the Imai–Tonouchi model [42]. The degradation of the shear modulus of the soil and the associated energy dissipation (soil damping) properties are characterized by the material curves in accordance with the Darendeli model [43]. More detailed explanations to compute subsoil properties based on borehole records, including the determination of bedrock properties, can be found in [44].
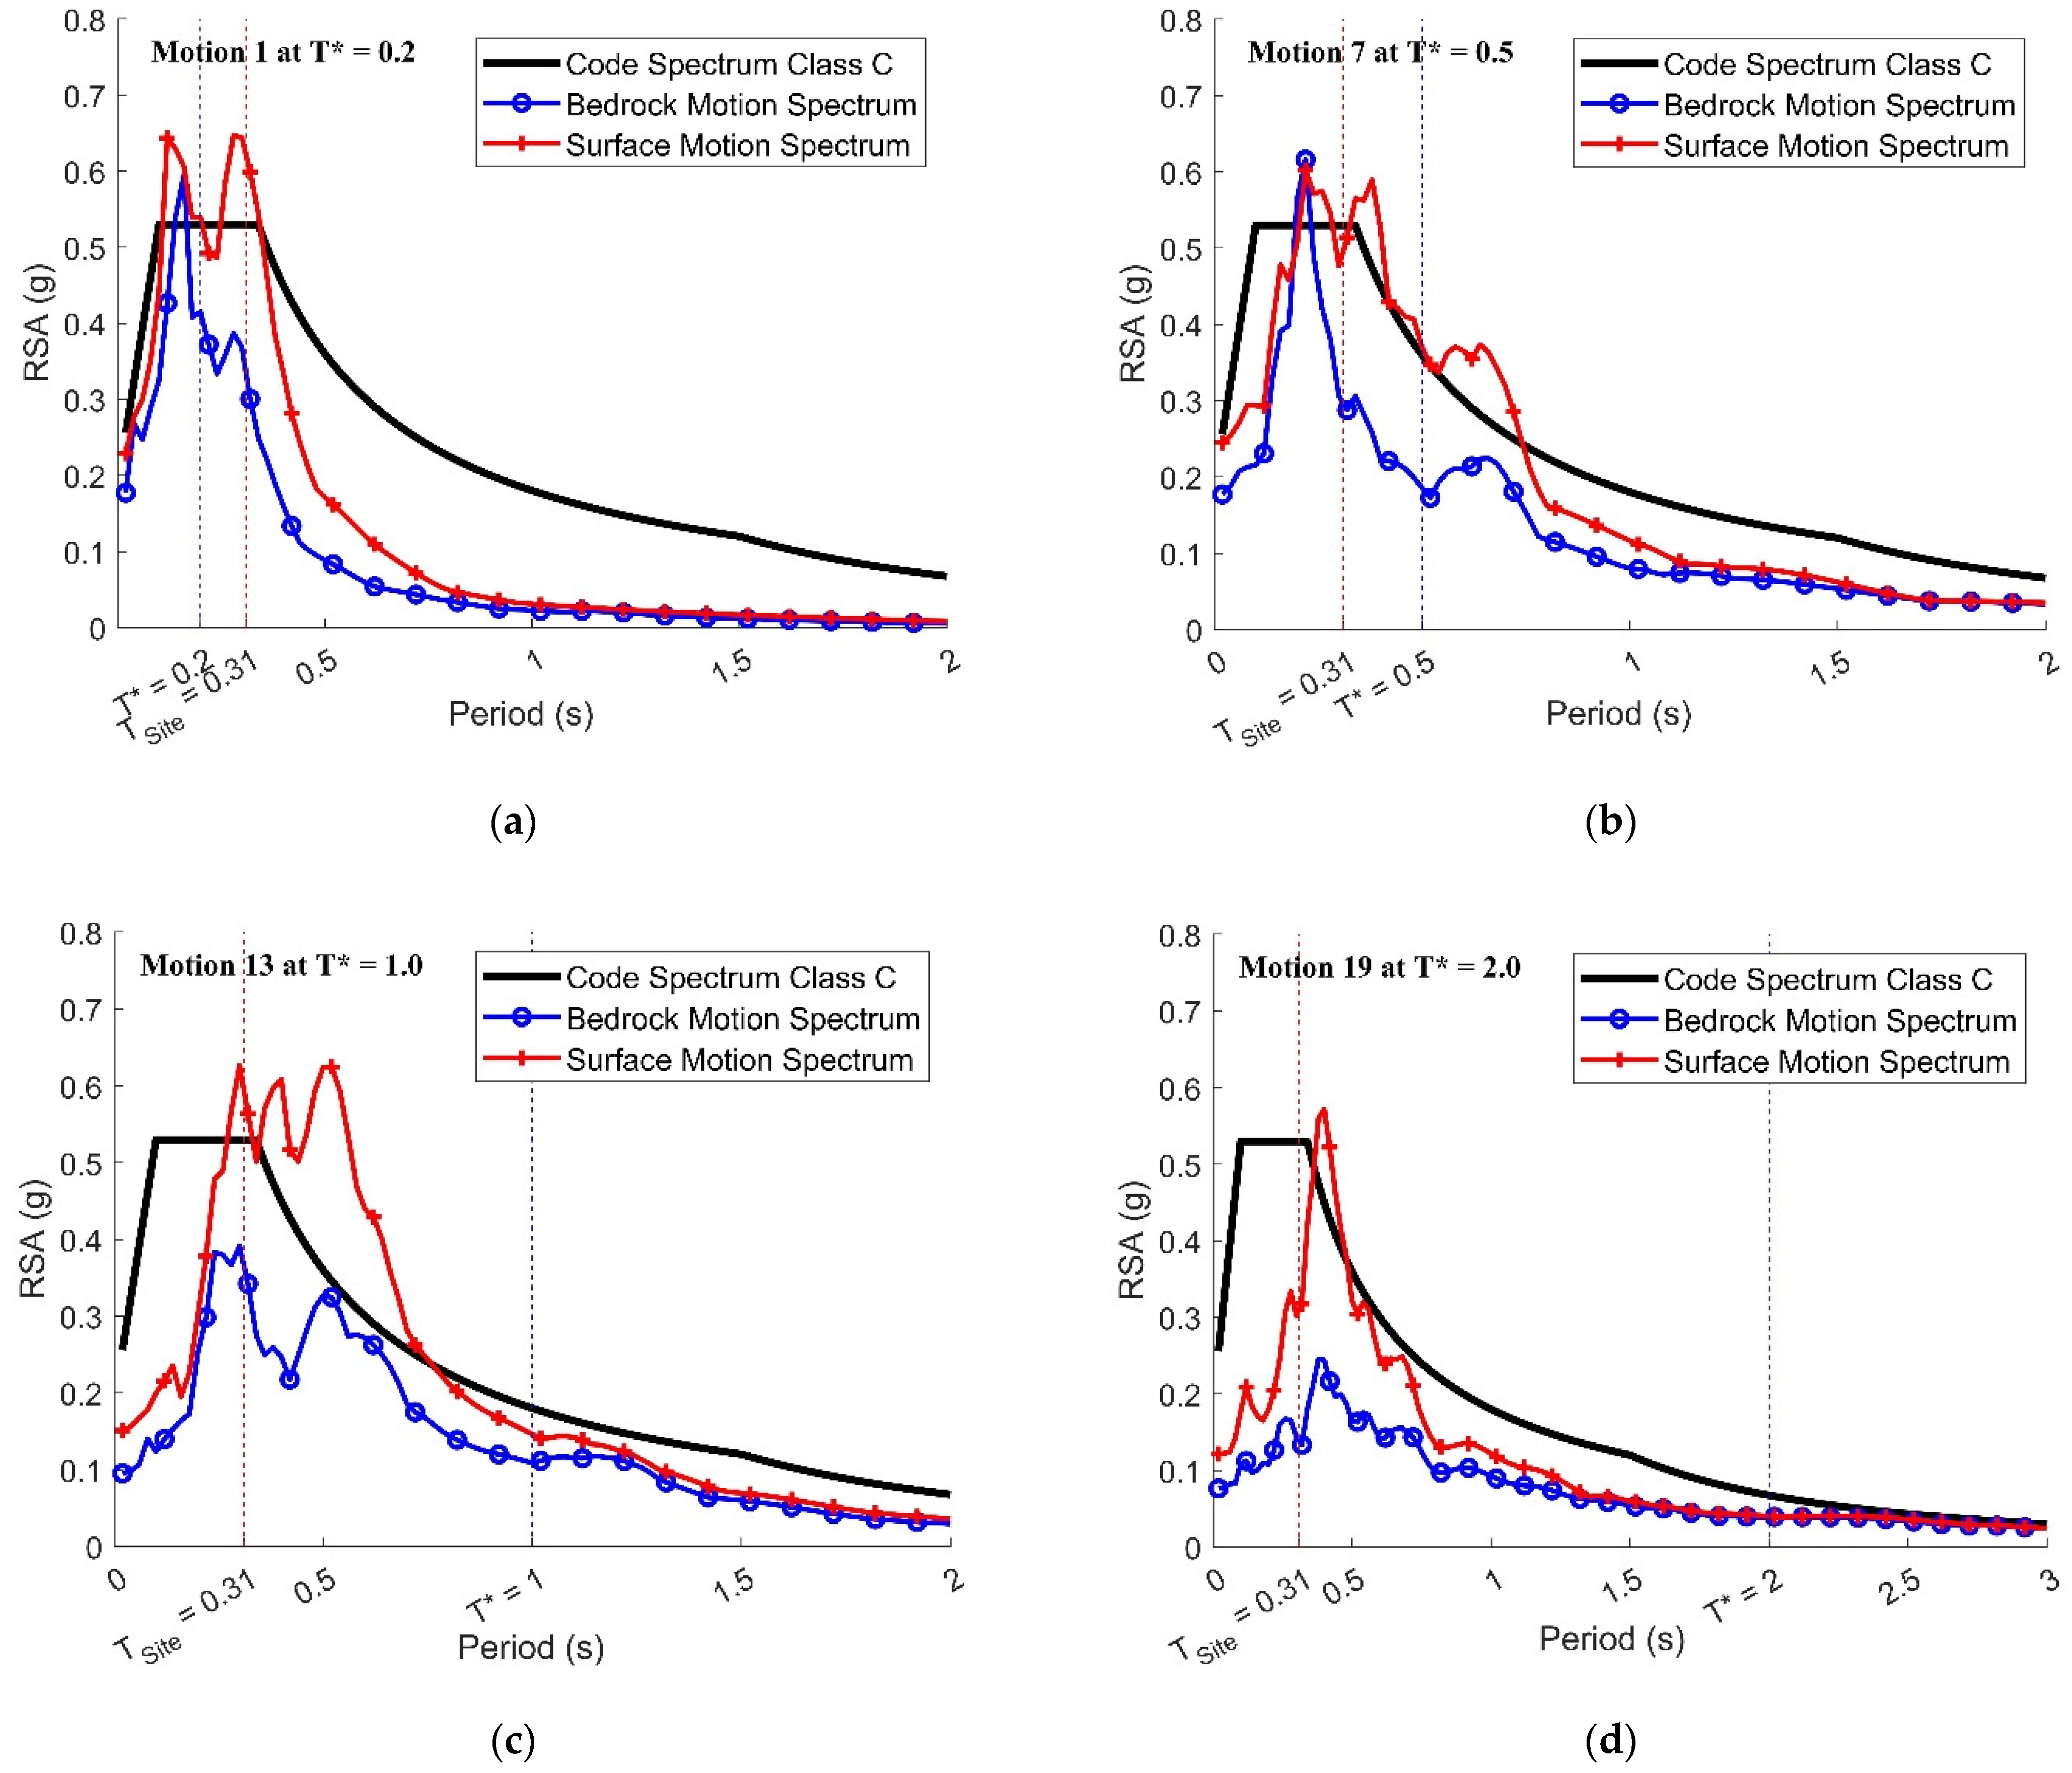
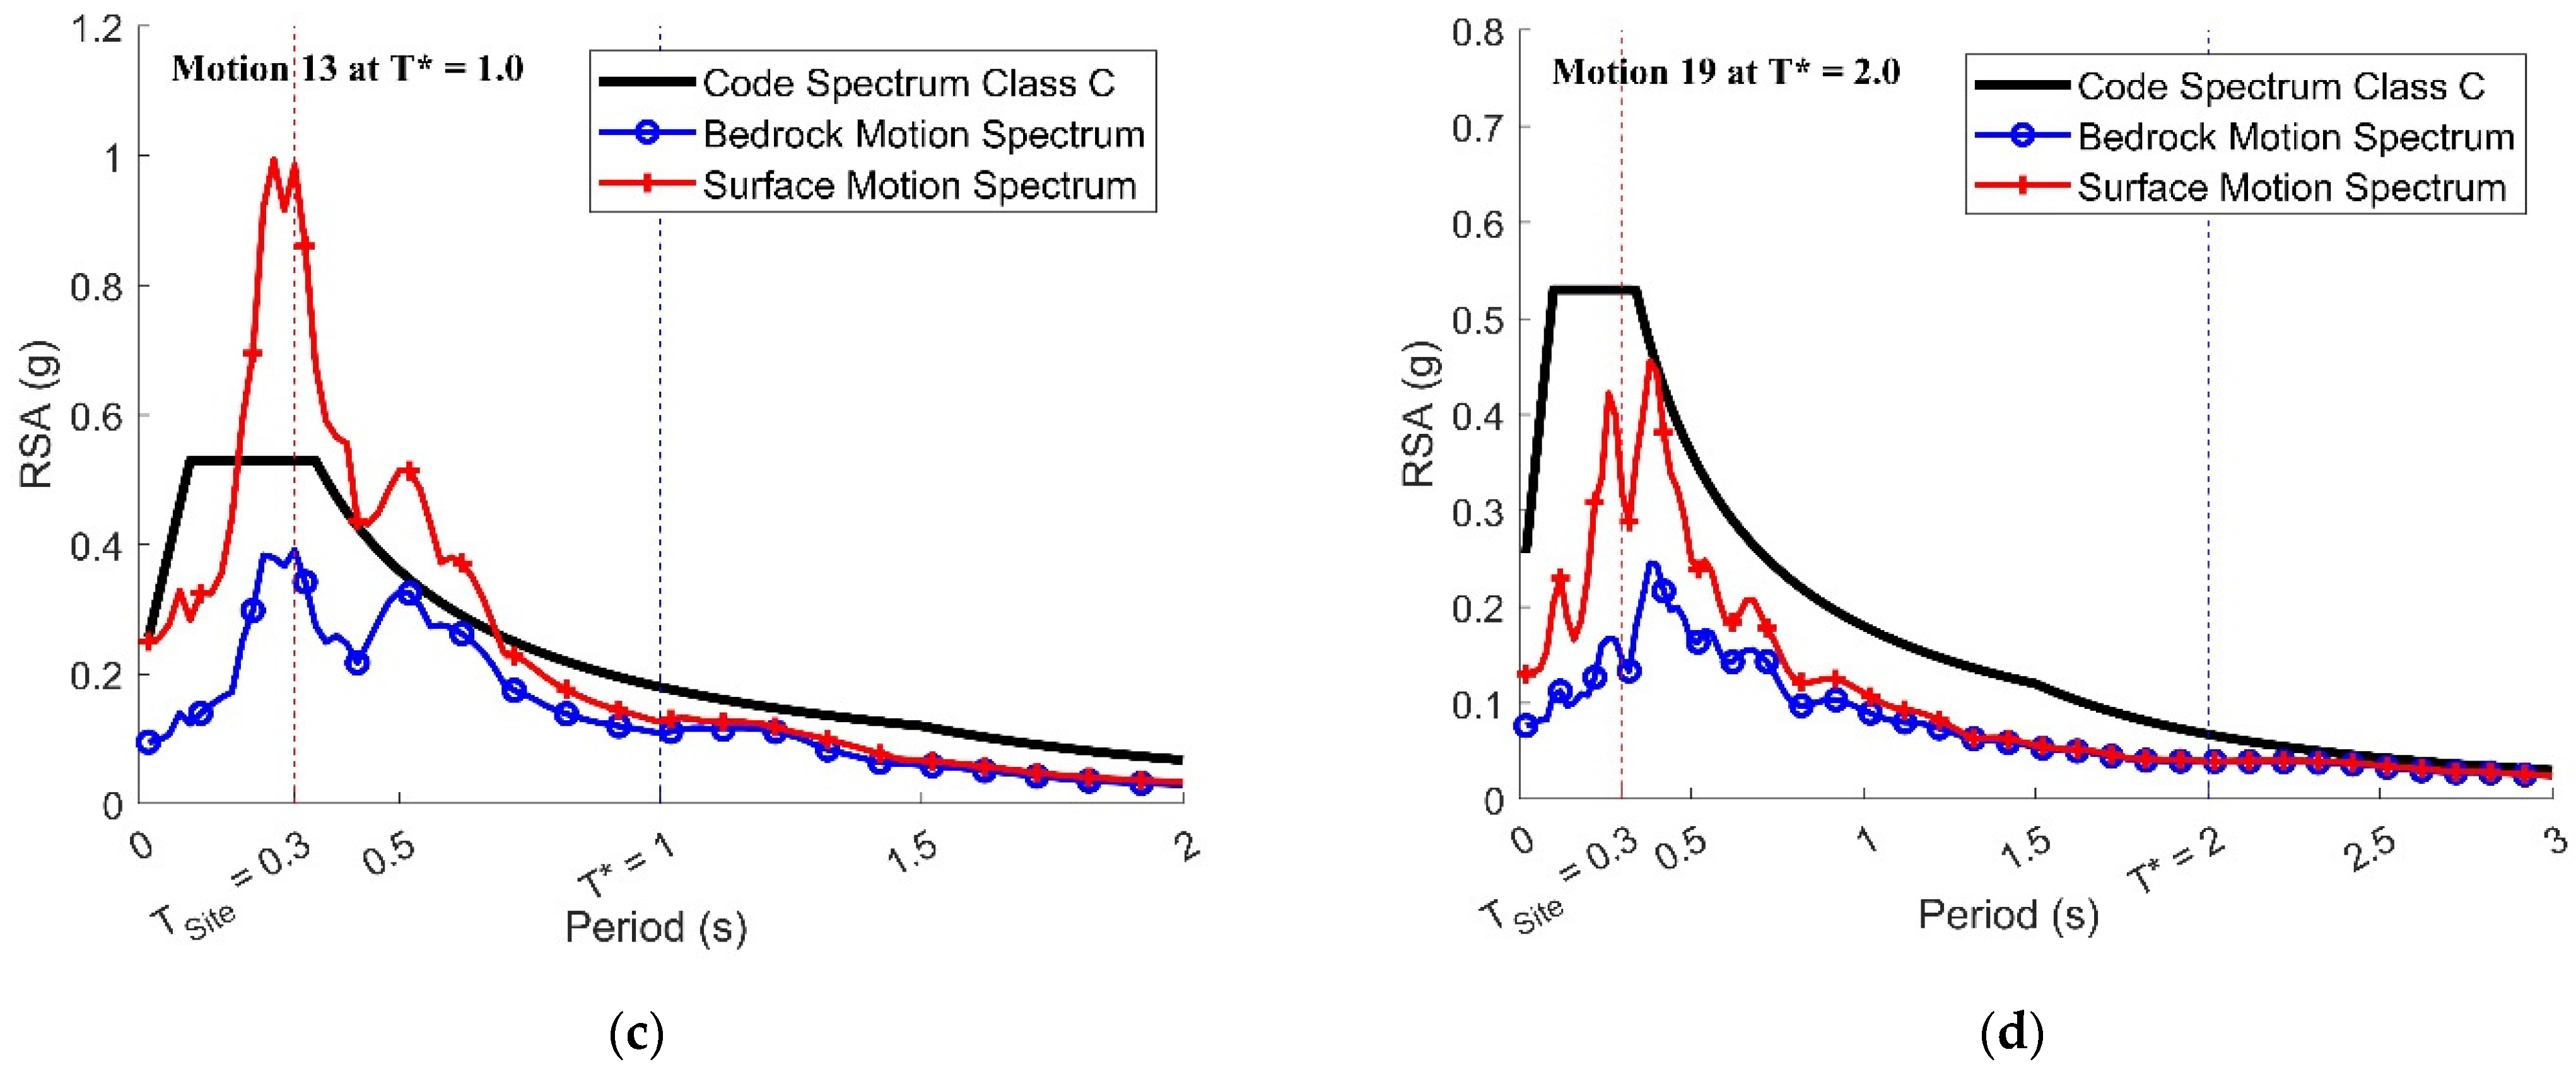
The calculated SWV profiles of the four example borelogs are presented in Figure 8a–d; the estimated initial site natural period without allowing for degradation of the soil shear modulus can be found in Table 6. Interested readers are referred to the Quake Advice website (https://quakeadvice.org, accessed on 1 December 2022) for records of borelogs and soil profiles.
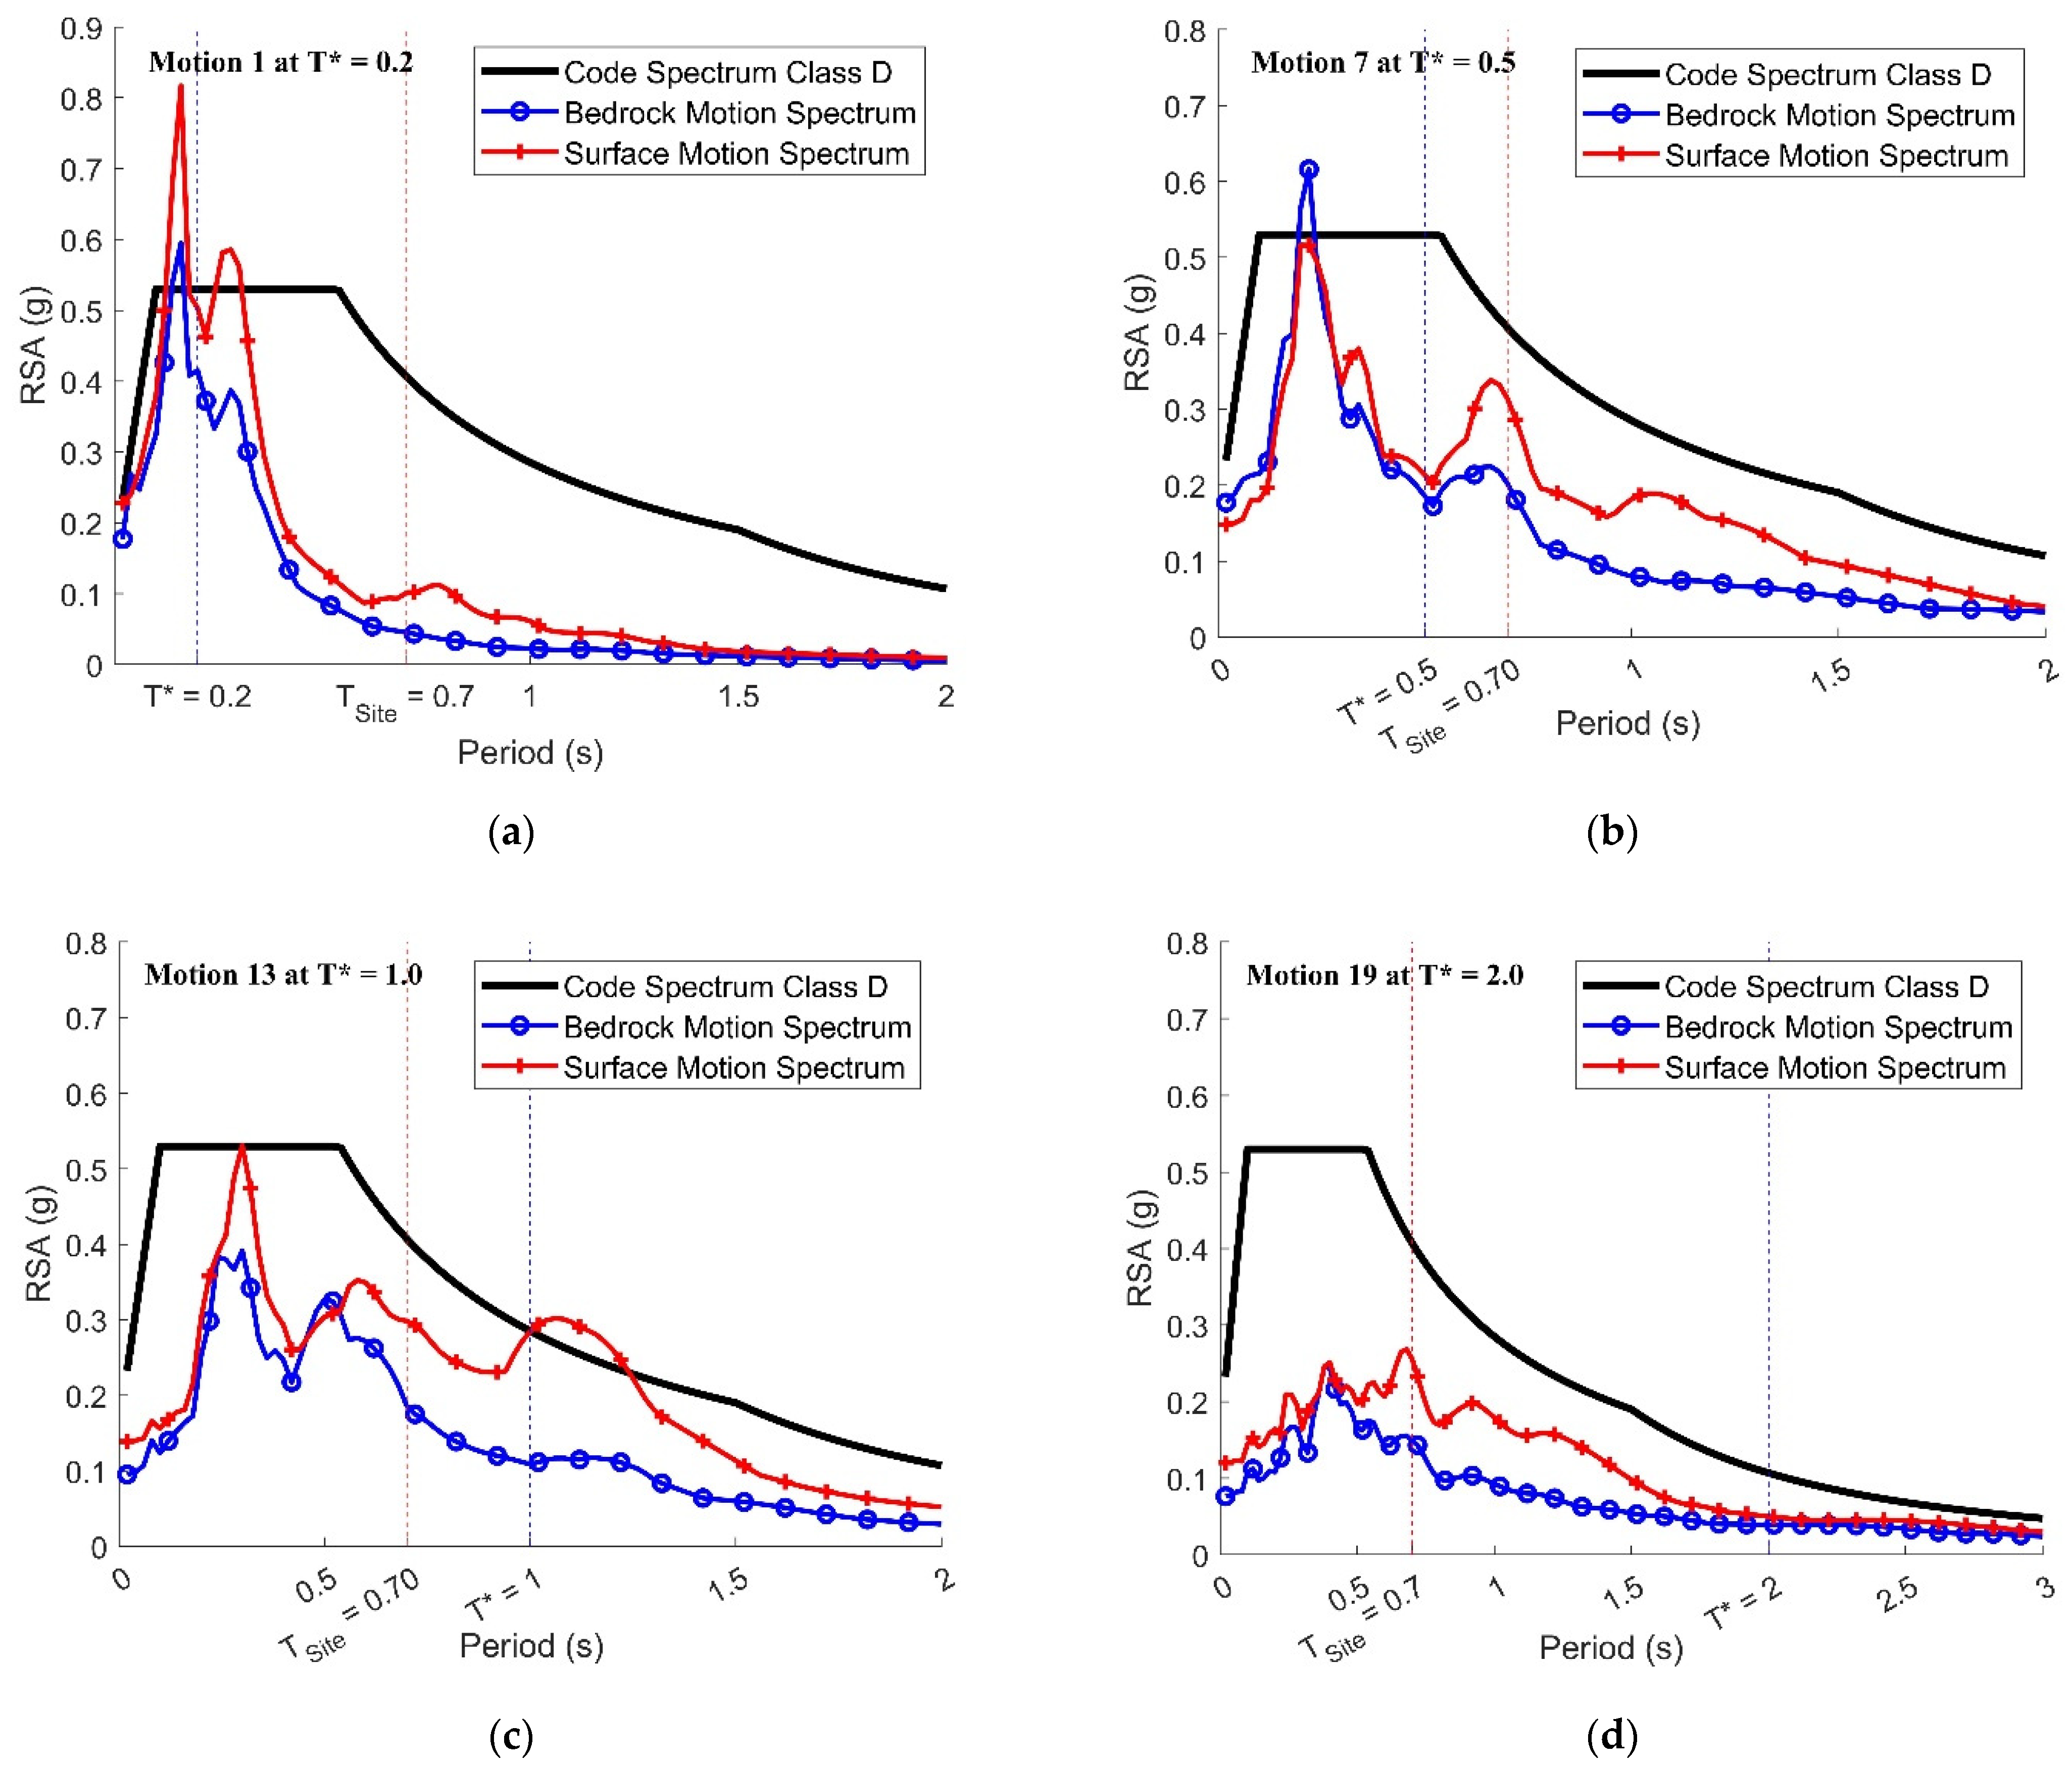
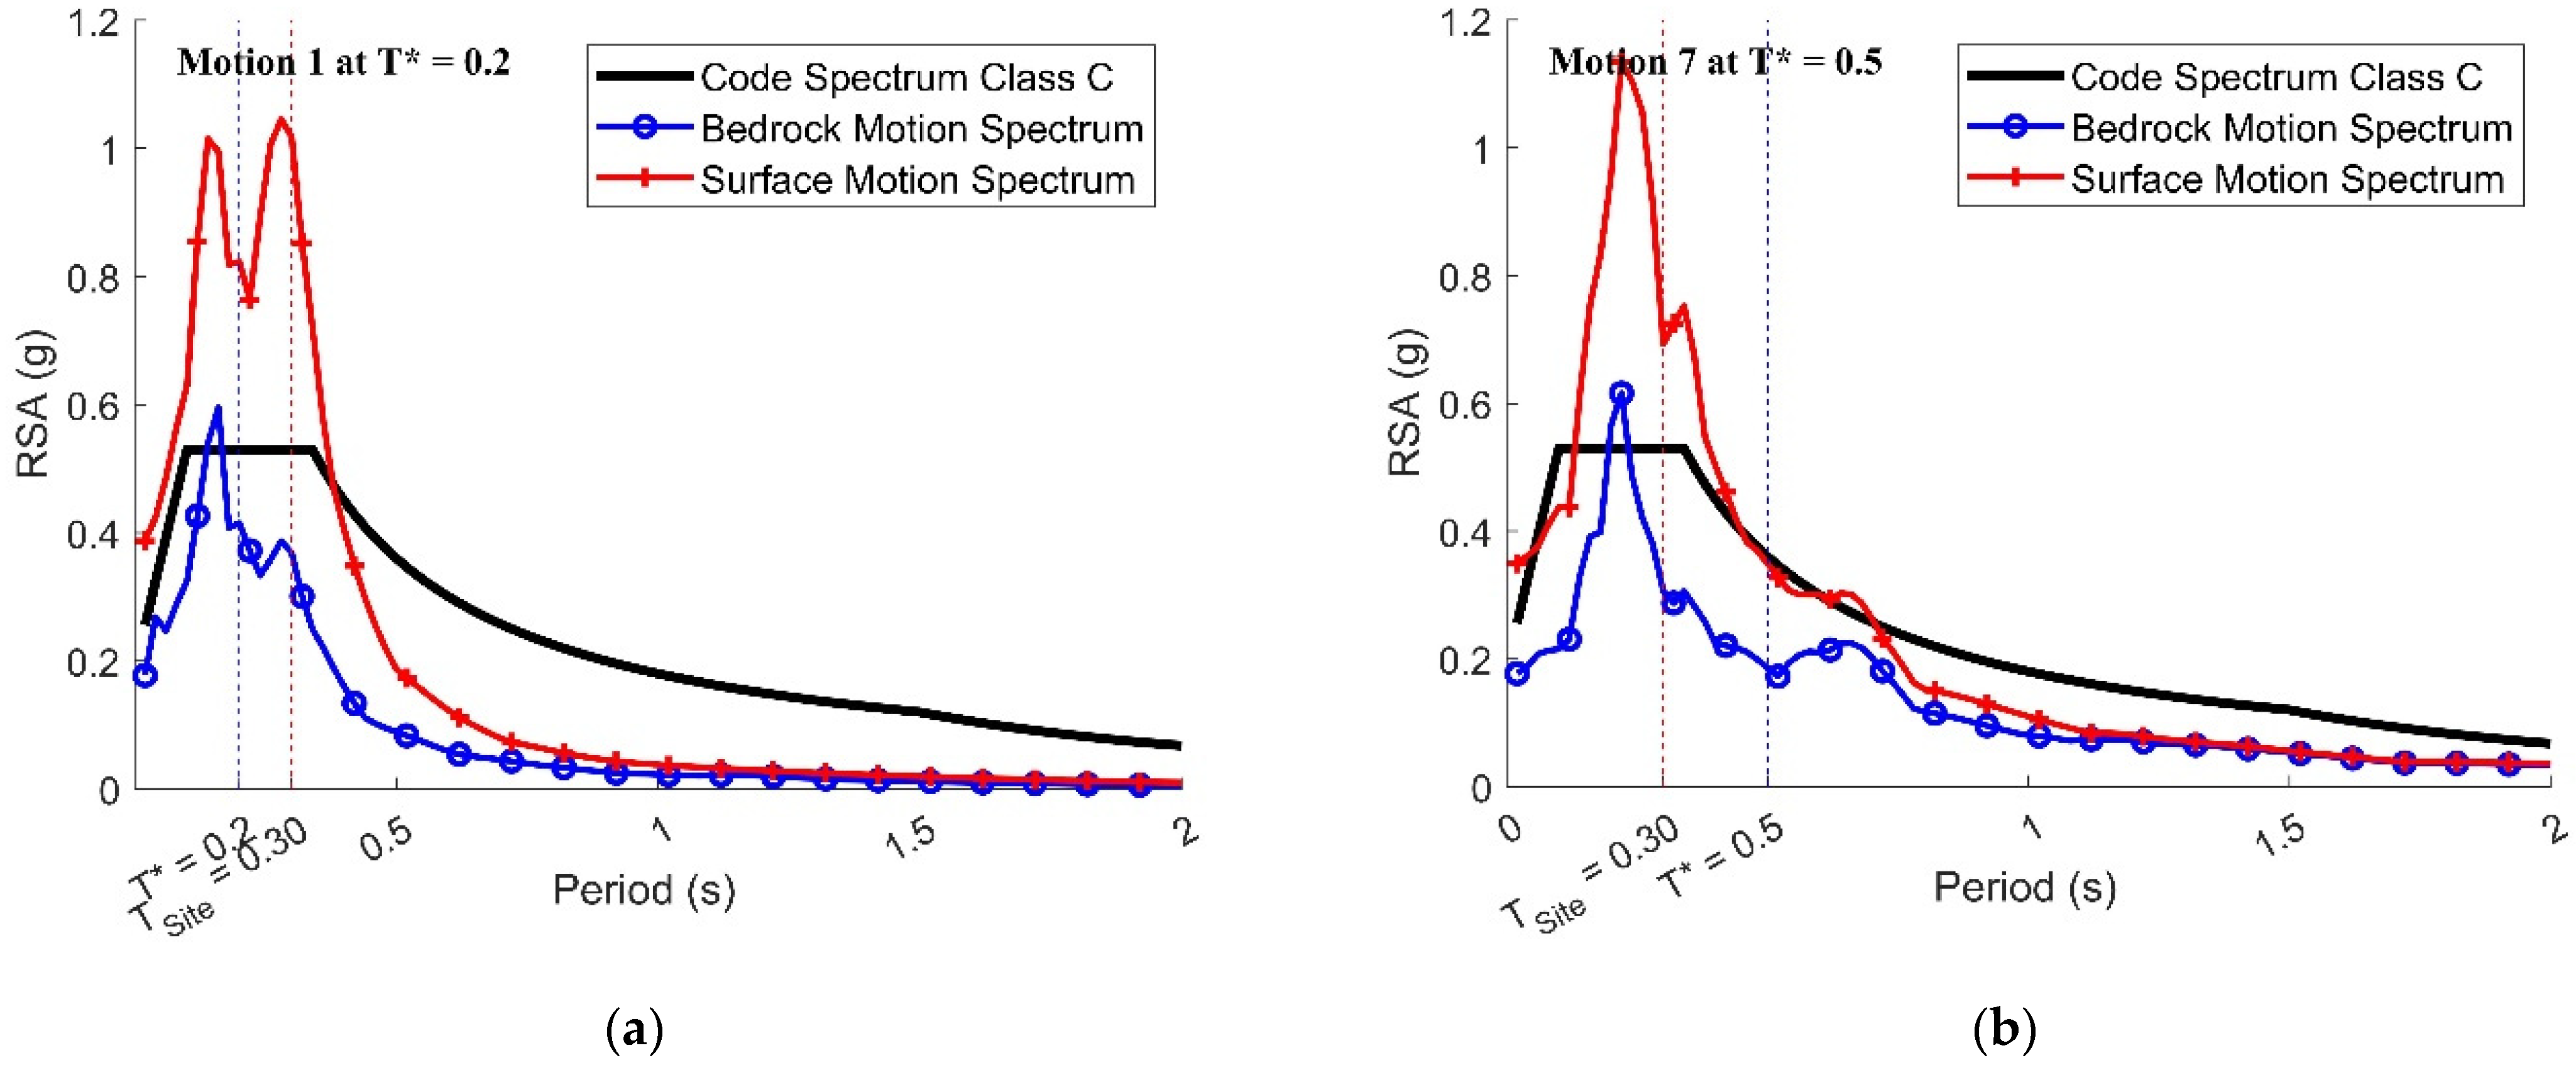
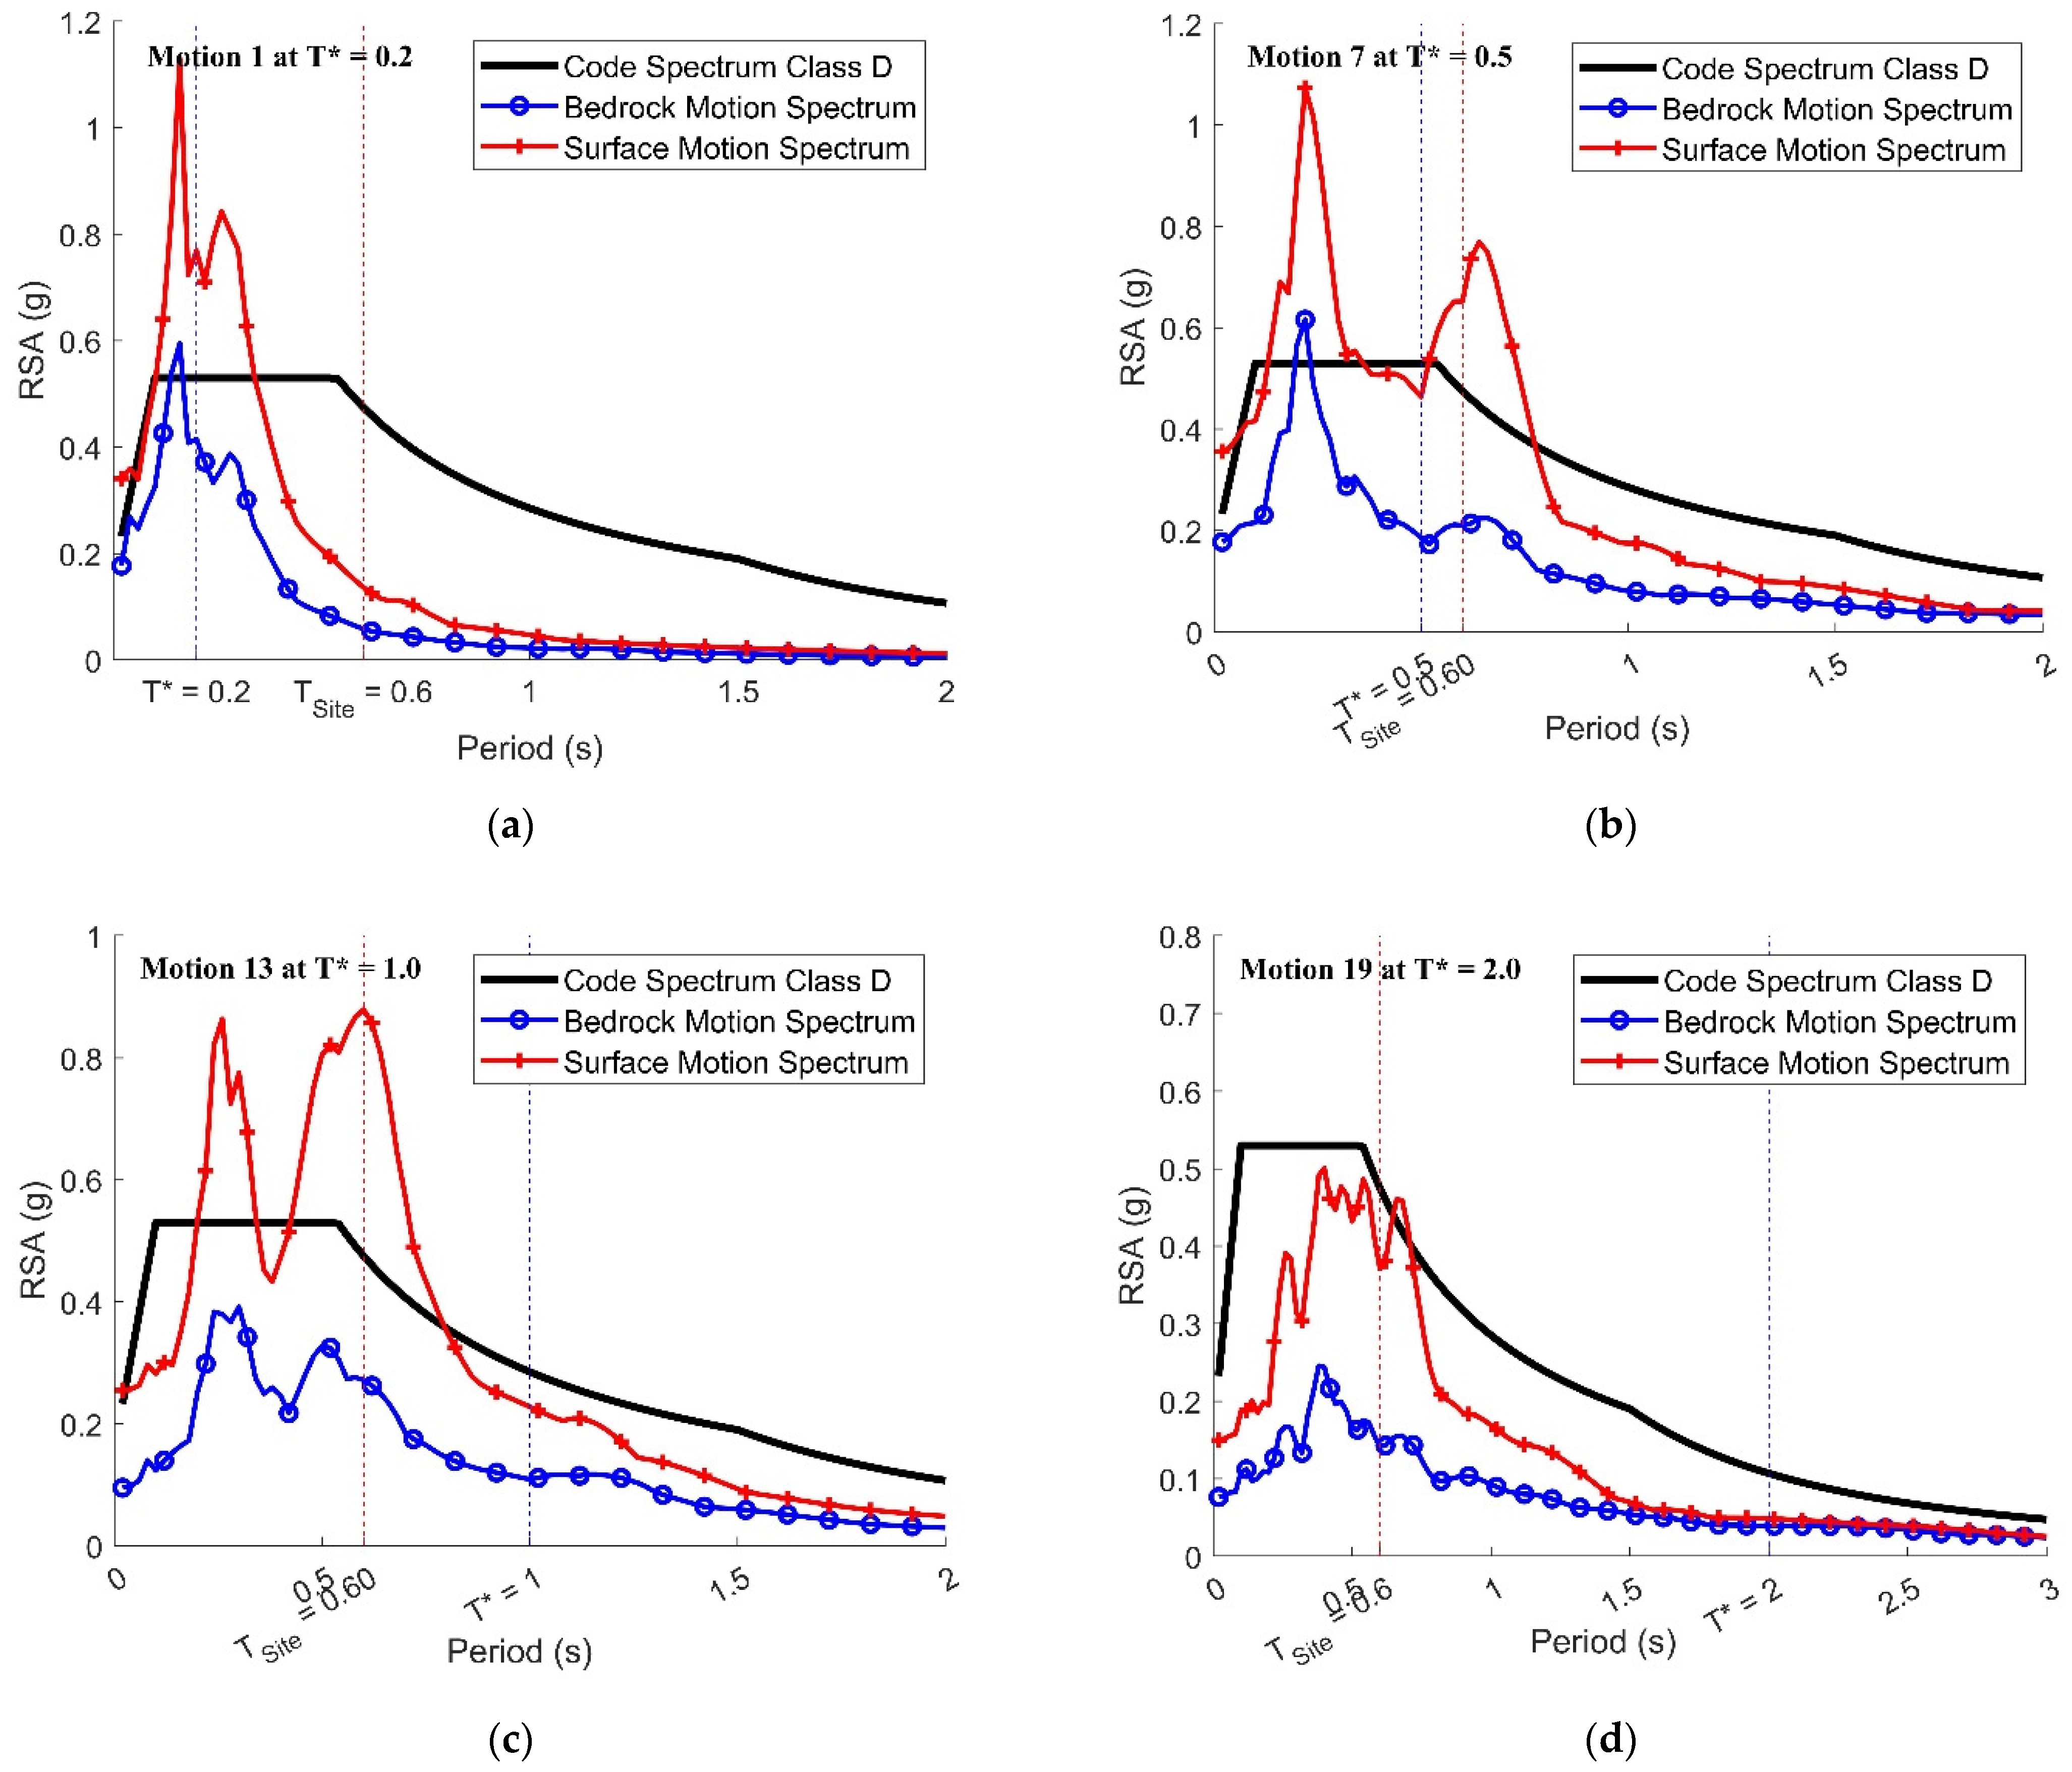
The generated soil surface spectra for borelogs corresponding to four of the selected–scaled bedrock motions (Motion Nos. 1, 7, 13 and 19) for borelog Nos. 1, 4, 7 and 8 are presented in Figure 9a–d, Figure 10a–d, Figure 11a–d and Figure 12a–d, respectively. The motion number identified with each soil spectrum refers to the input excitations from bedrock.
The soil amplification effect depends on several factors, including the impedance contrast between the soil and rock media, the intensity of the bedrock excitation causing soil modulus reduction and increased damping, and the resonance effect between the soil column and the structure. The limitations of the current code spectrum models for soil sites are addressed herein. The impedance contrast is accounted for by assigning amplification ratios to soil sites of different classifications (predominately based on the average shear wave velocity of the soil layers); the effect of the earthquake intensity is not considered in some design standards, such as AS1170.4 [26] and NZS1170.5 [45]; and the resonance effects can be understated in the code spectrum models.
Resonance causes the amplification ratio to peak at a period that is close to or slightly longer than the site period due to the fact of site period elongation. Nevertheless, the amplification ratio embedded in the code spectrum models for soil sites cannot accurately represent the resonance effect because the statistical data analyses for deriving the code amplification ratios smear individual spikes, as shown in Figure 9, Figure 10, Figure 11 and Figure 12. As a result, the code spectrum models underrepresent the actual extent of the site amplification. Therefore, site-specific response spectra and accelerograms are more realistic representations of seismic actions on construction sites with explicit subsoil information.
Site-specific ground motions, as proposed in this study, were developed from bedrock excitations that were less conservative than the code requirements and were amplified through soil layers retrieved on site. In many instances, the site-specific response spectra exceeded the code spectrum at close to the site period and were less conservative at other periods. While site-specific seismic design poses higher earthquake loads to structures that are potentially exposed to soil structure resonance, in situations where the fundamental period of vibration of the structure does not coincide with the site natural period, site-specific seismic design is cost-saving. The authors recommend that engineering practitioners adapt to site-specific seismic design, and the proposed ground motions could be applied in cases where detailed site information is unavailable.
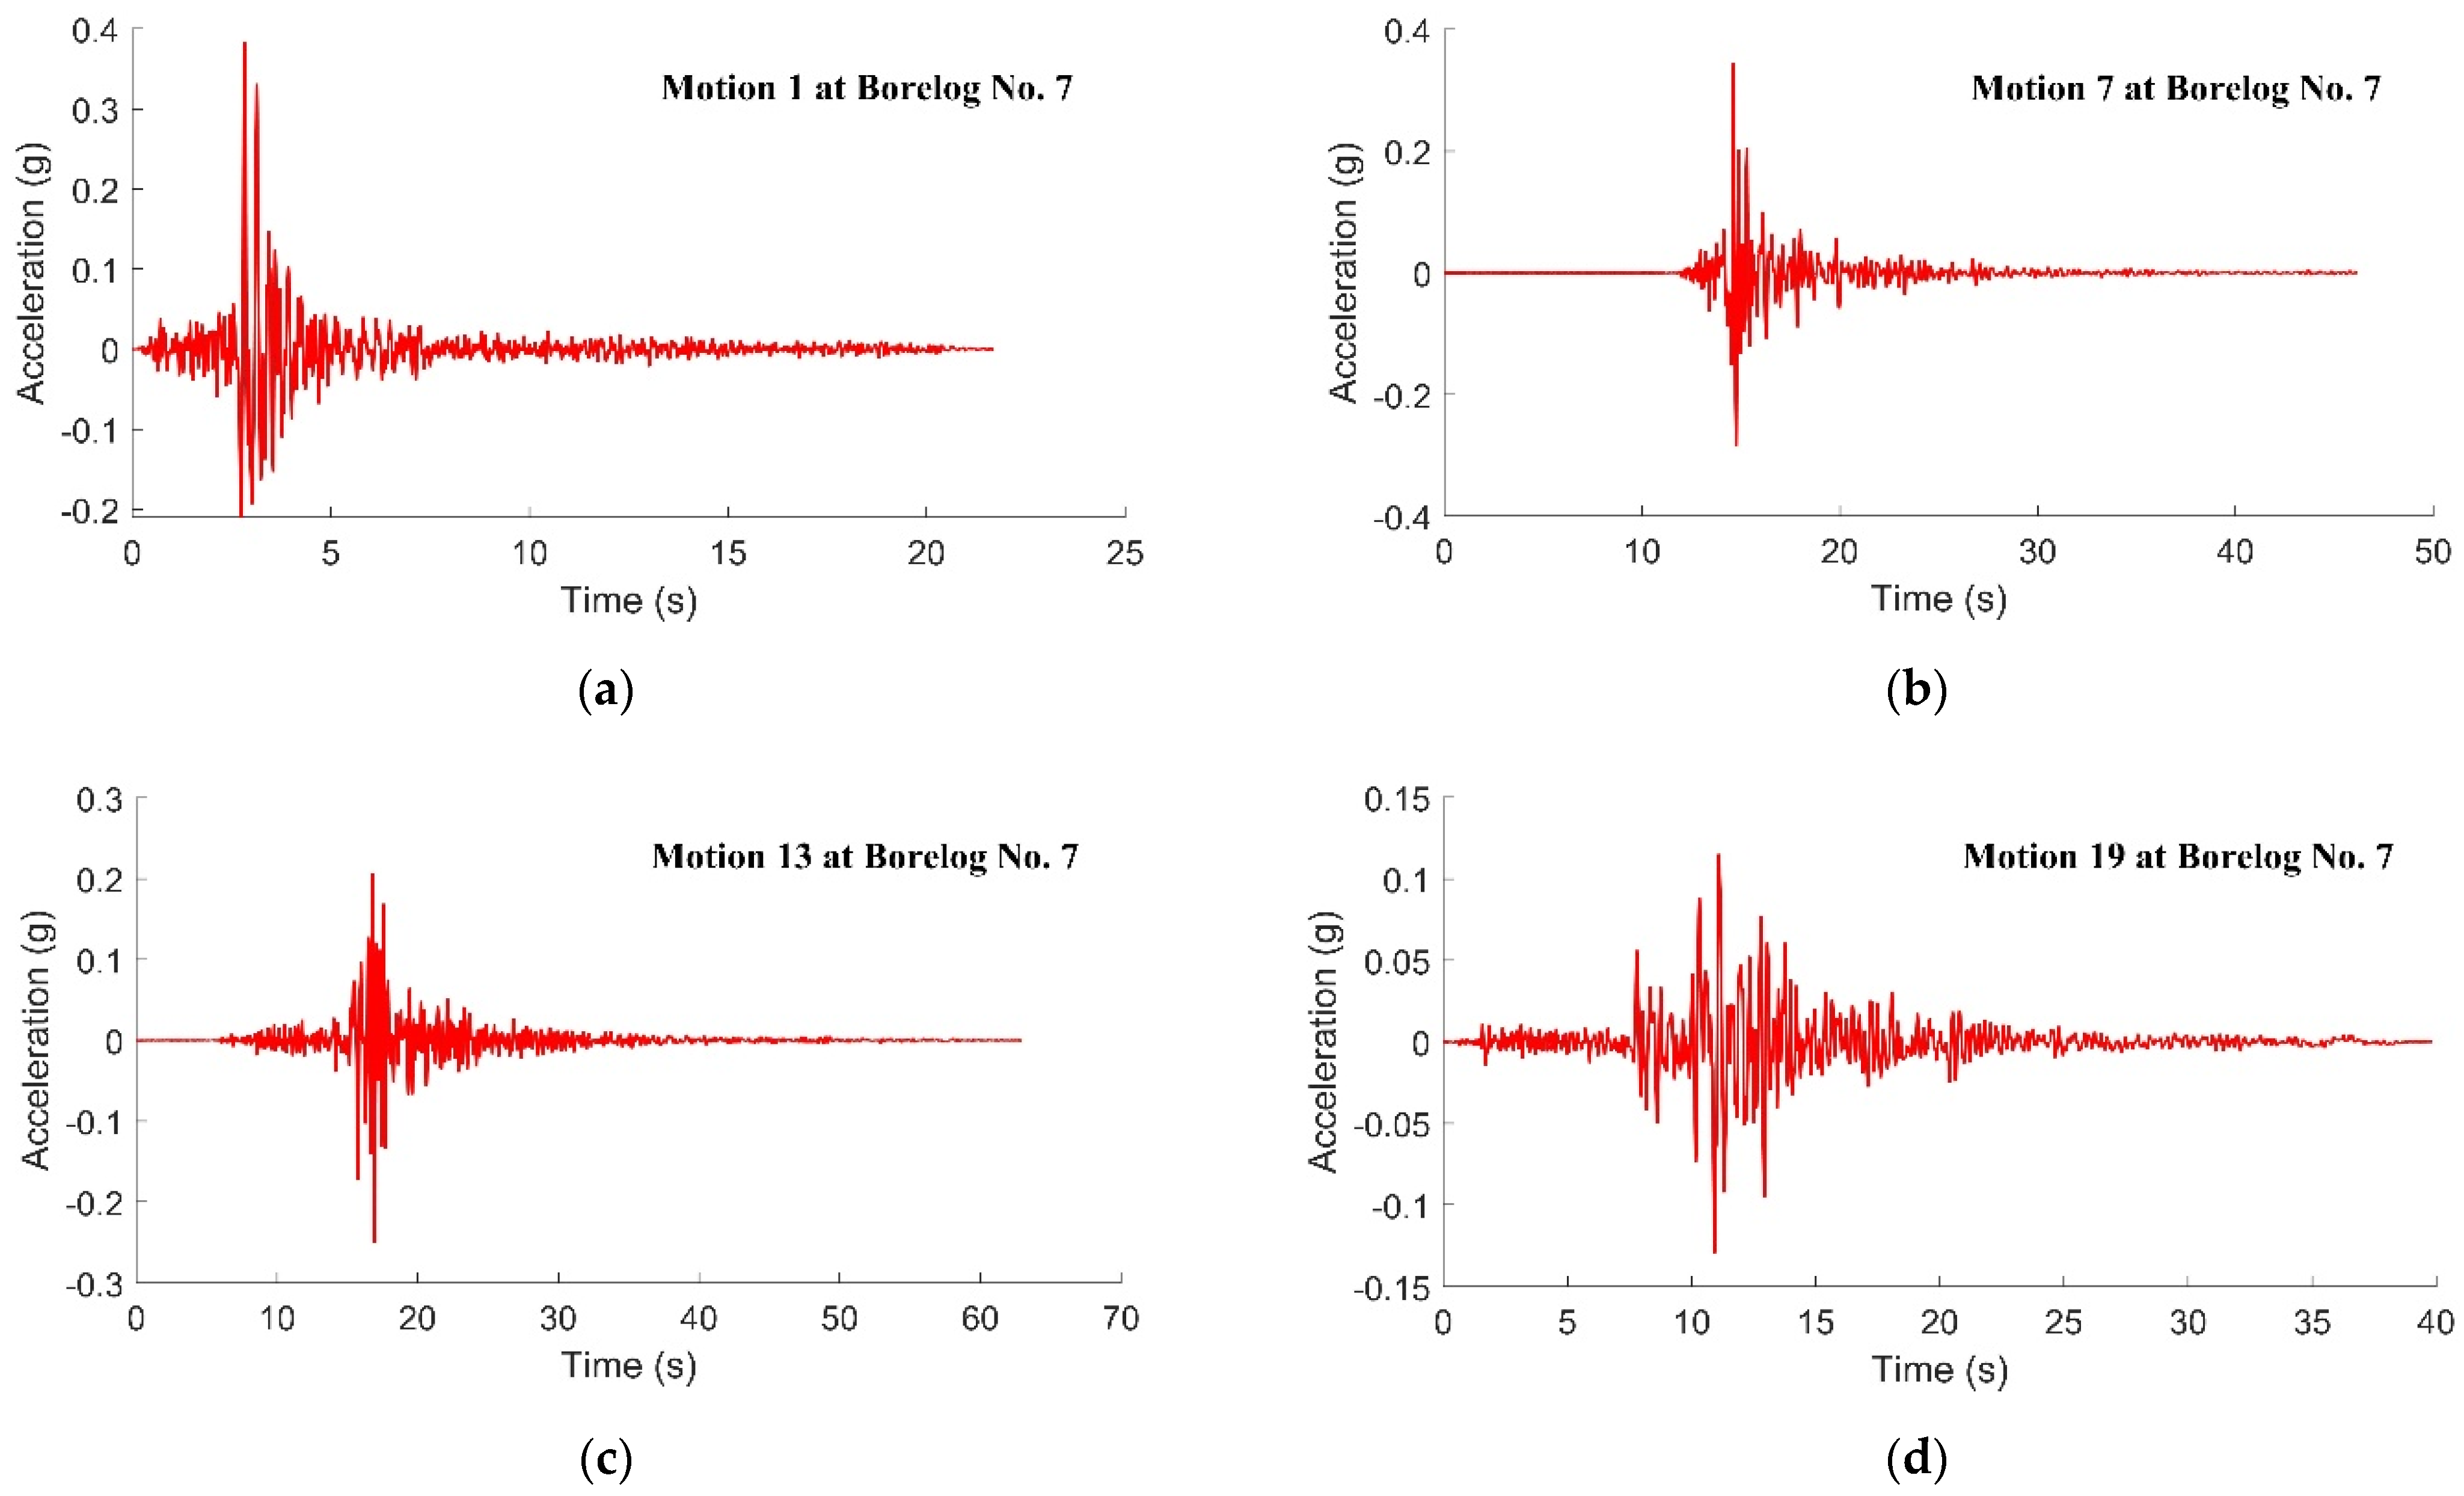
The corresponding acceleration time histories of the surface motions are presented in Figure 13a–d, Figure 14a–d, Figure 15a–d and Figure 16a–d, respectively. The motion number identified with each graph showing the soil surface acceleration time history refers to the input excitations from bedrock.

5. Conclusions

The use of the PEER NGA West2 strong motion database and the associated built-in accelerogram selection and scaling facility was first illustrated using the response spectrum models as specified by the Australian standard for seismic actions for site Class Ce and De as target spectra. The built-in conservatism of the use of the code spectrum models for selecting–scaling accelerograms has much to do with the aggregation of contributions from a range of earthquake scenarios in the development of the spectrum model.
The CMS methodology was then introduced as an alternative approach to constructing target spectra for scaling accelerograms. Less conservative estimates of seismic actions at the bedrock level (compared to the conventional approach of scaling to the code spectrum) were obtained, as a CMS is based on a specific earthquake scenario. Four CMS-based on matching the code spectrum for rock sites at reference periods of 0.2, 0.5, 1 and 2 s were derived for return periods of 500, 1500 and 2500 years. Each of the CMS were used to select and scale accelerograms that were retrieved from the PEER database. Graphs showing CMS corresponding to the return period of 2500 years were presented, along with an example of a selected and scaled accelerogram for each reference period.
A database of 20 borelogs taken from Class Ce, De and Ee sites were collected by the authors. Four of the borelogs (two from Class Ce sites and two from Class De sites) were subjected to site response analyses using accelerograms presented for rock sites as input. A total of sixteen soil surface accelerograms, based on combining four soil column models with four bedrock accelerograms, are presented for engineers and researchers to download at https://quakeadvice.org (accessed on 1 December 2022).

Author Contributions

Conceptualization, H.-H.T.; methodology, Y.H.; software, Y.H. and P.K.; resources, S.M.; writing—original draft preparation, Y.H.; writing—review and editing, P.K., H.-H.T. and S.M. All authors have read and agreed to the published version of the manuscript.

Funding

This research received no external funding.

Data Availability Statement

The data presented in this study are open access at https://quakeadvice.org (accessed on 1 December 2022).

Acknowledgments

The authors acknowledge the financial support from the Australian Research Council (ARC) Discovery Project DP180101593, entitled Seismic Performance of Precast Concrete Buildings for Lower Seismic Regions.

Conflicts of Interest

The authors declare no conflict of interest.

References

  1. Hanks, T.C.; McGuire, R.K. The character of high-frequency strong ground motion. Bull. Seismol. Soc. Am. 1981, 71, 2071–2095. [Google Scholar] [CrossRef]
  2. Boore, D.M. Stochastic simulation of high-frequency ground motions based on seismological models of the radiated spectra. Bull. Seismol. Soc. Am. 1983, 73, 1865–1894. [Google Scholar]
  3. Atkinson, G.M.; Boore, D.M. Ground-motion relations for eastern North America. Bull. Seismol. Soc. Am. 1995, 85, 17–30. [Google Scholar] [CrossRef]
  4. Atkinson, G.M.; Boore, D.M. Evaluation of models for earthquake source spectra in eastern North America. Bull. Seismol. Soc. Am. 1998, 88, 917–934. [Google Scholar] [CrossRef]
  5. Atkinson, G.M.; Silva, W. Stochastic modeling of California ground motions. Bull. Seismol. Soc. Am. 2000, 90, 255–274. [Google Scholar] [CrossRef]
  6. Atkinson, G.M.; Boore, D.M. Earthquake ground-motion prediction equations for eastern North America. Bull. Seismol. Soc. Am. 2006, 96, 2181–2205. [Google Scholar] [CrossRef] [Green Version]
  7. Boore, D.M. Point-Source Stochastic-Method Simulations of Ground Motions for the PEER NGA-East Project; Pacific Earthquake Engineering Research Center (PEER): Berkeley, CA, USA, 2015; pp. 11–49. [Google Scholar]
  8. Tang, Y.; Lam, N.T.; Tsang, H.-H.; Lumantarna, E. An adaptive ground motion prediction equation for use in low-to-moderate seismicity regions. J. Earthq. Eng. 2022, 26, 2567–2598. [Google Scholar] [CrossRef]
  9. Boore, D.M.; Joyner, W.B. Site amplifications for generic rock sites. Bull. Seismol. Soc. Am. 1997, 87, 327–341. [Google Scholar] [CrossRef]
  10. Silva, W.; Darragh, R.; Gregor, N.; Martin, G.; Abrahamson, N.; Kircher, C. Reassessment of Site Coefficients and Near-Fault Factors for Building Code Provisions; US Department of the Interior, US Geological Survey: Reston, VA, USA, 1999. [Google Scholar]
  11. Chandler, A.; Lam, N.; Tsang, H. Shear wave velocity modelling in crustal rock for seismic hazard analysis. Soil Dyn. Earthq. Eng. 2005, 25, 167–185. [Google Scholar] [CrossRef]
  12. Chandler, A.; Lam, N.; Tsang, H. Near-surface attenuation modelling based on rock shear-wave velocity profile. Soil Dyn. Earthq. Eng. 2006, 26, 1004–1014. [Google Scholar] [CrossRef] [Green Version]
  13. Boore, D.M. The uses and limitations of the square-root-impedance method for computing site amplification. Bull. Seismol. Soc. Am. 2013, 103, 2356–2368. [Google Scholar] [CrossRef]
  14. Boore, D.M. Determining generic velocity and density models for crustal amplification calculations, with an update of the generic site amplification for. Bull. Seismol. Soc. Am. 2016, 106, 313–317. [Google Scholar] [CrossRef]
  15. Baker, J.W.; Cornell, C.A. Spectral shape, epsilon and record selection. Earthq. Eng. Struct. Dyn. 2006, 35, 1077–1095. [Google Scholar] [CrossRef]
  16. Baker, J.W. Conditional mean spectrum: Tool for ground-motion selection. J. Struct. Eng. 2011, 137, 322–331. [Google Scholar] [CrossRef]
  17. Jayaram, N.; Lin, T.; Baker, J.W. A computationally efficient ground-motion selection algorithm for matching a target response spectrum mean and variance. Earthq. Spectra 2011, 27, 797–815. [Google Scholar] [CrossRef] [Green Version]
  18. Ancheta, T.D.; Darragh, R.B.; Stewart, J.P.; Seyhan, E.; Silva, W.J.; Chiou, B.S.-J.; Wooddell, K.E.; Graves, R.W.; Kottke, A.R.; Boore, D.M. NGA-West2 database. Earthq. Spectra 2014, 30, 989–1005. [Google Scholar] [CrossRef]
  19. Hu, Y.; Lam, N.; Menegon, S.J.; Wilson, J. The selection and scaling of ground motion accelerograms for Use in stable continental regions. J. Earthq. Eng. 2022, 26, 6284–6303. [Google Scholar] [CrossRef]
  20. Allen, T.I. Stochastic ground-motion prediction equations for southeastern Australian earthquakes using updated source and attenuation parameters. Geosci. Aust. Rec. 2012, 69, 55. [Google Scholar]
  21. Schnabel, P.B.; Lysmer, J.; Seed, H.B. SHAKE: A Computer Program for Earthquake Response Analysis of Horizontally Layered Sites; EERC Report 72-12; University of California, Berkeley: Berkeley, CA, USA, 1972. [Google Scholar]
  22. Bardet, J.; Ichii, K.; Lin, C. EERA: A Computer Program for Equivalent-Linear Earthquake Site Response Analyses of Layered Soil Deposits; University of Southern California, Department of Civil Engineering: Los Angeles, CA, USA, 2000. [Google Scholar]
  23. Kaiser, A.; Van Houtte, C.; Perrin, N.; Wotherspoon, L.; McVerry, G. Site characterisation of GeoNet stations for the New Zealand strong motion database. Bull. New Zealand Soc. Earthq. Eng. 2017, 50, 39–49. [Google Scholar] [CrossRef]
  24. Van Houtte, C.; Bannister, S.; Holden, C.; Bourguignon, S.; McVerry, G. The New Zealand strong motion database. Bull. New Zealand Soc. Earthq. Eng. 2017, 50, 1–20. [Google Scholar] [CrossRef]
  25. Luzi, L.; Puglia, R.; Russo, E.; Orfeus, W. Engineering strong motion database, version 1.0. Ist. Naz. Di Geofis. E Vulcanol. Obs. Res. Facil. Eur. Seismol. 2016, 10, 987–997. [Google Scholar]
  26. AS1170.4, AS 1170. 4; 2007 Structural Design Actions (Reconfirmed 2018) Part 4: Earthquake Actions in Australia. Standards Australia: Sydney, NSW, Australia, 2007.
  27. Cornell, C.A. Engineering seismic risk analysis. Bull. Seismol. Soc. Am. 1968, 58, 1583–1606. [Google Scholar] [CrossRef]
  28. McGuire, R.K. FORTRAN Computer Program for Seismic Risk Analysis; US Geological Survey: Reston, VA, USA, 1976. [Google Scholar]
  29. Baker, J.W.; Cornell, C.A. Correlation of response spectral values for multicomponent ground motions. Bull. Seismol. Soc. Am. 2006, 96, 215–227. [Google Scholar] [CrossRef]
  30. Roberts, J.; Asten, M. Estimating the shear velocity profile of Quaternary silts using microtremor array (SPAC) measurements. Explor. Geophys. 2005, 36, 34–40. [Google Scholar] [CrossRef]
  31. Asten, M.W. On bias and noise in passive seismic data from finite circular array data processed using SPAC methods. Geophys 2006, 71, V153–V162. [Google Scholar] [CrossRef]
  32. Park, C.B.; Miller, R.D.; Xia, J. Multichannel analysis of surface waves. Geophys 1999, 64, 800–808. [Google Scholar] [CrossRef] [Green Version]
  33. Nakamura, Y. A method for dynamic characteristics estimation of subsurface using microtremor on the ground surface. Railw. Tech. Res. Inst. Q. Rep. 1989, 30, 25–33. [Google Scholar]
  34. Kayen, R.E.; Carkin, B.A.; Allen, T.; Collins, C.; McPherson, A.; Minasian, D. Shear-Wave Velocity and Site-Amplification Factors for 50 Australian Sites Determined by the Spectral Analysis of Surface Waves Method; US Department of the Interior, US Geological Survey: Reston, VA, USA, 2015. [Google Scholar]
  35. Seed, H.B.; Idriss, I.M. Influence of soil conditions on ground motions during earthquakes. J. Soil Mech. Found. Div. 1969, 95, 99–137. [Google Scholar] [CrossRef]
  36. Kaklamanos, J.; Baise, L.G.; Thompson, E.M.; Dorfmann, L. Comparison of 1D linear, equivalent-linear, and nonlinear site response models at six KiK-net validation sites. Soil Dyn. Earthq. Eng. 2015, 69, 207–219. [Google Scholar] [CrossRef]
  37. Kaklamanos, J.; Bradley, B.A.; Thompson, E.M.; Baise, L.G. Critical parameters affecting bias and variability in site-response analyses using KiK-net downhole array data. Bull. Seismol. Soc. Am. 2013, 103, 1733–1749. [Google Scholar] [CrossRef] [Green Version]
  38. Kim, B.; Hashash, Y.M. Site response analysis using downhole array recordings during the March 2011 Tohoku-Oki earthquake and the effect of long-duration ground motions. Earthq. Spectra 2013, 29 (Suppl. S1), 37–54. [Google Scholar] [CrossRef]
  39. Thompson, E.M.; Baise, L.G.; Tanaka, Y.; Kayen, R.E. A taxonomy of site response complexity. Soil Dyn. Earthq. Eng. 2012, 41, 32–43. [Google Scholar] [CrossRef]
  40. Yee, E.; Stewart, J.P.; Tokimatsu, K. Elastic and large-strain nonlinear seismic site response from analysis of vertical array recordings. J. Geotech. Geoenvironmental Eng. 2013, 139, 1789–1801. [Google Scholar] [CrossRef]
  41. Papaspiliou, M.; Kontoe, S.; Bommer, J.J. An exploration of incorporating site response into PSHA-part II: Sensitivity of hazard estimates to site response approaches. Soil Dyn. Earthq. Eng. 2012, 42, 316–330. [Google Scholar] [CrossRef] [Green Version]
  42. Imai, T.; Tonouchi, K. Correlation of N Value with S-Wave Velocity and Shear Modulus; The 2nd European Symposium on Penetration Testing: Amsterdam, The Netherlands, 1982; pp. 67–72. [Google Scholar]
  43. Darendeli, M.B. Development of a New Family of Normalized Modulus Reduction and Material Damping Curves; The University of Texas at Austin: Austin, TX, USA, 2001. [Google Scholar]
  44. Hu, Y.; Lam, N.; Khatiwada, P.; Menegon, S.J.; Looi, D.T. Site-specific response spectra: Guidelines for engineering practice. Civ 2021, 2, 712–735. [Google Scholar] [CrossRef]
  45. NZS1170.5, NZS 1170.5; 2005 Strutural Design Actions Part 5: Earthquake Actions-New Zealand. New Zealand Standard: Wellington, New Zealand, 2005.
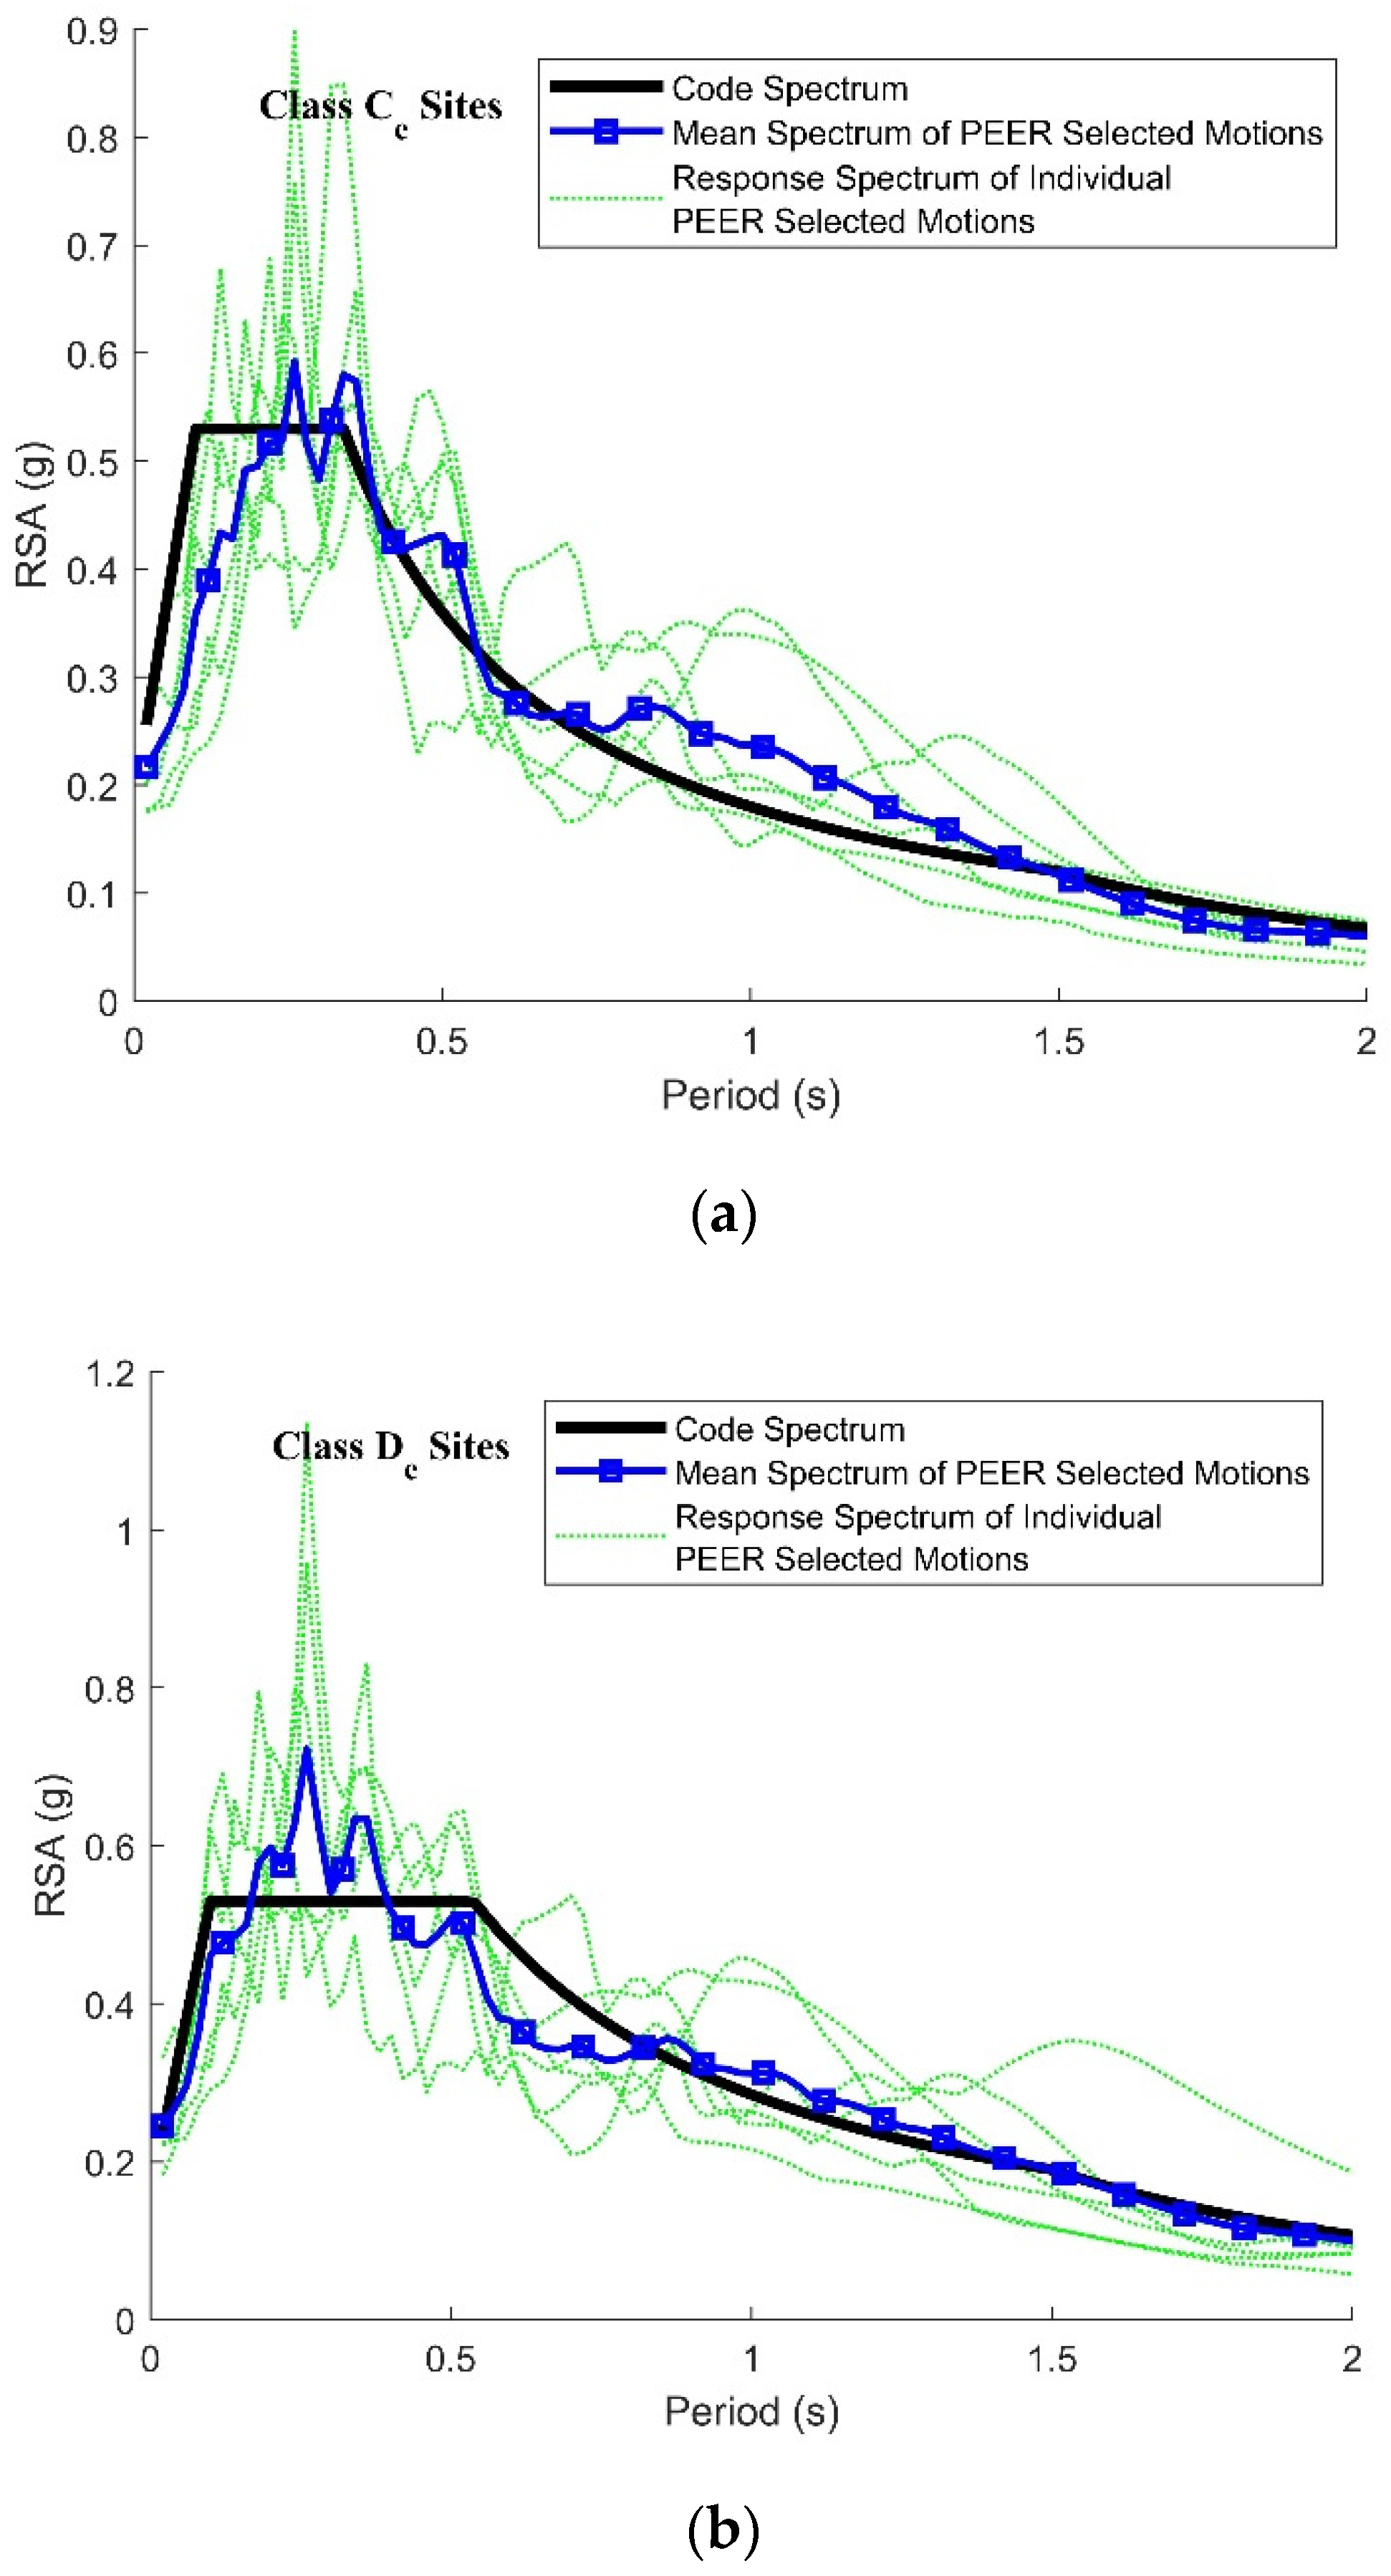
Figure 1. Acceleration response spectra of code-compatible records for a return period of 2500 years: (a) Class Ce sites; (b) Class De sites.
Civileng 04 00018 g001
Figure 2. Example acceleration time histories of the scaled accelerograms for matching with the code spectrum models for a return period of 2500 years: (a) Class Ce sites; (b) Class De sites.
Civileng 04 00018 g002
Figure 3. An example scaled event-specific spectrum and the associated scenario-specific median spectrum for the reference period of T * = 0.5 s; the median spectrum was scaled up by 1.18 times the standard deviation ( σ ) to match the code spectrum at T * = 0.5 s.
Civileng 04 00018 g003
Figure 4. Conditional mean spectrum for the reference period of T * = 0.5 s.
Civileng 04 00018 g004
Figure 5. The conditional mean spectra for a return period of 2500 years: (a) T * = 0.2 s; (b) T * = 0.5 s; (c) T * = 1 s; (d) T * = 2 s.
Civileng 04 00018 g005
Figure 6. Response spectra of the scaled accelerograms for matching with the CMS and code spectrum models for a return period of 2500 years: (a) T * = 0.2 s; (b) T * = 0.5 s; (c) T * = 1 s; (d) T * = 2 s.
Civileng 04 00018 g006
Figure 7. Acceleration time histories of the scaled accelerograms for matching with the CMS for a return period of 2500 years: (a) Motion 1; (b) Motion 7; (c) Motion 13; (d) Motion 19.
Civileng 04 00018 g007
Figure 8. Initial shear wave velocity profiles based on: (a) borehole ref No. 1; (b) borehole ref No. 4; (c) borehole ref No. 7; (d) borehole ref No. 8.
Civileng 04 00018 g008
Figure 9. Soil surface spectra and bedrock spectra (Class Ce site with borelog ref No. 1): (a) Motion 1; (b) Motion 7; (c) Motion 13; (d) Motion 19.
Civileng 04 00018 g009
Figure 10. Soil surface spectra and bedrock spectra (Class De site with borelog ref No. 4): (a) Motion 1; (b) Motion 7; (c) Motion 13; (d) Motion 19.
Civileng 04 00018 g010
Figure 11. Soil surface spectra and bedrock spectra (Class Ce site with borelog ref No. 7): (a) Motion 1; (b) Motion 7; (c) Motion 13; (d) Motion 19.
Civileng 04 00018 g011aCivileng 04 00018 g011b
Figure 12. Soil surface spectra and bedrock spectra (Class Ce site with borelog ref No. 8): (a) Motion 1; (b) Motion 7; (c) Motion 13; (d) Motion 19.
Civileng 04 00018 g012
Figure 13. Acceleration time histories of surface motions (borelog ref No. 1): (a) Motion 1; (b) Motion 7; (c) Motion 13; (d) Motion 19.
Civileng 04 00018 g013
Figure 14. Acceleration time histories of surface motions (borelog ref No. 6): (a) Motion 1; (b) Motion 7; (c) Motion 13; (d) Motion 19.
Civileng 04 00018 g014aCivileng 04 00018 g014b
Figure 15. Acceleration time histories of surface motions (borelog ref No. 7): (a) Motion 1; (b) Motion 7; (c) Motion 13; (d) Motion 19.
Civileng 04 00018 g015
Figure 16. Acceleration time histories of surface motions (borelog ref No. 8): (a) Motion 1; (b) Motion 7; (c) Motion 13; (d) Motion 19.
Civileng 04 00018 g016aCivileng 04 00018 g016b
Table 1. Selection criteria for input into the PEER user interface for retrieving strong motions.
Type of InputInput InformationRemarks
Fault typeReverse/obliqueTypical of intraplate earthquakes
Magnitude rangeM5–M7.5Typical size of destructive local earthquakes
Distance rangeRjb 10–200 kmJoyner and Boore Distance
Site shear wave velocity100–800 m/sRepresentative of soil conditions
Table 2. Listing of the records selected and scaled to match the Australian code spectrum for return periods of 2500 years for Class Ce and De sites.
Class Ce Sites
Earthquake NameYearStation NameMagnitudeRjb (km)Scaling Factor
Friuli_Italy-011976Tolmezzo6.514.970.69
San Fernando1971LA—Hollywood Stor FF6.6122.770.84
Kern County1952Taft Lincoln School7.3638.421.11
San Fernando1971Castaic—Old Ridge Route6.6119.330.85
Coalinga-011983Parkfield-Fault Zone 166.3626.21.12
Coalinga-011983Cantua Creek School6.3623.780.78
Class De Sites
Earthquake NameYearStation NameMagnitudeRjb (km)Scaling Factor
Kern County1952Taft Lincoln School7.3638.421.40
Coalinga-011983Cantua Creek School6.3623.780.98
Coalinga-011983Parkfield—Fault Zone 166.3626.21.41
San Fernando1971LA—Hollywood Stor FF6.6122.771.06
Friuli_Italy-011976Tolmezzo6.514.970.88
San Fernando1971Palmdale Fire Station6.6124.161.62
Table 3. Correlation coefficients ρ T , T * .
T * / T 0.212
0.21.00.440.26
10.441.00.75
20.260.751.0
Table 4. M-R combinations and epsilon values for the conditional mean spectra.
Return Period (Year)Hazard FactorPeriod of Interest (s)
0.20.512
5000.08M5.5R23 ε = 0.99M6R36 ε = 1.18M6.5R53 ε = 1.36M7R143 ε = 1.16
15000.12M5.5R17 ε = 0.96M6R27 ε = 1.28M6.5R40 ε = 1.49M7R101 ε = 1.44
25000.144M5.5R15 ε = 1.00M6R23 ε = 1.31M6.5R23 ε = 1.52M7R85 ε = 1.55
Table 5. Listing of the twenty-four accelerograms to match with the conditional mean spectrum for a return period of 2500 years.
Accelerogram Ref. NumberEarthquake NameReference Periods (s)YearStation NameMagnitudeRjb (km)PGA (g)Scaling Factor
1Whittier Narrows-020.21987Mt Wilson—CIT Seis Sta5.2716.40.1751.21
2Northridge-060.21994Beverly Hills—12520 Mulhol5.2810.60.1300.85
3Christchurch—20110.22011PARS5.798.50.1260.61
4Sierra Madre0.21991Cogswell Dam—Right Abutment5.6117.80.1510.50
5Friuli (aftershock 9)_Italy0.21976San Rocco5.511.90.1271.41
6Lytle Creek0.21970Wrightwood—6074 Park Dr5.3310.70.2151.06
7Christchurch—20110.52011GODS5.799.10.1750.63
8Chi-Chi_Taiwan-050.51999HWA0316.239.30.1281.91
9Chi-Chi_Taiwan-050.51999HWA0056.232.70.1241.46
10Whittier Narrows-010.51987Pacoima Kagel Canyon5.9931.60.1691.04
11Chi-Chi_Taiwan-030.51999CHY0416.240.80.1321.00
12N. Palm Springs0.51986Anza—Red Mountain6.0638.20.1711.77
13Chi-Chi_Taiwan-0611999CHY0416.345.70.0940.53
14Northridge-0111994LA—Temple & Hope6.6928.80.1130.62
15Coalinga-0111983Parkfield—Fault Zone 116.3627.10.0841.08
16Coalinga-0111983Parkfield—Stone Corral 3E6.3632.80.1701.13
17San Fernando11971Lake Hughes #46.6119.40.1981.27
18Chi-Chi_Taiwan-0611999WHA0196.352.40.0871.68
19Loma Prieta21989SF—Diamond Heights6.9371.20.0760.67
20Chuetsu-Oki_Japan22007NGN0046.878.20.0721.80
21Chuetsu-Oki_Japan22007NGNH286.876.70.0511.42
22Iwate_Japan22008AKT0096.91190.0861.66
23Loma Prieta21989Berkeley—Strawberry Canyon6.9378.30.0771.01
24Chuetsu-Oki_Japan22007NGNH276.891.40.0501.29
Table 6. Listing of 20 borelogs of site classification Ce, De and Ee.
Reference NumberSite Natural Period (s)Site ClassificationTotal Depth to Bedrock (m)Average SWV (m/s)Site LocationCompositionDescription
10.31Ce16.5214.2SydneyCohesionlessMedium-depth soil site of dense silty sand underlain by sandstone
20.41Ce25.95254.3MelbourneCohesionlessMedium-depth soil site of mixture of silty and clayey sand underlain by hard basalt
30.60De30199.6MelbourneCohesionlessDeep soil site of clayed sand underlain by basalt
40.70De28.6164.2New CastleCohesionlessMedium-depth soil site with 23.5 m loose sand and 5.1 m of medium dense gravel underlain by tuff and sandstone
50.93Ee50.5217.0MelbourneCohesionlessVery deep soil site of wet poorly graded sand underlain by sandstone
60.18Ce9.55207.2MelbourneCohesiveShallow soil site of soft-to-stiff sandy clay (medium plasticity) underlain by siltstone
70.30Ce18.3246.4MelbourneCohesiveMedium-depth soil site with 3.7 m firm clay and 14.6 m very stiff clay (low plasticity) underlain by siltstone
80.60De37.3246.6MelbourneCohesiveDeep soil site of stiff-to-hard wet clay (low plasticity) underlain by sandstone
90.67De33.5199.3BrisbaneCohesiveDeep soil site of stiff clay (high plasticity) underlain by medium strength phyllite; 4.25 m of very soft clay found at 6 m depth
100.84De42.5202.2BrisbaneCohesiveDeep soil site of soft-to-stiff clay (high plasticity) underlain by medium strength phyllite
110.16Ce9221.3BrisbaneMixtureShallow layer with 2 m fill sand and clay and 7 m of firm-to-hard clay underlain by basalt
120.21Ce13.8257.7BrisbaneMixtureShallow soil site of a mixture of sand and stiff clay underlain by basalt
130.35Ce19.9228.2MelbourneMixtureMedium-depth soil site with 10 m of stiff cohesive soil and 12 m of mixture of silt and extremely weathered basalt underlain by siltstone
140.40Ce30.6305.1MelbourneMixtureDeep soil site with 16 m of cohesive soil, 14 m of dense sand underlain by sandstone and 2 m of extremely weathered basalt found at 8 m depth
150.46Ce23.4203.7SydneyMixtureMedium-depth soil site of silt and sand underlain by sandstone
160.51Ce29.3230.1New CastleMixtureMedium-depth soil site with 11 m dense sand and 12 m of very stiff clay underlain by sandstone
170.64De32.5203.6BrisbaneMixtureDeep soil site with 18 m of soft-to-stiff clay and 14 m of dense sand underlain by low-to-medium strength phyllite
180.73De27.6150.7MelbourneMixtureVery deep soil site with 30 m of cohesive soil and 25 m of dense sand underlain by sandstone
190.80De61.2305.1New CastleMixtureMedium-depth soil site with 3 m fill of gravel, 3 m of organic matters, 9 m of loose sand and 12 m of stiff clay underlain by tuff
200.97Ee60247.5MelbourneMixtureVery deep soil site of mixture of sand and hard clay underlain by hard basalt
Disclaimer/Publisher’s Note: The statements, opinions and data contained in all publications are solely those of the individual author(s) and contributor(s) and not of MDPI and/or the editor(s). MDPI and/or the editor(s) disclaim responsibility for any injury to people or property resulting from any ideas, methods, instructions or products referred to in the content.