Article

Monitoring of Cardiac Output Using a New Smartphone Application (Capstesia) vs. Vigileo FloTrac System

1
Intensive Care Unit and Pain Therapy, Department of Anesthesia, IRCCS Humanitas Research Hospital, Via Manzoni 56, Rozzano, 20089 Milan, Italy
2
Intensive Care Unit and Pain Therapy, AO Città della Salute e della Scienza, Department of Anesthesia, Le Molinette Hospital, Corso Bramante 88, 10126 Turin, Italy
3
Department of Anesthesia and Intensive Care, Azienda Ospedaliera Universitaria Ospedali Riuniti Umberto I°- Lancisi-Salesi, 60123 Ancona, Italy
4
Department of Vascular Surgery, AO Città della Salute e della Scienza, Le Molinette Hospital, Corso Bramante 88, 10126 Turin, Italy
*
Author to whom correspondence should be addressed.
A Cross-Sectional Study during Open Aortic Aneurysm Repair surgery.
Surgeries 2021, 2(4), 347-356; https://doi.org/10.3390/surgeries2040034
Submission received: 14 August 2021 / Revised: 12 September 2021 / Accepted: 24 September 2021 / Published: 28 September 2021

Abstract

:
(1) Background: We tested Capstesia against a reference system, Vigileo FloTrac, in patients undergoing major vascular surgery procedures. (2) Methods: Twenty-two adult patients (236 data pairs) were enrolled. Cardiac output (CO), stroke volume (SV), systemic vascular resistance (SVR), and related indexed parameters from the two monitoring systems were collected and compared at eleven time points during surgery. Intraclass correlation coefficients with 95% confidence intervals (CIs) and Bland–Altman plots with percentages of error were used. (3) Results: The interclass correlation coefficients for CO, SV, and SVR were 0.527 (95%CI 0.387 to 0.634), 0.580 (95%CI 0.454 to 0.676), and 0.609 (95%CI 0.495 to 0.698), respectively. In the Bland–Altman analysis, bias (and limits of agreement) of CO was 0.33 L min−1 (−2.44; 3.10), resulting in a percentage error of 61.91% for CO. For SV, it was 5.02 mL (−36.42; 46.45), with 57.19% of error. Finally, the bias (and limit of agreement) of SVR was −75.99 dyne sec cm−5 (−870.04; 718.06), resulting in an error of 69.94%. (4) Conclusions: Although promising, cost-effective, and easy to use, the moderate level of agreement with Vigileo and the high level of error make Capstesia unsuitable for use in the intraoperative setting of vascular surgery. Critical errors in acquisition or digitalization of the snap might have a strong impact on the accuracy and performance. Further standardization of the acquisition technique and improvements in the processing algorithm are needed.

1. Introduction

Nowadays, minimally invasive hemodynamic monitoring is gaining popularity among physicians. It finds its justification in the several potential advantages of this kind of technology over the invasive devices in a broad range of clinical conditions. Indeed, the use of invasive monitoring is limited to major surgery, due to the invasiveness itself of the monitoring devices, costs, and resource availability. On the other hand, non-invasive or minimally invasive systems can have a theoretically wider availability, even in resource-limited hospitals or in minor surgery and emergency settings [1]. Hence, prompt availability, ease and readiness of use, no required calibration, reproducibility, and—last but not least—economic factors make these devices appealing and their current use more and more widespread.
A few hemodynamic monitoring systems are currently available. Among them, the Vigileo FloTrac technology (Edwards Lifesciences LLC, Irvine, CA, USA) is a worldwide validated and well-established monitoring tool [2,3,4]. It provides hemodynamic parameters and indexes, such as cardiac output and stroke volume variation, exploiting the pulse contour analysis of arterial waveforms [5,6], and does not require calibration but only patient demographic and physical characteristics for the estimation of the arterial compliance. Apart from an invasive arterial line, both a dedicated monitor and device are also needed.
Among a range of new mini-invasive tools for hemodynamic status assessment, we investigated a novel smartphone app, Capstesia (Galenic App, Vitoria-Gasteiz, Spain). Using the same pulse contour principle, this app provides hemodynamic parameters—namely cardiac output (CO), pulse pressure variation (PPV), maximum slope of the pression curve (max dP/dt)—after scanning the arterial pressure waveform of a digitalized acquisition of the patient’s monitored vital signs and communicating with an online server [1,7,8]. The costs and practicability of such technology are appealing; however, its effectiveness has yet to be properly evaluated in clinical settings.
Our aim was to compare the level of concordance of the Capstesia application and Vigileo-FloTrac system in a clinical setting, i.e., during the open repair of an infrarenal abdominal aortic aneurism.
Our primary endpoint was the level of concordance of the cardiac output (and related indexed parameter, cardiac index) measured with the two devices.
Secondary endpoints were the level of concordance of stroke volume, systemic vascular resistance, and related indexed parameters (stroke volume index, systemic vascular resistance index).

2. Materials and Methods

2.1. Patients

This prospective monocentric study was held in Turin City Hospital, Le Molinette, Città della Salute e della Scienza. The study was carried out in accordance with the STROBE statement and approved by the Local Ethics Committee. Patients’ consent was acquired. All patients older than 18 years scheduled for elective open infrarenal aortic aneurism repair from July 2018 to July 2019 were included. Exclusion criteria were: atrial fibrillation, severe aortic valve disease, emergency surgery.

2.2. Perioperative Management and Monitoring

All patients were monitored with a non-invasive blood pressure cuff, a 5-lead elctrocardiogram, pulse oximetry, and bispectral index (BIS) depth of anesthesia monitor (BIS monitor, Aspect Medical System Inc, Natick, MA, USA). Patient hemodynamic variables were monitored using a Dräger Infinity® Delta XL monitor (Dräger Medical, Lübeck, Germany). An internal jugular triple lumen central venous catheter (Arrow International, Inc, Reading, PA, USA) was placed and central venous pressure was monitored as well. Patients were also equipped with a radial arterial line and FloTrac sensor connected to the VigileoTM (Edwards Lifescience, Irvine, CA, USA) monitor upgraded to the third-generation algorithm.
An epidural catheter was placed at T10-T11 before anesthetic induction. Lidocaine 60 mg as a test dose was used. Continuous infusion of ropivacaine 0.2% 2 to 4 ml h−1 was used during and after surgery according to clinical judgement (multimodal or “blended” anesthesia management) [9].
Anesthesia was induced with propofol 1.5 mg kg−1, sufentanil 0.2 mcg kg−1, cisatracurium 0.15 mg kg−1, and maintained with Sevoflurane 0.8 MAC, sufentanil 0.2 mcg kg−1 h−1, cisatracurium 0.2 mg kg−1 h−1 in order to keep BIS values within the required range (40–60).
Mechanical ventilation was provided in volume-controlled mode, with 6–8 ml kg−1 tidal volume, a positive end-expiratory pressure of 5 cmH2O, an I:E ratio of 1:1.5, and a FiO2 of 0.5. Respiratory rate was adjusted to achieve normocapnia (PaCO2 35–40 mmHg). Fluids were administered under the clinical judgment of the attending anesthesiologist in order to optimize preload dynamic indices provided by the Vigileo monitor.

2.3. Capstesia and Vigileo Recording

The Capstesia application was downloaded on a Xiaomi Mi A1 smartphone (Xiaomi Corporation, Beijing, China), which had a 12-megapixel photo camera. Sinus rhythm and absence of spontaneous breathing were checked before recoding measures. After taking a photo of the vital signs on the monitor screen and cropping it to the arterial waveform, the picture was sent to the Capstesia server via a mobile Internet connection. The heart rate and systolic and diastolic arterial pressure values were manually entered into the app to determine cardiac output. Instantaneously, pulse pressure variation, the maximum slope of the pressure curve, and cardiac output values were displayed on the smartphone interface [8] (Figure 1).
Intentionally, in order to make the recording phase as easy to perform as possible, no device was used to stabilize the image during the snap. Nevertheless, a few instructions were given to the recording investigator. The smartphone was hand-held, whilst photographs were taken, taking care to keep it parallel to the monitor screen, as suggested by the manufacturer, and to capture the entire screen. The screen photos were taken by the same trained investigator. Each image was checked to identify obvious processing errors. An average of 8 arterial peaks was included in each image, thus enabling the entire respiratory variation of the arterial curve to be analyzed. The sweep speed of the screen monitor was 25 mm s−1 (standard setting).
During surgery, data from the Vigileo system were recorded and finally downloaded into an Excel spreadsheet. Afterward, we closely examined each time frame to extract and compare simultaneous recordings of Vigileo and Capstesia parameters. In each patient, we documented hemodynamic parameters from the two monitoring systems at eleven fixed time intervals: immediately after anesthetic induction, 15–30 min after anesthetic induction, 5 min before aortic clamping, 5–10–15–20 min after aortic clamp release, 30 and 15 min before the end of the surgery, at the end of the surgery (skin closure).
Arterial systolic blood pressure (SBP), diastolic blood pressure, mean arterial pressure (MAP), heart rate (HR), and central venous pressure (CVP) were recorded from the screen monitor, whilst cardiac output (CO), stroke volume (SV), stroke volume variation (SVV), pulse pressure variation (PPV), maximum slope of the pressure curve (dP/dT max), systemic vascular resistance (SVR), and related indexed parameters (cardiac index (CI), stroke volume index (SVI), and systemic vascular resistance index (SVRI)) were computed by the FloTrac system or Capstesia app after appropriate data insertion. Although both systems required an arterial line, neither of them needed external calibration.
Vasoactive agents, epidural analgesic doses, and positive end-expiratory pressure were kept constant during monitoring phases.

2.4. Statistical Analysis

2.4.1. Sample Size Calculation

The expected CO value measured by means of the Vigileo FloTrac method was 5.18 L min−1, whilst it was 5.12 L min−1 using Capstesia [11]. An agreement threshold value of ±0.30 L min−1 was set for cardiac output. In order to ascertain a power of 90% and a confidence interval of 95%, we planned to acquire 241 paired readings, i.e., around twenty-two patients would have been enrolled.

2.4.2. Agreement between the Two Devices

Qualitative variables were expressed as percentages and 95% confidence intervals (95% CIs), and quantitative variables as means ± SD or medians and interquartile ranges (IQR) depending on whether the variables were normally distributed. Kolmogorov–Sminorv test was used to ascertain normal distribution.
To assess the level of agreement between the two methods, we used intraclass correlation coefficients (ICCs), considering values of 0.75 to indicate very good agreement [12], the Bland–Altman methodology [(bias-mean difference between both techniques (difference was computed as test—reference method), the limit of agreement 95% confidence interval (calculated as bias ± 1.96 × SD)], and percentage of error [calculated as 1.96 SD of bias/(mean1 + mean2/2) × 100)] between test and reference method, considering the two methods interchangeable when the percentage of error between them was less than or equal to 30% [13].
MedCalc Statistical Software version 17.6 (MedCalc Software bvba, Ostend, Belgium; http://www.medcalc.org, accessed on 6 September 2019) and GraphPad Prism version 6.00 for Mac (GraphPad Software, La Jolla, CA, USA, http://www.graphpad.com accessed on 2 September 2019) were used to perform the analyses and α was set at 0.05.

3. Results

The 22 patients included in the analysis had a mean age of 72 ± 6 years and several comorbidities, producing a VPOSSUM score of 17 ± 2. The demographic and surgical profile of the included patients is shown in Table 1. The radial artery was used in 100% of patients.
Abbreviations: BMI, body mass index; BSA, body surface area (DuBois and DuBois formula); ASA, American Society of Anesthesiologists; V-POSSUM, Vascular POSSUM scoring (Physiological and Operative Severity Score for the enUmeration of Mortality and Morbidity); DCM, dilated–hypokinetic cardiomyopathy; COPD, chronic obstructive pulmonary disease; TIA, transient ischemic attack.
Of the 242 images initially taken, in six, there were errors in the digitalization of the screenshots and these were excluded, leaving a total 236 images in the final analysis. Data were not normally distributed for any of the variables analyzed. The medians and interquartile ranges of each variable can be seen in Table 2.
For the analyzed parameters, the ICCs ranged from 0.434 to 0.663 (Table 3), indicating an intermediate level of agreement. Indeed, the interclass correlation coefficients for CO, SV, and SVR were 0.527 (95%CI, 0.387–0.634), 0.580 (95%CI, 0.454 to 0.676), and 0.609 (95%CI, 0.495 to 0.698), respectively.
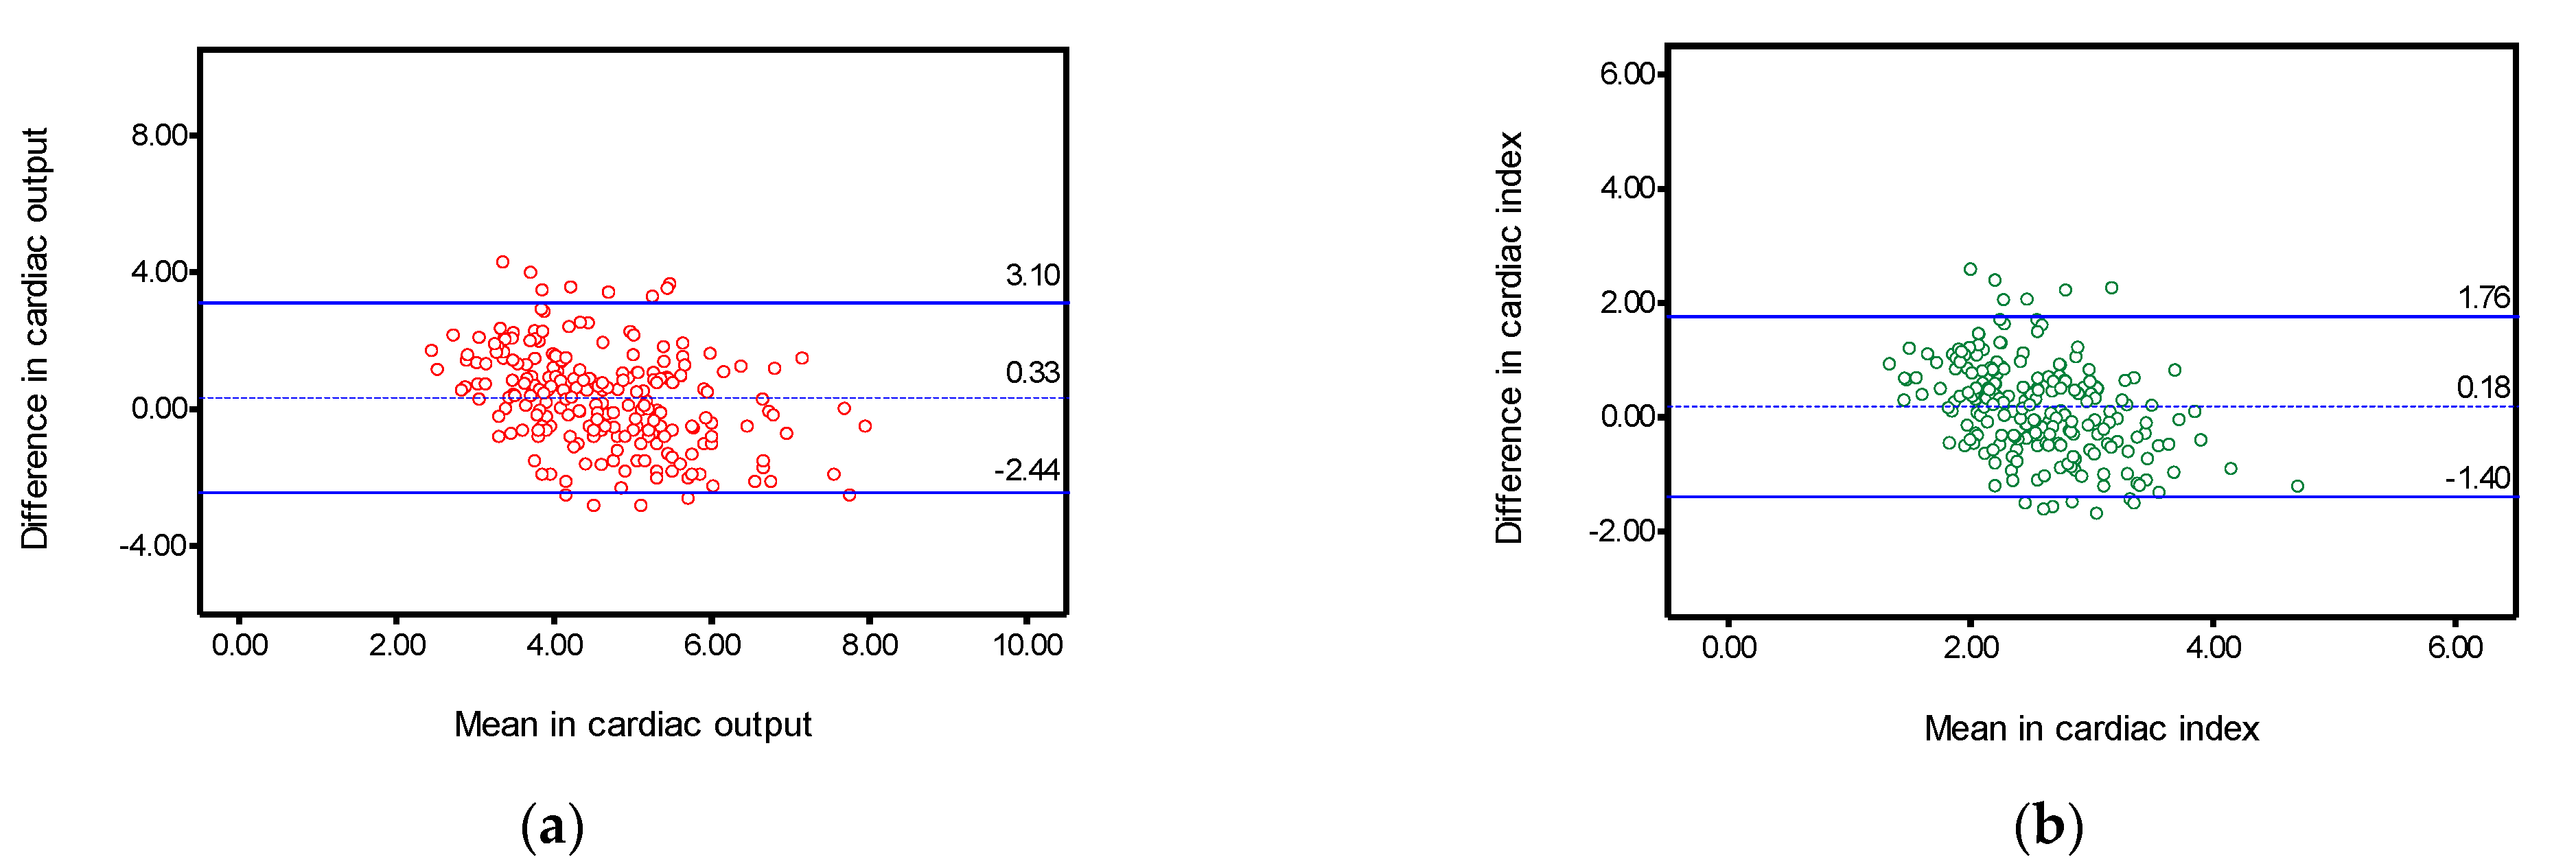
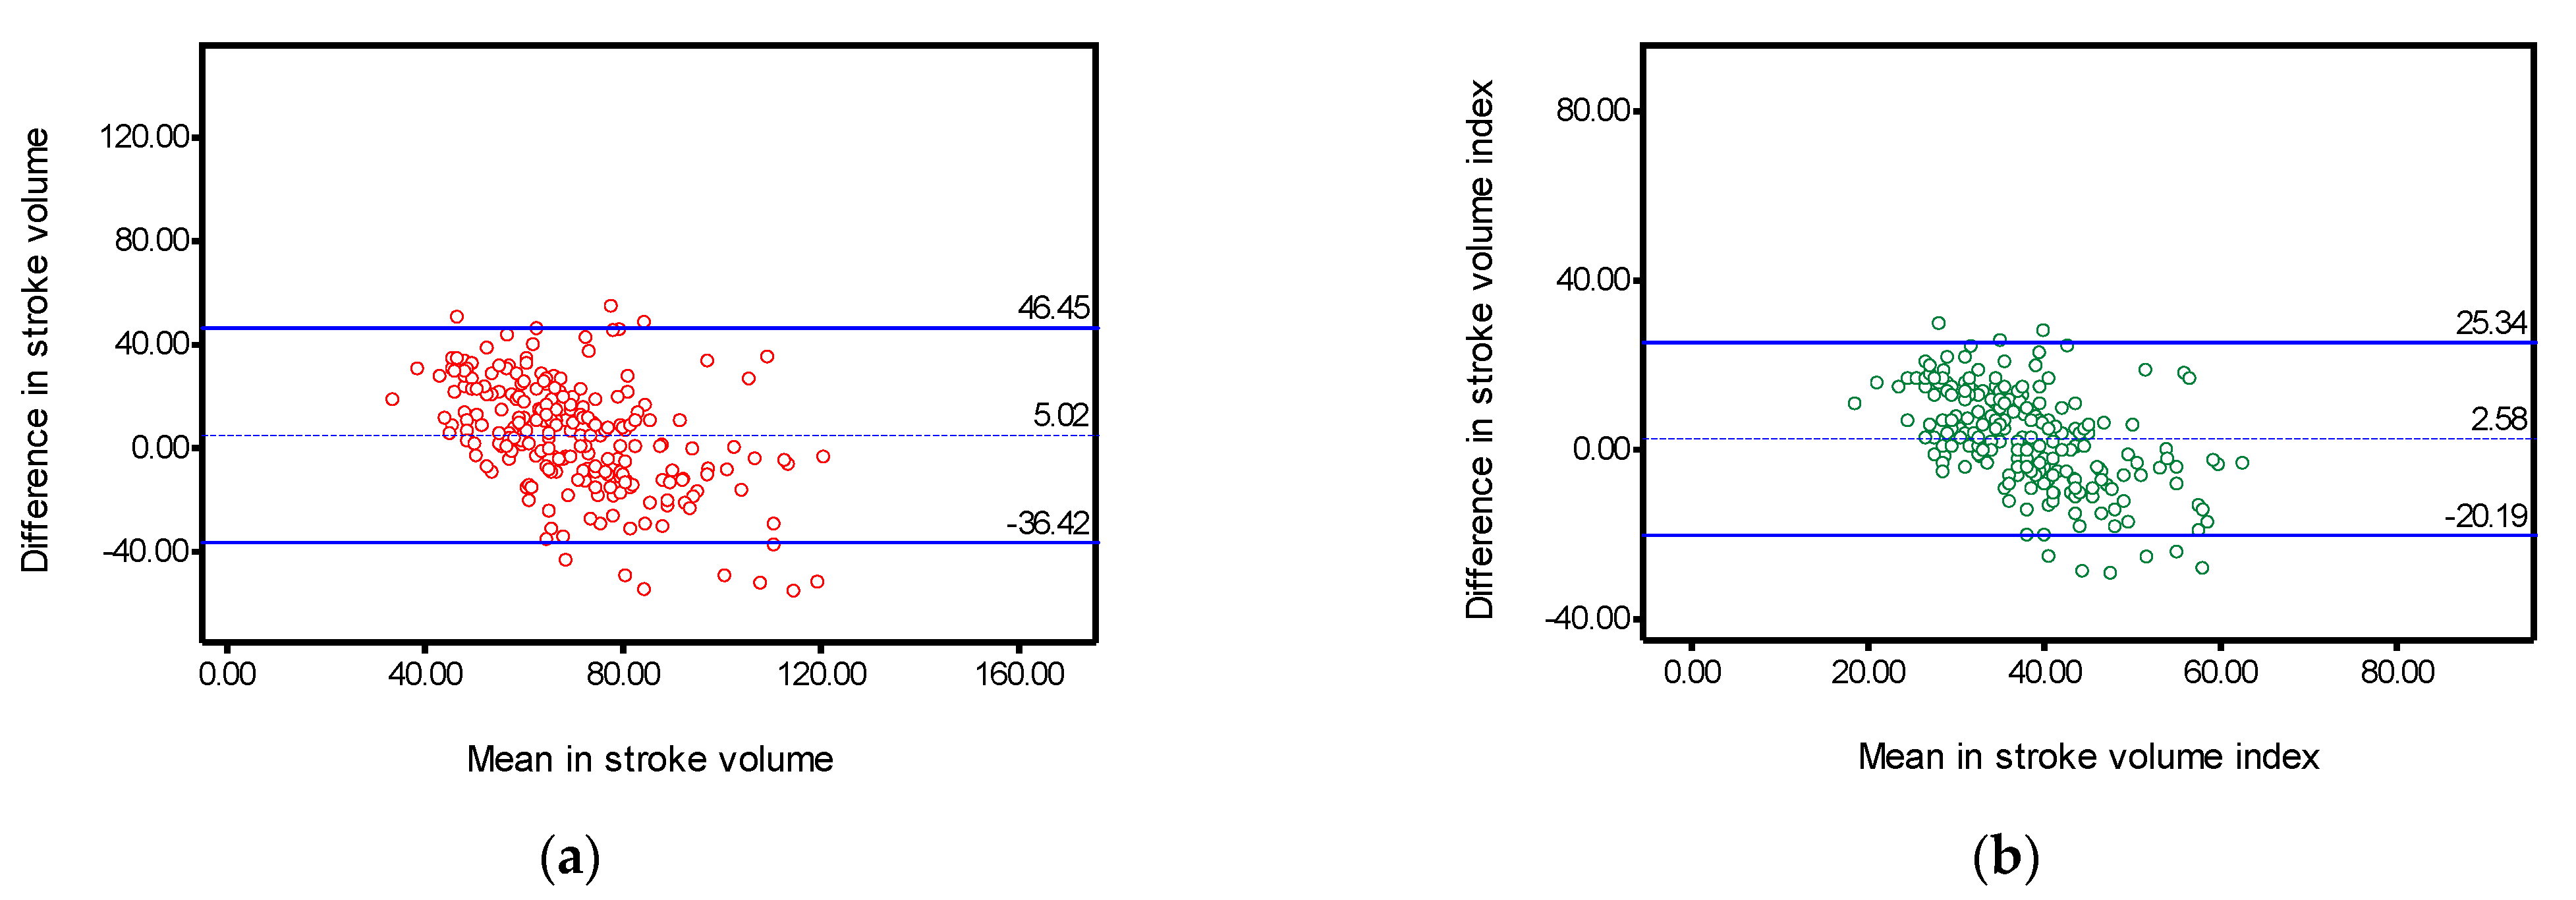
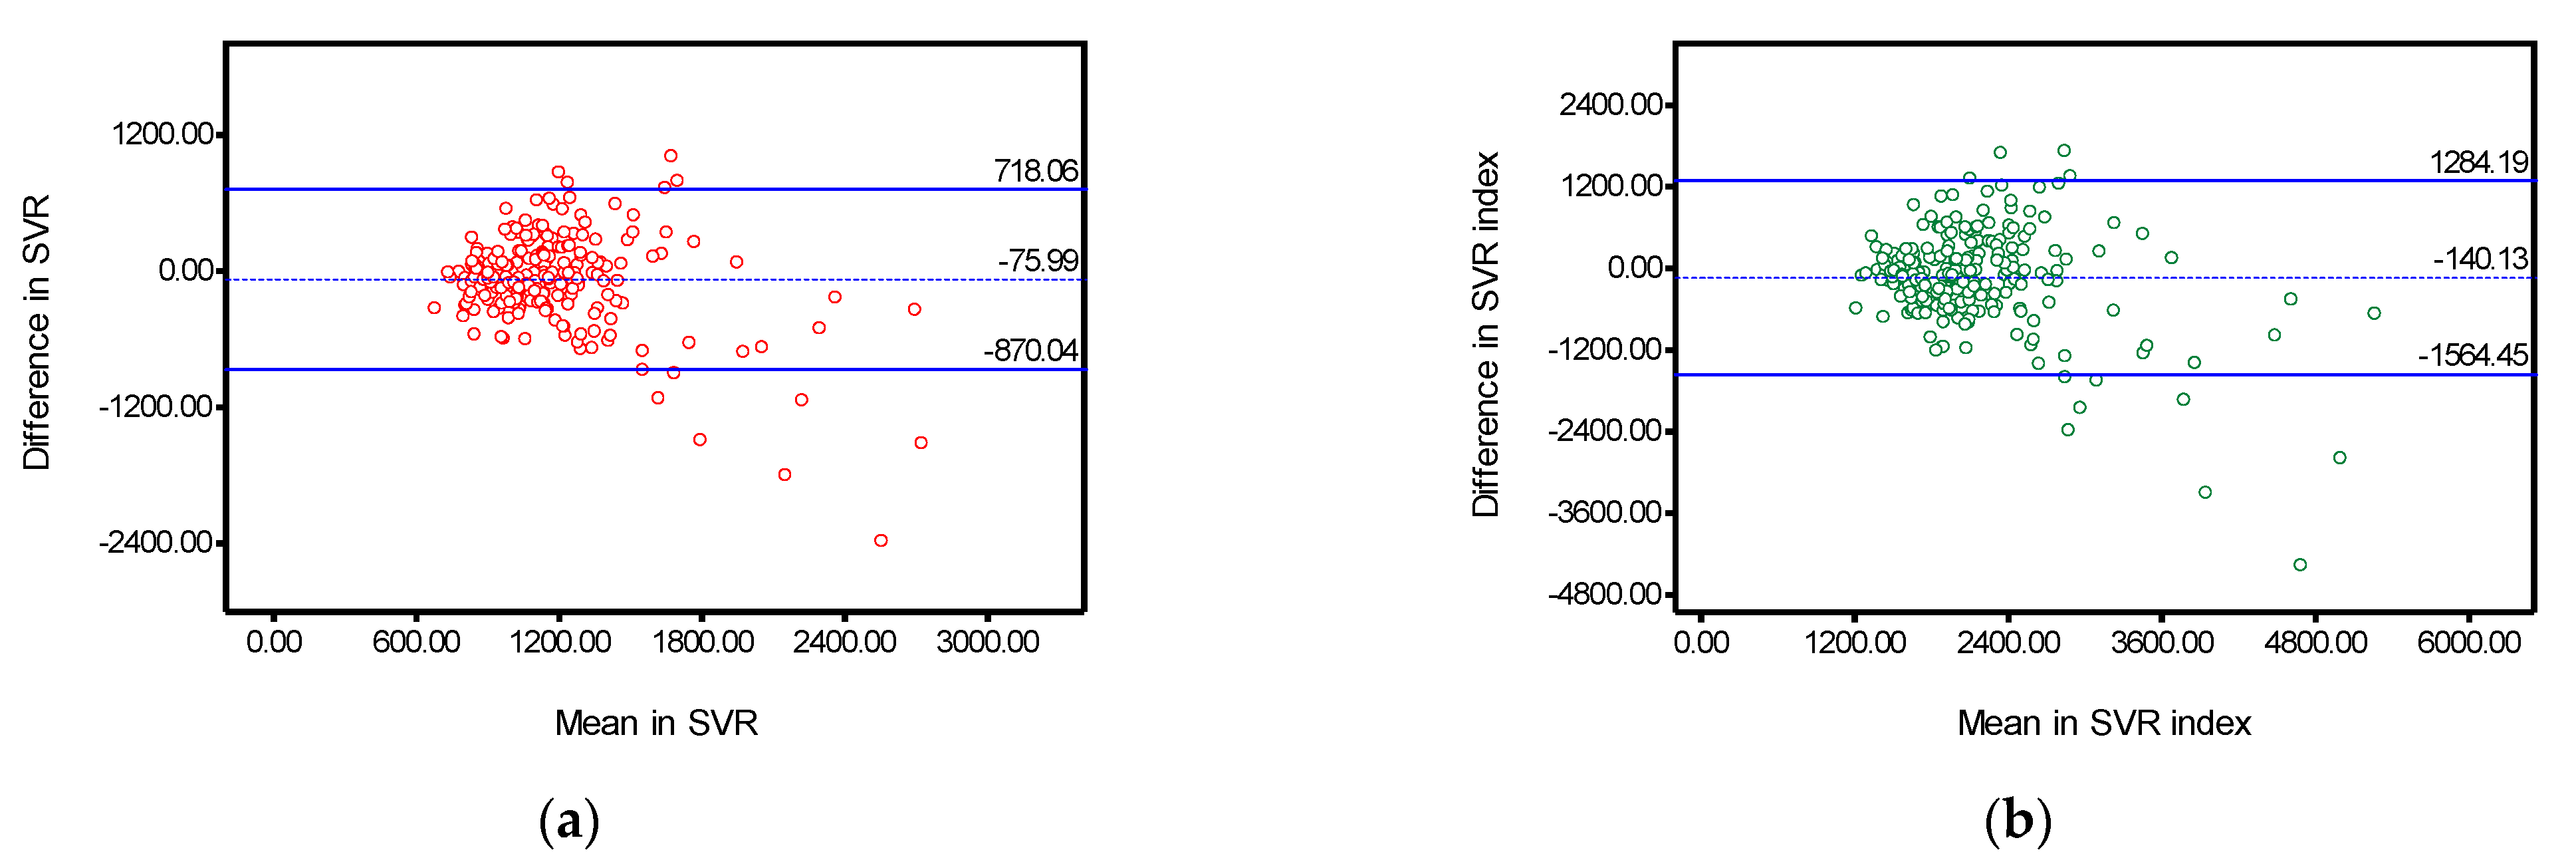
Based on the Bland–Altman plot (Figure 2, Figure 3 and Figure 4), the mean differences between results obtained with the two methods were smaller for cardiac output, 0.33 L min−1 (−2.44; 3.10), resulting in a percentage error of 61.91%. SV bias was 5.02 mL (−36.42; 46.45), with a 57.19% of error. Finally, bias (and limits of agreement) of SVR was −75.99 dyne sec cm−5 (−870.04; 718.06), resulting in an error of 69.94%.

4. Discussion

Capstesia is a novel smartphone app that relies on pulse contour analysis. It captures a photograph of the arterial waveform from a screenshot of the patient monitor, and subsequently provides hemodynamic data such as cardiac output by means of image comparison with an online server database [14]. Our aim was to assess the agreement between the app-performed analysis and the analysis performed by the Vigileo technology (Edwards Lifescience LLC, Irvine, CA, USA).
The pulse contour analysis performed by Capstesia has previously been validated under simulated environmental conditions, with encouraging results. A previous study proved the accuracy of Capstesia software against manual determination of PPV, showing 10% reproducibility, a low measurement error of <13%, and a low bias of 1.1 [8]. Similarly, the efficacy of the analysis algorithm of the app was confirmed by the good concordance shown between PPV, CO, and max dP/dt obtained from the patient monitor and a photograph of the same image using Capstesia (ICC 0.991, 0.966, and 0.962, respectively, with acceptably low error percentages of 20%, 13.8%, and 14.20%, respectively) [14].
Eventually, the clinical accuracy of Capstesia was evaluated in a few clinical studies, with conflicting results. In onco-surgical patients, Shah et al. [11] found a good correlation between Capstesia and Vigileo cardiac index (ICC 0.757) and a positive correlation between SVV and PVV (r = 0.732), although the agreement among cardiac output values was moderate (ICC 0.570), similarly to our population. Even better concordance (CCC 0.966) was found by Lopez et al. [15] in cardiac surgery patients, although they did not provide error percentages. On the other hand, poor concordance and high percentage error (60%) were found in Capstesia cardiac output when tested against the transpulmonary bolus thermodilution method by Joosten et al. [16]
As far as we know, our study is the first to test the clinical use of Capstesia in vascular surgery. Even if the two compared systems are based on the same principle of pulse contour analysis, the hemodynamic parameters provided proved to be substantially different. The level of concordance of cardiac output was suboptimal, although still in the intermediate range of correlation (ICC: 0.500–0.750) [12]. In addition to this, the error rate exceeded the required 30% limit [17], even if the bias was small (0.33%). Similar considerations could be made for stroke volume and systemic vascular resistances.
As opposed to previous studies comparing Capstesia and Vigileo, in our experience, the dissimilar accuracy and precision make the two methods not interchangeable, at least in the surgical setting that we have considered. Hence, we do not recommend using the Capstesia app in the clinical setting so far. Indeed, as Joosten et al. [10] pointed out when comparing PPV and SVV from two different methods, guiding fluid administration and clinical decision-making based on these preliminary findings may be rather premature or even shortsighted.

4.1. Limitations

Nevertheless, a few reasons that Capstesia’s device failed in providing reliable hemodynamic measures may be speculated. First, the recording conditions were affected by changes in physiologic variables, such as sympathetic vascular tone and arterial compliance, which could have influenced the accuracy of measures in dissimilar ways. Arterial stiffness, for example, changed during the surgical procedure according to volemic status, blood losses, temperature, use of vasoactive drugs, etc. [18]. Although these effects would have affected both Capstesia and Vigileo, it is worth noting that, to the best of our knowledge, Vigileo does have a correcting algorithm to compensate for these issues [19,20], something that Capstesia is currently lacking.
Secondly, technical issues with the Capstesia software could have affected its findings. Indeed, in order to make the use of the application as easy as possible in the clinical setting, minimum and simple instructions were given to the recording physician when the pictures were shot. The distance between the screen monitor and the hand-held smartphone should have been 30 cm, as recommended by the manufacturer. Nevertheless, the absence of perfect parallelism between the monitor screen and smartphone could have led to distortion in perspective and parallax error. In addition, the appearance of light reflections on the screen could have also distorted the signal digitalization process, although this issue is easy to diagnose and address—if suspected—by direct observation of the scanned image. Hence, the difficult endorsement of the quality of snapshot of the arterial waveform has possibly been a relevant issue [1]. In the future, standardization of the acquisition technique and, above all, improvement in the application algorithm might reduce the inaccuracy.
Thirdly, our acquisition technique was different from previous studies. In fact, we decided not to change the sweep speed of the patient monitor from 25 mm s−1 (standard setting) to 12.5 mm s−1 before taking the photo [16] since we managed to include a fair number of respiratory variations of the arterial waveform on the screen in any case. Regarding the number of acquisitions that were proven to offer the best predictive value for PPV, Desebbe et al. [8] showed that the average of at least three measurements resulted in fairly small bias, good limits of agreement, and low measurement error (7%). Nevertheless, the same study showed that bias and measurement error were acceptably low even with a single snapshot (bias 1.2, LOA −2.6; +5.0, measurement error 13%). Therefore, we opted for the latter approach in order to maintain a streamlined and convenient acquisition technique. We are aware that this could have remarkably influenced our findings.

4.2. Caveats

Finally, some relevant considerations regarding the Capstesia monitoring system should be made. Since Capstesia provides clinicians with a static evaluation of a parameter, the timing of the acquisition snap plays a central role. Hemodynamic changes in high-complexity settings, such as major surgery, occur abruptly and quickly enough and cannot be easily captured by a snap. A careful recording strategy obviates this occurrence. Nevertheless, it is worth mentioning that we purposely chose this extremely mutable clinical setting to test the app and its limits.
It is worth noting that an Internet connection must always be available when using the app. As previously mentioned, this is essential to allow the software to compare the picture taken with the online database. As intuitable, Internet connection facilities may not be readily available in some geographical areas or may offer differences in performance inside the same building depending on the strength of the provider’s signal. A downloadable database would be useful for offline usage in these situations.

5. Conclusions

In conclusion, despite the promising features, the Capstesia application showed a moderate level of agreement with the Vigileo FloTrac system with reference to cardiac output and other hemodynamic variables. Nevertheless, an unacceptably high percentage error in all the analyzed parameters means that the two monitoring systems are not interchangeable in the considered setting.
Considering current conflicting evidence on the accuracy of the Capstesia algorithm, as long as implementations of the manufacturer algorithm occur [10], more studies are needed before promoting its widespread use as a reliable tool for decision-making in the clinical context. Hence, our results should be viewed as a clinical benchmark for the app, aimed at providing useful insights to improve its acquisition algorithm before Capstesia enters the market.

Author Contributions

Conceptualization, F.N. and C.M.; methodology, F.N. and P.D.G.; formal analysis, F.N.; investigation, F.N. and C.M.; resources, F.N. and P.D.G.; data curation, F.N.; writing—original draft preparation, F.N.; writing—review and editing, C.M., E.G. and R.B.; supervision, E.C., P.R. and R.B. All authors have read and agreed to the published version of the manuscript.

Funding

This research received no external funding.

Institutional Review Board Statement

The study was conducted according to the guidelines of the Declaration of Helsinki and approved by the Institutional Review Board (or Ethics Committee) of Turin University Hospitals (protocol code 234/18 and date of approval 17.01.2018).

Informed Consent Statement

Informed consent was obtained from all subjects involved in the study.

Conflicts of Interest

The authors declare no conflict of interest.

References

  1. Shah, S.B.; Hariharan, U.; Bhargava, A.K. Capstesia: The smart hemodynamic monitor!, Trends Anaesth. Crit. Care. 2016, 10, 15–19. [Google Scholar] [CrossRef]
  2. Vasdev, S.; Chauhan, S.; Choudhury, M.; Hote, M.P.; Malik, M.; Kiran, U. Arterial pressure waveform derived cardiac output FloTrac/Vigileo system (third generation software): Comparison of two monitoring sites with the thermodilution cardiac output. J. Clin. Monit. Comput. 2012, 26, 115–120. [Google Scholar] [CrossRef] [PubMed]
  3. De Backer, D.; Marx, G.; Tan, A.; Junker, C.; Van Nuffelen, M.; Hüter, L.; Ching, W.; Michard, F.; Vincent, J.-L. Arterial pressure-based cardiac output monitoring: A multicenter validation of the third-generation software in septic patients. Intensive Care Med. 2011, 37, 233–240. [Google Scholar] [CrossRef] [PubMed] [Green Version]
  4. Mayer, J.; Boldt, J.; Poland, R.; Peterson, A.; Manecke, G.R. Continuous Arterial pressure waveform–based cardiac output using the FloTrac/Vigileo: A review and meta-analysis. J. Cardiothorac. Vasc. Anesth. 2009, 23, 401–406. [Google Scholar] [CrossRef] [PubMed]
  5. Manecke, G.R. Edwards FloTracTM sensor and VigileoTM monitor: Easy, accurate, reliable cardiac output assessment using the arterial pulse wave. Expert Rev. Med. Devices 2005, 2, 523–527. [Google Scholar] [CrossRef] [PubMed]
  6. Headley, J.M. Arterial pressure-based technologies: A new trend in cardiac output monitoring. Crit. Care Nurs. Clin. North. Am. 2006, 18, 179–187. [Google Scholar] [CrossRef] [PubMed]
  7. Larraza, B.B.; Guerras, O.A. Capstesia, una nueva APP para la monitorización/Capstesia, a new APP for advanced hemodynamic monitoring. Rev. Española Anestesiol. Reanim. 2016, 61, 535–536. [Google Scholar] [CrossRef] [PubMed]
  8. Desebbe, O.; Joosten, A.; Suehiro, K.; Lahham, S.; Essiet, M.; Rinehart, J.; Cannesson, M. A novel mobile phone application for pulse pressure variation monitoring based on feature extraction technology: A method comparison study in a simulated environment. Anesth. Analg. 2016, 123, 105–113. [Google Scholar] [CrossRef] [PubMed] [Green Version]
  9. Guay, J.; Kopp, S. Epidural pain relief versus systemic opioid-based pain relief for abdominal aortic surgery. Cochrane Database Syst. Rev. 2016. [Google Scholar] [CrossRef] [PubMed]
  10. Joosten, A.; Jacobs, A.; Desebbe, O.; Vincent, J.L.; Sarah, S.; Rinehart, J.; Van Obbergh, L.; Hapfelmeier, A.; Saugel, B. Monitoring of pulse pressure variation using a new smartphone application (Capstesia) versus stroke volume variation using an uncalibrated pulse wave analysis monitor: A clinical decision-making study during major abdominal surgery. J. Clin. Monit. Comput. 2019, 33, 787–793. [Google Scholar] [CrossRef] [PubMed]
  11. Shah, S.B.; Bhargava, A.K.; Hariharan, U.; Vishvakarma, G.; Jain, C.R.; Kansal, A. Cardiac output monitoring: A comparative prospective observational study of the conventional cardiac output monitor vigileoTM and the new smartphone-based application capstesiaTM. Indian J. Anaesth. 2018, 62, 584–591. [Google Scholar] [CrossRef] [PubMed]
  12. Koo, T.K.; Li, M.Y. A guideline of selecting and reporting intraclass correlation coefficients for reliability research. J. Chiropr. Med. 2016, 15, 155–163. [Google Scholar] [CrossRef] [PubMed] [Green Version]
  13. Critchley, L.A.; Critchley, J.A. A meta-analysis of studies using bias and precision statistics to compare cardiac output measurement techniques. J. Clin. Monit. Comput. 1999, 15, 85–91. [Google Scholar] [CrossRef] [PubMed]
  14. Barrachina, B.; Cobos, R.; Mardones, N.; Castañeda, A.; Vinuesa, C. Assessment of a smartphone app (Capstesia) for measuring pulse pressure variation. Eur. J. Anaesthesiol. 2017, 34, 75–80. [Google Scholar] [CrossRef] [PubMed]
  15. Santiago-López, J.; León-Ramírez, V.; Hernández-Ramírez, S.; Vásquez-Márquez, P.I.; Castellanos-Olivares, A. Concordance in the measurement of cardiac output. Vigileo vs. Capstesia. Rev. Med. Inst. Mex. Seguro Soc. 2018, 56, 136–142. [Google Scholar] [PubMed]
  16. Joosten, A.; Boudart, C.; Vincent, J.L.; Vanden Eynden, F.; Barvais, L.; Van Obbergh, L.; Rinehart, J.; Desebbe, O. Ability of a new smartphone pulse pressure variation and cardiac output application to predict fluid responsiveness in patients undergoing cardiac surgery. Anesth. Analg. 2019, 128, 1145–1151. [Google Scholar] [CrossRef] [PubMed]
  17. Bland, J.M.; Altman, D.G. Statistical methods for assessing agreement between two methods of clinical measurement. Lancet 1986, 1, 307–310. [Google Scholar] [CrossRef]
  18. Camporota, L.; Beale, R. Pitfalls in haemodynamic monitoring based on the arterial pressure waveform. Crit. Care 2010, 14, 124. [Google Scholar] [CrossRef] [PubMed] [Green Version]
  19. Sistema FloTrac|Edwards Lifesciences. 2019. Available online: https://www.edwards.com/it/devices/Hemodynamic-Monitoring/FloTrac (accessed on 19 November 2019).
  20. Anaesthesia West; Western Anesthesia Society Ireland. Flotrac-Vigileo—Useful Tool or Toy? 2012, pp. 2–6. Available online: https://anaesthesiawest.com/2012/03/12/flotrac-vigileo-useful-tool-or-toy/ (accessed on 22 November 2019).
Figure 1. Steps to obtain hemodynamic parameters calculated by the Capstesia™ application. Reprinted with permission from [10].
Surgeries 02 00034 g001
Figure 2. Bland–Altman plots for cardiac output and cardiac index. Bland–Altman analysis is a statistical method that allows the clinician to compare two different measurement techniques [13]. The Bland–Altman graph plots the difference between two techniques [test–reference method] against their averages [(test + reference method)/2]. The resulting scatter diagram allows the clinician to determine: bias (middle line): average difference, ideal bias = 0; precision or limits of agreement (superior and inferior lines): 1.96*Standard Deviation, which describes the range for 95% of comparison points. (a) Bland–Altman plot for cardiac output. The upper line above the X-axis depicts the upper limit of agreement (3.10 L/min). The line below shows the bias (0.33 L/min); the lower line depicts the lower limit of agreement (−2.44 L/min); (b) Bland–Altman plot for cardiac index. The upper line above the X-axis depicts the upper limit of agreement (1.76 L/min/m2). The line below shows the bias (0.18 L/min/m2); the lower line depicts the lower limit of agreement (−1.40 L/min/m2).
Surgeries 02 00034 g002
Figure 3. Bland–Altman plots for stroke volume and stroke volume index. (a) Bland–Altman plot for stroke volume: The upper line above the X-axis depicts the upper limit of agreement (46.45 mL). The line below shows the bias (5.02 mL); the lower line depicts the lower limit of agreement (−36.42 mL); (b) Bland–Altman plot for stroke volume index: The upper line above the X-axis depicts the upper limit of agreement (25.34 mL/m2). The line below shows the bias (2.58 mL/m2); the lower line depicts the lower limit of agreement (−20.19 mL/m2).
Surgeries 02 00034 g003
Figure 4. Bland–Altman plots for systemic vascular resistance (SVR) and SVR index. (a) Bland–Altman Plot for systemic vascular resistance: The upper line above the X-axis depicts the upper limit of agreement (718.06 dyne*sec/cm5). The line below shows the bias (−75.99 dyne*sec/cm5); the lower line depicts the lower limit of agreement (−870.04 dyne*sec/cm5); (b) Bland–Altman Plot for systemic vascular resistance index: The upper line above the X-axis depicts the upper limit of agreement (1284.19 dyne*sec*m2/cm5). The line below shows the bias (140.13 dyne*sec*m2/cm5); the lower line depicts the lower limit of agreement (−1564.45 dyne*sec*m2/cm5). Abbreviations: SVR, systemic vascular resistance.
Surgeries 02 00034 g004
Table 1. Baseline patient characteristics.
VariablesPatients (n = 22)
Age (years)72 ± 6
Sex: male21 (95%)
Weight (kg)77 ± 11
BMI (kg/m2)26 ± 3
BSA (m2)1.88 ± 0.15
ASA grade
I3 (14%)
II4 (18%)
III8 (36%)
IV7 (32%)
V-POSSUM17 ± 2
Comorbidities:
Coronary artery disease9 (41%)
DCM5 (23%)
Hypertension18 (82%)
Diabetes mellitus4 (18%)
Chronic Kidney Disease1 (5%)
COPD3 (14%)
Stroke or TIA2 (9%)
Results are expressed as mean ± SD or number (percentage).
Table 2. Hemodynamic data.
Hemodynamic DataCapstesia (n = 236)Vigileo (n = 236)
MedianInterquartile RangeMedianInterquartile Range
Cardiac output4.48(3.40–5.40)4.70(4.10–5.50)
Cardiac Index2.44(1.81–2.96)2.60(2.30–3.00)
PPV10.50(5.48–23.63)--
SVV--9.00(7.00–12.00)
Stroke volume65.00(51.00–82.00)71.50(63.00–80.00)
Stroke volume index35.50(28.00–44.00)39.00(34.75–43.00)
Systemic vascular resistance1111.00(939.75–1307.00)1088.50(915.25–1288.50)
Systemic vascular resistance index2042.50(1753.00–2419.75)1983.50(1613.00–2387.00)
Units: Cardiac Output (L min−1), Cardiac Index (L min−1 m2); Pulse Pressure Variation (%); Stroke Volume Variation (%); Stroke Volume (mL); Stroke Volume Index (mL m−2); Systemic Vascular Resistance (dyne sec cm−5); Systemic Vascular Resistance Index (dyne sec cm−5 m−2). Abbreviations: PPV, Pulse Pressure Variation (Capstesia only); SVV, Stroke Volume Variation (Vigileo only).
Table 3. Concordance between methods (Capstesia vs. Vigileo).
ICC(95% CI)Mean of the Differences (%)SD of the Differences (%)Limits of Agreement (%)Error Percentage (1.96 * SD/Mean) (%)
Cardiac output0.527(0.387–0.634)0.331.41−2.443.1061.91
Cardiac Index0.434(0.270–0.561)0.180.81−1.401.7659.82
Stroke volume0.580(0.454–0.676)5.0221.14−36.4246.4557.19
Stroke volume index0.478(0.326–0.595)2.5811.61−20.1925.3457.68
Systemic vascular resistance0.609(0.495–0.698)−75.99405.13−870.04718.0669.94
Systemic vascular resistance index0.663(0.563–0.740)−140.13726.70−1564.451284.1968.55
* means times.
Publisher’s Note: MDPI stays neutral with regard to jurisdictional claims in published maps and institutional affiliations.