Abstract
In this paper, we illustrate the synthesis, characterization, and application of a Bovine Serum Albumin-stabilized copper nanocluster (BSA@CuNCs)-based photoluminescence (PL) bifunctional sensor for the selective and rapid sensing of picric acid (PA) and hydrogen peroxide (H2O2). Blue-emitting copper nanoclusters were synthesized using one-pot synthesis at room temperature. The PL intensity of BSA@CuNCs was shown to be quenched (“Turn-off”) with an increase in the concentration of PA and intensified (“Turn-on”) with the addition of H2O2. The quenching of PL intensity of BSA@CuNCs was shown to be extremely selective and rapid towards PA. A linear decrease in the PL emission intensity of BSA@CuNCs was observed with a PA concentration in the range of 0–15 μM. An extremely low detection limit of 60 nM (3σ/k) was calculated. The as-prepared BSA@CuNCs also exhibited superior selectivity for PA detection in aqueous medium. The developed sensor was also utilized for the sensing of PA in natural water samples. The probe was found to be extremely sensitive towards the detection of H2O2. An increase in the PL intensity of BSA@CuNCs was seen with the addition of H2O2, with a detection limit of 0.11 μM.
1. Introduction
Metal nanoclusters, which consist of a few to hundreds of atoms, have garnered significant attention in various fields of interest in academia as well as industry. This is due to their remarkable PL intensity, biocompatibility, large quantum yield, large Stokes shift, and excellent solubility in water. They have been used in chemical sensing, heterogeneous catalysis, and cell imaging applications [1,2,3,4]. For a number of different analytical applications, researchers have concentrated on developing Gold (Au) and Silver (Ag) nanoclusters as luminous probes during the past decades [5,6,7,8]. Copper nanoclusters (CuNCs) have garnered great interest because they are relatively inexpensive, are earth abundant, have excellent optophysical properties, and are readily available for commercial applications. However, their application is hampered due to the difficulty in obtaining smaller particles because of surface oxidation [9,10,11,12,13,14,15]. As a result, researchers are eager to find ways to synthesise highly stable, surface-oxidation-free CuNCs that are soluble in water. [10,16,17,18] The luminescence of the NCs is influenced by several factors, such as the size and type of the NCs, the surface chemistry, and even the solvent. Hence, the fluorescence signals can be amplified effectively using metal enhanced fluorescence (MEF), which has been extensively researched. MEF occurs when a fluorophore is situated in an amplified electromagnetic field produced by far-field excitation of plasmonic metal nanoparticles and surfaces. In addition to the signal amplification, other significant spectral alterations, such as shortened lifetime, improved photo-stability, and longer distances for resonance energy transfer (RET) of fluorescence, have been documented in MEF [19]. It has also been observed that shape and surface morphology of plasmonic NPs influences optical properties. Recently, nanoparticles, either by ordered or self-assembled distribution, were shown to have near-field enhancement properties suitable for various applications, such as SERS, sensors, non-linear optics, and artificial magnetism [20].
PA is a widely applied nitro aromatic explosive organic compound. As per the reports in the literature, it is more volatile than 2,4,6-trinitrotoluene (TNT) [21,22,23,24,25,26]. The extremely high water solubility (~14 g/L at 20 °C) of PA in water leads to its extensive use in industry. It also pollutes ground water and soil [27,28,29]. It has applications in pharmaceutical industries, dye industries, and as an antiseptic in treatment [30,31]. However, higher doses cause serious health-related issues and can damage the respiratory system and skin as well as causing diseases such as cancer and anaemia. The allowable daily intake (ADI) of PA has been suggested to be 1–37 µg (kg day)−1, and the acceptable level for drinking water is 0.5 mg L−1 [32]. The extremely serious risks presented by PA to human health, the environment, and homeland security demand the utilisation of an extremely efficient, rapid, selective, and sensitive detection method. In the past, detection methods such as ion chromatography-mass spectrometry [33,34], infrared and Raman spectroscopy [35,36], X-ray techniques [37], and others [38,39,40] have been applied to meet the requirements for detecting PA. However, these methods have serious limitations. Therefore, it is necessary to design a sensitive, selective, and user-friendly rapid detection method for PA.
Hydrogen peroxide (H2O2), is used as an important oxidizing and bleaching agent in chemical and biochemical industries [41,42,43]. It is also known to be one of the most used oxidizing agents and is used in many industrial applications. The high concentration of H2O2 has dangerous effects on skin, eyes, overall human health, and aquatic systems [44]. H2O2 is also known to be an important molecule, playing a crucial role in several biological processes. It is thus of great relevance that efficient methods are emerging for the quantitative detection of H2O2 in clinical, dietary, and other samples of interest [45,46]. Various experimental methods, such as spectrophotometry, chemiluminescence, etc., for the determination of H2O2 have already been reported [47,48].
BSA is a ubiquitously used protein for the fabrication of various nanocrystals [49,50,51]. In this work, we employed an efficient protocol for the design and development of BSA@CuNCs, which shows blue luminescence. The present method does not require the use of strong/toxic reagents, which are injurious to human health and the environment. The synthesis was performed at room temperature, which makes it a green synthesis method. The as-prepared BSA@CuNCs were experimentally investigated for their “Turn Off/Turn On” PL response towards PA/H2O2.
2. Experiment
2.1. Materials
Cu(NO3)2·2H2O and all nitroaromatic compounds, such as 2,4,6-trinitrophenol (PA), 1,2-dinitro benzene (1,2-DNB), 1,3-dinitro benzene (1,3-DNB), 1,4-dinitro benzene (1,4-DNB), 2-nitrotoluene (2-NT), 4-nitrotoluene (4-NT), 1,2-dinitrobenzene (1,2-DNB), 2,4-dinitrotoluene (2,4-DNT), 2,6-dinitrotoluene (2,6-DNT), 30% hydrogen peroxide (H2O2), sodium hydroxide, BSA, etc., were obtained from Fisher Scientific, Maharashtra, India. Millipore water (resistivity of 18.2 MΩ cm) was used to prepare all the solutions in the present study.
2.2. Synthesis
BSA-stabilized copper nanoclusters were synthesized at ambient temperature using a greener approach. In a typical synthesis, we mixed 2 mL of 0.1 M freshly prepared Cu(NO3)2 (aqueous) solution with 2 mL of 0.1 M aqueous solution of L-ascorbic acid. The reaction mixture was stirred continuously. Into the reaction mixture, 3 mL of BSA (15 mg/mL) was introduced, and the final volume of the reaction mixture was maintained at 15 mL by the addition of Millipore water. The reaction was constantly stirred at ambient temperature for 24 h in darkness to obtain the final BSA-capped CuNCs. In this synthesis, ascorbic acid acts as a reducing agent, which reduces Cu2+ ions to CuNCs, and BSA is used as a capping agent to stabilize CuNCs. After the completion of reaction, the obtained solution was centrifuged to remove insoluble particles. The solution was then dialyzed to remove unbound BSA, ascorbic acid, and other impurities. Finally, the BSA-capped CuNCs solution was stored at 4 °C when not in use.
2.3. PA Detection
Eight nitroaromtic compounds were chosen to perform PL experiments. In a typical experiment, 5 µM solution of nitroaromtic compound was successively added to 50 µL of BSA@CuNCs solution. The PL experiment was performed. The same process was repeated for all the compounds. The samples were prepared at room temperature.
2.4. H2O2 Detection
In a typical experiment, 3 µM of H2O2 was gently added to 50 uL BSA@CuNCs solution to carry out the PL experiments. The measurements were taken at ambient temperature.
3. Results and Discussion
Scheme 1 displays the synthesis scheme for BSA@CuNCs. We utilized transmission electron microscopy using a JEM-2100 electron microscope system, operated at 200 kV, to investigate the obtained shape and size of as-synthesized BSA@CuNCs. As shown in the TEM image in Figure 1a, the average size of BSA@CuNCs was found to be 4 ± 1 nm of the NCs, which agrees with the results reported in the literature. Further, dynamic light scattering (DLS) measurement using a Malvern Zetasizer Nano S was also performed (Figure 1b), from which the hydrodynamic diameter was determined to be 5 nm.
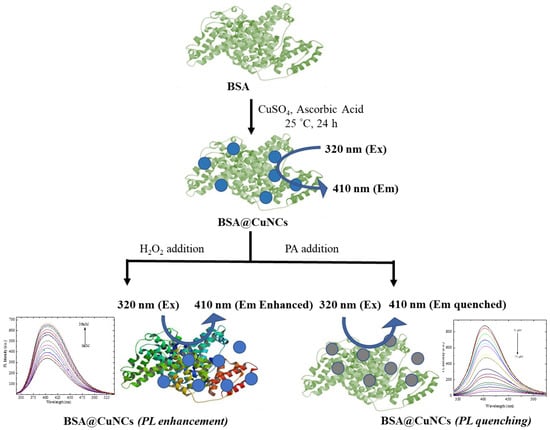
Scheme 1.
Schematic diagram for the fabrication procedure of BSA@CuNCs and its applicability for the sensing of PA/H2O2.
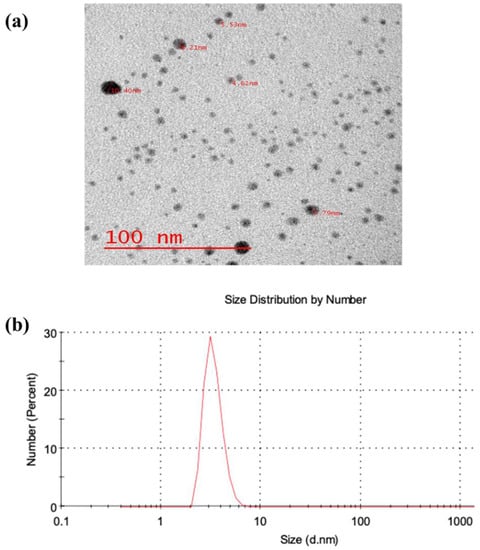
Figure 1.
(a) TEM image and (b) dynamic light scattering measurement of as-obtained BSA@CuNCs.
The UV-vis spectroscopy measurements were also performed on both BSA and BSA@CuNCs using a UV-170 Shimadzu spectrophotometer. Figure 2a,b show the recorded UV-Vis spectra for BSA and BSA@CuNCs, respectively. The BSA is characterized by the presence of an absorption peak at 280 nm, as shown in Figure 2a [52]. The UV-vis spectra of copper nanoparticles is reported to have a peak at 560 nm. As there is no peak in the UV-Vis spectra of BSA@CuNCs around 560 nm, this confirms the formation of smaller nanoclusters and not nanoparticles.
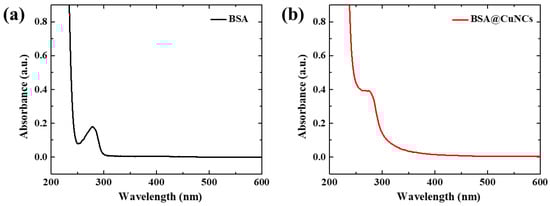
Figure 2.
UV-vis absorption spectrum of (a) BSA and (b) BSA@CuNCs.
3.1. Photoluminescence Study
In this study, we employed photoluminescence spectroscopy using an Agilent Cary spectrophotometer to evaluate the potential applicability of the as-synthesized BSA@CuNCs for selective sensing of PA. With the variation in the excitation wavelength from 300 to 350 nm, the emission peak was observed to be shifted from 400 to 430 nm. A single peak centred around 405 nm was experimentally observed in the fluorescence spectrum of BSA@CuNCs with the 320 nm excitation wavelength. As demonstrated in Figure 3a, the maximum intensity was recorded when the excitation wavelength was 320 nm and the emission peak was centred at 405 nm. We also performed the PL measurements of the synthesized sample at different times. As shown in Figure 3b, the PL intensity was noticed to be same for 48 h with 320 nm excitation wavelength. In fact, the sample seemed extremely stable. No relevant change in the PL was noticed even after a few days. We also investigated the pH dependence of the sample, and the PL intensity was found to be linearly increasing with respect to the increase in the pH of the buffer.

Figure 3.
Fluorescence emission spectra of BSA@CuNCs (a) recorded with excitation wavelengths in the range of 300 to 350 nm and (b) at different time intervals with 320 nm excitation wavelength.
The excellent water solubility of as-synthesized BSA@CuNCs makes them applicable for sensing of nitroaromatic explosives. Thus, fluorescence quenching titration experiments were carried out by adding the aqueous solutions of other nitro explosives, such as PA, 2,6-DNT; 2,4-DNT; 1,4-DNB; 1,3-DNB; 1,2-DNB; 4-NT, 2-NT, NB, etc., to the aqueous solution of BSA@CuNCs.
The fluorescence intensity of our analytical system was shown to be decreasing with increasing PA solution content, as shown in Figure 4a. For the 75 μM concentration of PA solution, the fluorescence intensity of BSA@CuNCs was decreased up to 90%. This clearly indicates the extreme sensitivity of the as-developed probe towards the sensing of PA. When a similar amount of other nitro explosives were added to the BSA@CuNCs solution, almost no or very little change in the PL intensity was observed, as shown in Figure 4b.
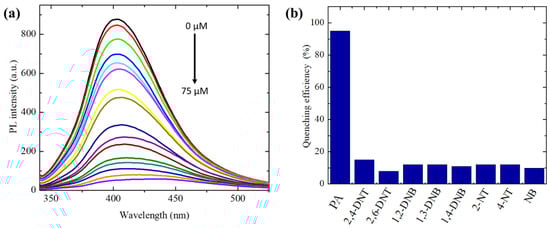
Figure 4.
(a) Fluorescence quenching measurements of BSA@CuNCs with PA concentrations in the range of 0–75 μM. (b) The response of quenching of BSA@CuNCs in the presence of other nitroaromatic compounds.
We also performed fluorescence titration experiments to determine the sensitivity of the BSA@CuNCs probe for the sensing of PA. The emission intensity of the BSA@CuNCs at 405 nm was recorded for the identification of the sensitivity of the developed system towards the sensing of PA. With the increase in the PA concentration in the range of 0–75 μM, the emission intensity of the BSA@CuNCs was observed to be decreasing (Figure 5a). The change in the emission intensity of BSA@CuNCs shows a good linear behaviour in the 0–15 μM concentration of PA (Figure 5b). This can be linearly fitted with the equation (F0/F)-1 = −0.0036 × X + 0.0431 (R2 = 0.99167), where X denotes the PA concentration. The detection limit was calculated as 60 nM using the equation 3σ/k, where σ is the standard deviation of the blank sample and k is slope of linear calibration plot. The present method thus exhibits a relatively better LOD for detecting PA in comparison to the other recently reported fluorescence methods. A comparison of the synthesized probe for the detection of PA with other fluorescence-based methods is listed in Table 1.
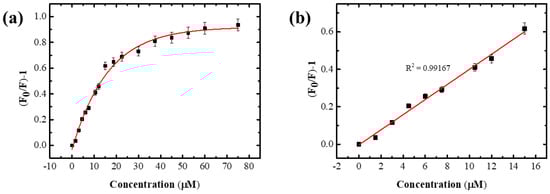
Figure 5.
(a) The plot of the (F0/F)-1 vs. the concentration of PA in the range of 0–75 µM. (b) The linear plot of (F0/F)-1 vs. the concentration of PA in the range of 0–15 µM.
In this work, the fluorescence intensity of BSA@CuNCs was found to decrease with the addition of PA, as shown in Figure 4a. A plausible mechanism for the sensing of PA by BSA@CuNCs is shown in Scheme 2. To understand the quenching mechanism, we carried out further investigations. The mechanism for quenching of fluorescence intensity in the presence of an analyte can be one of the following: fluorescence resonance energy transfer (FRET), the inner filter effect (IFE), the formation of a donor–acceptor charge-transfer complex, and static and dynamic quenching effects [53]. The fluorescence resonance energy transfer (FRET) mechanism is found to be operative in the quenching process if the absorption spectrum of the quencher overlaps with the emission spectrum of the fluorophore. In our experiments, the photoluminescence emission spectrum of BSA@CuNCs was found at 405 nm, whereas the UV-Vis spectrum of PA was observed at 355 nm. As can be seen in Figure 6a, there is a significant spectral overlap between the absorption spectrum of PA and the emission spectrum of BSA-CuNCs, which meets the criteria of FRET. In order to gain more insight into the mechanism behind the quenching of emission intensity of BSA@CuNCs in the presence of PA, time-resolved photoluminescence (TRPL) measurements were also carried out using a TRPL FLS920 spectrophotometer, Edinburgh, UK (Figure 6b). As is reported in the literature, fluorescence lifetime, which remains constant for static quenching and changes proportionally with the quencher concentration for dynamic quenching, can be utilised to differentiate between static and dynamic quenching [47,48,49]. We used a thrice exponential decay function to fit the decay in the fluorescence intensity. It was found that with the increase in the concentration of PA, fluorescence lifetime became shorter (Table 2). This reduction in the lifetime indicates that the fluorescence resonance electron transfer from BSA@CuNCs to PA is in good agreement with previous reports [29]. Thus, the FRET mechanism controls the excellent selectivity of BSA@CuNCs towards PA in comparison to other nitro compounds.
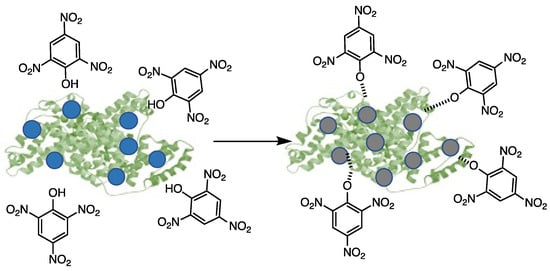
Scheme 2.
Schematic representation of plausible mechanism of sensing of PA.
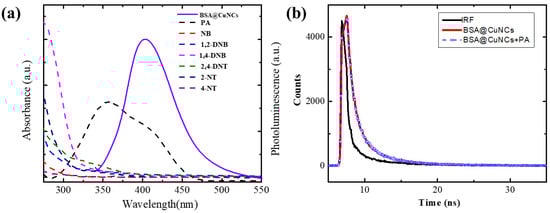
Figure 6.
(a) UV-Vis spectra of PA (black dashed line) and other nitroaromatic compounds (dashed lines) and fluorescence spectra (solid line) of BSA@CuNCs (b) Time-resolved fluorescence decay curves of BSA@CuNCs in the absence and presence of PA.

Table 2.
The time-resolved fluorescence decay components of the BSA@CuNCs with different concentrations of PA.
Table 1.
Comparison of proposed method with the previously reported strategies for the sensing of PA.
Table 1.
Comparison of proposed method with the previously reported strategies for the sensing of PA.
| Material | Limit of Detection | References |
|---|---|---|
| GQDs | 0.09 μM | [54] |
| N-GQDs | 0.92 μM | [55] |
| Reduced graphene oxide | 0.537 μM | [24] |
| Carbon dots | 51 nM | [56] |
| Amine-capped carbon dots | 1 μM | [57] |
| Lys-CdS QDs | 0.1 μM | [58] |
| Silver nanoclusters | 0.1 nM | [59] |
| Silver nanoclusters/DNA hybrids | 5.2 pM | [60] |
| Cys-CuNCs | 0.19 μM | [29] |
| BSA@CuNCs | 60 nm | This work |
3.2. Detection of PA in Water Samples
We also investigated the application of BSA@CuNCs for the detection of PA in water samples. For this purpose, we performed a recovery study where a known amount of the PA was added to the water sample. A standard addition method was applied to determine the recovery of PA in water samples. The proposed method shows excellent recovery (in the range of 98–99%) and good reproducibility, as shown in Table 3. The results obtained confirm that the developed photoluminescence-based sensor has tremendous potential for detecting PA in natural water samples.
Table 3.
Determination of PA in different water samples.
3.3. Turn-on–Based Sensing of H2O2
H2O2 is a very important molecule in the area of biological and chemical sciences. Developing new methods for its sensing and determination is of extreme importance. In this work, we also explored the possibility of H2O2 sensing using BSA@CuNCs under optimized conditions. Fluorescence experiments were carried out with the slow addition of H2O2 in the BSA@CuNCs solution. As presented in Figure 7a the fluorescence emission peak of BSA@CuNCs at 405 nm increased slowly with increasing H2O2 concentration. The plot of (1-F0/F) vs. the increasing concentration is reported in Figure 7b. The inset of Figure 7b exhibits the relative fluorescence intensity (1-F0/F), displaying linear response between the emission intensity and concentration of H2O2 in the range 0–36 μM. The detection limit obtained was 0.11 μM, which is comparable to the results reported in the literature. The relative standard deviation (RSD) was calculated to be 5.3% from the five repeated measurements of 10 μM H2O2, which confirms the extremely high reproducibility of the present system for H2O2. This increase in the PL intensity is due to the surface etching of CuNCs in the presence of H2O2.
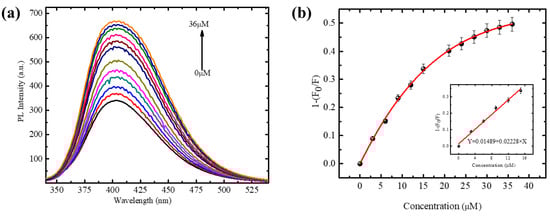
Figure 7.
(a) Fluorescence emission spectrum of BSA@CuNCs with a series of different concentrations of H2O2. (b) The plot of the 1-(F0/F) vs. concentration of H2O2 in the range of 0–36 μM. The inset shows the linear fit of 1-(F0/F) vs. the H2O2 concentration ranging of 3–15 μM.
4. Conclusions
To summarize, we reported on the development of a dual bifunctional fluorescence-based sensor constructing copper nanoclusters with BSA as a stabilizer. The so-synthesized BSA@CuNCs, with an excitation wavelength at 320 nm, displayed a sharp photoluminescence emission peak centred at 405 nm. The fluorescence intensity of BSA@CuNCs was observed to quench (“Turn-off”) and enhance (“Turn-on”) in the presence of PA and H2O2, respectively. The emission spectra of the BSA@CuNCs was found to be remarkably decreased while adding PA, and it was observed to be extremely selective. The suggested fluorescence-based sensor revealed the detection of PA with a detection limit of 60 nM. The application of as-synthesized materials towards the detection of PA in water samples also produced satisfactory results, which confirms its practical applications for real samples. The as-developed material was also tested for H2O2 detection. It was found that H2O2 could increase the photoluminescence of BSA@CuNCs. A low value of 0.11 µM for the detection limit was calculated. This simplistic methodology demonstrates the applications of BSA@CuNCs in the sensing of a broad range of pollutants and thus demonstrates their relevance in environmental applications.
Author Contributions
Conceptualization, D.G.; methodology, D.G.; validation, R.S. and S.G.; formal analysis, C.S.P.T.; resources, M.K.B.; data curation, R.S.; writing—original draft preparation, R.S. and C.S.P.T.; writing—review and editing, C.S.P.T. and D.G.; supervision, D.G.; project administration, D.G.; funding acquisition, C.S.P.T. and D.G. All authors have read and agreed to the published version of the manuscript.
Funding
This research was funded by the Department of Science and Technology, New Delhi, India through grant No. DST/WTI/2016/122 and Banaras Hindu University, Varanasi, by providing seed grants under the IoE scheme (Dev. Scheme No. 6031).
Institutional Review Board Statement
Not applicable.
Informed Consent Statement
Not applicable.
Data Availability Statement
The data presented in this study are available on request from the corresponding author.
Acknowledgments
R.S. thanks UGC India for PhD fellowship. The authors gratefully acknowledge IIT-BHU and the Department of Chemistry for the use of instrumentation facilities.
Conflicts of Interest
The authors declare no conflict of interest.
References
- Shang, L.; Dong, S.; Nienhaus, G. Ultra-small fluorescent metal nanoclusters: Synthesis and biological applications. Nano Today 2011, 6, 401–418. [Google Scholar] [CrossRef]
- Tao, Y.; Li, M.; Ren, J.; Qu, X. Metal nanoclusters: Novel probes for diagnostic and therapeutic applications. Chem. Soc. 2015, 44, 8636–8663. [Google Scholar]
- Bigdeli, A.; Ghasemi, F.; Golmohammadi, H.; Abbasi-Moayed, S.; Nejad MA, F.; Fahimi-Kashani, N.; Hormozi-Nezhad, M.R. Nanoparticle-based optical sensor arrays. Nanoscale 2017, 9, 16546–16563. [Google Scholar] [CrossRef] [PubMed]
- Liu, S.; Lu, F.; Zhu, J.-J. Highly fluorescent Ag nanoclusters: Microwave-assisted green synthesis and Cr3+ sensing. Chem. Commun. 2011, 47, 2661–2663. [Google Scholar] [CrossRef]
- Yuan, X.; Luo, Z.; Zhang, Q.; Zhang, X.; Zheng, Y.; Lee, J.Y.; Xie, J. Synthesis of highly fluorescent metal (Ag, Au, Pt, and Cu) nanoclusters by electrostatically induced reversible phase transfer. ACS Nano 2011, 5, 8800–8808. [Google Scholar] [CrossRef]
- Sun, J.; Jin, Y. Fluorescent Au nanoclusters: Recent progress and sensing applications. J. Mater. Chem. 2014, 2, 8000–8011. [Google Scholar]
- Wen, F.; Dong, Y.; Feng, L.; Wang, S.; Zhang, S.; Zhang, X. Horseradish peroxidase functionalized fluorescent gold nanoclusters for hydrogen peroxide sensing. Anal. Chem. 2011, 83, 1193–1196. [Google Scholar] [CrossRef]
- Shang, L.; Dong, S. Silver nanocluster-based fluorescent sensors for sensitive detection of Cu (II). J. Mater. Chem. 2008, 18, 4636–4640. [Google Scholar] [CrossRef]
- Hu, X.; Liu, T.; Zhuang, Y.; Wang, W.; Li, Y.; Fan, W.; Huang, Y. Recent advances in the analytical applications of copper nanoclusters. Trends Anal. Chem. 2016, 77, 66–75. [Google Scholar]
- Ghosh, S.; Das, N.K.; Anand, U.; Mukherjee, S. Photostable copper nanoclusters: Compatible forster resonance energy-transfer assays and a nanothermometer. J. Phys. Chem. Lett. 2015, 6, 1293–1298. [Google Scholar] [CrossRef]
- Cauzzi, D.; Pattacini, R.; Delferro, M.; Dini, F.; Di Natale, C.; Paolesse, R.; Bonacchi, S.; Montalti, M.; Zaccheroni, N.; Calvaresi, M. Temperature-Dependent Fluorescence of Cu5 Metal Clusters: A Molecular Thermometer. Angew. Chem. Int. Ed. Engl. 2012, 51, 9662–9665. [Google Scholar] [CrossRef] [PubMed]
- Das, N.K.; Ghosh, S.; Priya, A.; Datta, S.; Mukherjee, S. Luminescent copper nanoclusters as a specific cell-imaging probe and a selective metal ion sensor. J. Phys. Chem. C 2015, 119, 24657–24664. [Google Scholar] [CrossRef]
- Zhang, W.J.; Liu, S.G.; Han, L.; Ling, Y.; Liao, L.L.; Mo, S.; Luo, H.Q.; Li, N.B. Copper nanoclusters with strong fluorescence emission as a sensing platform for sensitive and selective detection of picric acid. Anal. Methods 2018, 10, 4251–4256. [Google Scholar]
- Rajamanikandan, R.; Ilanchelian, M. Fluorescence sensing approach for high specific detection of 2, 4, 6-trinitrophenol using bright cyan blue color-emittive poly (vinylpyrrolidone)-supported copper nanoclusters as a fluorophore. ACS Omega 2018, 3, 18251–18257. [Google Scholar] [PubMed]
- Li, H.; Chang, J.; Hou, T.; Ge, L.; Li, F. A facile, sensitive, and highly specific trinitrophenol assay based on target-induced synergetic effects of acid induction and electron transfer towards DNA-templated copper nanoclusters. Talanta 2016, 160, 475–480. [Google Scholar] [CrossRef]
- Wang, Z.; Chen, B.; Rogach, A.L. Synthesis, optical properties and applications of light-emitting copper nanoclusters. Nanoscale Horiz. 2017, 2, 135–146. [Google Scholar]
- Han, A.; Xiong, L.; Hao, S.; Yang, Y.; Li, X.; Fang, G.; Liu, J.; Pei, Y.; Wang, S. Highly bright self-assembled copper nanoclusters: A novel photoluminescent probe for sensitive detection of histamine. Anal. Chem. 2018, 90, 9060–9067. [Google Scholar] [CrossRef]
- Chauhan, C.; Bhardwaj, V.; Sahoo, S.K. Sequential detection of vitamin B6 cofactors and nitroaromatics by using albumin-stabilized fluorescent copper nanoclusters. Microchem. J. 2021, 170, 106778. [Google Scholar]
- Sabzalipoor, H.; Karimi, E.; Nikkhah, M.; Abbasian, S.; Moshaii, A. Metal enhanced fluorescence of different metallic nanoclusters deposited on silver dendritic nanostructures. Micro Nano Lett. 2022, 17, 114–123. [Google Scholar] [CrossRef]
- Devaraj, V.; Lee, J.-M.; Kim, Y.-J.; Jeong, H.; Oh, J.-W. Engineering Efficient Self-Assembled Plasmonic Nanostructures by Configuring Metallic Nanoparticle’s Morphology. Int. J. Mol. Sci. 2021, 22, 10595. [Google Scholar] [CrossRef]
- Dong, M.; Wang, Y.W.; Zhang, A.J.; Peng, Y. Colorimetric and Fluorescent Chemosensors for the Detection of 2, 4, 6-Trinitrophenol and Investigation of their Co-Crystal Structures. Chem. Asian 2013, 8, 1321–1330. [Google Scholar] [CrossRef] [PubMed]
- Ma, Y.; Li, H.; Peng, S.; Wang, L. Highly selective and sensitive fluorescent paper sensor for nitroaromatic explosive detection. Anal. Chem. 2012, 84, 8415–8421. [Google Scholar] [CrossRef] [PubMed]
- Liu, S.; Shi, F.; Chen, L.; Su, X. Bovine serum albumin coated CuInS2 quantum dots as a near-infrared fluorescence probe for 2, 4, 6-trinitrophenol detection. Talanta 2013, 116, 870–875. [Google Scholar] [CrossRef] [PubMed]
- Dinda, D.; Gupta, A.; Shaw, B.K.; Sadhu, S.; Saha, S.K. Highly selective detection of trinitrophenol by luminescent functionalized reduced graphene oxide through FRET mechanism. ACS Appl. Mater. 2014, 6, 10722–10728. [Google Scholar] [CrossRef] [PubMed]
- Nagarkar, S.S.; Desai, A.V.; Samanta, P.; Ghosh, S.K. Aqueous phase selective detection of 2, 4, 6-trinitrophenol using a fluorescent metal–organic framework with a pendant recognition site. Dalton Trans. 2015, 44, 15175–15180. [Google Scholar] [CrossRef]
- Patel, R.; Bothra, S.; Kumar, R.; Crisponi, G.; Sahoo, S.K. Pyridoxamine driven selective turn-off detection of picric acid using glutathione stabilized fluorescent copper nanoclusters and its applications with chemically modified cellulose strips. Biosens. Bioelectron. 2018, 102, 196–203. [Google Scholar] [CrossRef]
- Xu, B.; Wu, X.; Li, H.; Tong, H.; Wang, L. Selective detection of TNT and picric acid by conjugated polymer film sensors with donor–acceptor architecture. Macromolecules 2011, 44, 5089–5092. [Google Scholar] [CrossRef]
- Kaur, S.; Bhalla, V.; Vij, V.; Kumar, M. Fluorescent aggregates of hetero-oligophenylene derivative as “no quenching” probe for detection of picric acid at femtogram level. J. Mater. Chem. 2014, 2, 3936–3941. [Google Scholar]
- Shanmugaraj, K.; John, S.A. Inner filter effect based selective detection of picric acid in aqueous solution using green luminescent copper nanoclusters. New J. Chem. 2018, 42, 7223–7229. [Google Scholar] [CrossRef]
- Buragohain, A.; Yousufuddin, M.; Sarma, M.; Biswas, S. 3D luminescent amide-functionalized cadmium tetrazolate framework for selective detection of 2, 4, 6-trinitrophenol. Cryst. Growth Des. 2016, 16, 842–851. [Google Scholar] [CrossRef]
- Peng, Y.; Zhang, A.-J.; Dong, M.; Wang, Y.-W. A colorimetric and fluorescent chemosensor for the detection of an explosive—2, 4, 6-trinitrophenol (TNP). Chem. Commun. 2011, 47, 4505–4507. [Google Scholar] [CrossRef] [PubMed]
- Thorne, P.G.; Jenkins, T.F. A field method for quantifying ammonium picrate and picric acid in soil. Field Anal. Chem. Technol. 1997, 1, 165–170. [Google Scholar] [CrossRef]
- Barron, L.; Gilchrist, E. Ion chromatography-mass spectrometry: A review of recent technologies and applications in forensic and environmental explosives analysis. Anal. Chim. Acta 2014, 806, 27–54. [Google Scholar] [CrossRef] [PubMed]
- Badjagbo, K.; Sauvé, S. High-throughput trace analysis of explosives in water by laser diode thermal desorption/atmospheric pressure chemical ionization-tandem mass spectrometry. Anal. Chem. 2012, 84, 5731–5736. [Google Scholar] [CrossRef]
- Dasary, S.S.; Singh, A.K.; Senapati, D.; Yu, H.; Ray, P.C. Gold nanoparticle based label-free SERS probe for ultrasensitive and selective detection of trinitrotoluene. J. Am. Chem. Soc. 2009, 131, 13806–13812. [Google Scholar] [CrossRef]
- Lopez-Lopez, M.; Garcia-Ruiz, C. Infrared and Raman spectroscopy techniques applied to identification of explosives. Trends Anal. Chem. 2014, 54, 36–44. [Google Scholar] [CrossRef]
- Wells, K.; Bradley, D. A review of X-ray explosives detection techniques for checked baggage. Appl. Radiat. Isot. 2012, 70, 1729–1746. [Google Scholar] [CrossRef]
- Berg, M.; Bolotin, J.; Hofstetter, T.B. Compound-specific nitrogen and carbon isotope analysis of nitroaromatic compounds in aqueous samples using solid-phase microextraction coupled to GC/IRMS. Anal. Chem. 2007, 79, 2386–2393. [Google Scholar] [CrossRef]
- Vourvopoulos, G.; Womble, P. Pulsed fast/thermal neutron analysis: A technique for explosives detection. Talanta 2001, 54, 459–468. [Google Scholar] [CrossRef]
- Bao, Z.; Zhang, K.; Jian, J.; Hu, Z.; Yuan, K.; Shao, H.; Peng, K.; Jiang, Z.; Zapien, J.A.; Yan, Y. Strongly fluorescent cysteamine-coated copper nanoclusters as a fluorescent probe for determination of picric acid. Mikrochim. Acta 2018, 185, 1–7. [Google Scholar] [CrossRef]
- Yu, C.; Wang, L.; Li, W.; Zhu, C.; Bao, N.; Gu, H. Detection of cellular H2O2 in living cells based on horseradish peroxidase at the interface of Au nanoparticles decorated graphene oxide. Sens. Actuators B Chem. 2015, 211, 17–24. [Google Scholar] [CrossRef]
- Zhang, J.; Liu, X.; Zhou, J.; Huang, X.; Xie, D.; Ni, J.; Ni, C. Carbon dots derived from algae as H 2 O 2 sensors: The importance of nutrients in biomass. Nanoscale Adv. 2019, 1, 2151–2156. [Google Scholar] [CrossRef] [PubMed]
- Wei, C.; Liu, Y.; Li, X.; Zhao, J.; Ren, Z.; Pang, H. Nitrogen-Doped Carbon–Copper Nanohybrids as Electrocatalysts in H2O2 and Glucose Sensing. ChemElectroChem 2014, 1, 799–807. [Google Scholar] [CrossRef]
- Linley, E.; Denyer, S.P.; McDonnell, G.; Simons, C.; Maillard, J.-Y. Use of hydrogen peroxide as a biocide: New consideration of its mechanisms of biocidal action. J. Antimicrob. Chemother. 2012, 67, 1589–1596. [Google Scholar] [CrossRef]
- Xie, F.; Cao, X.; Qu, F.; Asiri, A.M.; Sun, X. Cobalt nitride nanowire array as an efficient electrochemical sensor for glucose and H2O2 detection. Sens. Actuators B Chem. 2018, 255, 1254–1261. [Google Scholar] [CrossRef]
- Ding, Y.; Yang, B.; Liu, H.; Liu, Z.; Zhang, X.; Zheng, X.; Liu, Q. FePt-Au ternary metallic nanoparticles with the enhanced peroxidase-like activity for ultrafast colorimetric detection of H2O2. Sens. Actuators B Chem. 2018, 259, 775–783. [Google Scholar] [CrossRef]
- Hu, L.; Yuan, Y.; Zhang, L.; Zhao, J.; Majeed, S.; Xu, G. Copper nanoclusters as peroxidase mimetics and their applications to H2O2 and glucose detection. Anal. Chim. Acta 2013, 762, 83–86. [Google Scholar] [CrossRef]
- Liu, H.; Ding, Y.; Yang, B.; Liu, Z.; Liu, Q.; Zhang, X. Colorimetric and ultrasensitive detection of H2O2 based on Au/Co3O4-CeOx nanocomposites with enhanced peroxidase-like performance. Sens. Actuators B Chem. 2018, 271, 336–345. [Google Scholar] [CrossRef]
- Carter, D.C.; Ho, J.X. Structure of serum albumin. In Advances in Protein Chemistry; Elsevier: Amsterdam, The Netherlands, 1994; Volume 45, pp. 153–203. [Google Scholar]
- Singh, A.V.; Bandgar, B.M.; Kasture, M.; Prasad, B.; Sastry, M. Synthesis of gold, silver and their alloy nanoparticles using bovine serum albumin as foaming and stabilizing agent. J. Mater. Chem. 2005, 15, 5115–5121. [Google Scholar] [CrossRef]
- Singh, A.; Patil, R.; Kasture, M.; Gade, W.; Prasad, B. Synthesis of Ag–Pt alloy nanoparticles in aqueous bovine serum albumin foam and their cytocompatibility against human gingival fibroblasts. Colloids Surf. B 2009, 69, 239–245. [Google Scholar] [CrossRef]
- Huang, P.; Li, Z.; Hu, H.; Cui, D. Synthesis and characterization of bovine serum albumin-conjugated copper sulfide nanocomposites. J. Nanomater. 2010, 33, 1–6. [Google Scholar] [CrossRef]
- Lakowicz, J.R. (Ed.) Principles of Fluorescence Spectroscopy; Springer: Boston, MA, USA, 2006. [Google Scholar]
- Li, Z.; Wang, Y.; Ni, Y.; Kokot, S. A sensor based on blue luminescent graphene quantum dots for analysis of a common explosive substance and an industrial intermediate, 2, 4, 6-trinitrophenol. Spectrochim. Acta A Mol. Biomol. Spectrosc. 2015, 137, 1213–1221. [Google Scholar] [CrossRef] [PubMed]
- Kaur, M.; Mehta, S.K.; Kansal, S.K. A fluorescent probe based on nitrogen doped graphene quantum dots for turn off sensing of explosive and detrimental water pollutant, TNP in aqueous medium. Spectrochim. Acta A Mol. Biomol. Spectrosc. 2017, 180, 37–43. [Google Scholar] [CrossRef]
- Fan, Y.Z.; Zhang, Y.; Li, N.; Liu, S.G.; Liu, T.; Li, N.B.; Luo, H.Q. A facile synthesis of water-soluble carbon dots as a label-free fluorescent probe for rapid, selective and sensitive detection of picric acid. Sens. Actuators B Chem. 2017, 240, 949–955. [Google Scholar] [CrossRef]
- Niu, Q.; Gao, K.; Lin, Z.; Wu, W. Amine-capped carbon dots as a nanosensor for sensitive and selective detection of picric acid in aqueous solution via electrostatic interaction. Anal. Methods 2013, 5, 6228–6233. [Google Scholar] [CrossRef]
- Na, W.; Liu, X.; Pang, S.; Su, X. Highly sensitive detection of 2, 4, 6-trinitrophenol (TNP) based on lysozyme capped CdS quantum dots. RSC Adv. 2015, 5, 51428–51434. [Google Scholar] [CrossRef]
- Zhang, J.R.; Yue, Y.Y.; Luo, H.Q.; Li, N.B. Supersensitive and selective detection of picric acid explosive by fluorescent Ag nanoclusters. Analyst 2016, 141, 1091–1097. [Google Scholar] [CrossRef]
- Wang, Z.; Chen, B.; Rogach, A.L. Ag nanocluster/DNA hybrids: Functional modules for the detection of nitroaromatic and RDX explosives. Nano Lett. 2014, 14, 4918–4922. [Google Scholar]


Disclaimer/Publisher’s Note: The statements, opinions and data contained in all publications are solely those of the individual author(s) and contributor(s) and not of MDPI and/or the editor(s). MDPI and/or the editor(s) disclaim responsibility for any injury to people or property resulting from any ideas, methods, instructions or products referred to in the content. |
© 2023 by the authors. Licensee MDPI, Basel, Switzerland. This article is an open access article distributed under the terms and conditions of the Creative Commons Attribution (CC BY) license (https://creativecommons.org/licenses/by/4.0/).