Article

Use of Pyrolyzed Soybean Hulls as Fillers in Polypropylene and Linear Low Density Polyethylene

Polymer Engineering Department, University of Akron, Akron, OH 44325, USA
*
Author to whom correspondence should be addressed.
Sustain. Chem. 2021, 2(4), 622-644; https://doi.org/10.3390/suschem2040035
Submission received: 16 September 2021 / Revised: 7 November 2021 / Accepted: 8 November 2021 / Published: 12 November 2021

Abstract

:
In the competitive market of plastic fillers, inexpensive and reliable materials are always sought after. Using a method of thermal conversion called pyrolysis, a potential contender was created from a plant biomass known as soybean hulls (SBH). SBH are a byproduct of the soybean farming industry and represent an abundant and inexpensive feedstock. The thermal conversion of SBH material gives rise to a lightweight carbon-rich filler called pyrolyzed soybean hulls (PSBH). We created two separate lots, lots A and B, with lot A corresponding to SBH pyrolyzed at 450 °C (PSBH-A) and lot B corresponding to SBH pyrolyzed at 500 °C (PSBH-B). Both lots of PSBH were also milled to reduce their particle size and tested against the as-received PSBH fillers. These milled materials were designated as ground soybean hulls (GSBH). Two different polyolefins, linear low-density polyethylene (LLDPE) and polypropylene (PP), were used for this study. The PSBH fillers were added to the polyolefins in weight percentages of 10%, 20%, 30%, 40%, and 50%, with the resulting plastic/PSBH composites being tested for their mechanical, thermal, and water absorption properties. In general, the addition of filler increased the maximum stress of the LLDPE/PSBH composites while reducing maximum stress of the PP/PSBH composites. The strain at maximum stress was reduced with increasing amounts of the PSBH filler for all composites. The modulus of elasticity generally increased with increasing filler amount. For thermal properties, the addition of the PSBH filler increased the heat distortion temperature, increased the thermal decomposition temperature, and reduced the heat of fusion of the composites compared to the neat polyolefins. The liquid absorption and thickness swelling in the materials were small overall but did increase with increasing amounts of the PSBH filler and with the time spent submerged in liquid. Milling the PSBH material into GSBH generally had small effects on the various tested material properties and led to easier mixing and a smoother finish on the surface of processed samples. The differences observed between lot A and lot B composites were often small or even negligible.

1. Introduction

Biomass has been known as a valuable renewable energy source since the beginning of humanity. With enhancements in technology, the uses of biomass feedstock are always expanding, and its full potential has not yet been reached. One avenue for experimentation resides in the use of biomass converted into material fillers. Most of the common organic fillers are some form of flour or fiber, but the filler of interest discussed in this paper is thermally converted soybean hulls. More specifically, the filler is pyrolyzed soybean hulls (PSBH) evaluated by mixing them with two different polyolefins, namely linear low-density polyethylene (LLDPE) and polypropylene (PP). The PSBH were added to the polyolefins in weight percentages of 10%, 20%, 30%, 40%, and 50%, with the resulting composites being tested for their mechanical, thermal, and water absorption properties.
Polypropylene is the first of the polyolefins used in this study. PP has the chemical formula (C3H6)n and is created via chain-growth polymerization using the propylene monomer. PP is a popular commodity plastic, with a global production of 73.7 million tons in 2016 [1]. The physical, mechanical, thermal, and absorption properties of PP coupled with its low price and low density make it an attractive plastic for use in many applications. Common uses of PP include as packaging and containers for food.
The other polyolefin used in this study is LLDPE, which is created via the chain-growth polymerization of the ethylene monomer. LLDPE is characterized by its low density (for PE) and its many short branches that come off the main polymer chain. The production of PE was 103 million tons in 2016, with 35.1 million tons being LLDPE [2]. LLDPE has various applications but is generally used to make bags or used as films.
Plant biomasses were considered here because of their major benefits: they have a large and sustainable feedstock, acceptable mechanical and thermal properties, low densities, are inexpensive, and they are more environmentally friendly than other alternatives. Burning biomass is considered cleaner since no CO2 is created from its use; instead, the CO2 absorbed during photosynthesis is merely being released, thus leading to no net gain in CO2 [3]. There are some obstacles to overcome before using biomass, however: most biomass is hydrophilic, which causes problems with storage and increases processing costs; its low mass and energy densities coupled with large volume make the transportation of biomass materials more inefficient than other solid materials; the shape of biomass and its fibrous structures lead to poor flowability and make it more difficult to grind; the composition of biomass is variable based on its growing conditions, which increases processing difficulty; and the amount that can be grown and stockpile decay are also concerns [4]. These drawbacks are the reason why biomass is not more widely used, but there are solutions to many of them that are discussed later.
Soybean hulls (SBH) are the biomass of interest in this paper. Soybean hulls are the outer coating/skin around each soybean seed and are not to be confused with the pods that soybeans grow inside on the plant [5,6].
The hulls are a byproduct of traditional soybean processing and are typically used as feed for various cattle or treated as waste. Soybean hulls are considered a lignocellulosic material, meaning that they are primarily made up of cellulose, hemicellulose, and lignin. A collection of data provided by [7] suggested that soybean hulls contain the following materials: cellulose (29–51%), hemicelluloses (10–25%), proteins (11–15%), pectins (4–8%), lignin (1–4%), and minor extractives. Some of the major advantages of using SBH as a filler are that they are inexpensive and have a readily available feedstock. World soybean production for the 2019/2020 year was predicted to be approximately 341 million metric tons [8]. The hull of the soybean is about 5% of the total weight of the crop [9], which means an estimated 17 million metric tons of soybean hulls were available in the 2019/2020 year. Another advantage that soybean hulls have as a filler is that there are not any additional steps or processes that need to be added onto the pre-existing growing or processing procedures. Since the hulls are simply a byproduct of farming soybeans, there is no additional land required or any changes that need to be made to any of the machinery.
There are many types of thermal conversion processes. The major differences between the processes are the temperatures that they operate at, the overall goal of the process, and the environment in which the reaction is carried out. Liquefaction (250–330 °C), pyrolysis (300–650 °C), combustion (700–1400 °C), and gasification (800–1000 °C) are four of the major thermal conversion processes, and each have a variety of uses in creating various forms of solid, liquid, and gaseous fuels [10]. Pyrolysis is the focus of this paper, as that is how the soybean hulls were prepared.
The gaseous products of pyrolysis mainly comprise carbon dioxide, carbon monoxide, ethane, ethylene, hydrogen, methane, and water vapor [11]. The design of the pyrolizer, biomass properties, heating rate, final temperature, residence time, pressure, reaction atmosphere, and presence of catalysts are all major factors in determining the product of the pyrolysis process [10].
A method of mild pyrolysis at lower temperatures over longer periods called torrefaction can be used to convert biomass into a desirable solid product with higher energy density, easier grindability, improved water resistance, lower atomic H/C and O/C ratios, and more uniform properties [12]. In our case of the SBH, thermal conversion was carried out at temperatures above traditional torrefaction levels for expediency in production time.
The key objectives of this work can be summarized as follows:
  • Add pyrolyzed soybean hull (PSBH) fillers to two polyolefins, linear low-density polyethylene (LLDPE) and polypropylene (PP), in weight percentages of 10%, 20%, 30%, 40%, and 50%.
  • Analyze the resulting plastic/PSBH composites for their mechanical, thermal, and water absorption properties.
  • Observe the effects that pyrolysis temperature and particle size of the filler have on the properties of the composites.
The main purposes were to:
  • Lower the overall cost of products.
  • Enhance material properties.
  • Lower resource use and environmental impact.
Among the findings of this work, perhaps the most significant result is that the heat distortion temperature for the composites increased with increasing amounts of the PSBH filler for all cases. The heat distortion temperatures of the as-received LLDPE/PSBH composites moved to higher values in comparison to their ground counterparts. The pyrolysis temperatures also had some influence, as lot A materials generally outperformed lot B materials.

2. Materials and Experimental Procedures

2.1. Materials Used

2.1.1. Polyolefins

The LLDPE used in this study was provided by Americhem (Cuyahoga Falls, OH, USA), and the PP used was a Hival grade homopolymer (Hival 26007) provided by Nexeo Solutions (Dublin, OH, USA).

2.1.2. Pyrolyzed Soybean Hull (PSBH) Filler

Soybean hulls were thermally converted into carbon by Nex-Gen Industries (NGI, Chavies, KY, USA). Over the course of three days, NGI processed approximately 2 tons of the SBH feedstock in an indirect-fired rotary kiln at four different temperatures using a four-minute resident time. The feedstock was said to be uniform in size and flowed through the augers without hanging. It was noted that the off-gas produced during the process was excessive compared to other biomasses but could still be completely incinerated, thus leaving only trace amounts of residue. NGI also concluded that vapor recovery could be implemented to limit production costs. Table 1 summarizes the results of the four different lots created from the feedstock. Of the four lots created, two were used in this study. Lot A corresponded to feedstock processed at 450 °C, leading to a feed reduction of 80% and a carbon content of 77%. Lot B corresponded to feedstock processed at 500 °C, with a 91% feed reduction and 85% carbon content. Feed reduction and carbon content increased with increasing operating temperatures.
Figure 1 shows the as-received PSBH material from both lots A and B. The two lots were similar in grain size and in color.

2.2. Experimental Procedures

2.2.1. Particle Size of As-Received PSBH

An RX-86 sieve shaker (W.S. Tyler Inc., Gastonia, NC, USA) with accompanying sieves (ASTM E11, Fisher Scientific, Hampton, NH, USA) was used to determine the distribution of particle sizes for the as-received PSBH filler. The used sieve opening sizes were 710, 600, 500, 425, 250, and 90 μm, as organized from top to bottom, respectively. The material was sieved for 28 min (the maximum time the machine allowed), with any material smaller than 90 μm being collected by a solid pan at the bottom of the sieving stack. For both PSBH-A and PSBH-B, three separate sieving tests were done, and the results were combined to form a particle size distribution.

2.2.2. Particle Size Reduction of PSBH Using Jar Mill

The used roller jar (ball) mill machine was a 764-AVM Jar Mill (U.S. Stoneware, East Palestine, OH, USA). Milling was carried out in an alumina-fortified porcelain jar using cylindrically shaped zirconia grinding media. The grinding media consisted of two sizes: 9.5 × 9.5 mm and 12.7 × 12.7 mm. The mixture of grinding media and filler were added to fill roughly 60% of the jar’s capacity to allow for appropriate room for movement during tumbling. About 50 g of as-received PSBH were milled at any one time. The jar was placed on rollers and rotated for 24 h at a rate of 70 rotations per minute.

2.2.3. Particle Size of Ground SBH (GSBH)

Since the particle size of the GSBH is smaller than the mesh openings found in any of the sieves, a different method needed to be used. To determine the particle sizes of the GSBH, a combination of SEM images and ImageJ software was used, with one image of both GSBH-A and GSBH-B being evaluated for particle size. The ImageJ software can use the scale of an SEM image to convert picture pixels into distances. Once properly calibrated, the software was used to manually outline the shape of a vast number of the particles in each SEM image. For GSBH-A, 125 particles were evaluated. For GSBH-B, 100 particles were evaluated. The number of particles evaluated was based on the number available in each image and the ability to see a clear boundary for the particle shapes. The smallest particles were not evaluated because their outlines could not be accurately determined and traced.
Using the software, two separate metrics for particle size were acquired: ferret diameter and projected area diameter. The ferret diameter, sometimes called the caliper length, is the distance between two parallel tangent lines that touch the outer surface of a 2D particle image [13]. The ImageJ software uses the outline of each particle to determine its maximum and minimum ferret diameter. While these two readings give some insight into the maximum and minimum lengths of each particle, the irregular and varying shape of the GSBH particles means that two diameters are not the most accurate method to depict reliable particle sizes. To achieve a more consistent measurement of the particle size, a method of equivalent diameters was used. By using the outlined particles, the ImageJ software could calculate the area of each particle (Ap). A circle of equivalent area to the 2D particle was created, and its diameter (Dp) was considered the projected area diameter of the particle [13]. The projected area diameter was easily calculated from the area of a circle: Dp = (4Apπ)1/2.

2.2.4. Sample Preparation for Mechanical Testing

As-received and ground PSBH material were mixed with LLDPE and PP in different weight amounts (10 wt.%, 20 wt.%, 30 wt.%, 40 wt.%, and 50 wt.%) using an internal batch compounder (Type 808-1002-DTI, C.W. Brabender Instruments, Inc., South Hackensack, NJ, USA) equipped with CAM blades. Each batch consisted of 35 g of total material. The mixing was done at 165 °C (LLDPE) and 190 °C (PP) using a 20 rpm mixing rate. In all cases, the polymer was added to the compounder first and allowed to melt for 10 and 15 min for LLDPE and PP, respectively. After the material was uniformly melted, the PSBH filler was added and allowed to mix for 20 min in all cases. After mixing, the material was collected via a brass putty knife and stored in labeled plastic bags.
The newly mixed material was processed using a 3.5 mL microinjection molder (DSM, Geleen, The Netherlands). The microinjection molder was used to create 5 dog-bone shaped samples (ASTM D638 Type-V) for each condition [14]. The barrel temperature was set to 165 and 190 °C for LLDPE and PP, respectively, and the mold temperature was 65 °C for all cases. The material was added to the barrel in small amounts and allowed to melt for 5 min before more was added. Between each amount added, the melted polymer was manually compressed in the barrel via a plunger to release trapped air from the material and prevent the formation of bubbles in the molded samples. Once the barrel was full, the material was injected into the mold at 0.3 MPa of pressure. Mold release spray was used to prevent the material from sticking to the mold and to allow for easy flow into the mold. The molded samples were removed, and their flashing was carefully cut off.

2.2.5. Mechanical Testing

Finished samples were tested using a tensometer (Instron 5567) equipped with Bluehill 3 software. Testing was conducted at room temperature, with a 50 mm/min crosshead rate and the use of a 1 kN load cell. Strain was measured based on the crosshead extension rather than with an extensometer because of the small sample dimensions and limitations of the available extensometer. From the received stress and strain data, the maximum tensile stress and the strain at that maximum stress were recorded for each sample. The slope of the stress–strain curve was taken at each point to obtain the tangent modulus data. The reported modulus of elasticity, or Young’s modulus, was determined by selecting the tangent modulus value where there was less than a 10% change from the previous value. This value marked the beginning of a region on the stress–strain graph where the slope was no longer significantly changing and therefore nearly linear. The tangent modulus was equivalent to Young’s modulus when taken from the linear elastic region of the stress–strain graph. Thus, by using two stress values (σ1 and σ2) and two corresponding strain values (ε1 and ε2), the Young’s modulus (E) could be determined via the equation: E = (σ2σ1)/(ε2ε1).
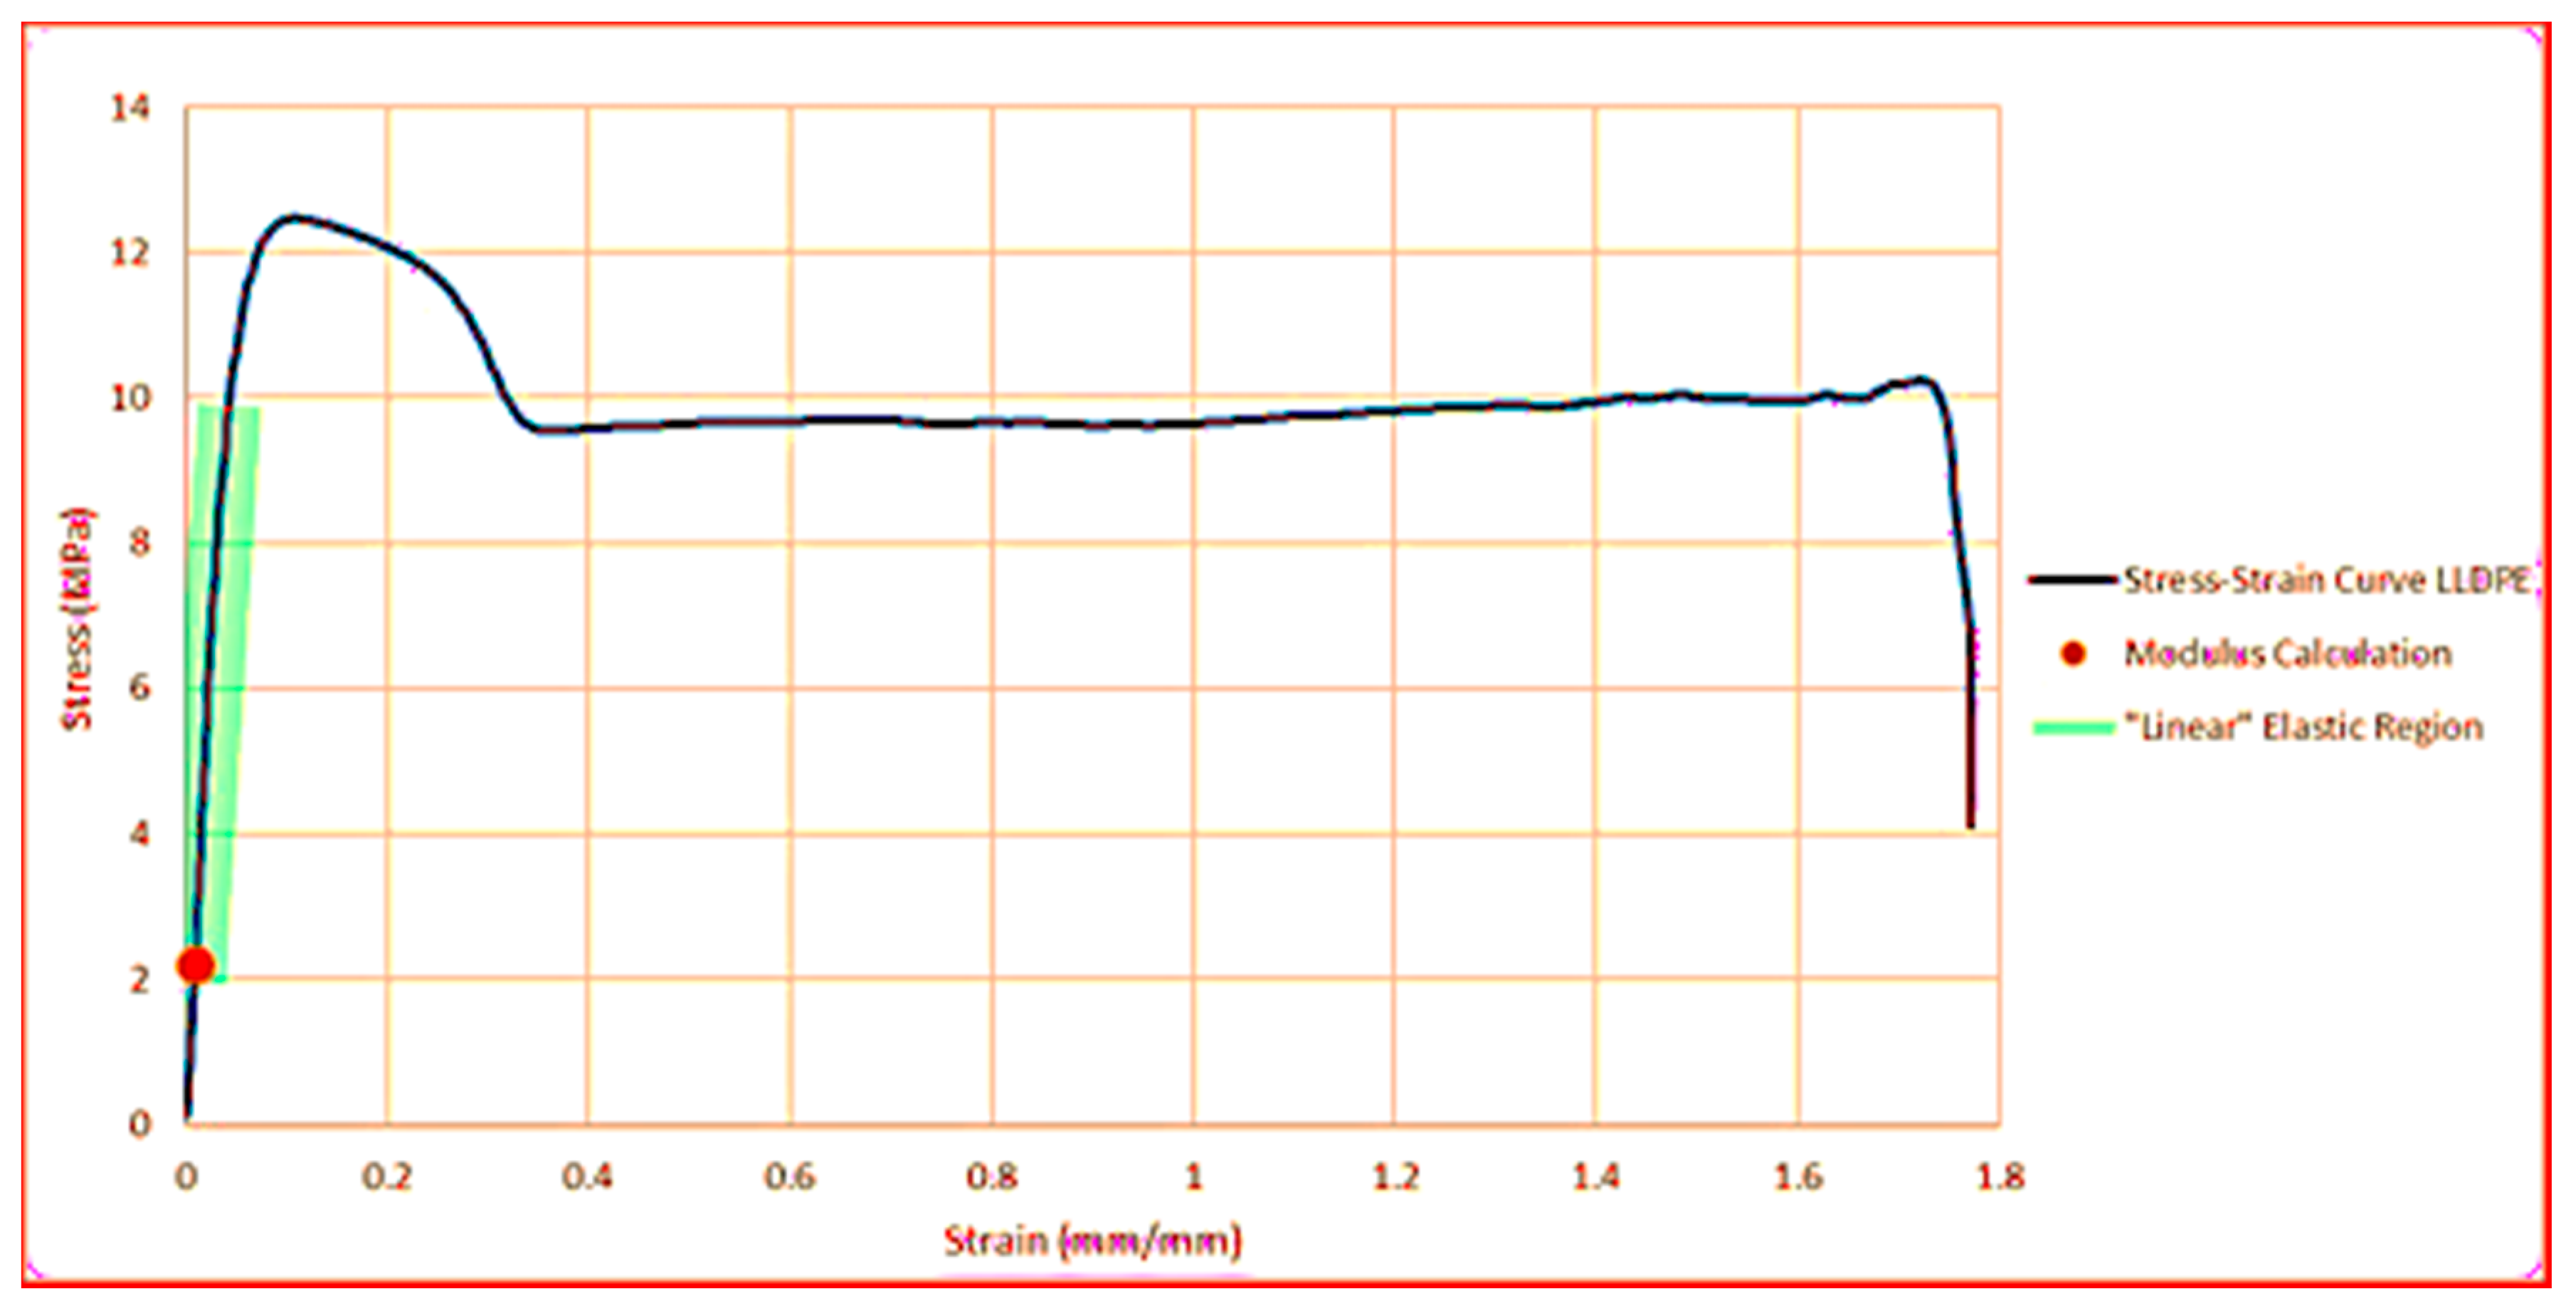
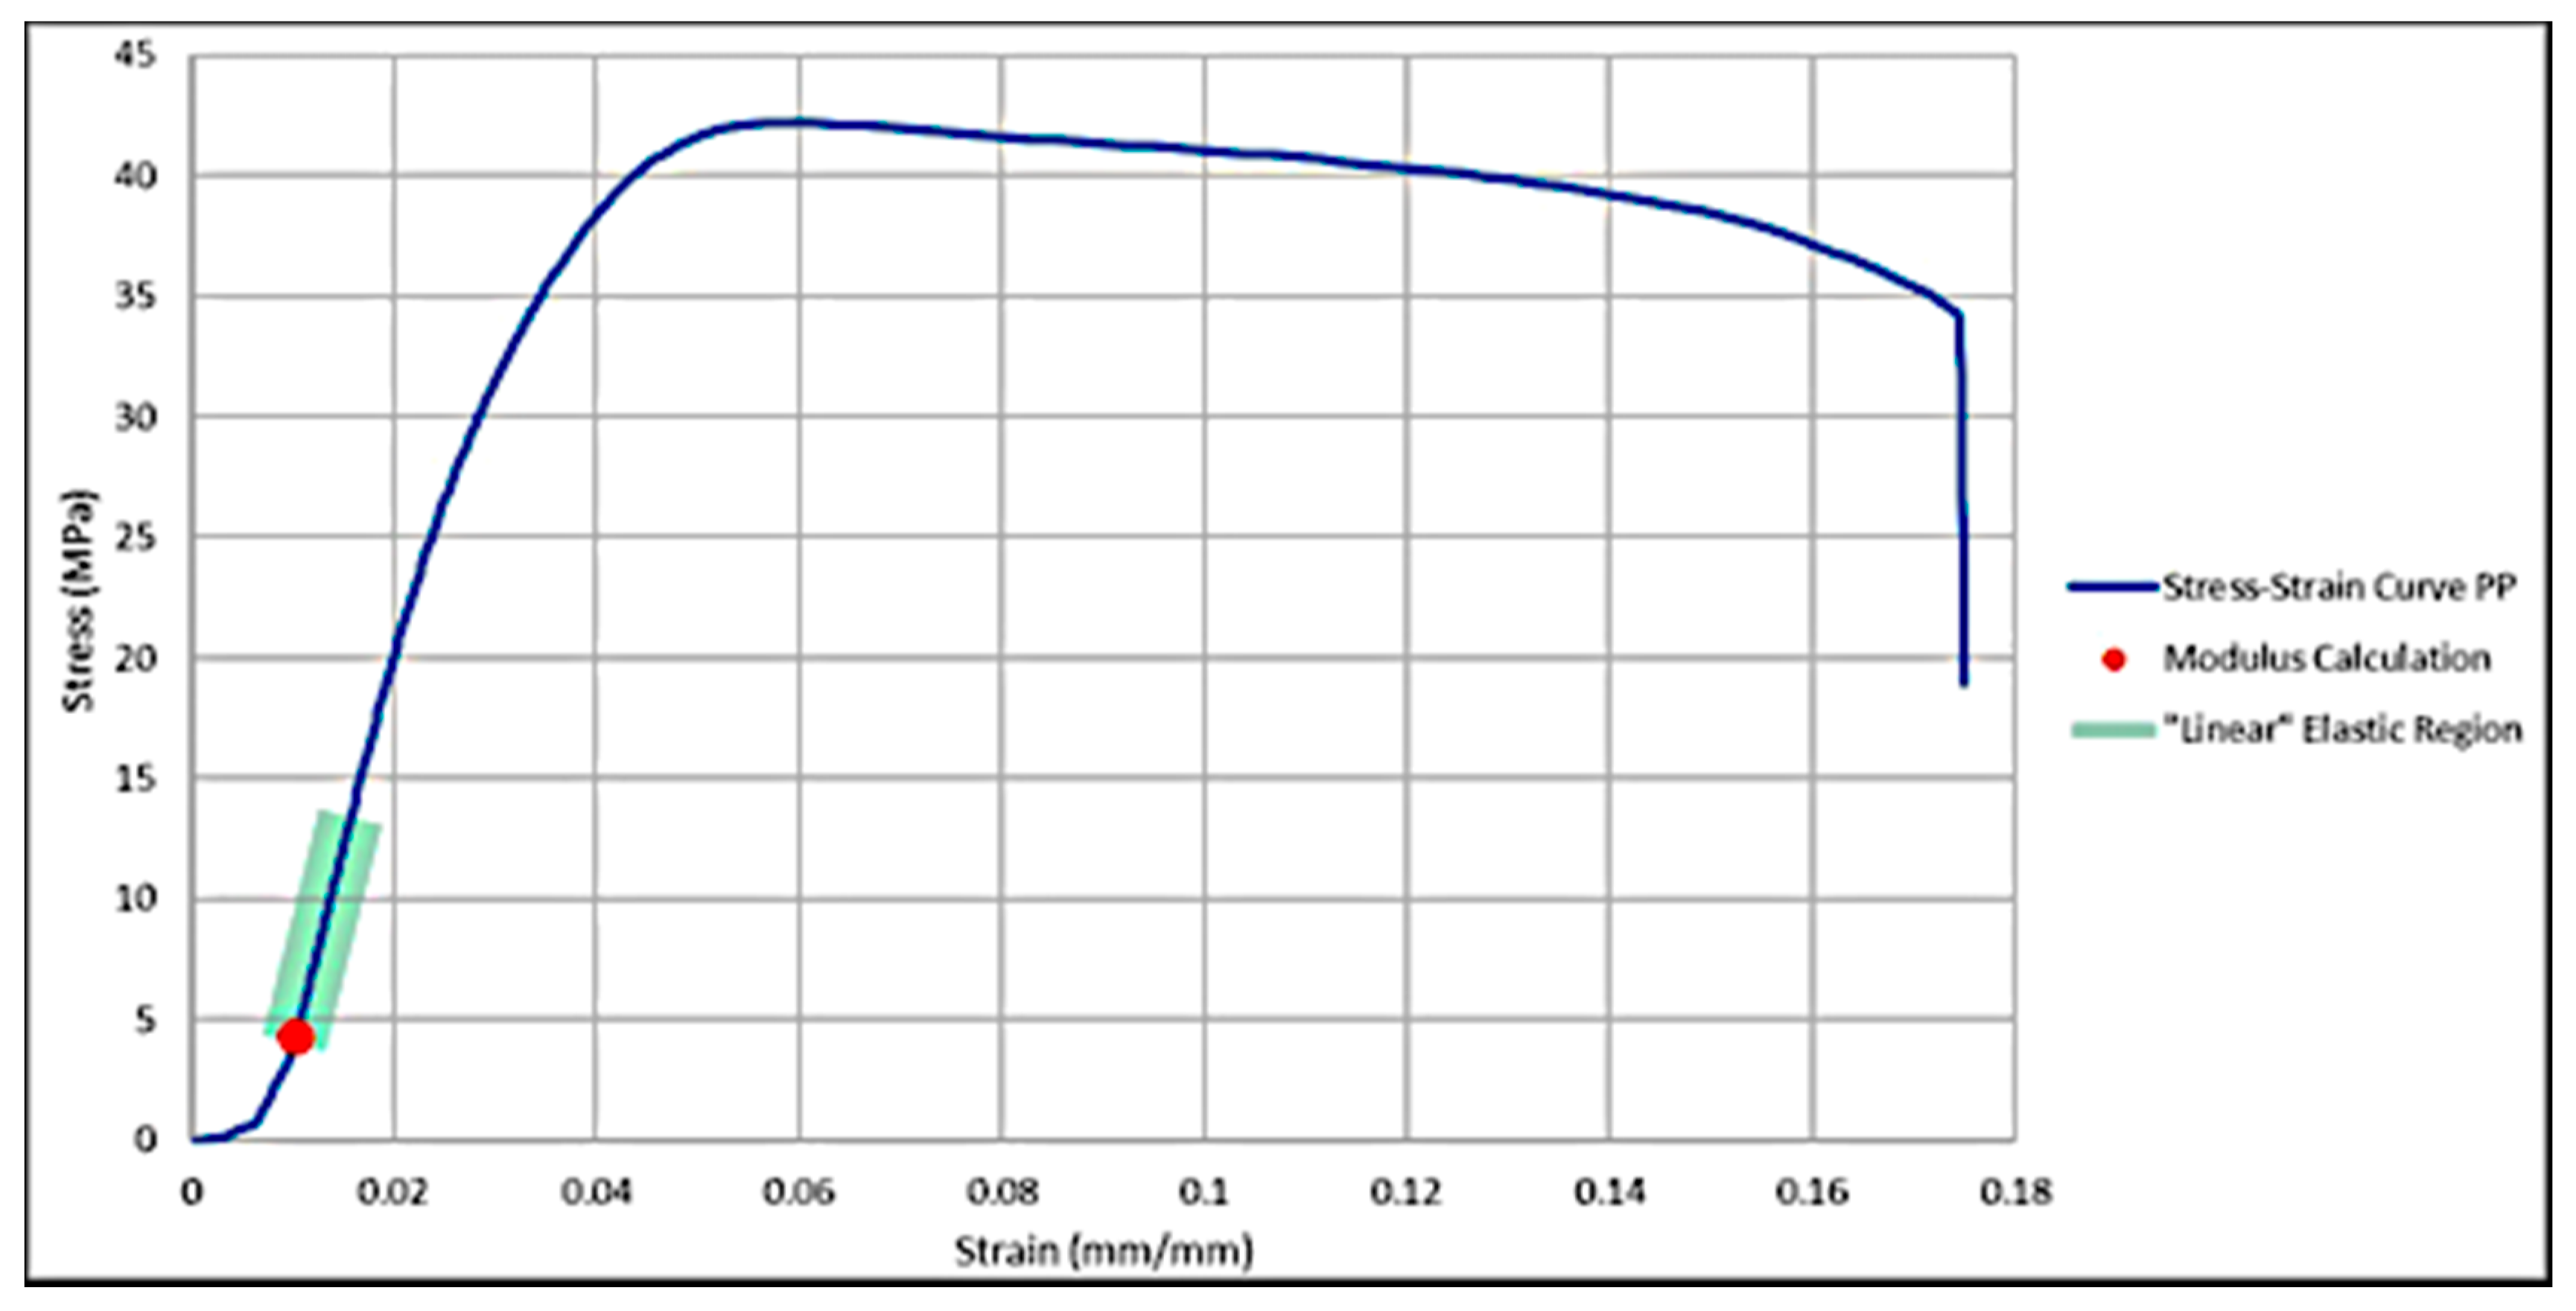
Figure 2 and Figure 3 show the stress–strain curves for single samples of neat LLDPE and neat PP, respectively. The highlighted region indicates where the curve can be considered linear or in its elastic region. Recall that this region is not perfectly linear but rather a region where the slope is changing by less than 10% from point to point. The red dot represents the location on the curve that the slope was taken to calculate Young’s modulus. The same method was followed for all polymer/PSBH composites.

2.2.6. Thickness Swelling and Liquid Uptake

For each filler condition, three separate rectangular pieces of material were cut using leftover dog-bone samples. Each of the three pieces was measured for thickness using a micrometer and then weighed. The samples were then placed into segmented Petri dishes and submerged in pure water with pH 7 for a total of 7 days at room temperature. At the end of the 1st, 3rd, and 7th days, the samples were removed from the water, any liquid on the surface was wiped clean with paper towel, and then the thickness and weight of each sample were remeasured to find the amount of thickness swelling and water intake. The results of the three samples were averaged together to form the final data. The same process was done again for both a 0.1 M dilute HCl solution with pH 2 and a 0.1 M dilute NaOH solution with pH 12. Using the weight (W) and the thickness (t) results, the water absorption and thickness swelling were calculated using Equations (1) and (2), respectively:
Water Absorption = [Wafter immersionWbefore immersion]/Wbefore immersion
Thickness Swelling = [tafter immersion − tbefore immersion]/tbefore immersion.

2.2.7. Dynamic Mechanical Analyses (DMA)

A DMA Q800 (TA Instruments, New Castle, DE, USA) was used to determine the heat distortion temperature for all polymer/PSBH composites, neat LLDPE, and neat PP. Testing was done under a nitrogen environment (40 mL/min) with three-point bending apparatus and constant stress (0.455 MPa) based on ASTM International Standard D648 [15]. The rectangular samples were created five at a time using compression molding plates and a 35 ton vacuum molding press (Technical Machine Products, Cleveland, OH, USA). The mold dimensions for the rectangular samples were a length of 63.5 mm, a width of 12.5 mm, and a thickness of 2.75 mm. Three separate plates were needed, with two plates being plain flat plates and the third being the molding plate. Polyethylene terephthalate (PET) plastic sheets were used between the three plates to prevent the samples from sticking to the metal surfaces. The molds were preloaded using 2.2 g of material for every sample, which was a suitable amount to ensure that the cavities were fully filled without causing excess flashing. Compression molding was done at 5000 lbs (2268 kg) for all cases using 12 × 12 in (30.5 × 30.5 cm) heated platens. LLDPE/PSBH samples were molded at 329 °F (165 °C) for 30 min, cooled to 230 °F (110 °C) in the mold, and allowed to sit (still under pressure) for 10 min. The same process was followed for PP/PSBH samples with a 410 °F (210 °C) molding temperature and a 300 °F (148.9 °C) cooling temperature. The created samples were tested in the 25–150 °C (PP/PSBH) and 25–120 °C (LLDPE/PSBH) ranges using 2 °C/min ramp rate.
Due to size limitations of the three-point bending apparatus for the Q800 instrument, the sample sizes suggested in ASTM D648 could not be used. To account for this issue, TA Instruments has an article that explains the necessary calculations in order to properly test with their machine and still adhere to the guidelines found in ASTM D648 [16]. ASTM classifies the heat distortion temperature as the temperature where the sample deflects 0.25 mm [15]. Using this knowledge, the strain in the ASTM sample could be calculated. The strain of the ASTM sample was used to find the DMA sample deflection required to induce an equivalent strain. The temperature recorded at this calculated deflection was the heat distortion temperature for each DMA sample (see [16] for more details and calculation examples).

2.2.8. Differential Scanning Calorimetry (DSC)

DSC analyses were performed to observe the effect of PSBH on the melting temperatures and heat of fusion of both PP and LLDPE. To prepare for testing, a 5–10 mg sample was cut and then sealed inside of an aluminum hermetic pan. An empty reference pan was also required for testing. A DSC-TA instrument Q200 (TA Instruments, New Castle, DE, USA) was used under a nitrogen environment (40 mL/min flowrate) for each 5–10 mg sample. The samples were tested from 25 to 150 °C (LLDPE/PSBH) and from 25 to 190 °C (PP/PSBH) with a 10 °C/min ramp rate. The calculated melting temperature was taken as temperature where the maximum of the endothermic peak occurred [17].

2.2.9. Thermo Gravimetric Analyses (TGA)

TGA testing was performed using a TGA-TA instrument Q50 (TA Instruments, New Castle, DE) to assess the thermal stability of the polymer/PSBH composites. For all cases, a 5–10 mg piece of each sample was cut and used. The samples were ramped from 25 to 600 °C under a nitrogen environment (40 mL/min flowrate) using a 10 °C/min ramp rate. The thermal decomposition temperature is reported as the temperature at the onset of major material weight loss (decomposition) [17].
Pure PSBH-A and PSBH-B fillers were also tested to observe their thermal stability. About 10 mg of material were tested for each case. The samples were ramped from 25 to 700 °C under a nitrogen environment (40 mL/min flowrate) using a 20 °C/min ramp rate.

2.2.10. Scanning Electron Microscopy (SEM)

The fracture surfaces of various tensile samples were observed using scanning electron microscopy. For each condition, a thin sliver of the fracture surface was cut from the broken dog-bone sample and affixed to metal mounting stubs using dual-sided conductive tape. The samples were then coated with a thin layer of conducting silver using a Denton Vacuum (Cherry Hill, NJ, USA) Model Desk 11 Sputter Coater to enable SEM imaging. Examinations of the samples using different magnifications showed the morphology and roughness of the fracture surfaces, as well as the relative particle sizes and compatibility of the PSBH in the polymers. Only lot A composites were imaged to save time and expense, as lot A and lot B materials were indistinguishable from a visual standpoint. Composites with 20 wt.% and 50 wt.% filler were imaged to study the effect of filler amount on the fracture surfaces of the materials.
SEM images of pure GSBH powder were also taken to determine the particle size of the milled filler. To prepare these samples, the same metal stubs and conductive tape were used. The GSBH powder was poured onto the tape in small amounts, with excess powder being blown off using a compressed air duster (canned air). The sputter coater was again used to coat the powder with conducting silver.

2.2.11. Fourier Transform Infrared Spectroscopy (FT-IR)

FT-IR (Perkin Elmer Waltham, MA, USA) with an attenuated total reflectance (ATR) detector was used to analyze the chemical functional groups present on the surface of PSBH. The wavelength range was set from 400 to 4000 cm−1 with 64 scans and a 4 cm−1 resolution. Before testing PSBH samples, the detector and the sample loading station were cleaned with acetone. After cleaning, the background was scanned in the first step to determine the reference. Then, PSBH samples were loaded onto the loading station, and the detector was brought close to the sample and gently pressed onto the PSBH samples. After scanning, the sample spectra were collected, and the background signals were subtracted from the sample spectra.

3. Results and Discussion

3.1. Particle Sizes of As-Received PSBH

Results of the sieving for as-received PSBH, lot A, and lot B revealed that a large portion of the particles were greater than 710 μm in size (48.42% for lot A and 43.68% for lot B). Only 0.83% of lot A and 1.30% of lot B particles were smaller than 90 µm in size. In general, the particle sizes of both lots A and B were similar, but lot B had a smaller average particle size than lot A. Since the same feedstock was used, the smaller particle size in lot B can be explained by the higher operating temperature causing more material disintegration during pyrolysis.

3.2. Particle Sizes of GSBH

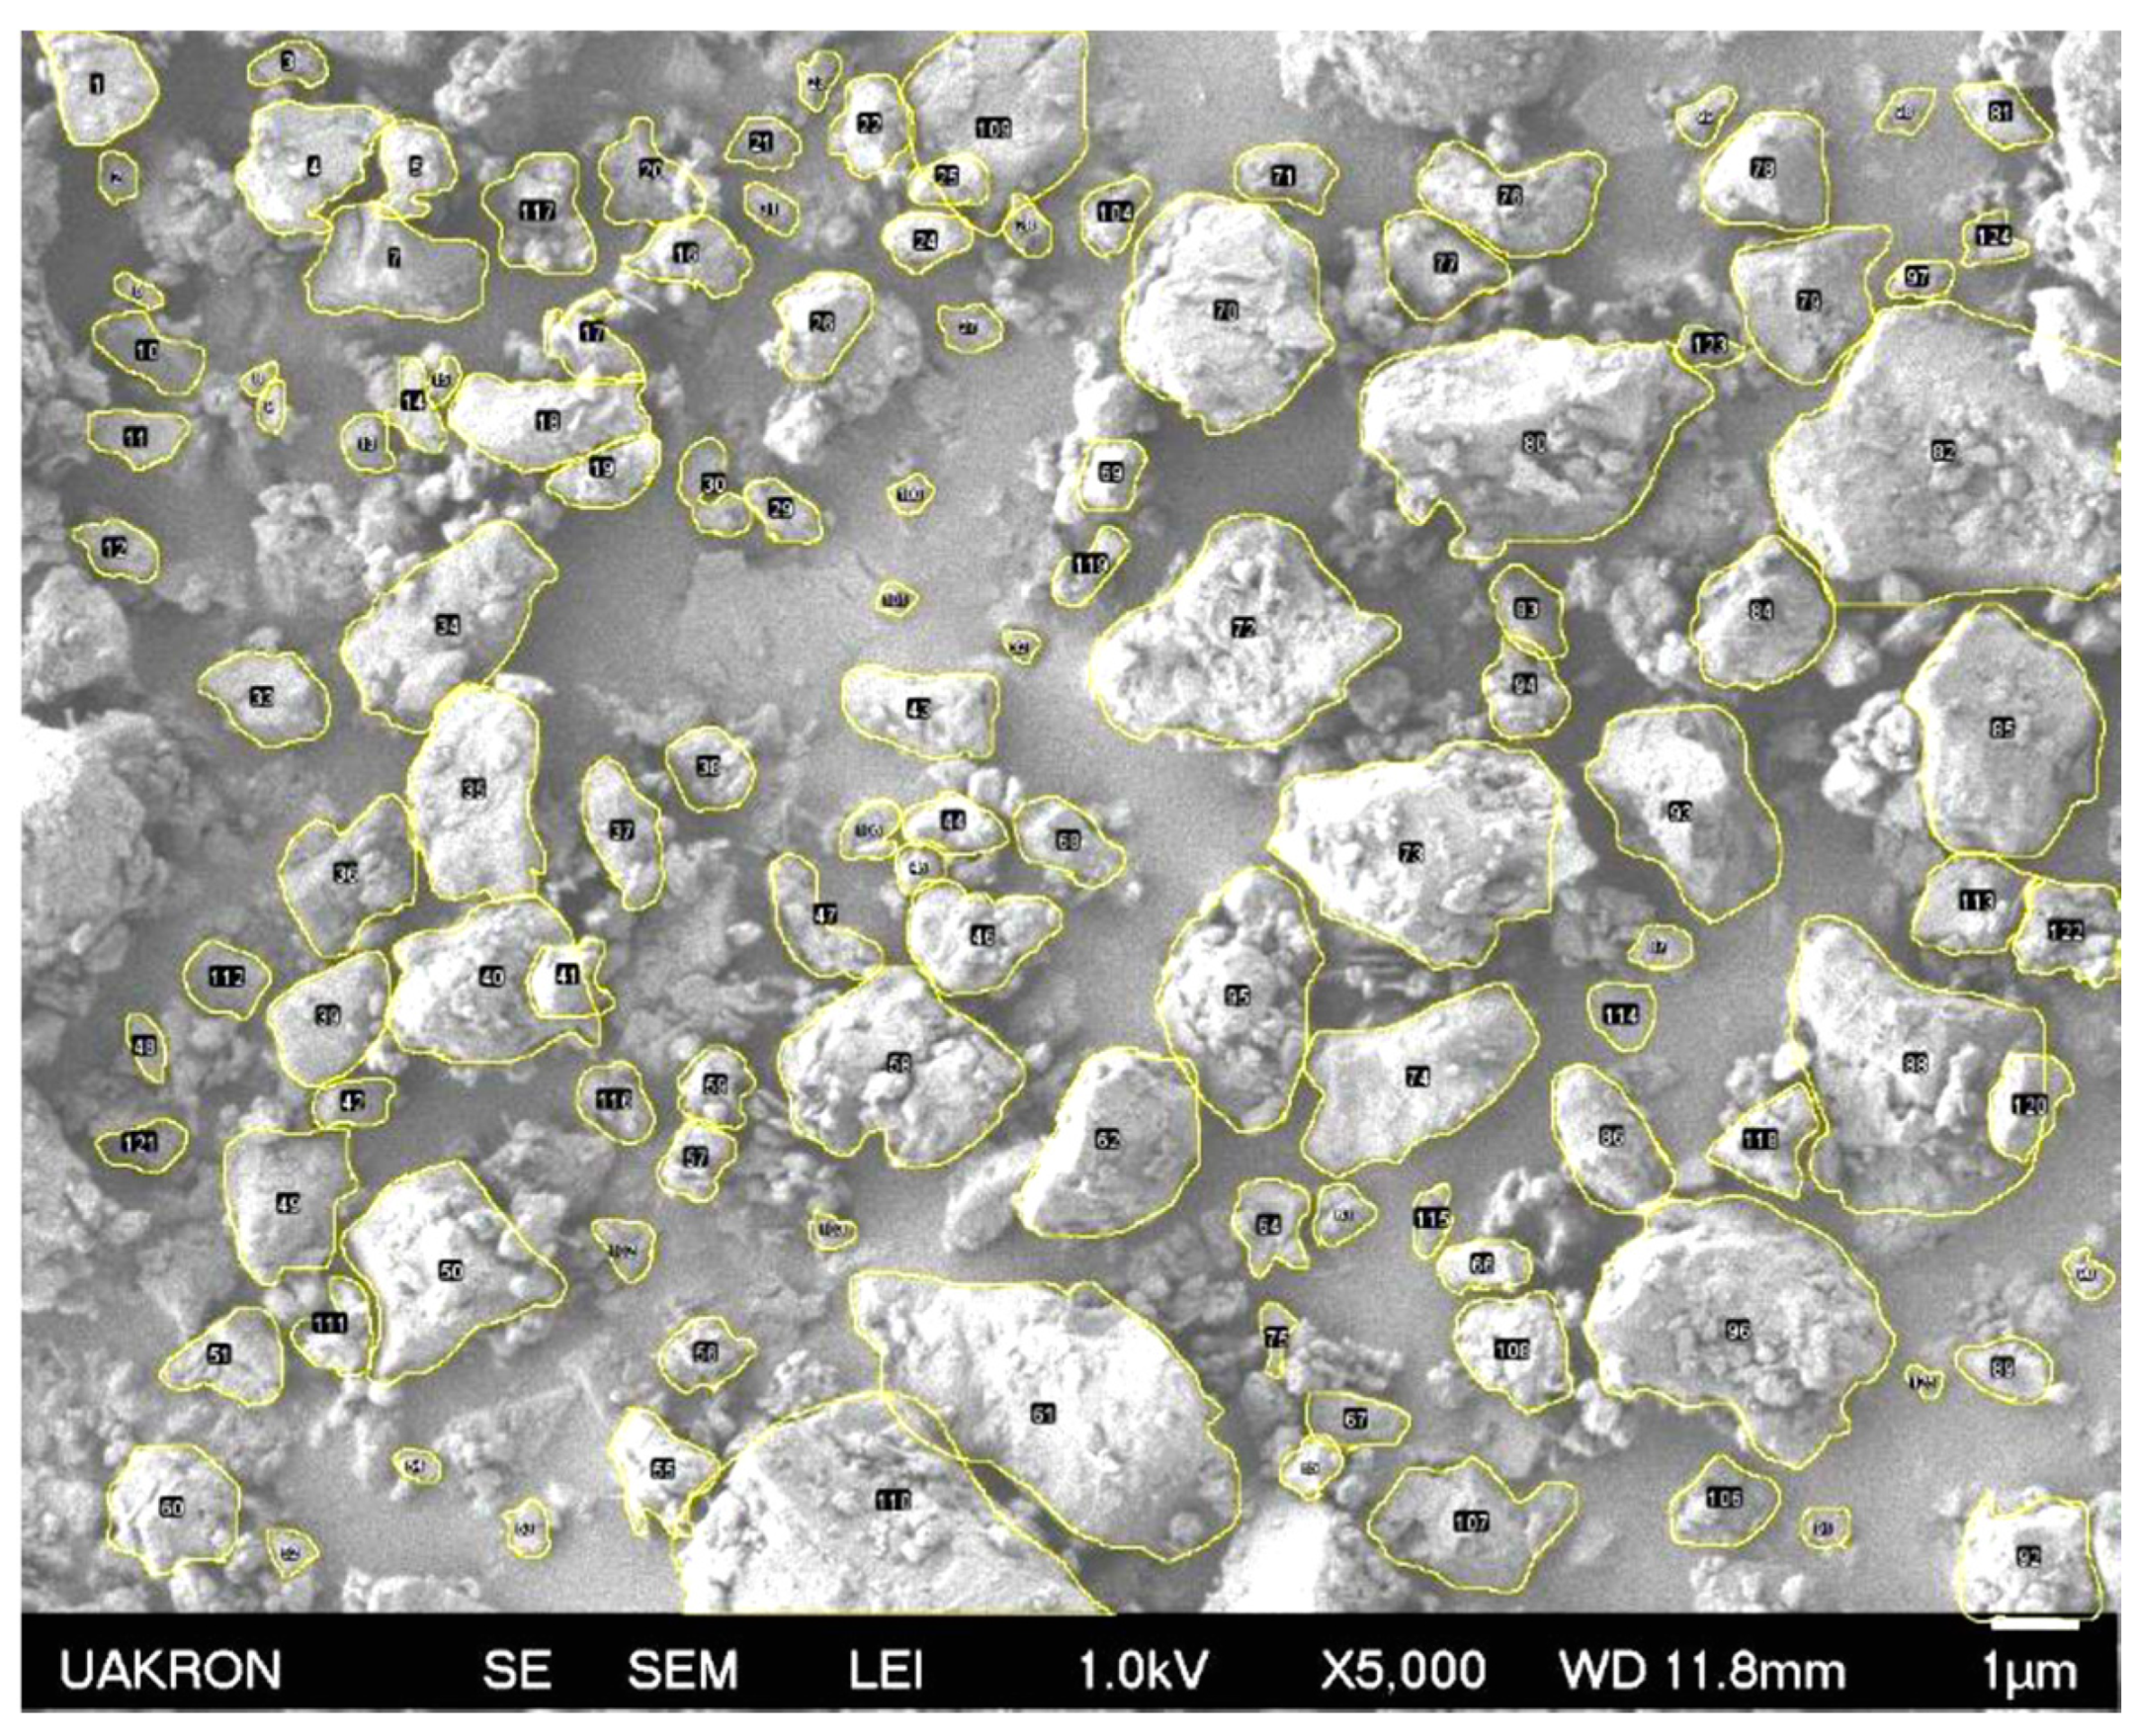
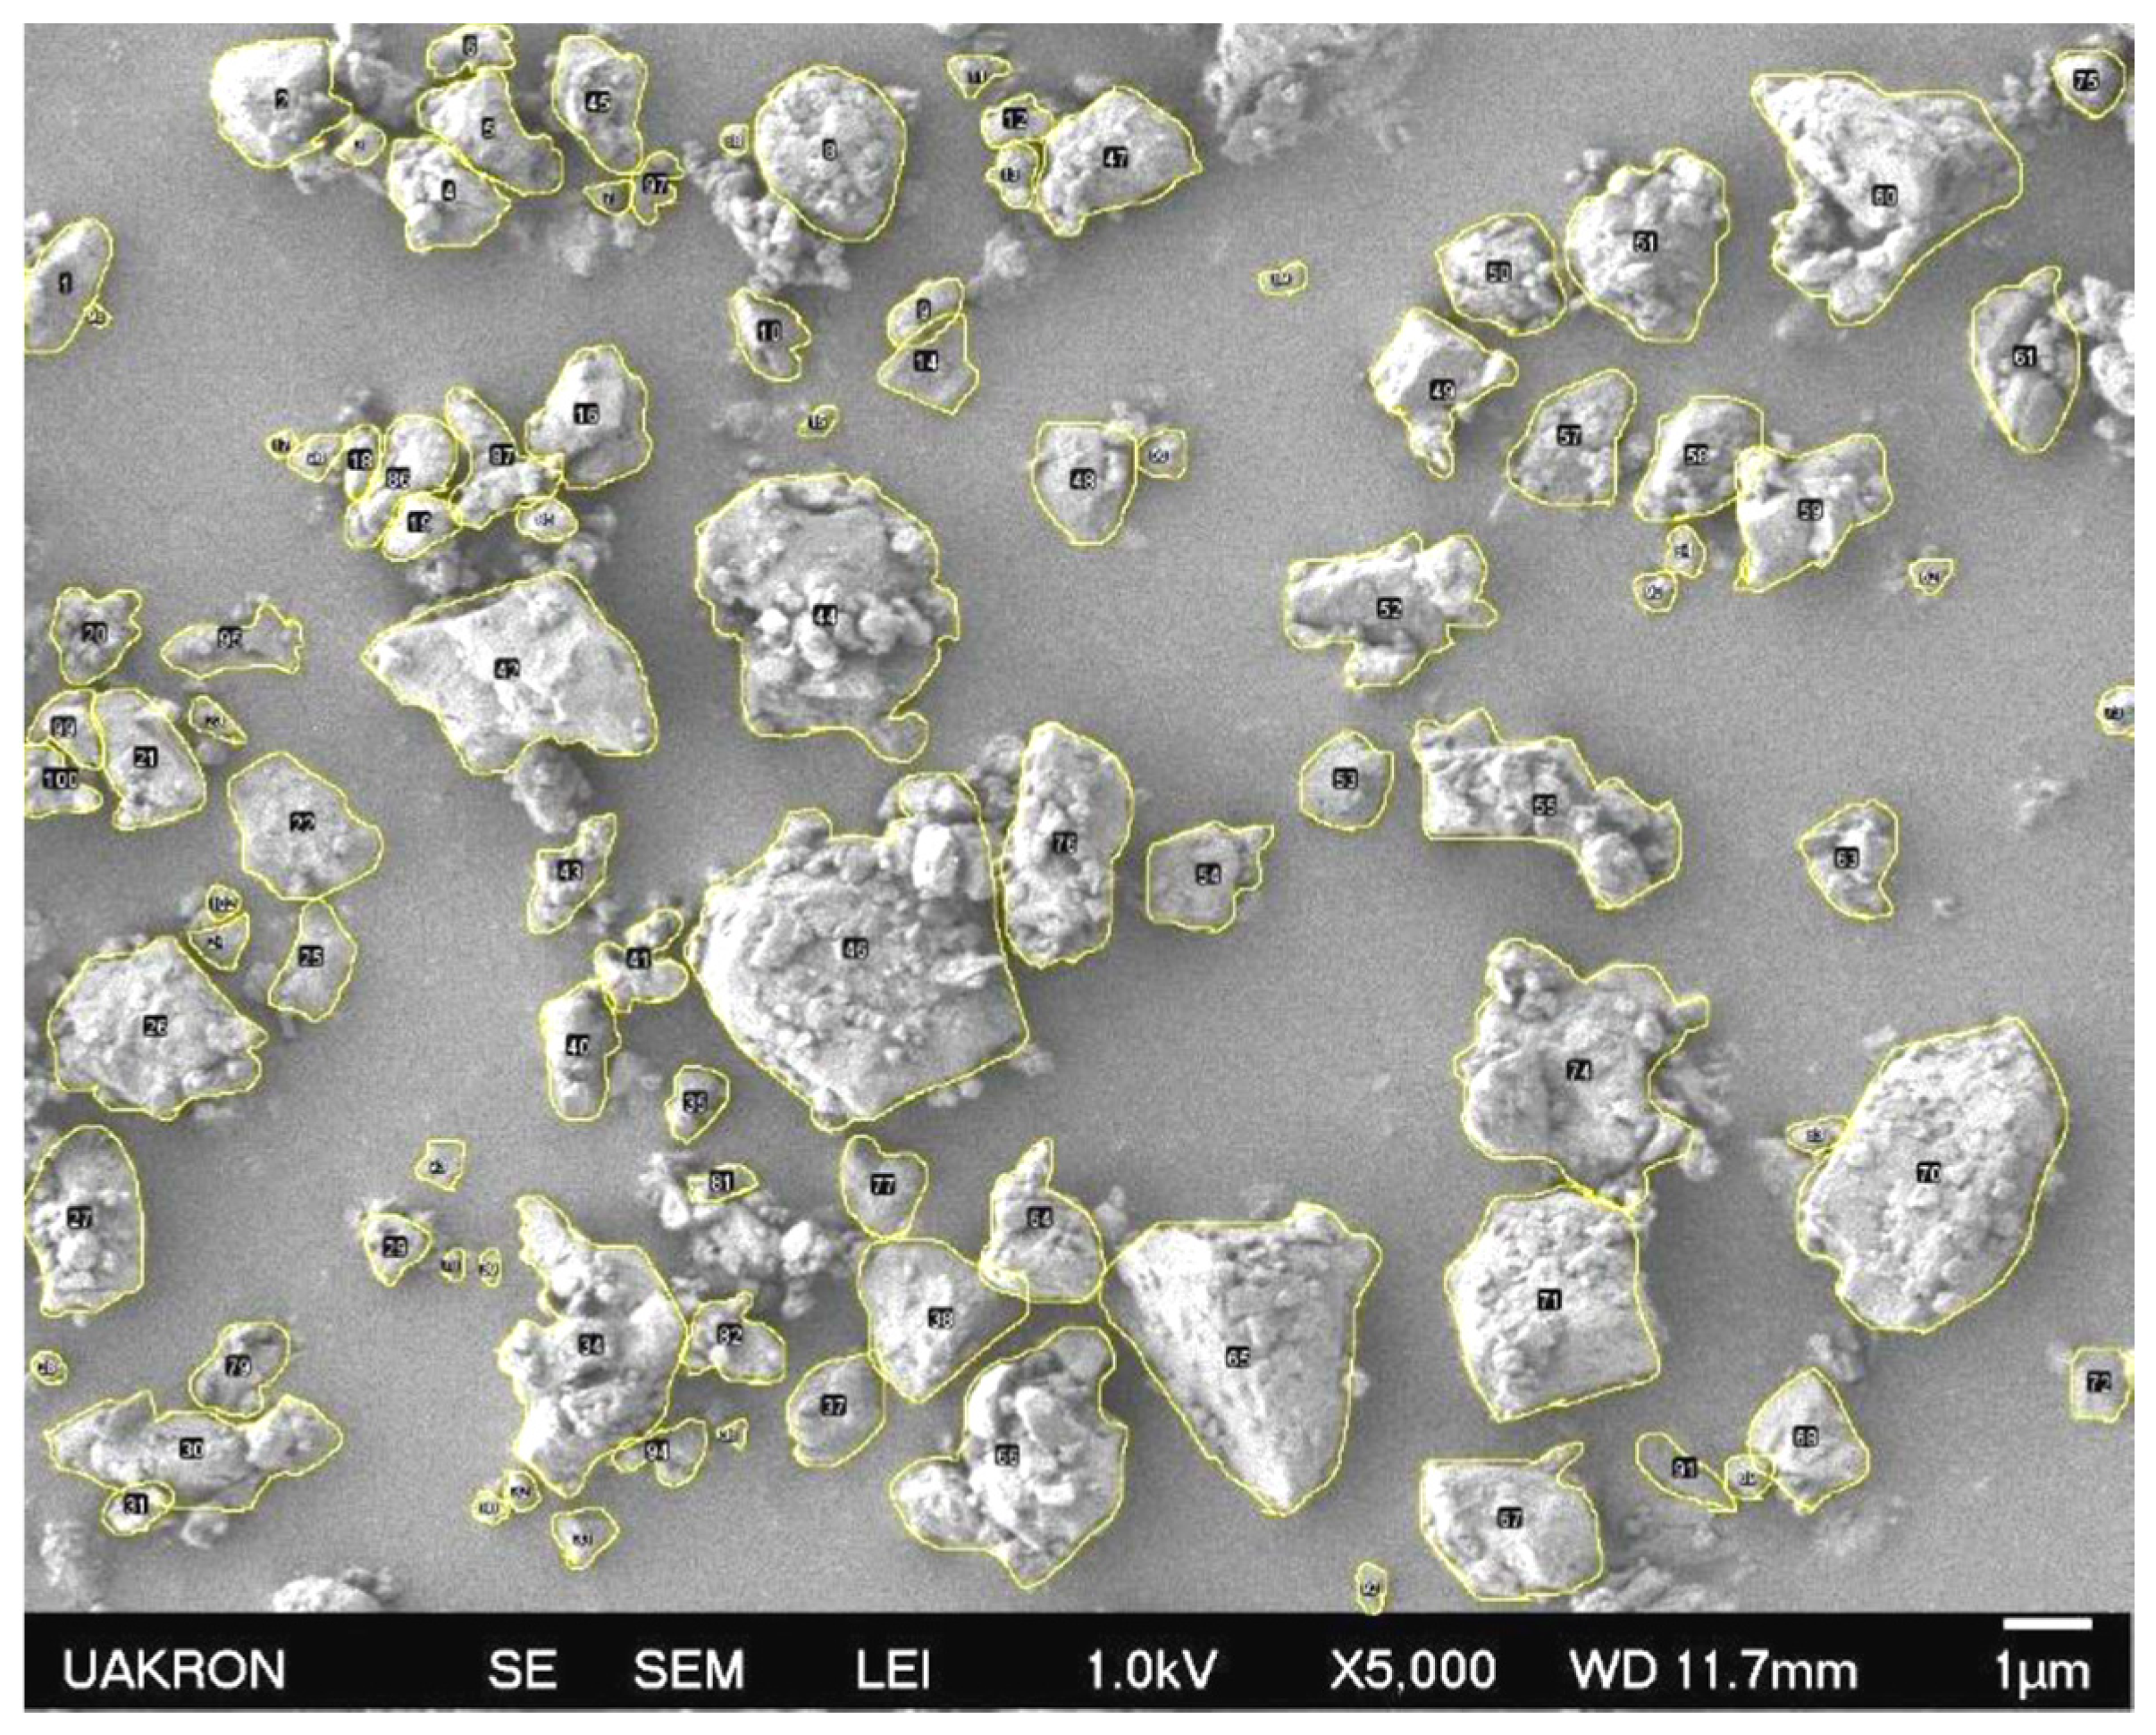
Figure 4 and Figure 5 show the SEM images used to determine the particle size of GSBH-A and GSBH-B, respectively. The particles that were used for that purpose are outlined in yellow and numbered.
The average projected area diameter for GSBH-A was 1.165 μm, with an average maximum ferret diameter of 1.525 μm and an average minimum ferret diameter of 1.025 μm. The average projected area diameter for GSBH-B was 1.140 μm, with an average maximum ferret diameter of 1.498 μm and an average minimum ferret diameter of 1.035 μm.
The particle sizes of GSBH-A and GSBH-B remained similar after the jar milling process. The variance in particle sizes could be attributed to the as-received particle sizes and the innate variance of the milling process. Increasing the milling duration would lead to smaller average particle sizes but would not necessarily decrease variance in particle size.

3.3. Mechanical Properties

3.3.1. Maximum Tensile Stress

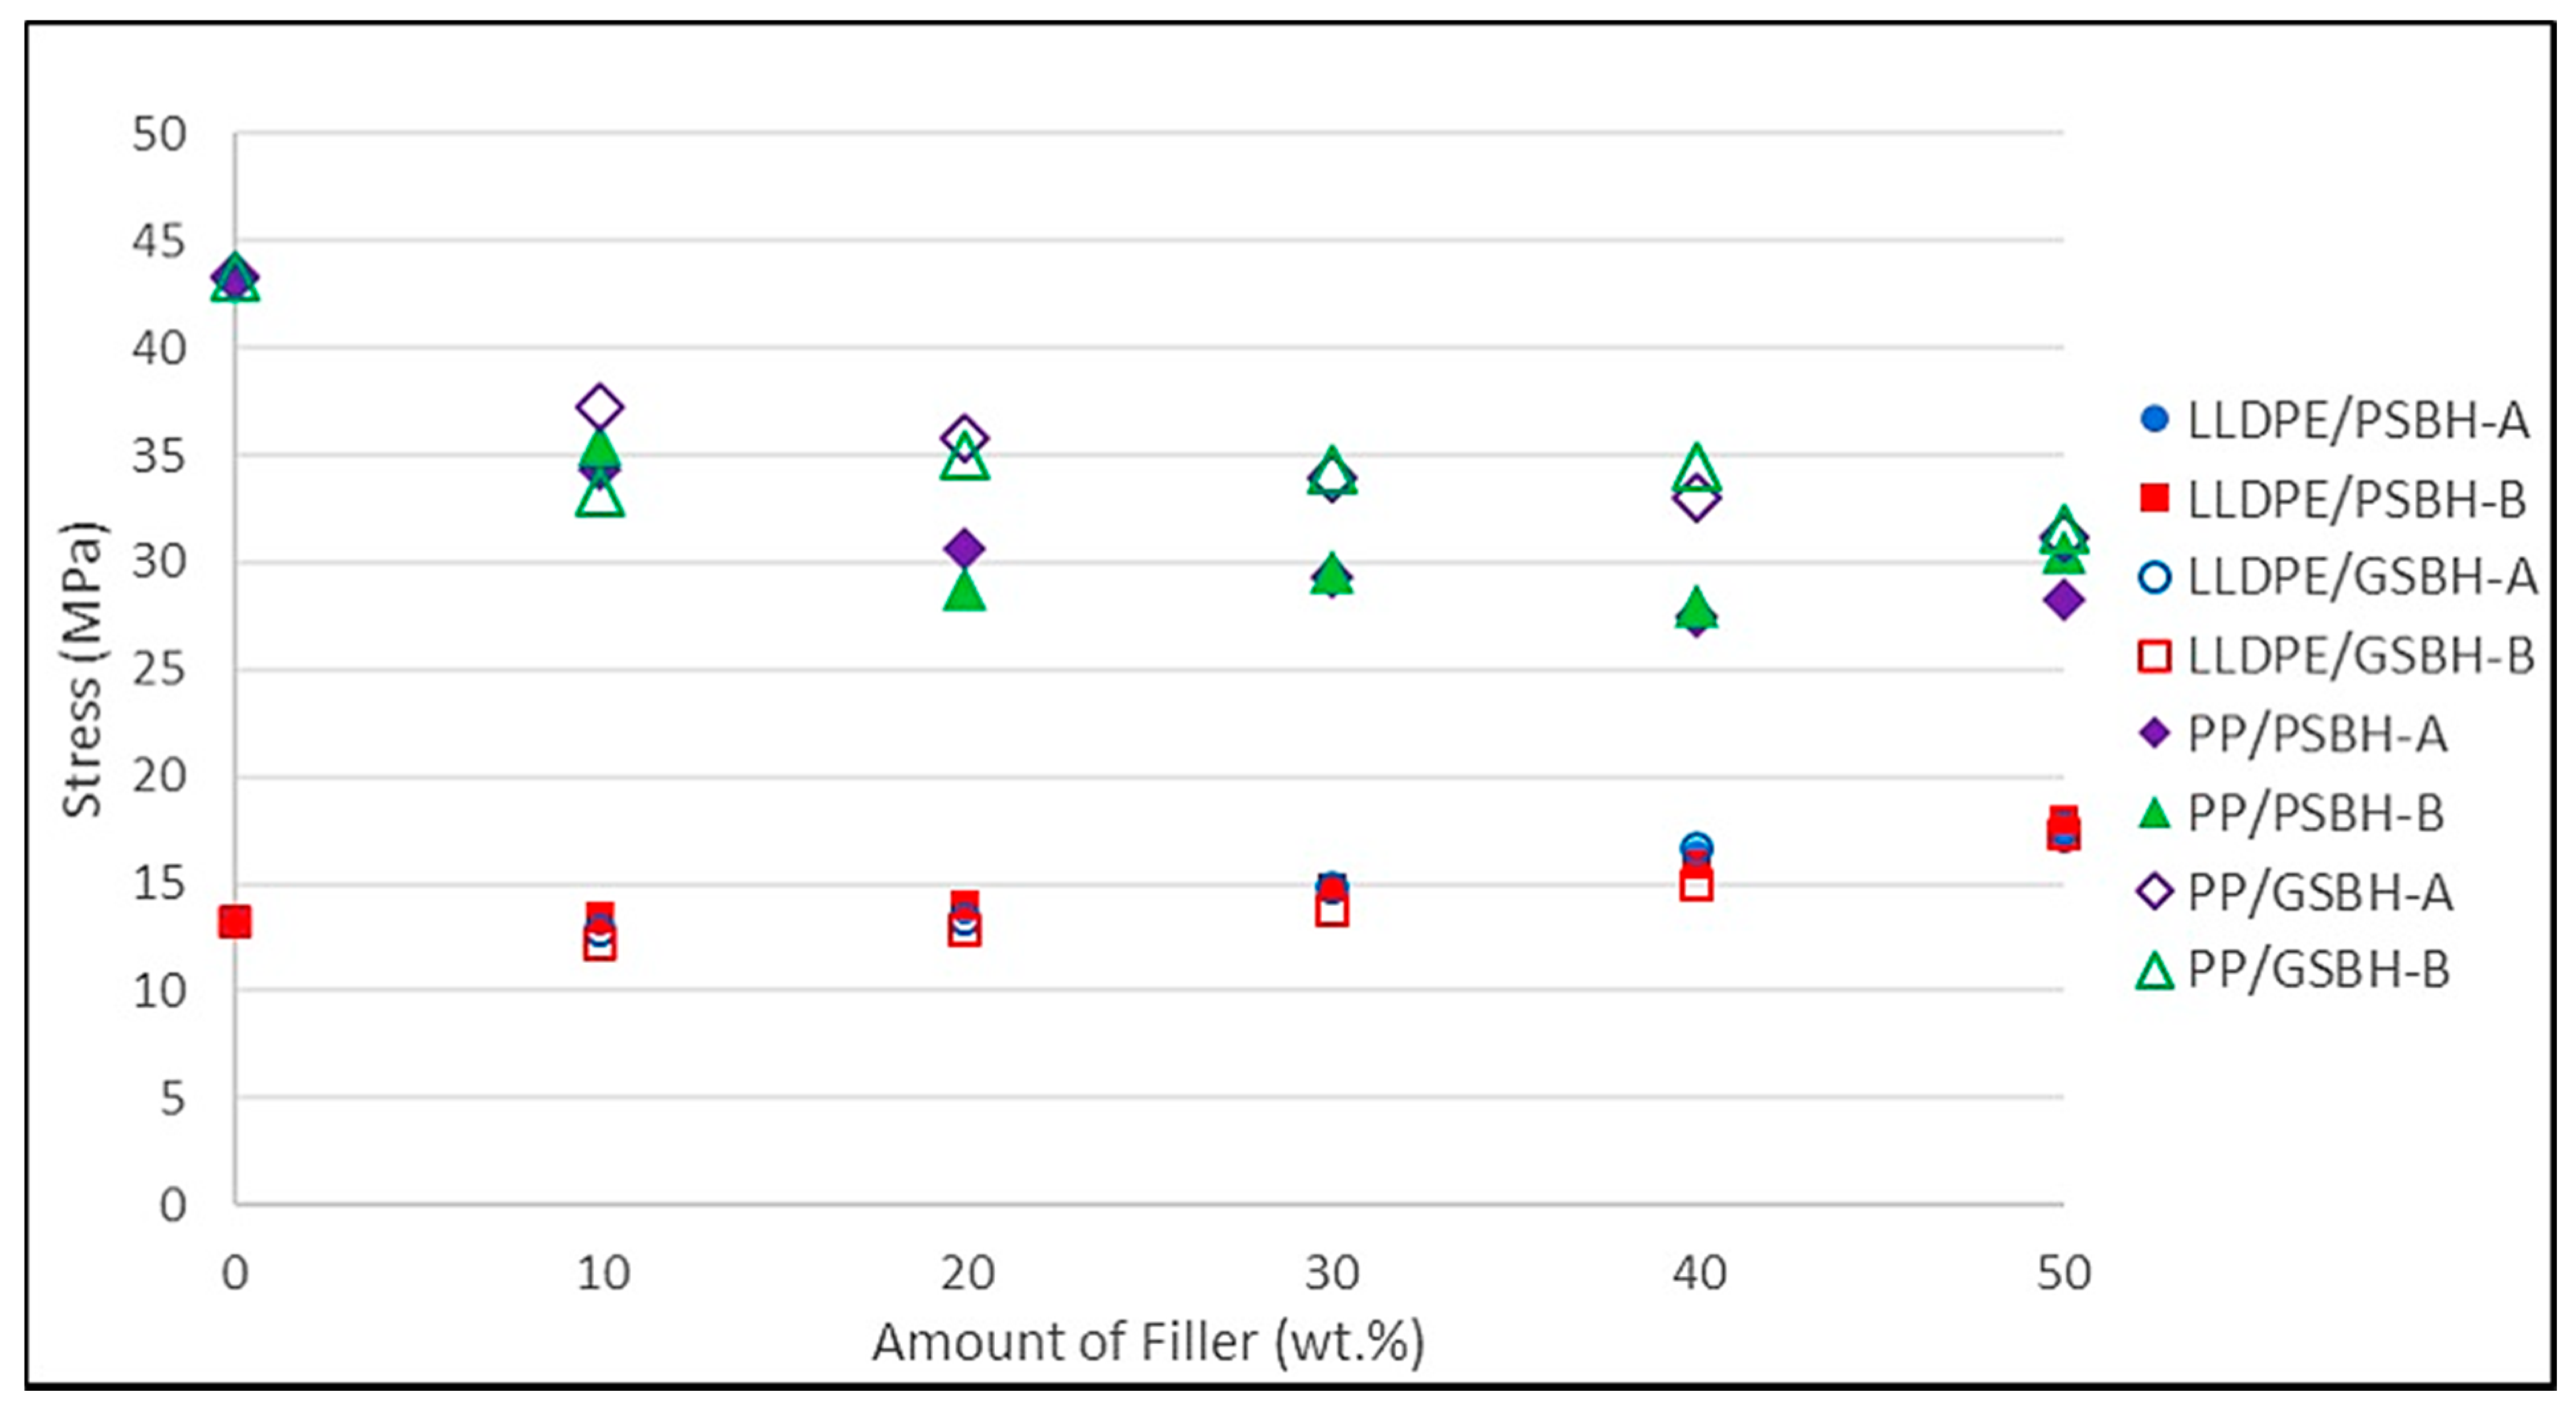
Figure 6 shows the maximum tensile stress results for all composites with all filler weight percentages of as-received and ground PSBH lots A and B. In general, increasing amounts of the PSBH filler led to increases in the maximum tensile stress for LLDPE/PSBH compounds and decreases in the maximum tensile stress for PP/PSBH compounds.
The effect of jar milling was negligible in the case of LLDPE/PSBH compounds. For PP/PSBH compounds, the ground PSBH filler performed slightly better than the as-received counterparts in general.
In the case of LLDPE/PSBH composites, the data contradicted what might have been expected. One may have expected that the smaller particle sizes of the GSBH filler would increase surface area contact between the polymer and filler. The increased surface area was expected to enhance the positive effect of the filler on the overall mechanical strength of the composite. There could be a few reasons that no noticeable difference was observed. First, the particle size of the as-received PSBH filler could have been reduced during mixing. There is some evidence of this found in the SEM images. Second, PSBH are a porous material and there is evidence that the molten LLDPE material penetrated its pores. This means that there was more polymer-to-filler contact than simply the outer surface of the PSBH particles. When the PSBH material was milled into GSBH, the porous structure of the material was largely destroyed, which limited contact to only the outer surfaces of each particle. In the case of PP, the filler seemed less integrated in the polymer matrix. The PP material did not appear to penetrate the pores of the PSBH material and LLDPE; in turn, it relied on surface contact to greater effect.
There was no discernable difference between lots A and B for this test. It seems that the pyrolysis conditions and the resulting materials were too similar to have appreciably different mechanical properties. Recall that lot A was pyrolyzed at 450 °C with 77% carbon content, whereas lot B was pyrolyzed at 500 °C with 85% carbon content.
The average maximum stress value of neat LLDPE was found to be 13.183 MPa. The values for the different conditions at 50% filler amount were: LLDPE/PSBH-A, 17.079 MPa (29.6% increase); LLDPE/PSBH-B, 17.995 MPa (36.5% increase); LLDPE/GSBH-A, 17.558 MPa (33.2% increase); and LLDPE/GSBH-B, 17.366 MPa (31.7% increase). The standard deviation values varied between 0.164 and 1.055 MPa.
The average maximum stress value of neat PP was found to be 43.271 MPa. The values for the different conditions at 50% filler amount were: PP/PSBH-A, 28.228 MPa (34.8% decrease); PP/PSBH-B, 30.513 MPa (29.5% decrease); PP/GSBH-A, 31.116 MPa (28.1% decrease); and PP/GSBH-B, 31.581 MPa (27.0% decrease). The standard deviation values varied between 0.507 and 2.010 MPa.

3.3.2. Strain at Maximum Tensile Stress

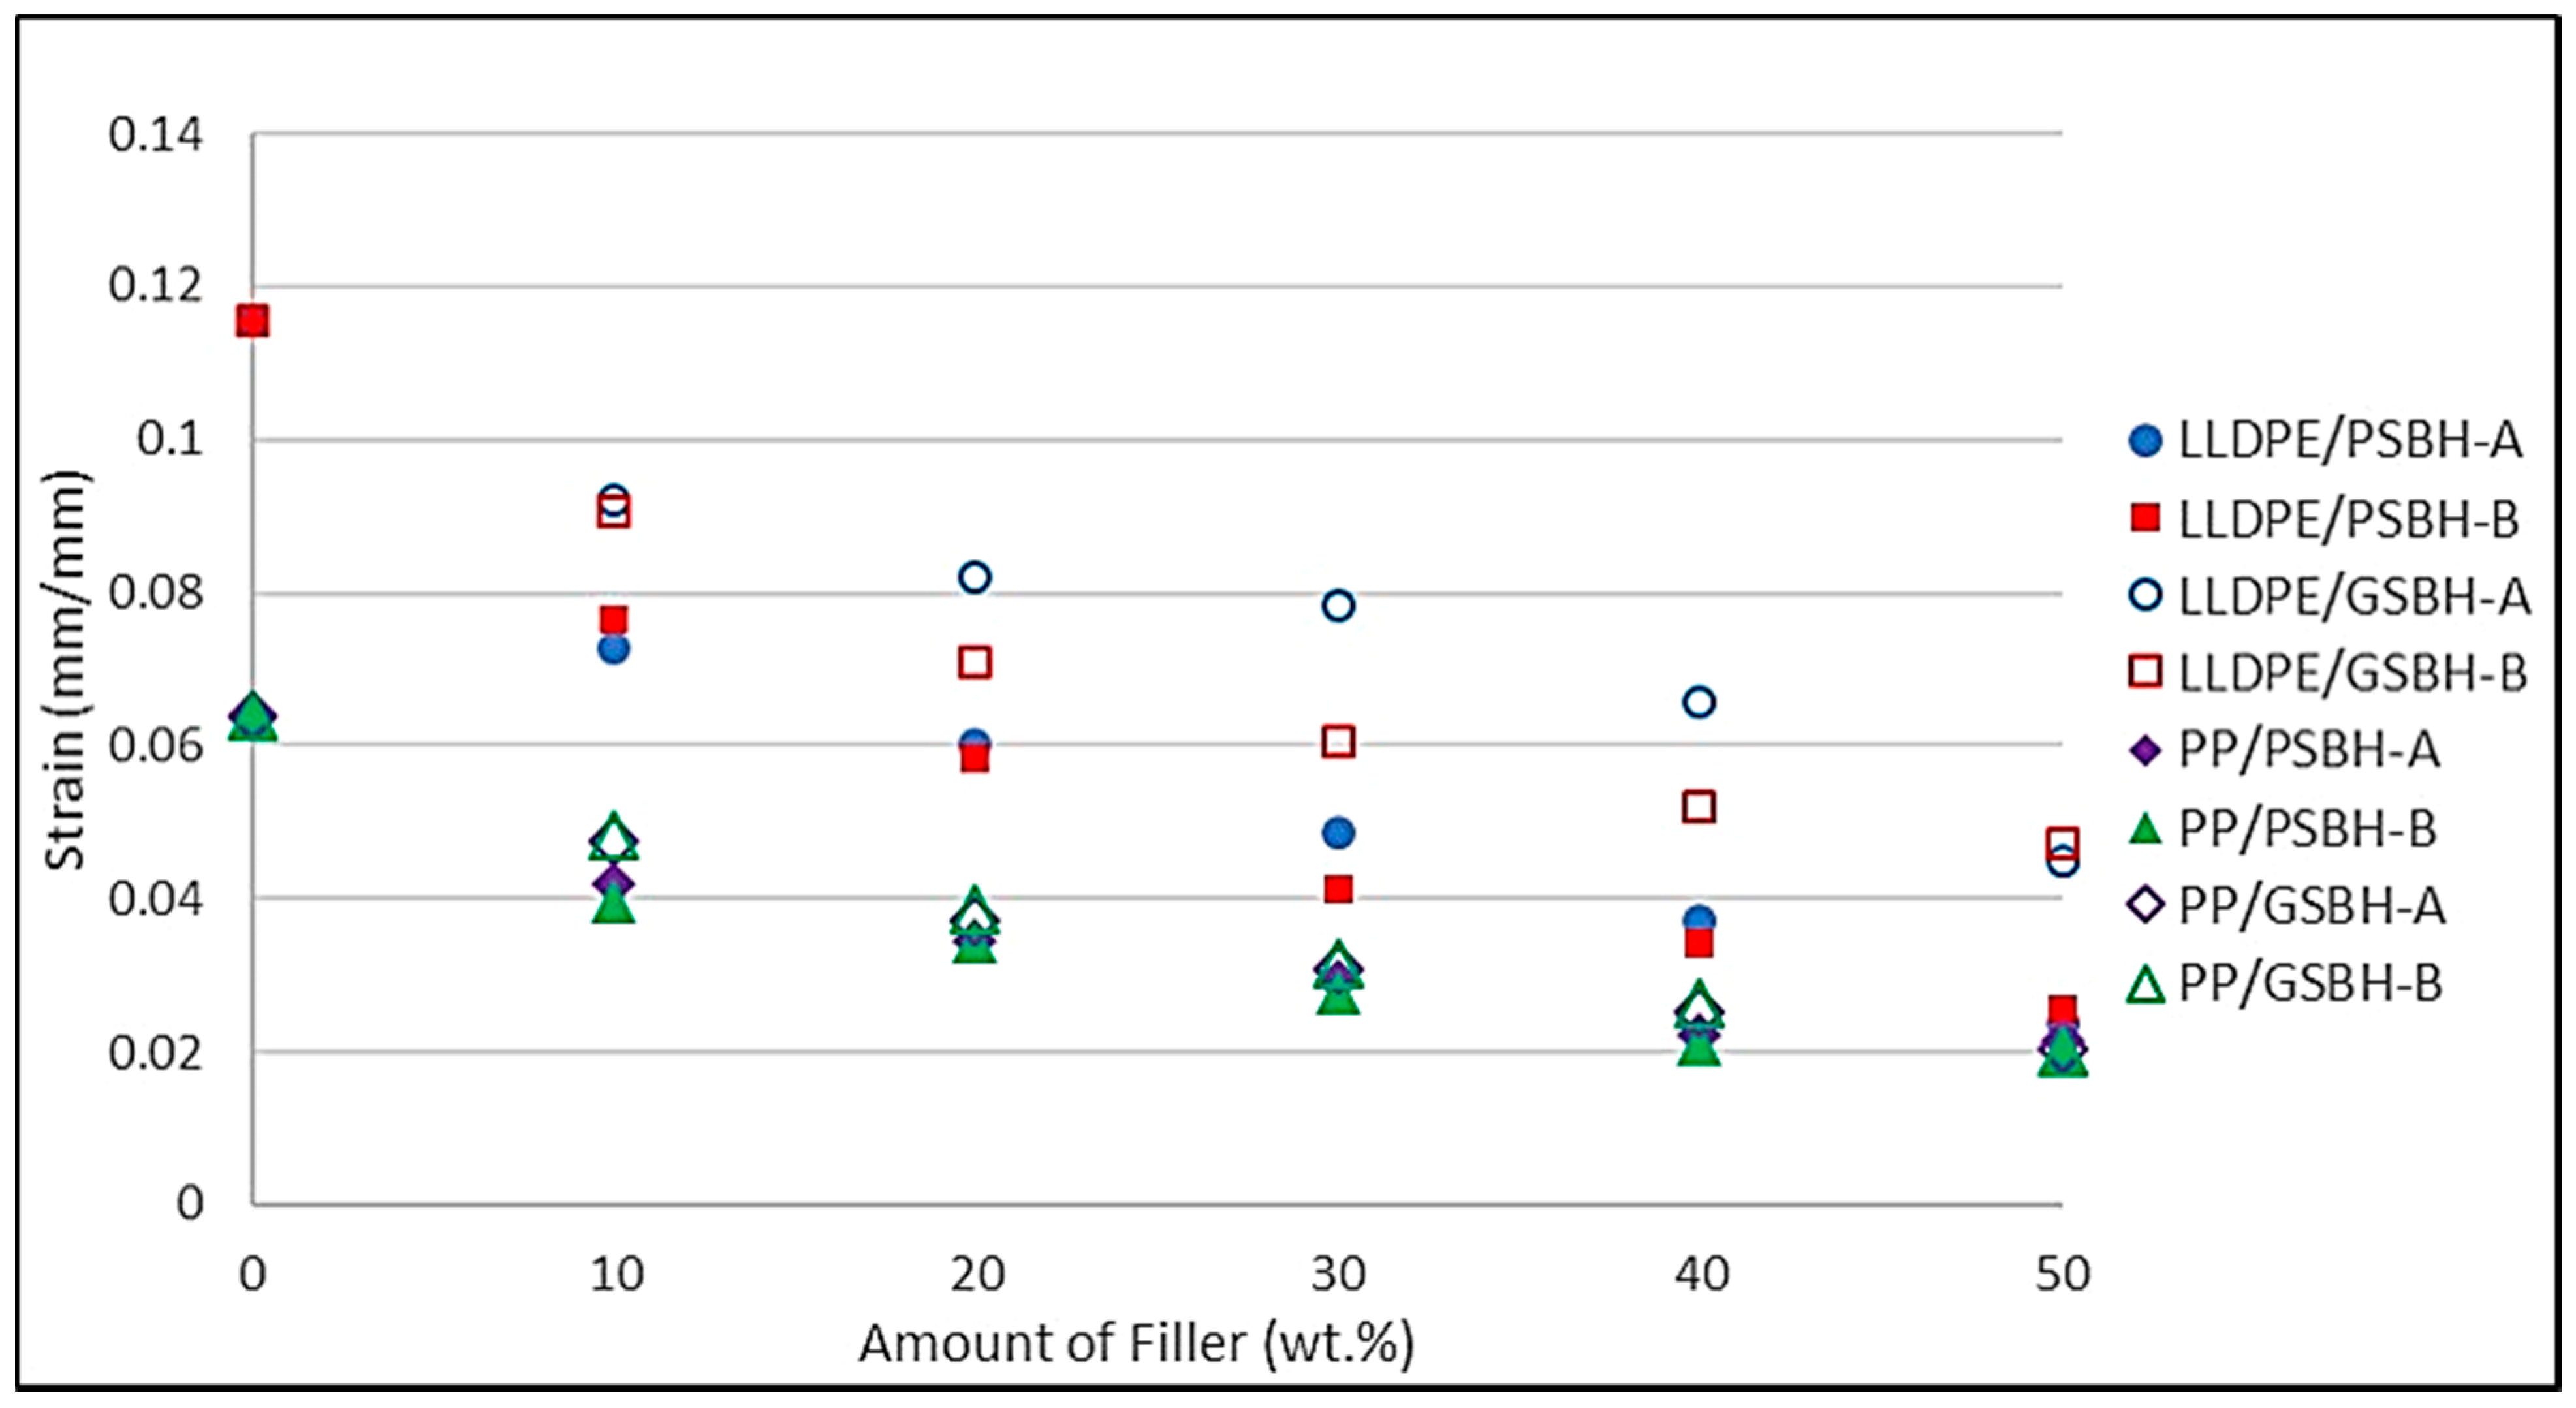
Figure 7 shows the strain at maximum stress results for all composites with all filler weight percentages of as-received and ground PSBH lots A and B. For all compounds, the increasing amounts of the PSBH filler led to decreases in the strain value at maximum stress. This highlights that the PSBH filler was less deformable than either PP or LLDPE.
The effect of jar milling was noticeable for the LLDPE/PSBH compounds but small for the PP/PSBH compounds. At all weight percentages, the LLDPE/GSBH composites had higher strain values than the as-received counterparts. For PP/PSBH compounds, the GSBH filler also had higher strain values than the as-received PSBH filler, but the differences in values were much smaller.
In the case of LLDPE/GSBH composites, there was notable separation in strain values between lots A and B with the 20 wt.%, 30 wt.%, and 40 wt.% filler amounts. With the 10 wt.% and 50 wt.% values being almost identical, it is difficult to assume that any purposeful pattern was truly evident. All other composites presented very little variation between lot A and lot B materials.
The average strain at maximum stress value of neat LLDPE was found to be 0.116 mm/mm. The values for the different conditions at 50% filler amount were: LLDPE/PSBH-A, 0.024 mm/mm (79.4% decrease); LLDPE/PSBH-B, 0.026 mm/mm (78.0% decrease); LLDPE/GSBH-A, 0.045 mm/mm (61.4% decrease); and LLDPE/GSBH-B, 0.047 mm/mm (59.4% decrease). The standard deviation values varied between 0.001 and 0.012 mm/mm.
The strain at maximum stress value of neat PP was found to be 0.064 mm/mm. The values for the different conditions at 50% filler amount were: PP/PSBH-A, 0.022 mm/mm (66.3% decrease); PP/PSBH-B, 0.020 mm/mm (69.2% decrease); PP/GSBH-A, 0.021 mm/mm (68.0% decrease); and PP/GSBH-B, 0.020 mm/mm (68.6% decrease). The standard deviation values varied between 0.000 and 0.004 mm/mm.

3.3.3. Modulus of Elasticity

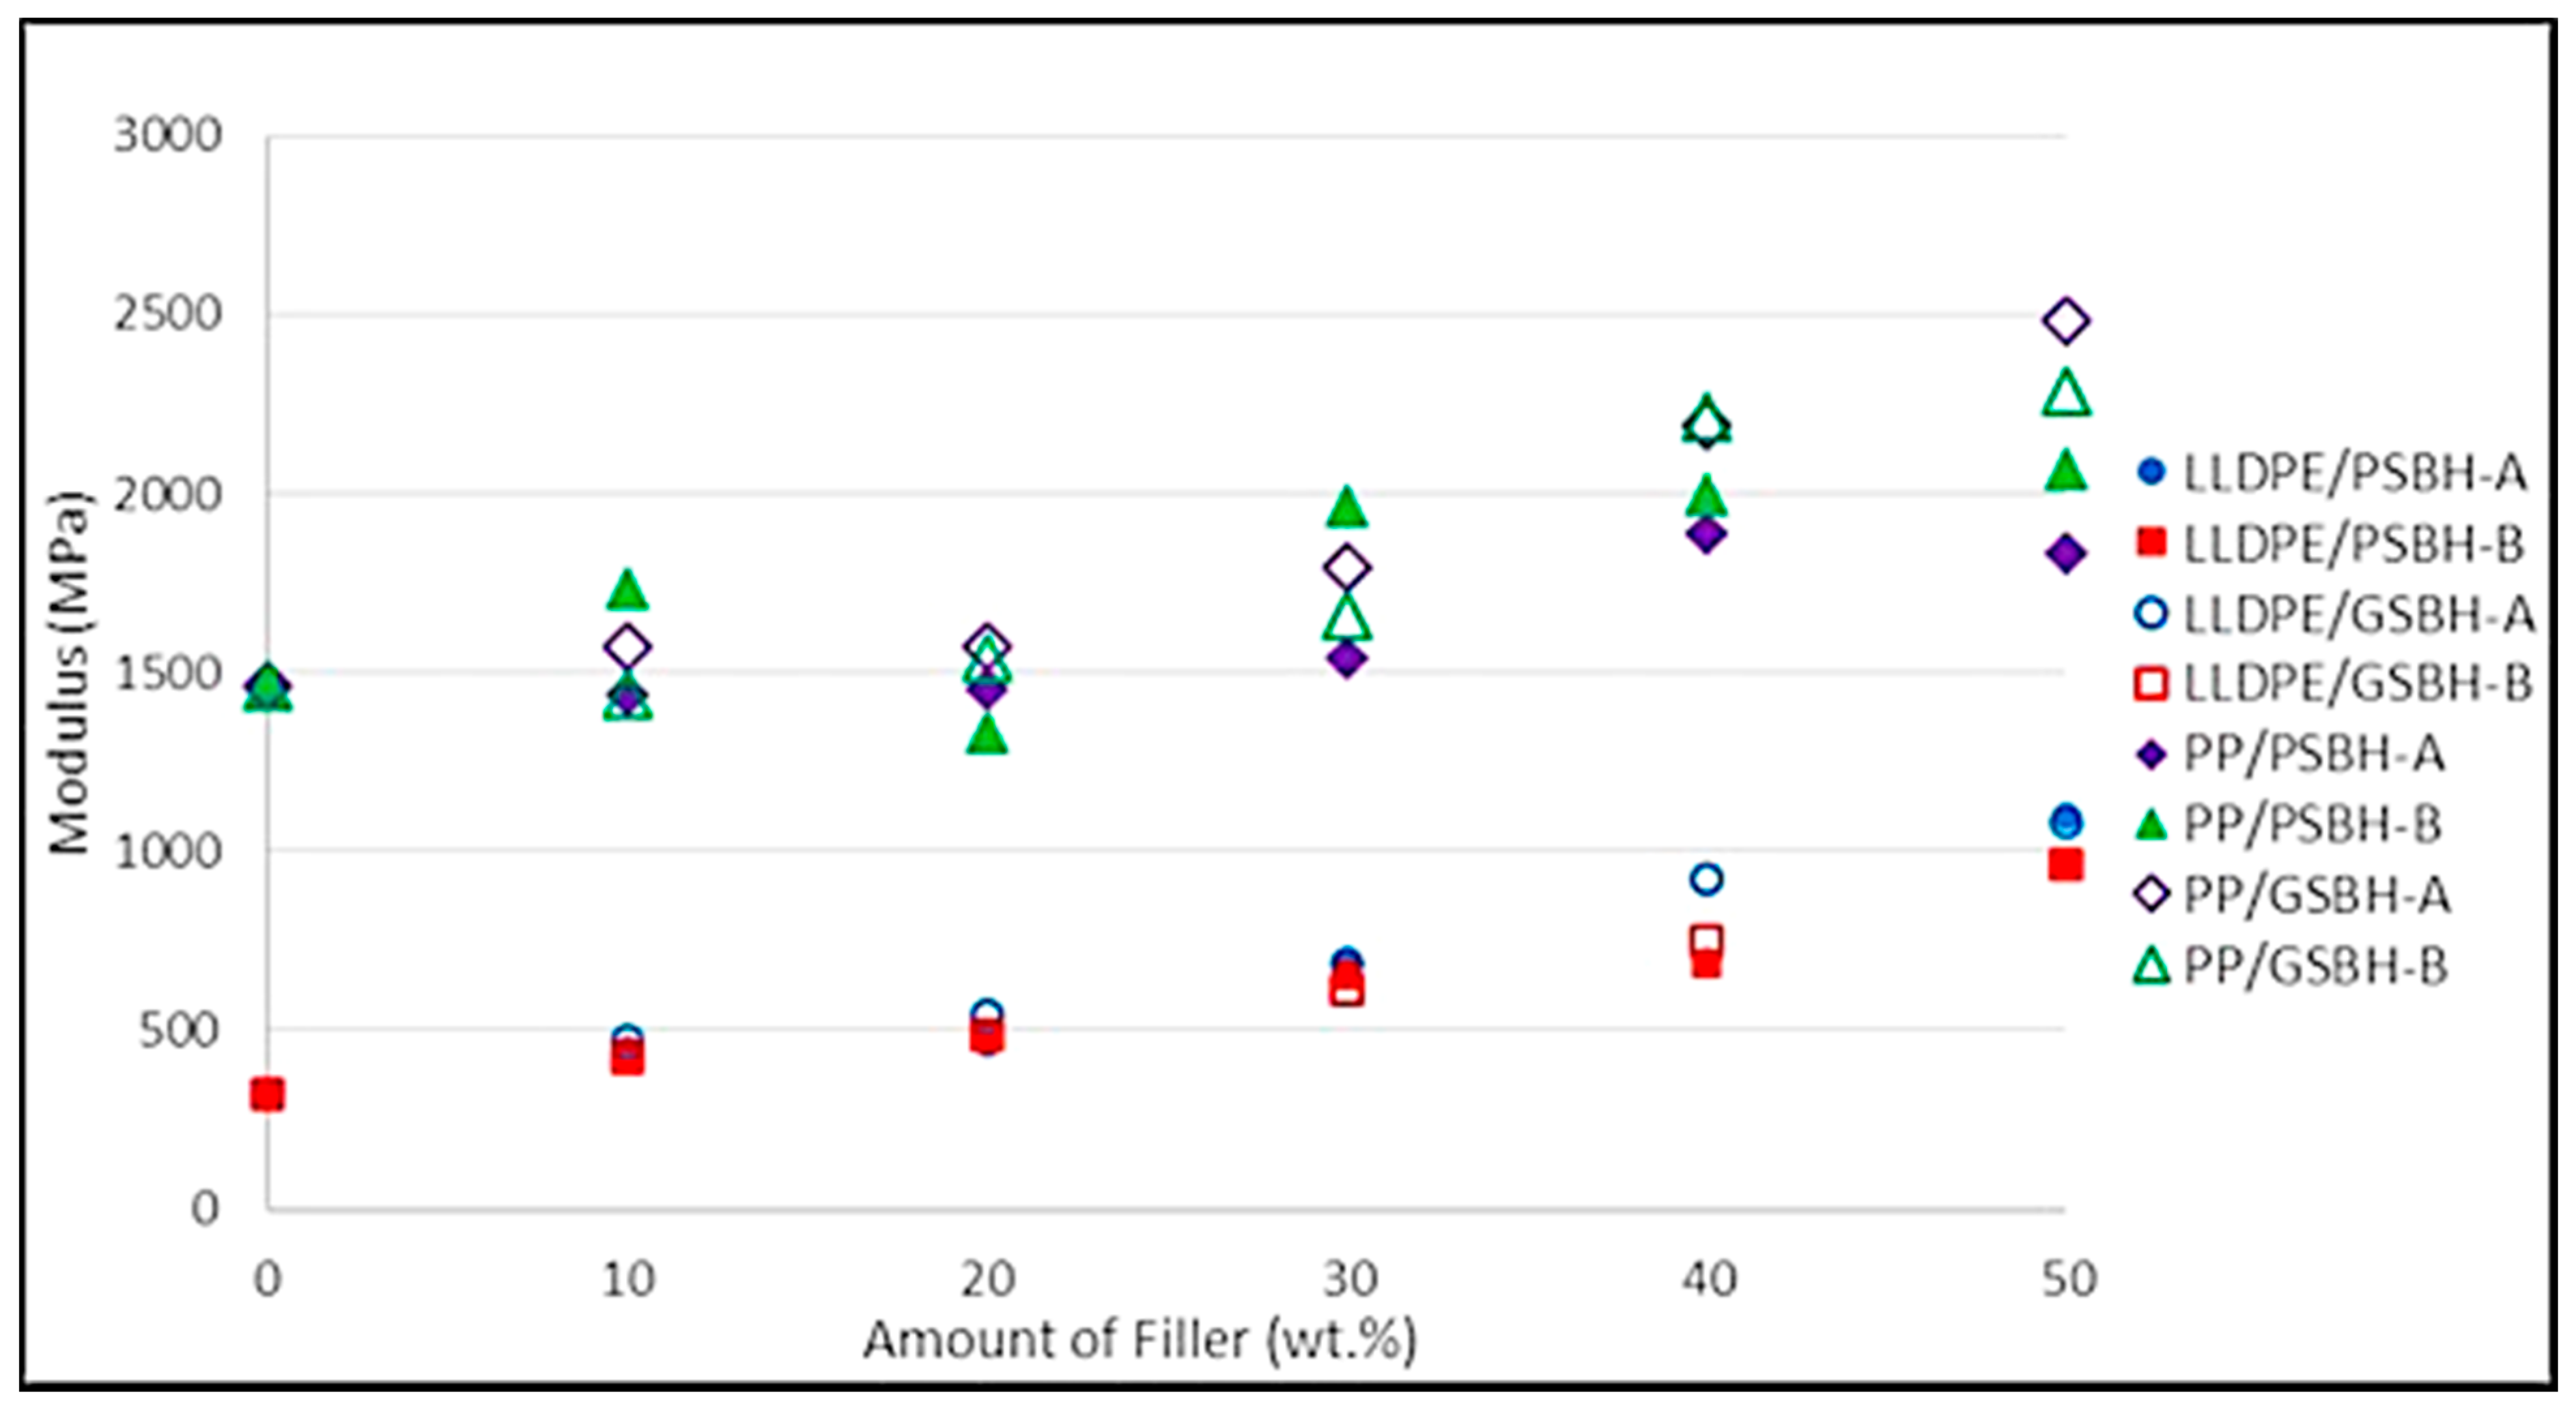
Figure 8 shows the modulus of elasticity results for all composites with all filler weight percentages of as-received and ground PSBH lots A and B. In general, an increase in the PSBH filler led to increases in the modulus for all compounds. The effects of jar milling and pyrolysis temperatures were slight or inconsistent in all cases.
The modulus of elasticity value of neat LLDPE was found to be 325.4 MPa. The values for the different conditions at 50% filler amount were: LLDPE/PSBH-A, 1100.8 MPa (238% increase); LLDPE/PSBH-B, 962.6 MPa (196% increase); LLDPE/GSBH-A, 1082.7 MPa (233% increase); and LLDPE/GSBH-B, 965.3 MPa (197% increase). The standard deviation values varied between 10.8 and 132.0 MPa.
The modulus of elasticity value of neat PP was found to be 1462.2 MPa. The values for the different conditions at 50% filler amount were: PP/PSBH-A, 1837.3 MPa (25.7% increase); PP/PSBH-B, 2068.4 MPa (41.5% increase); PP/GSBH-A, 2482.1 MPa (69.8% increase); and PP/GSBH-B, 2286.8 MPa (56.4% increase). The standard deviation values varied between 48.0 and 438.2 MPa.

3.4. Failure Pattern

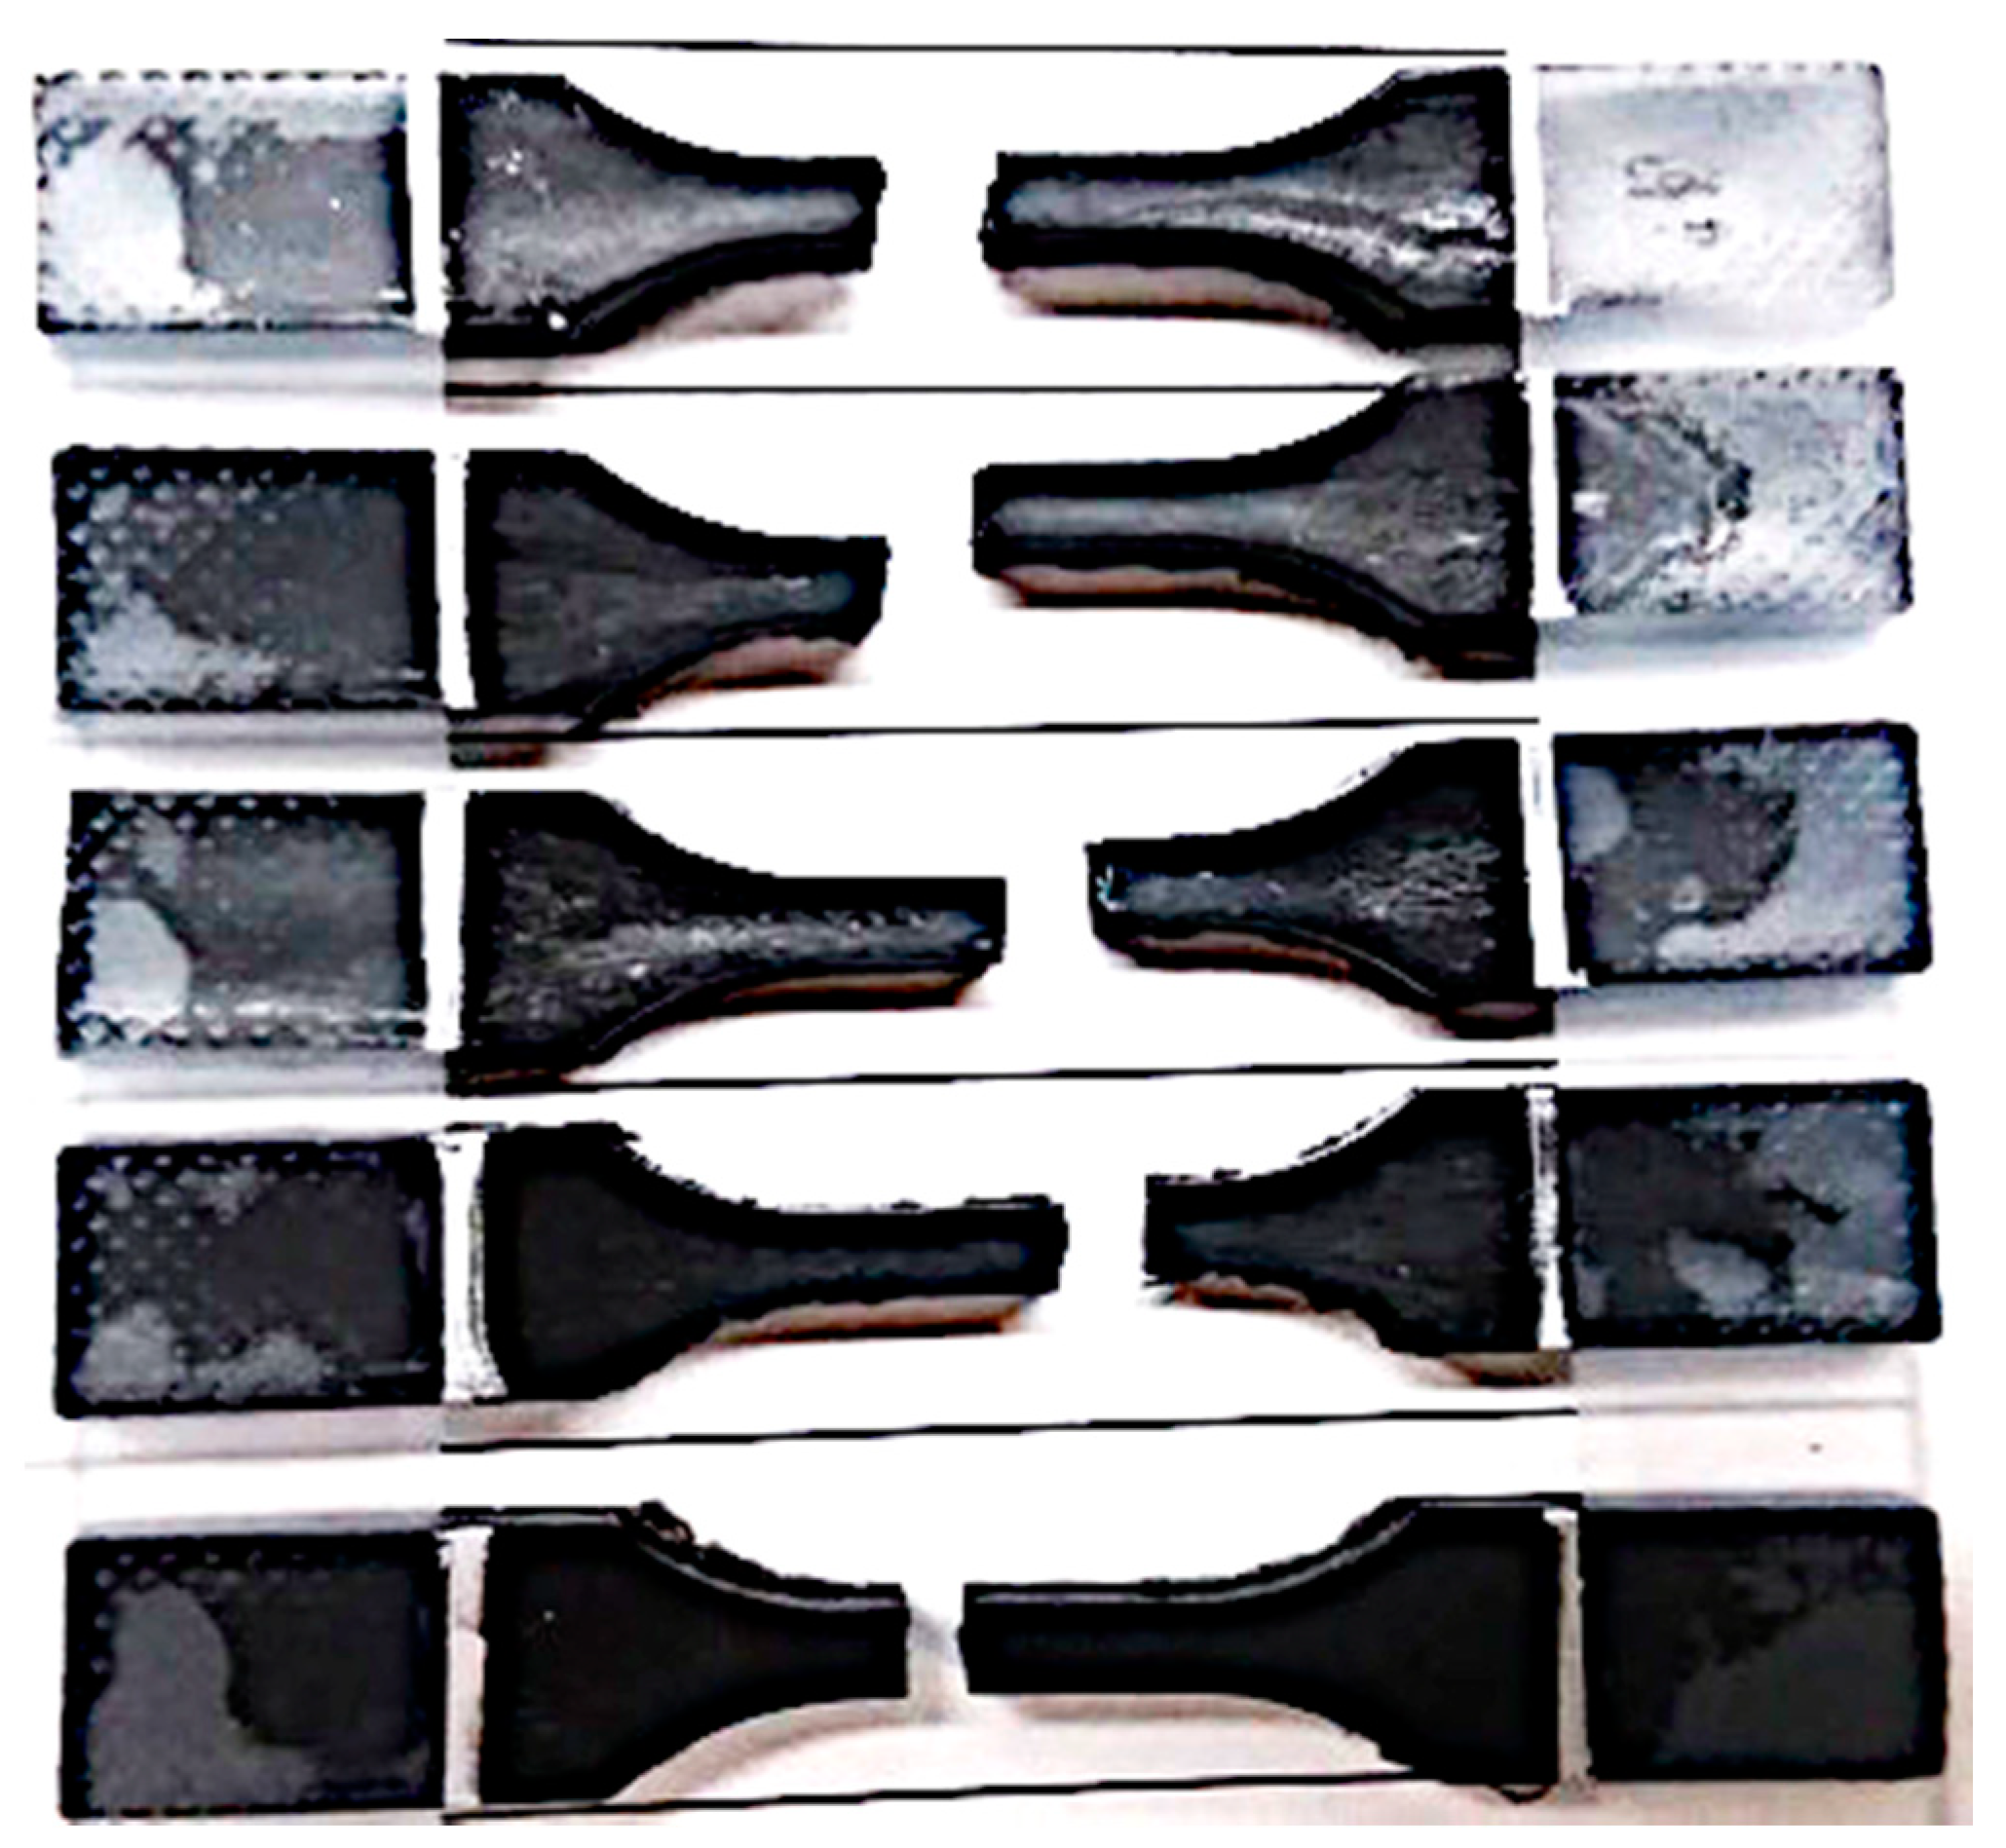
The typical failure patterns for the composite specimens are shown in Figure 9. Most specimens failed well within the test section. The governing failure mode appeared to be the maximum normal stress criterion, with the failure areas perpendicular to the applied tensile load.

3.5. Thermal Properties

3.5.1. Heat Distortion Temperature

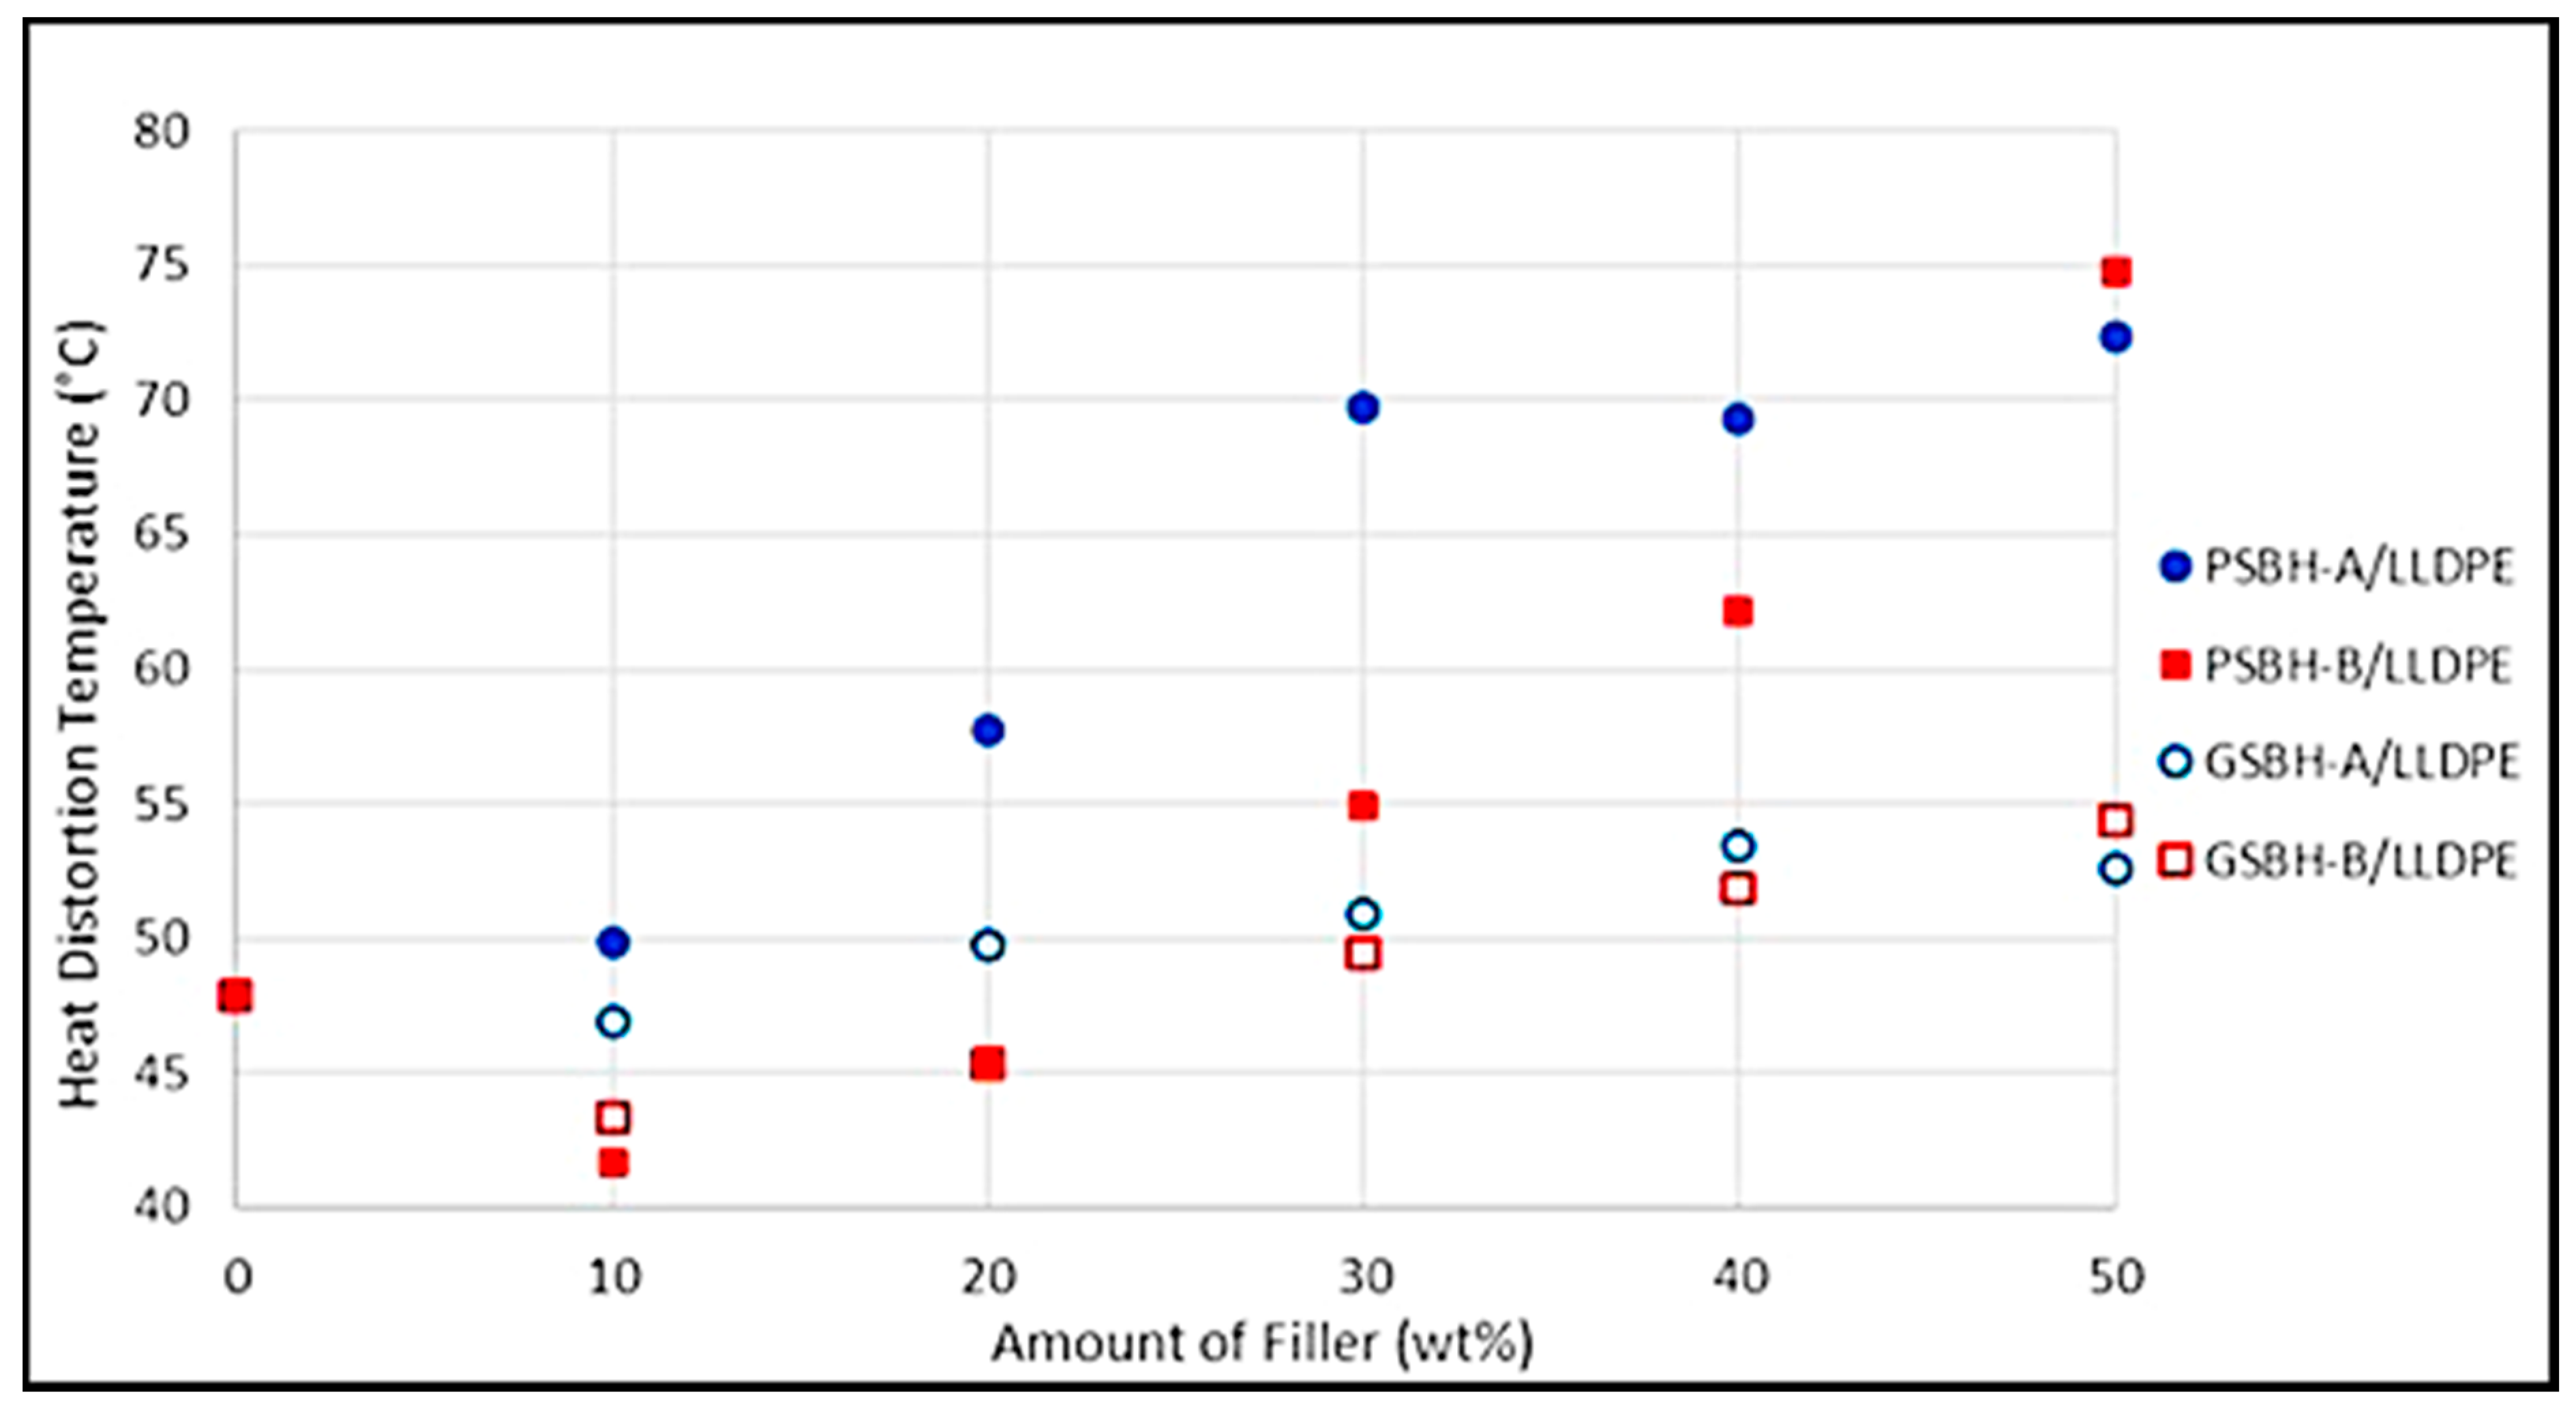
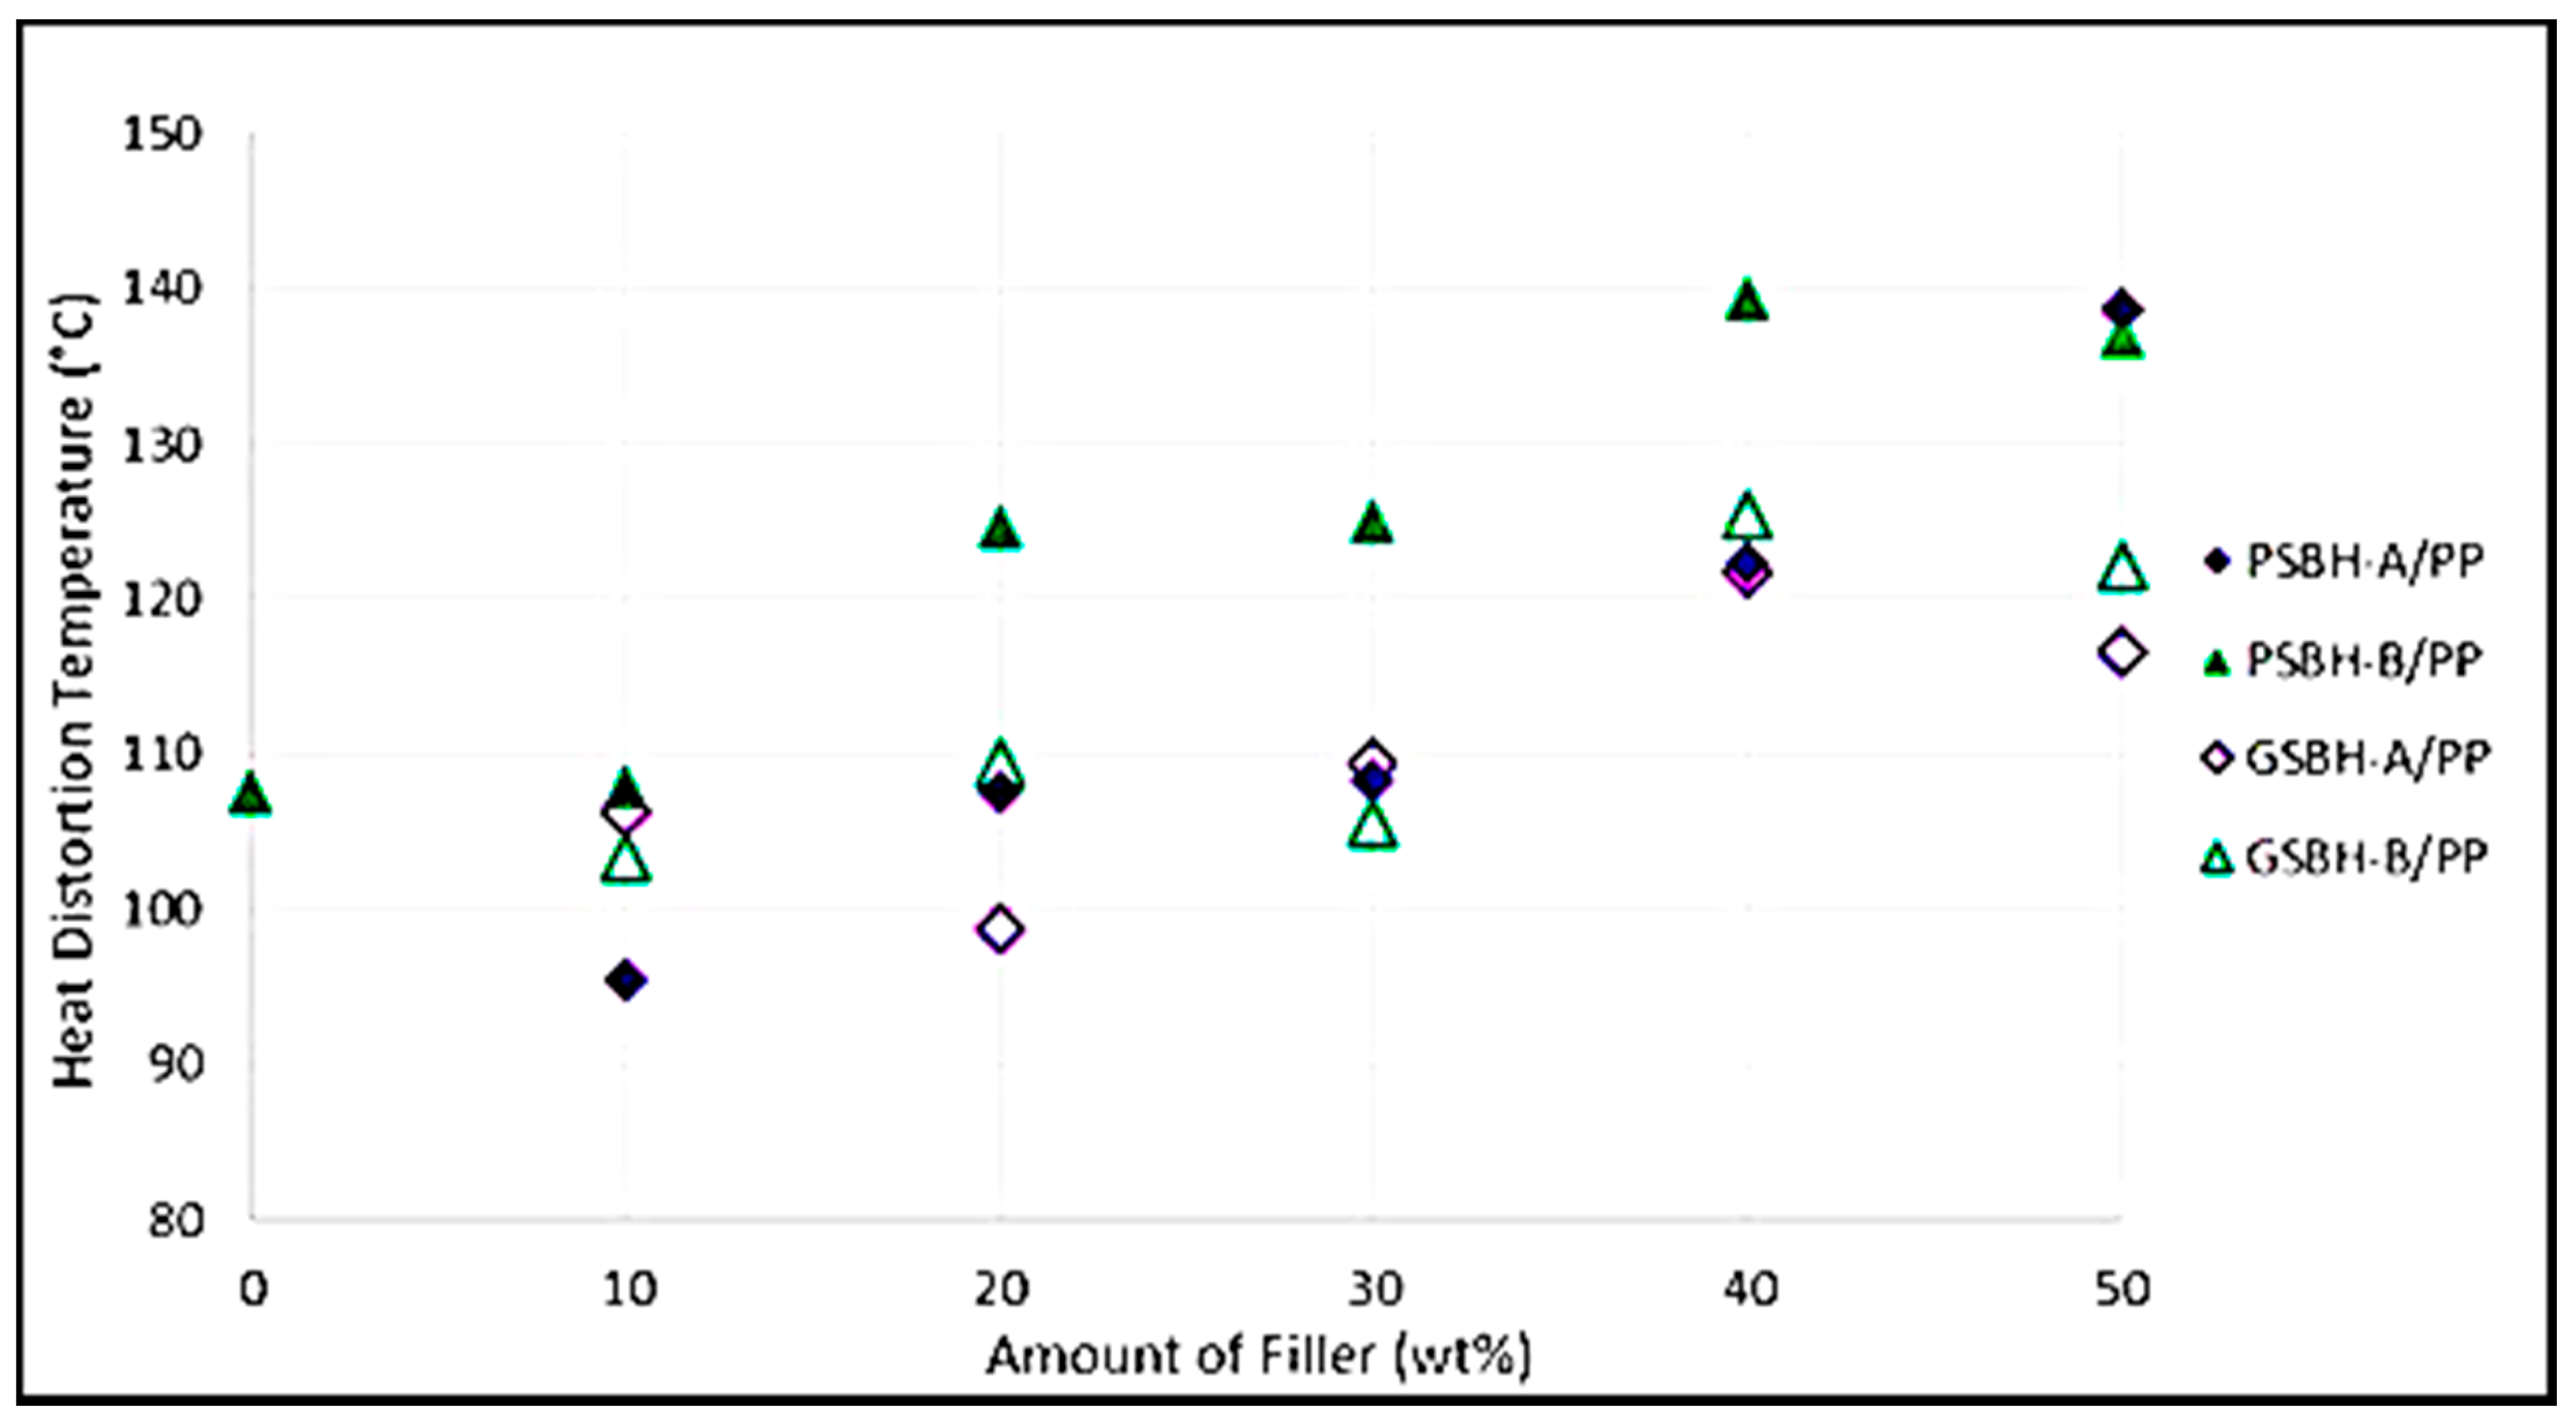
The heat distortion temperature (HDT) measurements for LLDPE-PSBH and PP-PSBH composites using DMA are shown in Figure 10 and Figure 11, respectively.
Figure 10 reveals that HDT of LLDPE/PSBH increased with increasing amounts of PSBH, resulting in a maximum of 27 °C enhancement with pyrolysis condition B and a maximum of 24 °C with pyrolysis condition A with the PSBH filler addition of up to 50 wt.%. The LLDPE/GPSBH composites had lower gains in HDT, with increases of up to 6.5 and 4.5 °C increments for pyrolysis conditions B and A, respectively, indicating the high efficacy of larger (as received) PSBH particles in increasing the heat distortion temperature for the composite in comparison to the use of smaller (ground) PSBH particles.
Figure 11 reveals that HDT of PP/PSBH composites increased with increasing amounts of PSBH. When compared to neat PP, up to 30.5 and 30 °C increases were obtained for heat distortion temperatures of PP/PSBH composites for pyrolysis conditions B and A, respectively, with the PSBH filler addition of up to 50 wt.%. The PP/GPSBH composites had lower gains in HDT in a manner similar to the behavior of the LLDPE/GSBH composites, with increases of up to 12.5 and 7.5 °C increments for pyrolysis conditions B and A, respectively.
Differences obtained in HDT between as received and ground-filler-added LLDPE and PP-based composites could be attributed to reductions in freedom of movement of polymer chains, which were reduced more when porous and bigger particles were added (confinement effect) in comparison to the addition of smaller (ground) particles.

3.5.2. Melting Temperature and Heat of Fusion

Table 2 and Table 3 show the results of DSC analyses for the LLDPE/PSBH and PP/PSBH composites, respectively. The melting temperature of neat LLDPE was found to be 123 °C. The melting temperatures of most LLDPE/PSBH composites were slightly higher than those of neat LLDPE (within ~4%) but with no noticeable trend between the weight percentage and the melting temperature. This could have been caused by a reduction in movement for the polymer chains as a result of the added filler. The heat of fusion (ΔH) noticeably decreases with increasing filler addition in most cases. Many factors likely caused this decrease. First, the addition of the PSBH filler in increasing amounts meant that there was less polymer being melted (up to 50% less polymer by weight), which meant less energy was required for melting. The PSBH filler was likely not melting much under the testing conditions and therefore did not show any change in enthalpy. A lower degree of crystallinity in the LLDPE/PSBH composites when compared to neat LLDPE could also have contributed to lower heat of fusion values. The crystallinity could have changed because of the presence of the filler or even the processing conditions the composite materials were subjected to.
The melting temperature of neat PP was found to be 170 °C. The addition of the PSBH filler reduced the melting temperature for all cases, with no correlation between filler amount and melting temperature. The reduced melting temperature was likely a result of smaller crystals being formed in PP/PSBH composite samples when compared to neat PP. The heat of fusion generally decreased with increasing filler addition. As with the LLDPE/PSBH composites, the reduction in heat of fusion could be attributed to the smaller amounts of polymer being melted and what was likely a lower crystallinity. The effects of pyrolysis temperature and milling were minor and inconsistent for most cases.

3.5.3. Thermal Stability

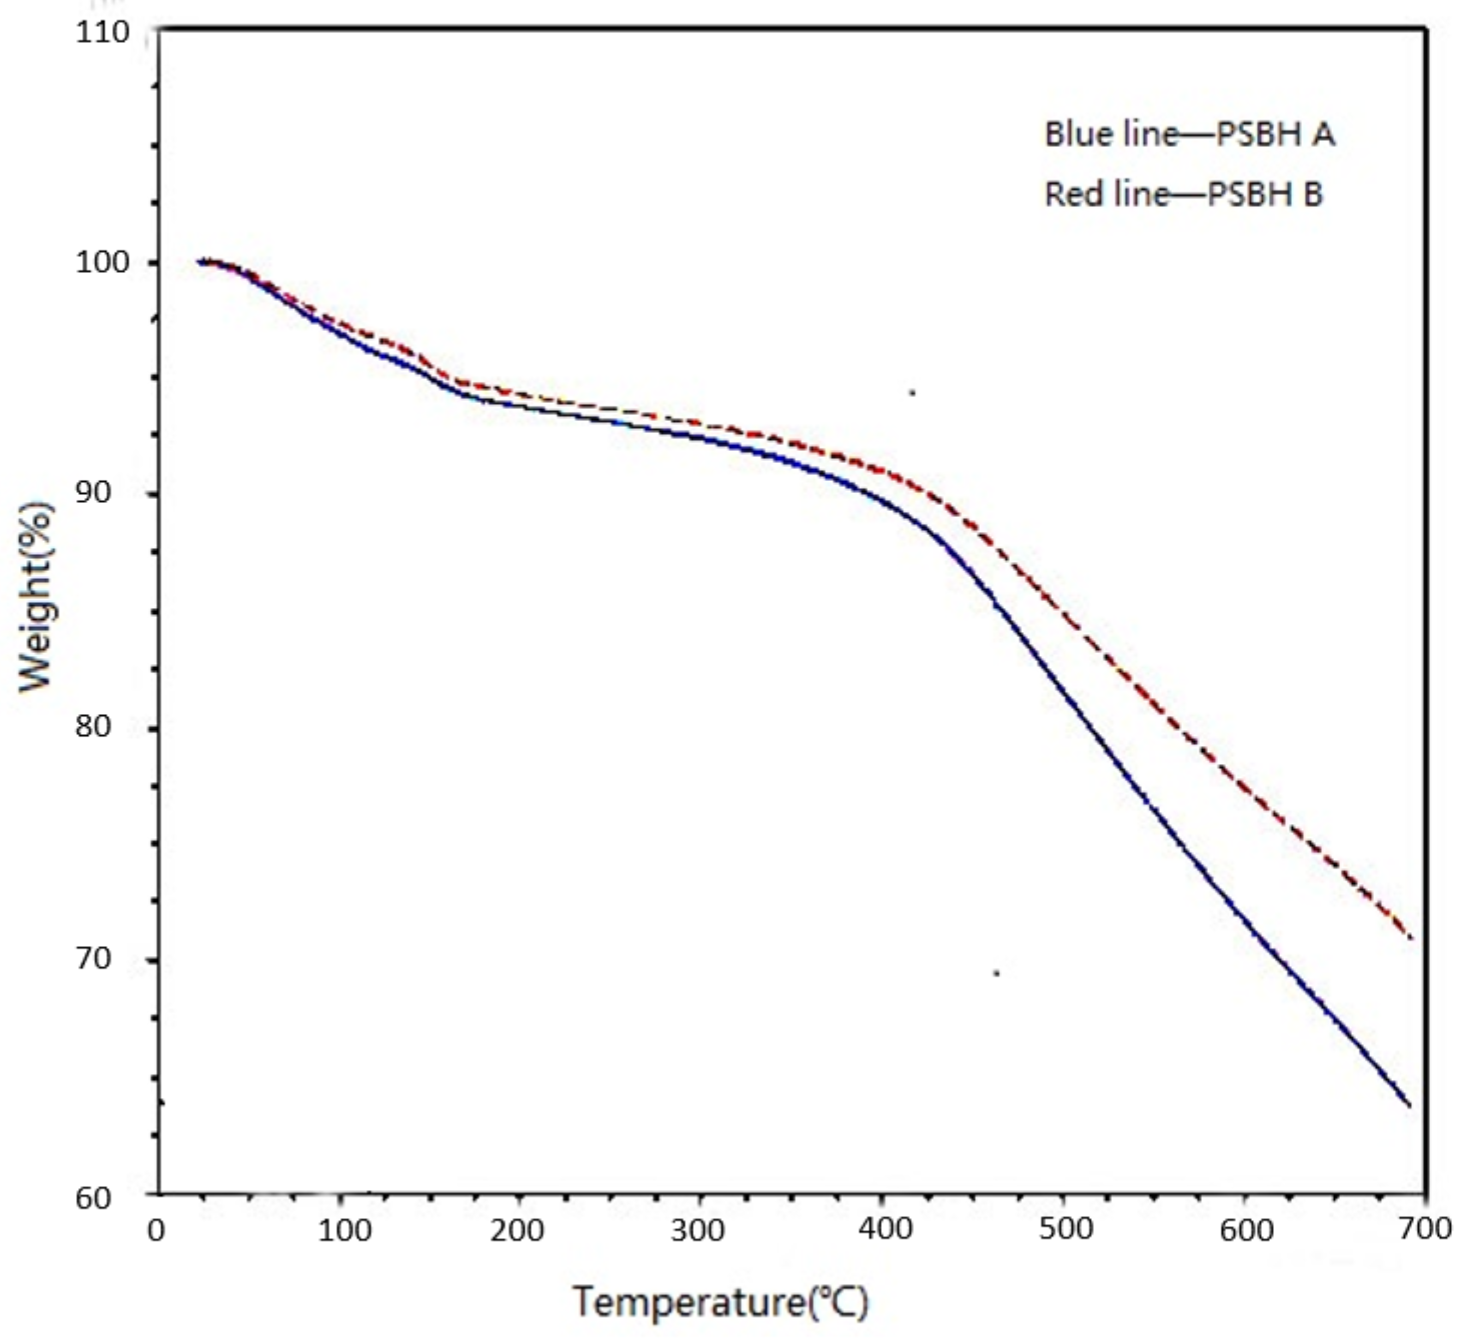
The thermal decomposition temperature (TDT) of neat LLDPE was 425.64 °C, and the addition of the PSBH filler increased the TDT by roughly 50–60 °C in all cases. The extent of the increase did not seem to depend on the amount of filler added. In general, lot B compounds had higher TDT values than lot A compounds. This is explained by the lot B filler being more thermally stable than the lot A filler because it was pyrolyzed at a higher temperature (Figure 12 demonstrates this fact). GSBH composites also seemed to have larger TDT values than their as-received PSBH counterparts. This could be attributed to a more homogeneous mixture in GSBH composites, which offered more thermal stability to the polymer matrix than the PSBH/LLDPE counterparts.
The TDT of PP was 384.88 °C, with the addition of the PSBH filler increasing the TDT by roughly 80–90 °C. The effects of milling and pyrolysis temperature did not have any apparent trend in the TDT values.
The results showed that addition of the PSBH filler led to a greater increase of TDT in PP/PSBH composites than in the LLDPE/PSBH composites. PP is naturally more vulnerable to decomposition than LLDPE due to the presence of tertiary carbons in the main polymer chain [18]. The greater increase in TDT for PP/PSBH composites was likely related to the filler’s ability to better suppress decomposition in PP than in LLDPE. Unpyrolyzed biomass materials that remained within the PSBH filler also underwent decomposition. Some of the byproducts of the decomposed PSBH filler contained oxygen. The radicals formed during PP decomposition could be consumed by these oxygen-containing molecules, which hindered decomposition and improved the thermal stability of the PP/PSBH composites compared to neat PP [19].
Figure 12 shows the TGA results for the PSBH-A and PSBH-B fillers. The data clearly show that both filler materials degraded as the temperature was increased with a weight loss of roughly 30% for PSBH-B and 36% for PSBH-A. Since the lot B material was thermally converted at a higher temperature, it makes sense that less of the material was degrading during this test. The slope change at 100 °C corresponds to water loss and provides information on the amount of water present in the PSBH-A and PSBH-B fillers.
Recall that SBH contains cellulose, hemicellulose, lignin, and other components [7]. The thermal conversion of SBH does not fully burn all these materials away, meaning that the PSBH filler still contains various amounts of each. These materials disintegrate at various rates and temperatures during testing, which explains the weight loss from the PSBH filler. Based on the analysis of the peaks detected in the FT-IR spectra we obtained for the PSBH-A and PSBH-B fillers, it was clear that both as-received and ground PSBH contained small amounts of cellulose and hemicellulose, as well as relatively large amounts of lignin, contrary to the data reported in [7]. This was expected because the main decomposition temperature of lignin is above 500 °C, which exceeds the pyrolysis temperature of PSBH A and B.

3.6. Thickness Swelling and Liquid Uptake

3.6.1. Thickness Swelling and Liquid Uptake in Water

In general, the amount of water absorbed and the thickness swelling increased with the number of days submerged and increasing filler amounts. PP/PSBH composites showed less water absorption and thickness swelling than their LLDPE/PSBH counterparts. This could have been due to the stronger adhesion between the filler and the PP matrix leading to smaller voids in the composite material compared to LLDPE/PSBH composites, which meant less space for liquid to occupy. Additionally, the PP matrix could have been coating the filler surface better than the LLDPE matrix, which limited the porous PSBH filler from taking in water through capillary action. The neat polymers were shown to be very hydrophobic, absorbing almost no liquid even after 7 days. Thus, all absorption can be attributed to the porous PSBH material, which explains why liquid uptake and thickness swelling increased with increasing amounts of filler. The absorption and swelling levels for the composites were overall still small, which may be attributed to the effectiveness of thermal conversion in improving the water resistance of the biomass material.
The effect of milling was evident, with the GSBH material absorbing less liquid than PSBH in general, which led to less thickness swelling as well. It is the porous nature of the PSBH material that allows liquid to enter it. By milling the material, much of that porous structure was destroyed and the ability of the material to absorb liquid was reduced. The difference between the lot A and lot B PSBH was very slight, with lot B generally absorbing more water. This result suggests that lot B PSBH is most likely more porous than lot A in general.

3.6.2. Thickness Swelling and Liquid Uptake in 0.1 M HCl

The thickness swelling and liquid uptake generally increased with both filler amount and days submerged in 0.1 M HCl. The PSBH composites generally absorbed more HCl than the GSBH composites, but some of the results for thickness swelling did not follow this trend. The values between lot A and lot B compounds were similar, with no apparent trends seen. The composites seemed resistant to the acidic solution, with no signs of reaction or dissolved material.

3.6.3. Thickness Swelling and Liquid Uptake in 0.1 M NaOH

The thickness swelling and liquid uptake generally increased with both filler amount and days submerged in 0.1 M NaOH. The PSBH composites generally absorbed more NaOH than the GSBH composites. The values between lot A and lot B compounds were similar, with no apparent trends seen. The composites seemed resistant to the basic solution, with no evidence of reaction or dissolved material being found.

3.6.4. Comparison of Water, 0.1 M HCl, and 0.1 M NaOH Results

The results of thickness swelling and water absorption for the three tested liquids were very similar. The composite materials seemed to behave the same regardless of the type of liquid they were in, which suggests that both the polymers and the fillers were unreactive to the different liquids.

3.7. Morphology, Roughness, and Compatibility of PSBH in LLDPE and PP

3.7.1. SEM Images of PSBH-A/LLDPE and GSBH-A/LLDPE Composites

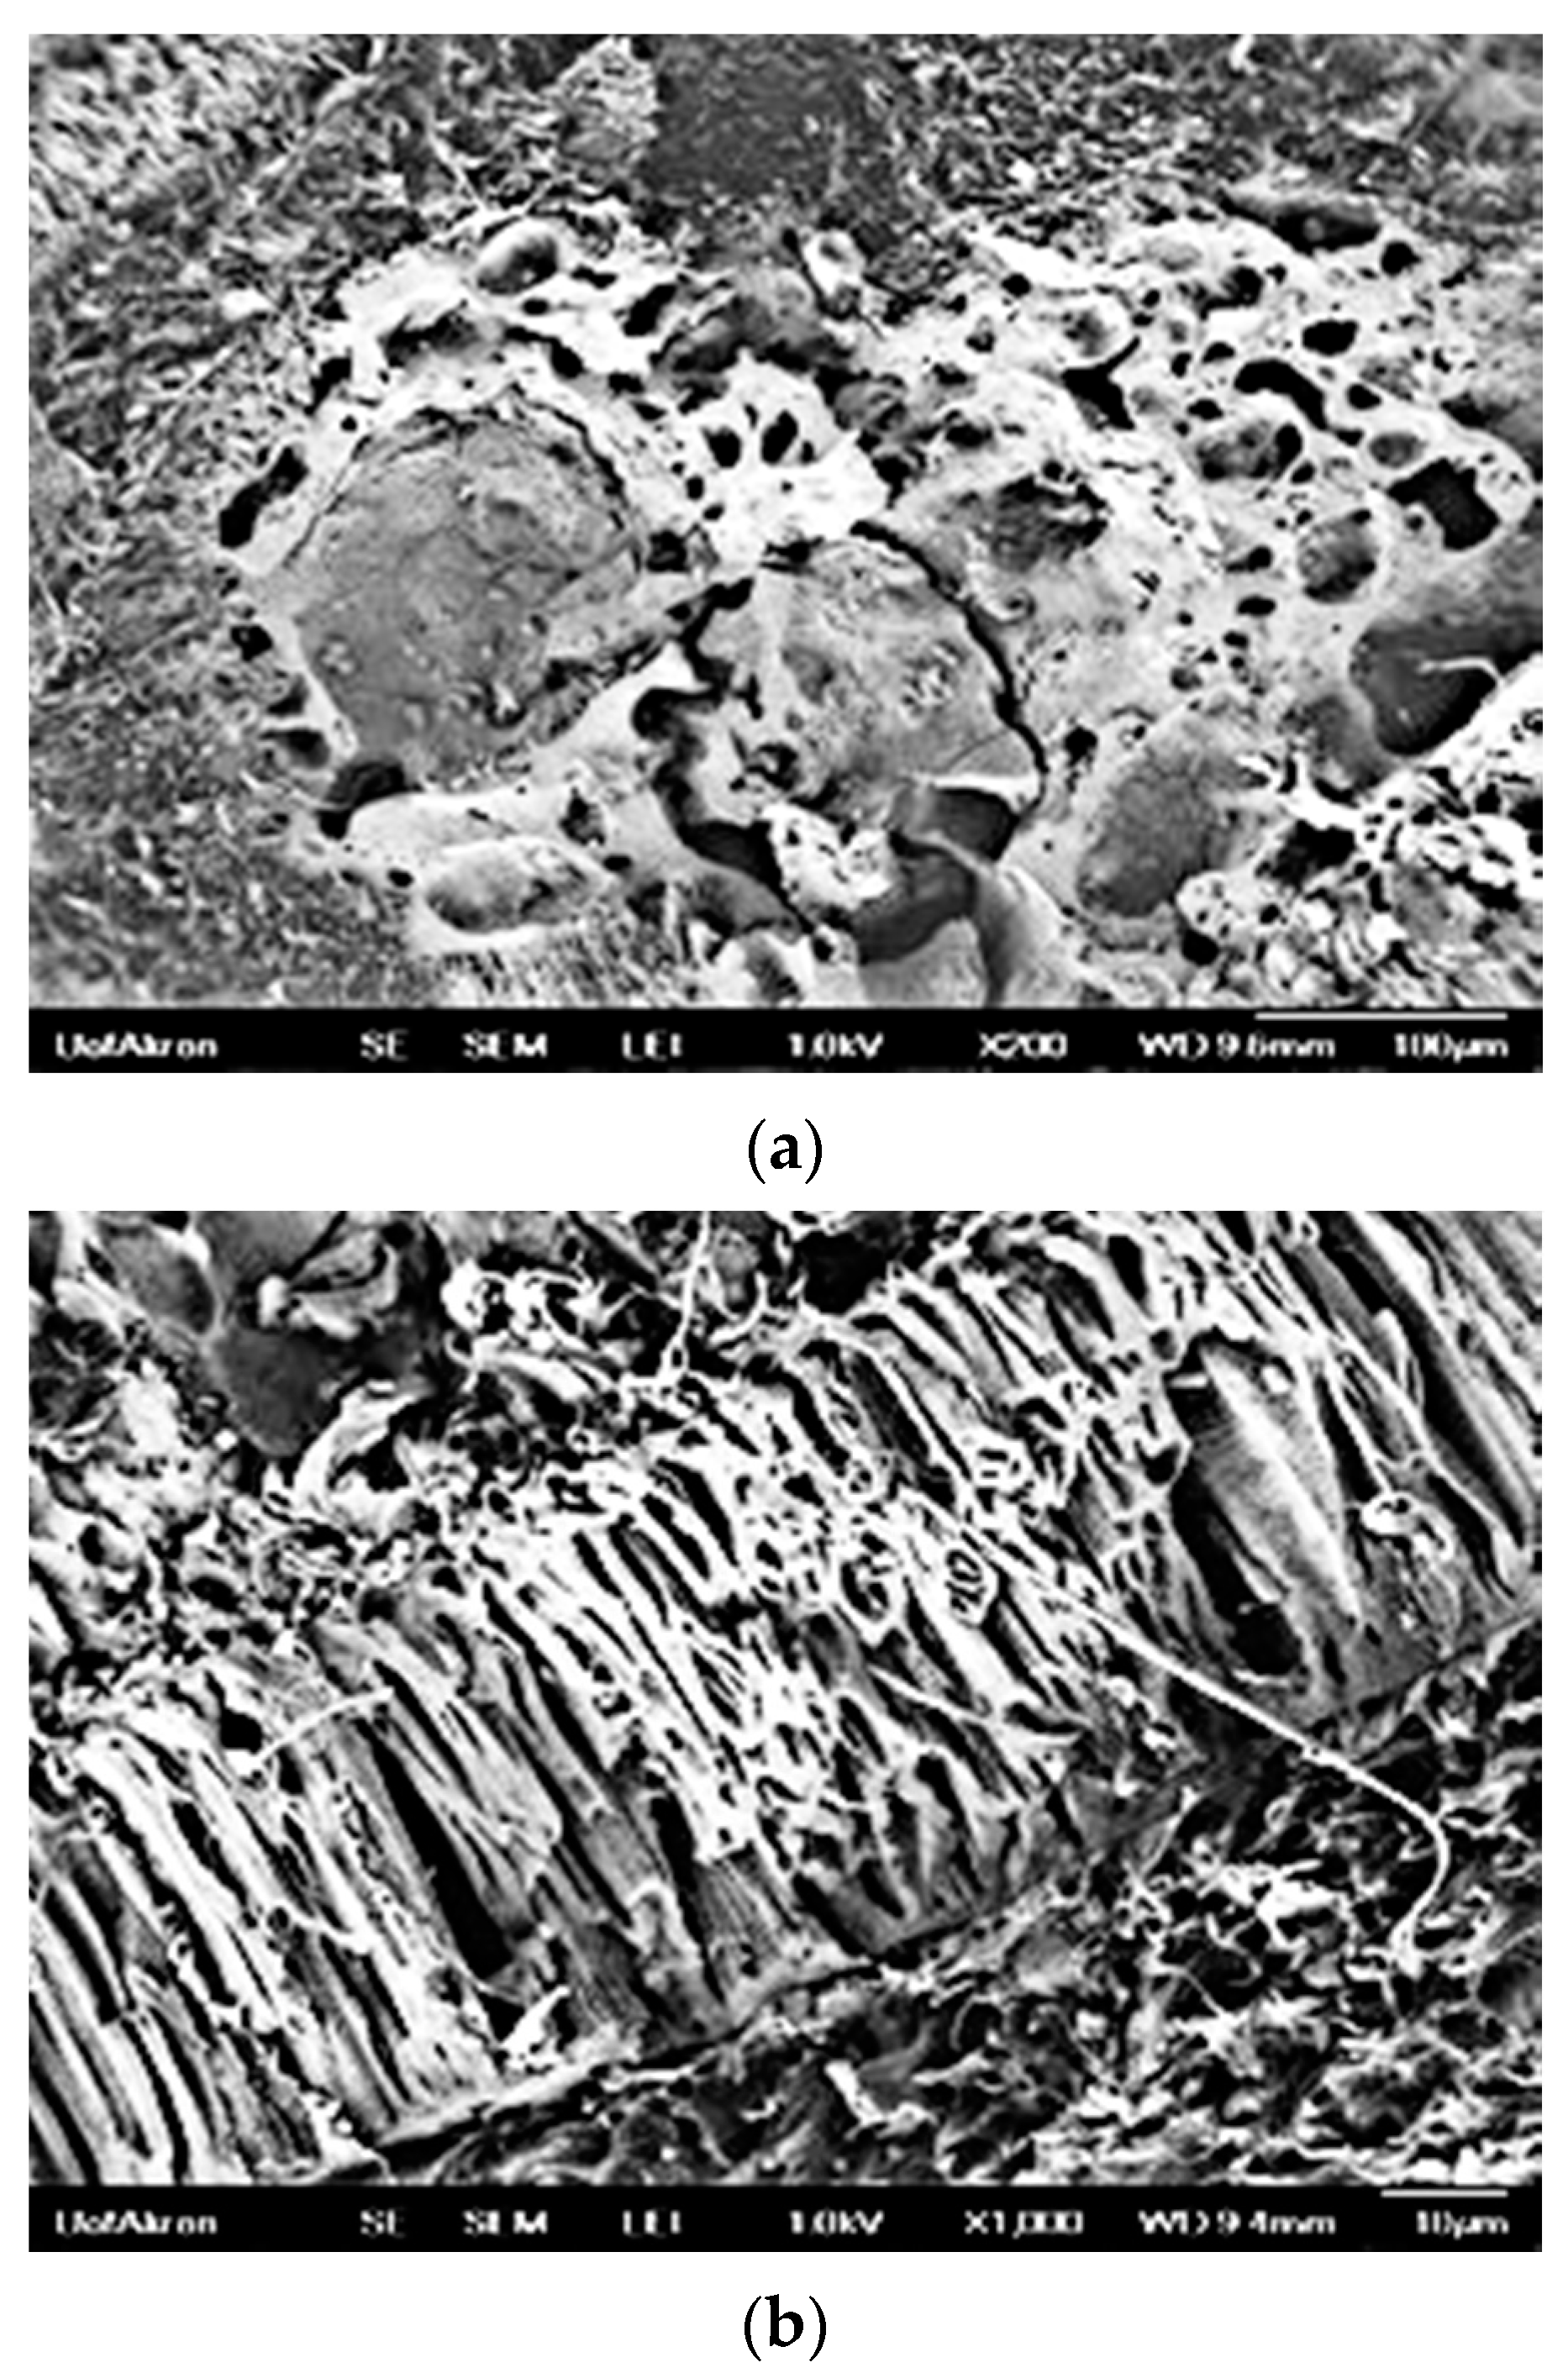
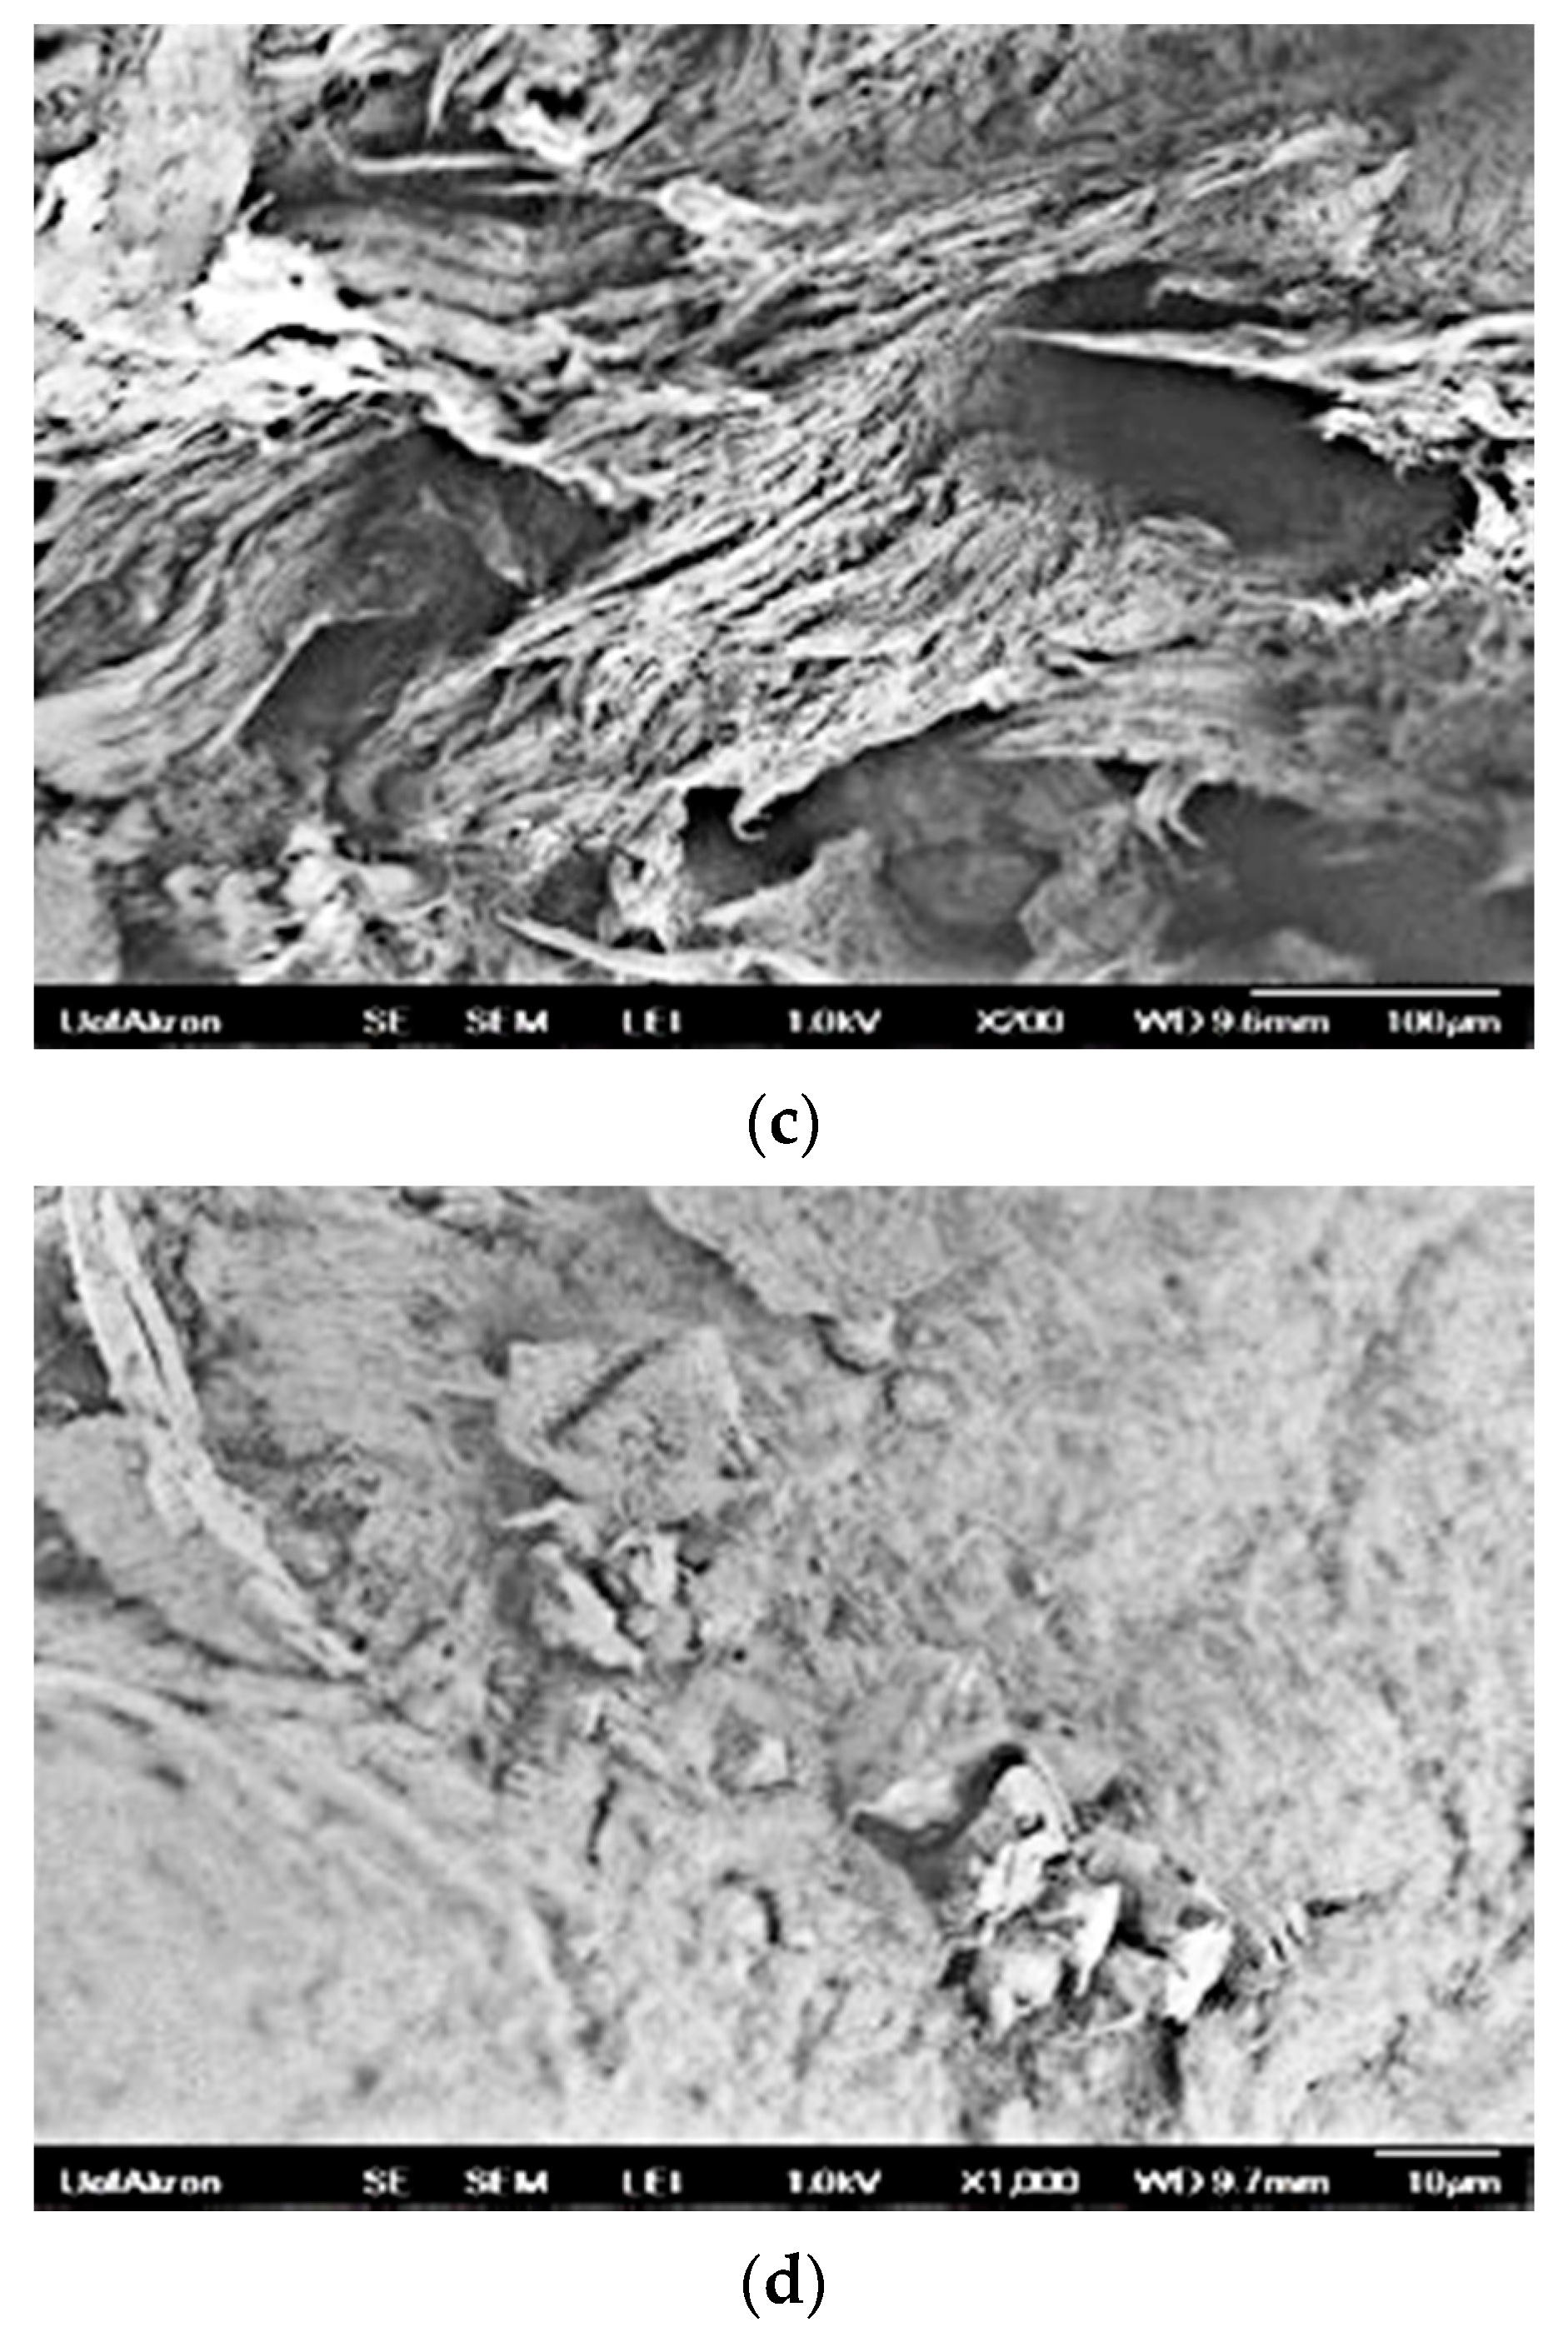
Figure 13 shows the fracture surfaces of various PSBH-A/LLDPE and GSBH-A/LLDPE composites after they were broken by tensile testing. The size scale is displayed in the bottom right of each image and varies from image to image. For the as-received PSBH-A composites (Figure 13a,b), the large PSBH particles can be easily seen. The particles were porous in nature and generally well embedded into the polymer matrix, showing good compatibility. These figures reveal that the PSBH particles had different structures. The LLDPE material can be seen to have had many stretched fibrils. Recall that these images are of the fracture surface of the dog-bone samples after tensile testing. Thus, the fibrils are evidence that the material was elongating before it fractured. Based on our mechanical test results, it is known that the material became more brittle at higher filler fractions. When comparing composites with 50 wt.% filler to composites with 20 wt.% filler, we noticed a distinct reduction in the length and amount of the fibrils in the 50 wt.% composites. This reduction is further evidence that the material was elongating less before breaking (less deformable) due to the lower percentage of the polymer component within the composite.
Figure 13a,b reveals that LLDPE material penetrated some of the pores/gaps in the PSBH material. Figure 13c,d shows the fracture surfaces of LLDPE matrix composites containing ground PSBH material. These photos reveal that the LLDPE material did not penetrate the pores/gaps in the GSBH particles as much as it did with the as-received PSBH, indicating that the structure of the particles was largely destroyed during the milling process. All photos in Figure 13 reveal the variation in particle sizes.

3.7.2. SEM Images of PSBH-A/PP and GSBH-A/PP Composites

Figure 14 shows the fracture surfaces for the PSBH-A/PP and GSBH-A/PP composites. The surface of PP was smoother than LLDPE samples, showing less signs of elongation. The PSBH particles were easier to distinguish from the polymer matrix than in LLDPE samples. Notice that the PP did not penetrate the particle pores as much as in the LLDPE composites, with the PP showing much less ability to flow into the pores of the PSBH particles.
Figure 14c,d shows the fracture surfaces of the PP matrix composites containing ground PSBH material. Again, the reduction in particle size due to milling is evident. Some polymer fibrillation can also be seen. Figure 14d is an image (×1000) of the fracture surface for a 20 wt.% GSBH-A/80 wt.% PP composite sample. Some of the smaller GSBH particles can be seen to have been embedded in the polymer matrix.

4. Conclusions

The addition of PSBH material made notable improvements to various thermal properties of the polymers. The heat distortion temperature was shown to increase with increasing amounts of the PSBH filler for all cases. The heat distortion temperatures of the as-received LLDPE/PSBH composites were increased in comparison to their ground counterparts. The pyrolysis temperatures also had some influence, as lot A materials generally outperformed lot B materials.
The thermal decomposition temperature (TDT) was shown to increase for all composite cases when compared to the neat polyolefins. The addition of more filler did not directly correlate to an increase in the TDT for any cases. In general, lot B compounds (pyrolyzed at 500 °C) had higher TDT values than lot A compounds (pyrolyzed at 450 °C) for the LLDPE/PSBH composites. The LLDPE/GSBH composites also had larger TDT values than their as-received PSBH counterparts. For PP/PSBH composites, the effects of pyrolysis temperature and milling had no apparent trends.
The melting temperature of most LLDPE/PSBH composites was slightly higher than that of neat LLDPE, but with no noticeable trend between the weight percentage and the melting temperature. The addition of the PSBH filler reduced the melting temperature for the PP/PSBH composites, with no correlation between filler amount and melting temperature. The heat of fusion values were shown to decrease with increasing filler amounts for all cases. The effects of pyrolysis temperature and milling were shown to be slight and inconsistent in most cases.
In general, the addition of filler increased the maximum stress of the LLDPE/PSBH composites while reducing the maximum stress of the PP/PSBH composites. The strain at maximum stress was reduced with increasing amounts of the PSBH filler for all composites. The modulus of elasticity generally increased with increasing filler amount, leading to more brittle material. The use of lot A material versus lot B material had little effect on the mechanical properties of the materials. Milling the material into GSBH had minimal to slightly positive effects on the mechanical properties of most composites. The effects of milling were more noticeable in the PP/PSBH composites than in the LLDPE/PSBH composites.
The liquid absorption and thickness swelling in the materials were small overall but did increase with increasing amounts of the PSBH filler and with the time spent submerged in liquid. The differences between using water, 0.1 M HCl, and 0.1 M NaOH were mostly negligible. The as-received PSBH composites generally absorbed more liquid than their GSBH counterparts, which also meant more thickness swelling. Lots A and B preformed the same in most cases.
SEM images revealed that the filler was compatible with the polymers and embedded itself into the polymer matrices. The results of the sieving for as-received PSBH, SEM particle size analysis of the GSBH, and the SEM images themselves show that milling resulted in significant size reductions of the particles. The SEM images also gave some insight into the shape and porous nature of the PSBH particles.
Overall, the use of PSBH as fillers shows promise. Like most fillers, their use comes with advantages and disadvantages. PSBH fillers are advantageous in that they are inexpensive, lightweight, abundant, and offer favorable thermal properties. These benefits come with considerable changes in mechanical properties and slight increases in liquid absorption and thickness swelling.
With the differences in lot A and lot B materials being minor, lot A materials (which is pyrolyzed at a lower temperature) are preferred due to their lower production cost. On the other hand, lot B materials are pyrolyzed at a higher temperature, which leads to more feedstock reduction (91% reduction for lot B vs. 80% reduction for lot A) and reduces the amount of organic matter in the pyrolyzed material. This means less material to store and a lighter material to transport.
Milling the PSBH material into GSBH was shown to have positive effect on the results, but for large-scale production, a more efficient and likely automated process should be developed for milling.

Author Contributions

Conceptualization, E.S.; Data curation, C.C.; Formal analysis, C.C.; Funding acquisition, E.S.; Investigation, C.C.; Methodology, E.S. and C.C.; Project administration, E.S.; Resources, E.S.; Supervision, E.S.; Validation, E.S. and C.C.; Visualization, C.C.; Writing—original draft, C.C.; Writing—review & editing, E.S. All authors have read and agreed to the published version of the manuscript.

Funding

This research was funded by [Ohio Soy Bean Council] grant number [17-R-26].

Institutional Review Board Statement

Not Applicable.

Informed Consent Statement

Not applicable.

Data Availability Statement

Not applicable.

Acknowledgments

Financial support from the Ohio Soybean Council (Project 17-R-26; Barry McGraw, technical monitor) is gratefully acknowledged. Valuable help by Joseph J. James, President of Agri-Tech Producers, LLC, in acquiring the pyrolyzed soybean hulls is also gratefully acknowledged.

Conflicts of Interest

The authors declare no conflict of interest.

References

  1. Polypropylene Production Capacity, Market and Price. Available online: https://www.plasticsinsight.com/resin-intelligence/resin-prices/polypropylene/ (accessed on 20 January 2020).
  2. LLDPE Production Capacity by Region and Price. Available online: https://www.plasticsinsight.com/resin-intelligence/resin-prices/lldpe/ (accessed on 20 January 2020).
  3. Van Der Stelt, M.J.C.; Gerhauser, H.; Kiel, J.H.A.; Ptasinski, K.J. Biomass upgrading by torrefaction for the production of biofuels: A review. Biomass Bioenergy 2011, 35, 3748–3762. [Google Scholar] [CrossRef]
  4. Niu, Y.; Lv, Y.; Lei, Y.; Liu, S.; Liang, Y.; Wang, D.; Hui, H. Biomass torrefaction: Properties, applications, challenges, and economy. Renew. Sustain. Energy Rev. 2019, 115, 109395. [Google Scholar] [CrossRef]
  5. Liu, H.-M.; Li, H.-Y. Application and Conversion of Soybean Hulls. In Soybean: The Basis of Yield, Biomass and Productivity; Kasai, M., Ed.; IntechOpen: London, UK, 2017; ISBN 978-1-78985-374-2. [Google Scholar]
  6. United States Department of Agriculture Economic Research Service. Available online: https://www.ers.usda.gov/data-products/#!topicid=14829&subtopicid=14851 (accessed on 23 September 2019).
  7. Toro-trochez, J.L.; Carrillo-pedraza, E.S.; Bustos-martínez, D.; García-mateos, F.J.; Ruiz-rosas, R.R.; Rodríguez-mirasol, J. Thermogravimetric characterization and pyrolysis of soybean hulls. Bioresour. Technol. Reports 2018, 6, 183–189. [Google Scholar] [CrossRef]
  8. GES–Soy. Available online: http://greenearthsystems.com.au/commodities/soy/ (accessed on 9 March 2020).
  9. How to Remove a lot of Soybean Skin Easily? 3 Steps. Available online: https://www.nutmachines.com/blog/remove-soybean-skin.html (accessed on 9 March 2020).
  10. Basu, P. Biomass Gasification and Pyrolysis: Practical Design and Theory; Academic Press: Cambridge, MA, USA, 2010; ISBN 978-0-12-374988-8. [Google Scholar]
  11. Yaman, S. Pyrolysis of biomass to produce fuels and chemical feedstocks. Energy Convers. Manag. 2004, 45, 651–671. [Google Scholar] [CrossRef]
  12. Chen, W.H.; Peng, J.; Bi, X.T. A state-of-the-art review of biomass torrefaction, densification and applications. Renew. Sustain. Energy Rev. 2015, 44, 847–866. [Google Scholar] [CrossRef]
  13. Pabst, W.; Gregorov, E. Characterization of Particles and Particle Systems; Institute of Chemical Technology: Prague, Czech Republic, 2007; Available online: http://old.vscht.cz/sil/keramika/Characterization_of_particles/CPPS%20_English%20version_.pdf (accessed on 15 September 2021).
  14. ASTM Designation: D638-14. Standard Test Method for Tensile Properties of Plastics; ASTM International: Miami, FL, USA, 2014; Volume 82, pp. 1–15. [Google Scholar] [CrossRef]
  15. ASTM Designation: D648-18. Standard Test Method for Deflection Temperature of Plastics Under Flexural Load in the Edgewise Position; ASTM International: Miami, FL, USA, 2001; Volume 8, pp. 1–15. [Google Scholar] [CrossRef]
  16. Wadud, S.E.B.; Ullbrich, R.R. Using the DMA Q800 for ASTM International D 648 Deflection Temperature Under Load; TA Instruments: New Castle, DE, USA; Available online: http://www.tainstruments.com/pdf/literature/RH086_Using_Q800_for_ASTM_D468.pdf (accessed on 15 September 2021).
  17. Baş, G.S.; Sancaktar, E.; Karadurmuş, E. Physical Properties of LLDPE and PP Filled with Wood Flours. In Proceedings of the ASME 2015 International Design Engineering Technical Conferences & Computers and Information in Engineering Conference, New York, NY, USA, 2–5 August 2015. [Google Scholar] [CrossRef]
  18. Beyler, C.L.; Hirschler, M.M. Thermal decomposition of polymer. Fire Prot. Eng. 2002, 2, 110–131. [Google Scholar] [CrossRef]
  19. Pǎrpǎriţǎ, E.; Nistor, M.T.; Popescu, M.C.; Vasile, C. TG/FT-IR/MS study on thermal decomposition of polypropylene/biomass composites. Polym. Degrad. Stab. 2014, 109, 13–20. [Google Scholar] [CrossRef]
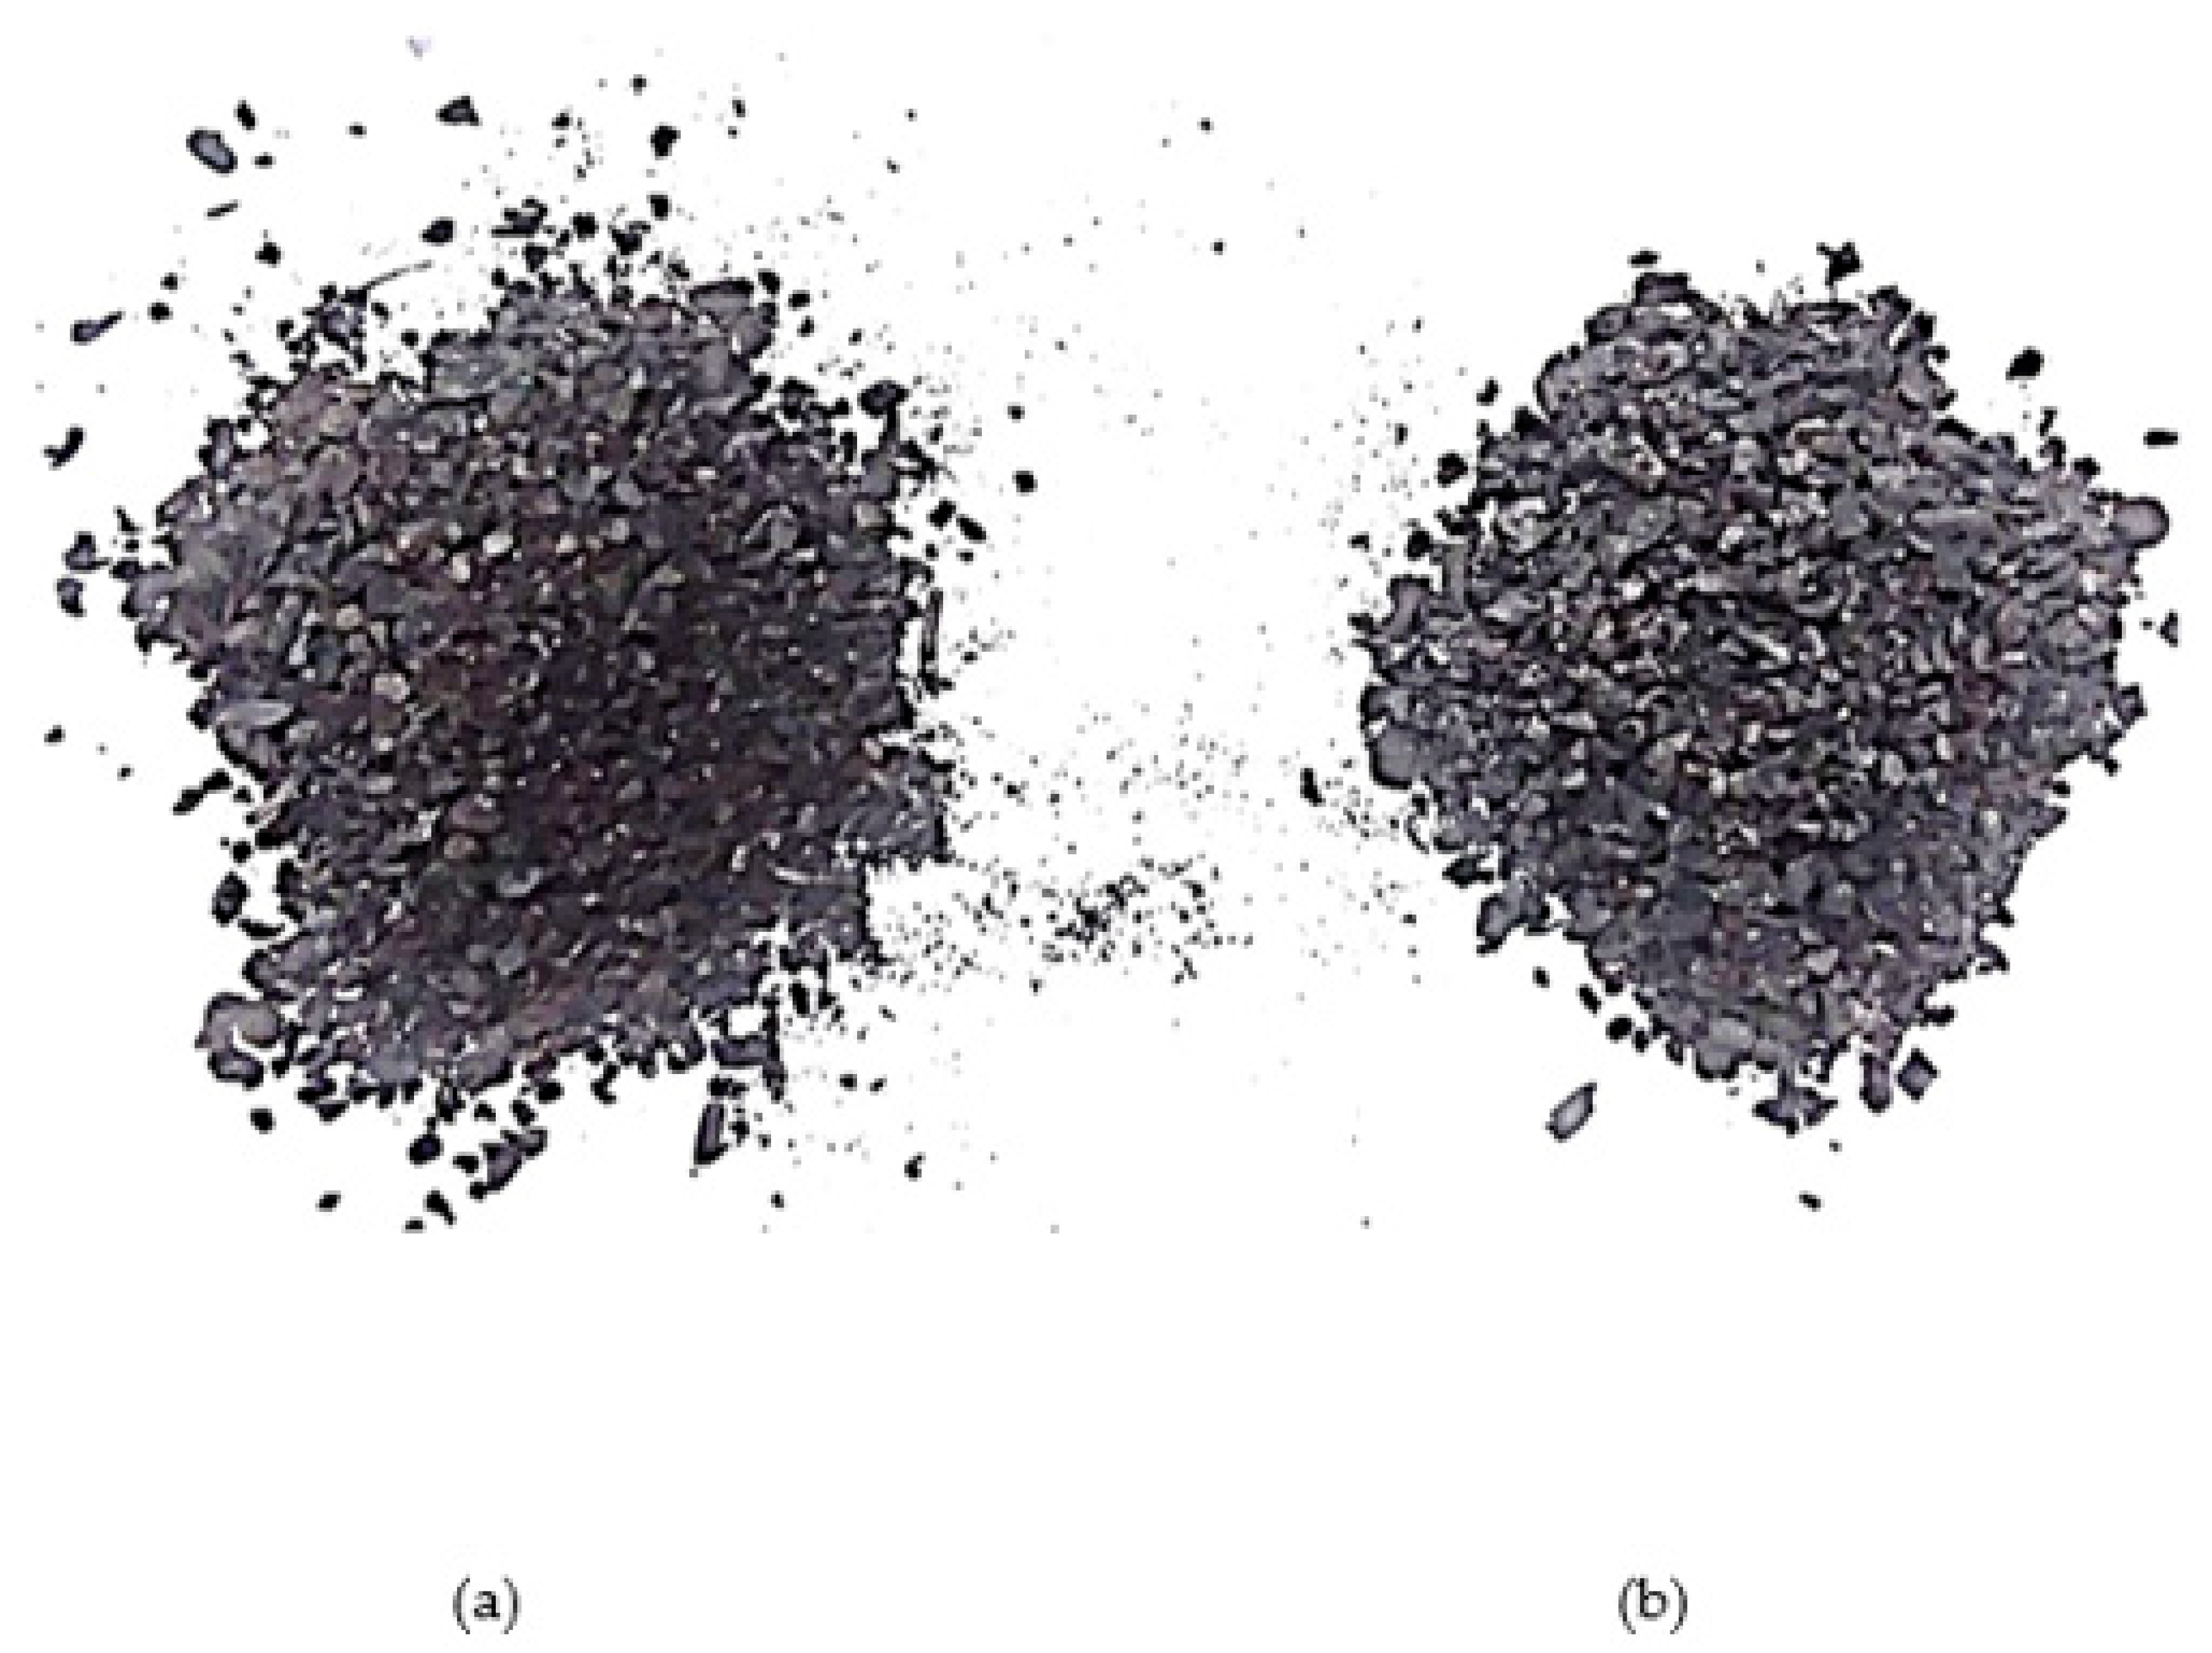
Figure 1. As-received pyrolyzed soybean hulls (PSBH) from lots A and B. Refer to Section 3.1 for particle sizes. (a) Lots A (b) Lots B.
Suschem 02 00035 g001
Figure 2. The stress–strain curve for a neat LLDPE sample subjected to tensile testing.
Suschem 02 00035 g002
Figure 3. The stress–strain curve for a neat PP sample subjected to tensile testing.
Suschem 02 00035 g003
Figure 4. SEM image of GSBH-A particles. The outlined particles were used by the ImageJ software to determine their particle size.
Suschem 02 00035 g004
Figure 5. SEM image of GSBH-B particles. The outlined particles were used by the ImageJ software to determine their particle size.
Suschem 02 00035 g005
Figure 6. Maximum tensile stress of all composites at all weight percentages.
Suschem 02 00035 g006
Figure 7. Strain at maximum stress of all composites at all weight percentages.
Suschem 02 00035 g007
Figure 8. Modulus of elasticity of all composites at all weight percentages.
Suschem 02 00035 g008
Figure 9. The failure patterns of composite samples.
Suschem 02 00035 g009
Figure 10. Heat distortion temperature of LLDPE/PSBH composites.
Suschem 02 00035 g010
Figure 11. Heat distortion temperature of PP/PSBH composites.
Suschem 02 00035 g011
Figure 12. Thermal stability of PSBH-A and PSBH-B fillers.
Suschem 02 00035 g012
Figure 13. SEM images of the fracture surface for LLDPE composite samples with: (a) 50 wt.% PSBH-A (×200); (b) 50 wt.% PSBH-A (×1000); (c) 20 wt.% GSBH-A (×200); and (d) 20 wt.% GSBH-A (×1000).
Suschem 02 00035 g013aSuschem 02 00035 g013b
Figure 14. SEM images of the fracture surface for PP composite samples with: (a) 20 wt.% PSBH-A (×100); (b) 20 wt.% PSBH-A (×1000); (c) 20 wt.% GSBH-A (×250); and(d) 20 wt.% GSBH-A (×1000).
Suschem 02 00035 g014
Table 1. Thermal treatment conditions and results.
Temperature (°C)Feed ReductionCarbon Content
27552%61%
32565%68%
450 (Lot A)80%77%
500 (Lot B)91%85%
Table 2. Melting temperature and heat of fusion for LLDPE/PSBH composites.
Sample NameMelting Temperature (°C)ΔH (J/g)ΔH Rank
Neat LLDPE123.4086.06100.00
10%wt PSBH-A 90%wt LLDPE124.2766.8577.68
20%wt PSBH-A 80%wt LLDPE125.8367.5378.47
30%wt PSBH-A 70%wt LLDPE126.1753.2361.85
40%wt PSBH-A 60%wt LLDPE125.9548.0755.85
50%wt PSBH-A 50%wt LLDPE125.6144.1351.28
10%wt PSBH-A 90%wt LLDPE127.1378.8291.59
20%wt PSBH-A 80%wt LLDPE126.1064.9775.49
30%wt PSBH-A 70%wt LLDPE126.8352.0760.50
40%wt PSBH-A 60%wt LLDPE124.7942.5249.41
50%wt PSBH-A 50%wt LLDPE126.3228.5033.12
10%wt PSBH-A 90%wt LLDPE127.7868.1079.13
20%wt PSBH-A 80%wt LLDPE127.8366.5777.35
30%wt PSBH-A 70%wt LLDPE126.0449.4757.48
40%wt PSBH-A 60%wt LLDPE126.6146.9954.60
50%wt PSBH-A 50%wt LLDPE126.6137.4743.54
10%wt PSBH-A 90%wt LLDPE126.6773.9585.93
20%wt PSBH-A 80%wt LLDPE123.3664.9075.41
30%wt PSBH-A 70%wt LLDPE125.8251.4359.76
40%wt PSBH-A 60%wt LLDPE125.6850.4858.66
50%wt PSBH-A 50%wt LLDPE125.5129.6434.44
Table 3. Melting temperature and heat of fusion for PP/PSBH composites.
Sample NameMelting Temperature (°C)ΔH (J/g)ΔH Rank
Neat PP169.6575.46100.00
10%wt PSBH-A 90%wt PP165.2072.3995.93
20%wt PSBH-A 80%wt PP165.9561.5081.50
30%wt PSBH-A 70%wt PP163.5855.3473.34
40%wt PSBH-A 60%wt PP164.2659.8279.27
50%wt PSBH-A 50%wt PP163.3838.7951.40
10%wt PSBH-A 90%wt PP165.6174.3298.49
20%wt PSBH-A 80%wt PP165.2170.5393.47
30%wt PSBH-A 70%wt PP162.8855.1173.03
40%wt PSBH-A 60%wt PP163.6954.7072.49
50%wt PSBH-A 50%wt PP164.3148.2463.93
10%wt PSBH-A 90%wt PP162.6160.1179.66
20%wt PSBH-A 80%wt PP164.5970.4193.31
30%wt PSBH-A 70%wt PP163.5560.7580.51
40%wt PSBH-A 60%wt PP164.0048.9564.87
50%wt PSBH-A 50%wt PP163.5237.2049.30
10%wt PSBH-A 90%wt PP166.2173.5597.47
20%wt PSBH-A 80%wt PP168.2171.1094.22
30%wt PSBH-A 70%wt PP164.7754.1771.79
40%wt PSBH-A 60%wt PP164.8248.6964.52
50%wt PSBH-A 50%wt PP163.0846.7161.90
Publisher’s Note: MDPI stays neutral with regard to jurisdictional claims in published maps and institutional affiliations.