


Abstract
This study examines tourist perceptions of experiences offered on Airbnb, a sharing economy platform in Türkiye, through qualitative content analysis within the context of e-WOM. The study employs qualitative content analysis to examine 32,666 user reviews collected from Airbnb experiences offered across Türkiye within an experiential value framework. In the study, which analyzed a total of 32,666 user reviews, service excellence, aesthetics, and client return on investment emerged as the most prominent experiential values, while guided experiences were the highest-rated category. The findings revealed that experiential value dimensions vary by city and that hosts’ ratings also influence experiential value. Drawing on these findings, practical recommendations are offered to enhance host visibility and align experience offerings with tourist expectations. This study contributes to the literature by demonstrating how experiential value is created through the co-creation of experiences within the context of digital interaction, local context, and the sharing economy.
1. Introduction
The digital transformation, which has gained momentum over the past few years, has played a key role in the expansion of online platforms and, in particular, the emergence of the sharing economy [1,2]. As digital platforms have become increasingly integrated into tourism, online interactions have increased, and the ways in which tourism experiences are created and interpersonal communication occurs have begun to be reshaped [3,4]. The tourism sector has been particularly affected by this digital transformation, with sharing-based experiences in accommodation, food and beverage, and guided activities gaining considerable popularity.
In the last decade, there has been a transition from a focus on products and services to one on experiences [5,6]. Electronic word-of-mouth communication (e-WOM) has become one of the fundamental elements that guide user perceptions, providing a social and dynamic communication environment where experiential values are reproduced in the process of creating and marketing tourism experiences [7,8,9]. The global spread of the internet and the sharing economy has enabled individuals to share their experiences on online platforms, and e-WOM has become a decisive communicative tool not only in shaping experience-based decision-making but also in structuring tourist experiences themselves [10,11,12].
Although qualitative research has examined e-WOM, experiential value, and sharing economy platforms [13,14] studies that simultaneously address these dimensions across multiple tourism subcategories within the Turkish context remain limited [15,16,17,18]. The integration of sharing-based platforms such as Airbnb into urban infrastructure, combined with the predominantly city-centre orientation of sharing economy tourism, situates this study at the intersection of platform-based tourism and the rapidly changing dynamics of urban destinations [19,20,21]. Urban tourism is becoming increasingly shaped by platform-based systems similar to Airbnb. The digital transformation taking place in the tourism sector—driven by digital word-of-mouth communication and digital interaction—has begun to shape platform-based experiences in modern cities, as well as standard tourism consumption patterns and interactions between tourists and local residents [22,23,24].
Building on this, the study examines experiential value based on e-WOM at the intersection of digital transformation and urban tourism, aiming to analyze tourists’ sharing-based experiences and how they perceive the cities where they experience them.
The originality of the study lies in its comparative analysis of experiential values within the framework of gastronomy, cultural–recreational, guiding, and sporting experiences, and its comprehensive analysis of e-WOM content through qualitative data analysis in the Turkish sample.
This study contributes to the urban tourism literature by grouping online reviews obtained through e-WOM research in the context of different cities in Türkiye and examining how experiential value changes across different urban geographies. Analyzing user reviews of experiences offered on Airbnb in different cities across Türkiye, this study examines the extent to which sharing economy platforms shape tourist perceptions and the multi-layered impact of cities on the formation of experiential value. Therefore, the research offers a new perspective on the contemporary concept of urban destinations shaped by e-WOM and the sharing economy, which involves creating more physical interaction and shared experiences.
The purpose of this study is to analyze users’ online reviews of gastronomy, guiding, cultural–recreational, and sporting experiences offered on the Airbnb sharing platform in Türkiye through e-WOM. It aims to identify the prominent experiential value dimensions and to comparatively evaluate their relationship with variables such as experience types, cities where experiences are offered, and hosting characteristics (years of participation on Airbnb, rating).
Within the framework of qualitative research design, 32,666 online user reviews of 588 experiences listed on the Airbnb platform across Türkiye were analyzed using content analysis in MAXQDA 2022 software. Based on the findings, the aim is to contribute to the theoretical framework by analyzing how experiential values are conveyed through e-WOM.
2. Literature Review
In the tourism sector, the impact of digitalization has driven a shift from product-centred to service-centred, and ultimately to experience-centred models of value creation [25,26]. The digitalization process has significantly transformed tourists’ decision-making behavior. Individuals have begun making purchasing decisions by reviewing online evaluations from users who have previously experienced the product or service [18,26]. It stands out as a decisive factor, particularly in tourist decision-making processes such as destination selection and accommodation options [27,28,29,30].
The literature emphasizes that e-WOM, which differs from traditional forms of communication in terms of its global accessibility and permanence, plays an important role in increasing consumer confidence [29,31,32,33]. It provides a high level of credibility among tourists, particularly because the source of the message is independent [30,34,35]. Research conducted in this direction shows that e-WOM has a positive effect on customer loyalty and repurchase intention [36,37]. Studies have also been conducted showing that online reviews directly influence user decisions, particularly in the sharing economy [38,39].
Tourists can compare experiences offered in different parts of the world before purchasing any product or service, enabling them to make more informed choices [40]. The sharing economy lies at the intersection of digitalization and experiential consumption, offering a new technological model based on temporary use, rental, or sharing rather than ownership of goods or services [41,42].
The tourism sector has become more personalized and authentic, thanks to numerous platforms such as Airbnb, Uber, BlaBlaCar, Eatwith, ToursByLocals, and Withlocals [20,43]. Platforms such as Withlocals and ToursByLocals are pioneering a new approach in the field of tour guiding by establishing a direct bridge between tourists and the local community [44,45].
Today, tourists aim to gain meaningful value from their tourist trips rather than consuming goods or services [46]. This value is explained by the concept of “experiential value” in tourism. The theoretical foundations of experiential value have been addressed in the literature within the framework of models developed by Holbrook [47], Schmitt, [48], Pine and Gilmore [49], Mathwick, Malhotra and Rigdon [50].
In recent years, the concept of experiential value has become quite important in the development of urban tourism. In tourist cities, tourists no longer settle for just visiting physical places; they interact with the local people to explore the local culture in depth, listen to the history of the city directly from the people of that region, and participate in tourism activities. This transformation reveals that the tourist experience goes beyond being a consumer service, establishing a multi-layered and equally personalized relationship with cities and their sociocultural fabric.
Holbrook [47], a pioneer in the development of experiential value theory, defines value as an interactive, reciprocal, and desirable experience; he states that this value is based on the benefit that arises from the individual’s interaction with the product or service. Pine and Gilmore [49], whose dimensions are frequently used in the literature, define the experience as not only entertaining the consumer but also capturing their attention, and they examine the experience along the dimensions of aesthetics, education, entertainment, and escape.
Using the value typology developed by Holbrook, [47] and Pine and Gilmore [49], Mathwick et al. [50] developed a new experiential value model for online shopping. In experiential value measurement, four fundamental dimensions are used: “client return on investment”, “entertainment”, “service excellence” and “aesthetics”. The aesthetic dimension reflects the visual and emotional appeal of experiences; entertainment measures the enjoyment users derive from experiences; service excellence measures the perceived level of professionalism and users’ perceptions of quality; and client return on investment reflects the value gained from the experience relative to the time and money spent, as measured by perceived efficiency. Collectively, Mathwick et al. [50], Holbrook [47] and Pine and Gilmore [49] have demonstrated that experiential value is not only an individual perception but also a multidimensional structure that guides consumer behavior. Similarly, Holbrook [47] and Pine and Gilmore [49] emphasized that experiential values such as service excellence and aesthetics come to the fore in the context of gastronomic tourism.
Airbnb is one of the most common examples of the sharing economy in the tourism sector, a system that brings together individuals looking for a place to stay with homeowners who have space to share [51]. Founded in 2008, this digital platform enables individuals to temporarily rent out their living spaces to tourists, offering an alternative model to traditional accommodation [20,52]. According to 2024 data, Airbnb operates in more than 220 countries, listing over 8 million accommodation units and accumulating more than one billion total guest arrivals since its founding [53].
The value Airbnb offers globally is not limited to accommodation. With its “Airbnb Experiences” option, this platform also offers its users a variety of different experiences, providing opportunities to engage directly with unique, cultural, and local life across a wide range of activities, including gastronomy, guided tours, cultural events, and sporting activities [19].
As with all other online platforms, reviews on the Airbnb platform directly influence how experiences are perceived and the decision-making processes of potential tourists. The platform, where online experience content is also shared intensively, contributes to its significant position in the production of experiential value in the digital age [54]. Guttentag [55] emphasizes that the most important difference between the platform and traditional hospitality is the social bonds that develop among users; Bardhi et al. [42] explain this interaction using the “co-creation” model. Airbnb’s personalized and authentic experiences, combined with factors such as price advantages and direct contact with local residents, have begun to reshape the traditional concept of tourism [19,51,56].
3. Methodology
3.1. Research Design
Since the aim of this study is to examine e-WOM narratives obtained from the online sharing economy platform Airbnb within the framework of experiential value, a qualitative research approach has been adopted.
The tourism literature highlights the contribution of e-WOM content to tourist perceptions and the processes of co-created experiences [21,44,57,58]. In the field of the sharing economy, qualitative approaches offer the advantage of examining emotional and experiential dimensions that go far beyond quantitative evaluation [45,59,60,61,62]. For this reason, the study examines online reviews on Airbnb using qualitative content analysis.
Studies on the sharing economy in the tourism literature focus on themes such as the reasons for choosing high-level platforms, perceptions of trust, purchase intentions, and sustainability [44,57,58,60,61,63,64,65,66,67,68].
This study analyzes gastronomy, guided tours, cultural–recreational, and sports tourism experiences offered on the Airbnb platform in Türkiye using the e-WOM method, based on users’ online reviews. It is considered important to demonstrate how the experiential values prioritized in the study differ (such as listing duration on Airbnb, ratings, etc.).
The primary objective of this study is to analyze the gastronomy, guiding, cultural–recreational, and sports tourism experiences offered on the Airbnb sharing platform in Türkiye through e-WOM, based on users’ online reviews, and to identify the experiential value dimensions that stand out on the platform. The study examined how the experiential values that users prioritize differ based on the type of experience, the cities where experiences are offered, and hosting characteristics (years of participation on Airbnb, ratings, etc.).
3.2. Data Collection and Sample
The research sample is based on 588 experiences offered on the Airbnb sharing platform in Türkiye (pottery making, camel safaris, hot air balloon experiences, etc.) and 32,666 online reviews related to these experiences. The research data used in this study was obtained from the https://www.airbnb.com.tr/experiences (accessed on 10 May 2023–18 September 2023) platform, where Airbnb experiences are shared publicly. Before analyzing the data in MAXQDA, duplicate, incomplete, and empty comments were removed. To ensure consistency in coding, comments written in languages other than English were translated into English, and text-based expressions were taken into account.
Creswell [14] argues that researchers cannot develop any theory from data without mastering the subject matter. Based on this explanation, the experiential value literature and the data were analyzed using open coding. To ensure the validity and reliability of online reviews with e-WOM, the scale frequently recommended in the literature was used as a basis for operation. The consistency of the coding was tested, and as a result of the reviews conducted, it was concluded that the scale developed by Mathwick et al. [50] and widely preferred in the literature provided the ideal framework for the research.
Accordingly, the research was conducted based on 588 experiences offered in 9 different provinces of Türkiye. Table 1 shows the experiences offered throughout Türkiye and the number of online reviews for these experiences.
Table 1.
Online Evaluation Numbers for Experiences Offered in Türkiye.
Ethical Approval Statement
The study did not require any formal ethical approval as it did not involve direct interaction with human participants. All research data was obtained from publicly available and anonymized user reviews on the Airbnb platform. The research data is open access and does not contain any personal or identifiable information. Therefore, the study complies with ethical research standards.
3.3. Measurement Tool
The experiential value scale developed by Mathwick et al. [50] has been conceptually adapted to Airbnb experiences while preserving its theoretical foundation.
The scale developed under the leadership of Mathwick et al. [50] has been used in many studies in tourism research to investigate the accommodation experience [24,46,69,70], examine customers’ experiential value [71], investigate customer satisfaction [72,73,74,75,76,77,78,79,80], examine the experiential value from a gastronomic perspective [81,82,83,84,85], and tourists’ revisit and recommendation levels [76,86,87,88,89,90].
Mathwick et al. [50] developed a four-dimensional scale consisting of aesthetics, entertainment, client return on investment, and service excellence to measure customers’ experiential values. The statements on the scale have been adapted to align with Airbnb experiences, and terms such as “online shopping” have been revised to “experience.”
3.4. Data Analysis
Qualitative research was deemed the most appropriate method for this study in order to explore users’ perceptions regarding their experiences in their natural environment [75,76,77]. Content analysis, which offers a systematic and objective way of defining and measuring facts, was preferred in the study to achieve the most accurate results [91,92,93,94]. To examine the experience patterns that stand out in user experiences with e-wom, interpretive content analysis was conducted using MAXQDA 2022 software. MAXQDA is a data analysis software that enables the systematic coding and thematic interpretation of textual data [95,96]. This software allows researchers to analyze large-scale datasets and visualize them through coding [96].
Reliability and Validity
In qualitative research, the reliability of findings can be ensured through agreement among coders, consistency of coding, coding frequency, and code overlap rate [96,97,98,99]. It has been noted that, similarly, using two coders in addition to the authors helps ensure analytical reliability in large-scale online analyses [96,100]. In qualitative studies, having two independent experts in addition to the researchers reach consensus in the analyses increases the reliability of the findings [97]. Oliveira et al. [95] argue that coding should not be arbitrary and that codes should be tested by two separate experts. In the study, experiential value themes were coded by two independent experts; to test the reliability of the coding, the agreement percentages of the independent coders were examined and made consistent with research standards. According to Sevilmis et al. [99], Rädiker et al. [94], Oliveira et al. [95] if both coders assign the code to a specific data segment, it is considered a match; however, if one encoder assigns a code and the other does not, reliability is lost. A match is accepted if the same code has been assigned at least once by both coders [100]. The fact that the code is assigned at least once by two coders or that neither coder assigns the same code ensures similarity and reliability in the studies [95].
Forty-eight online reviews of a randomly selected experience were coded by two separate academic experts, excluding reviews by authors who had previously used Airbnb. The code map for a single document is presented in Table 2.
Table 2.
Reliability of Experiential Value Codes.
Hammarberg et al. [90], proposed the following formula to ensure similarity and reliability in qualitative research:
Reliability = (Agreement)/(Agreement + Disagreements)
In the formula, the “concordance” rate refers to the percentage of matching codes among coders, while the “discordance” rate refers to the percentage of non-matching codes. When examining the similarity ratio among coders, the code “Experience excellent-unique” was coded 21 times by the 1st coder and 24 times by the 2nd coder. It was observed that agreement was reached in 21 codes, while it was not reached in 3 codes. The similarity of the code has been calculated as 21/(21 + 3) = 0.88. Multiplying the similarity ratio by 100 gives the similarity percentage. This percentage has been calculated as 88%. This result demonstrates a high degree of agreement and reliability between the two coders.
The similarity percentage for the statements “The way the experience is presented is engaging and unforgettable”, “The experience is so good it’s worth the price”, “The experience that makes you forget everything else”, “Experience away from the routine”, “Flexible experience, filling all the time” and “The experience area is aesthetically appealing” was found to be 100%. It was determined that the dimensions “pleasurable experience”, “experience with economic value”, and “high price for the quality of the experience” were not coded by either coder. The fact that neither coder assigned the same codes indicates that the reliability of these dimensions has been preserved. Overall, the scale has been determined to be highly reliable at a level of 91%.
4. Data Analysis and Findings
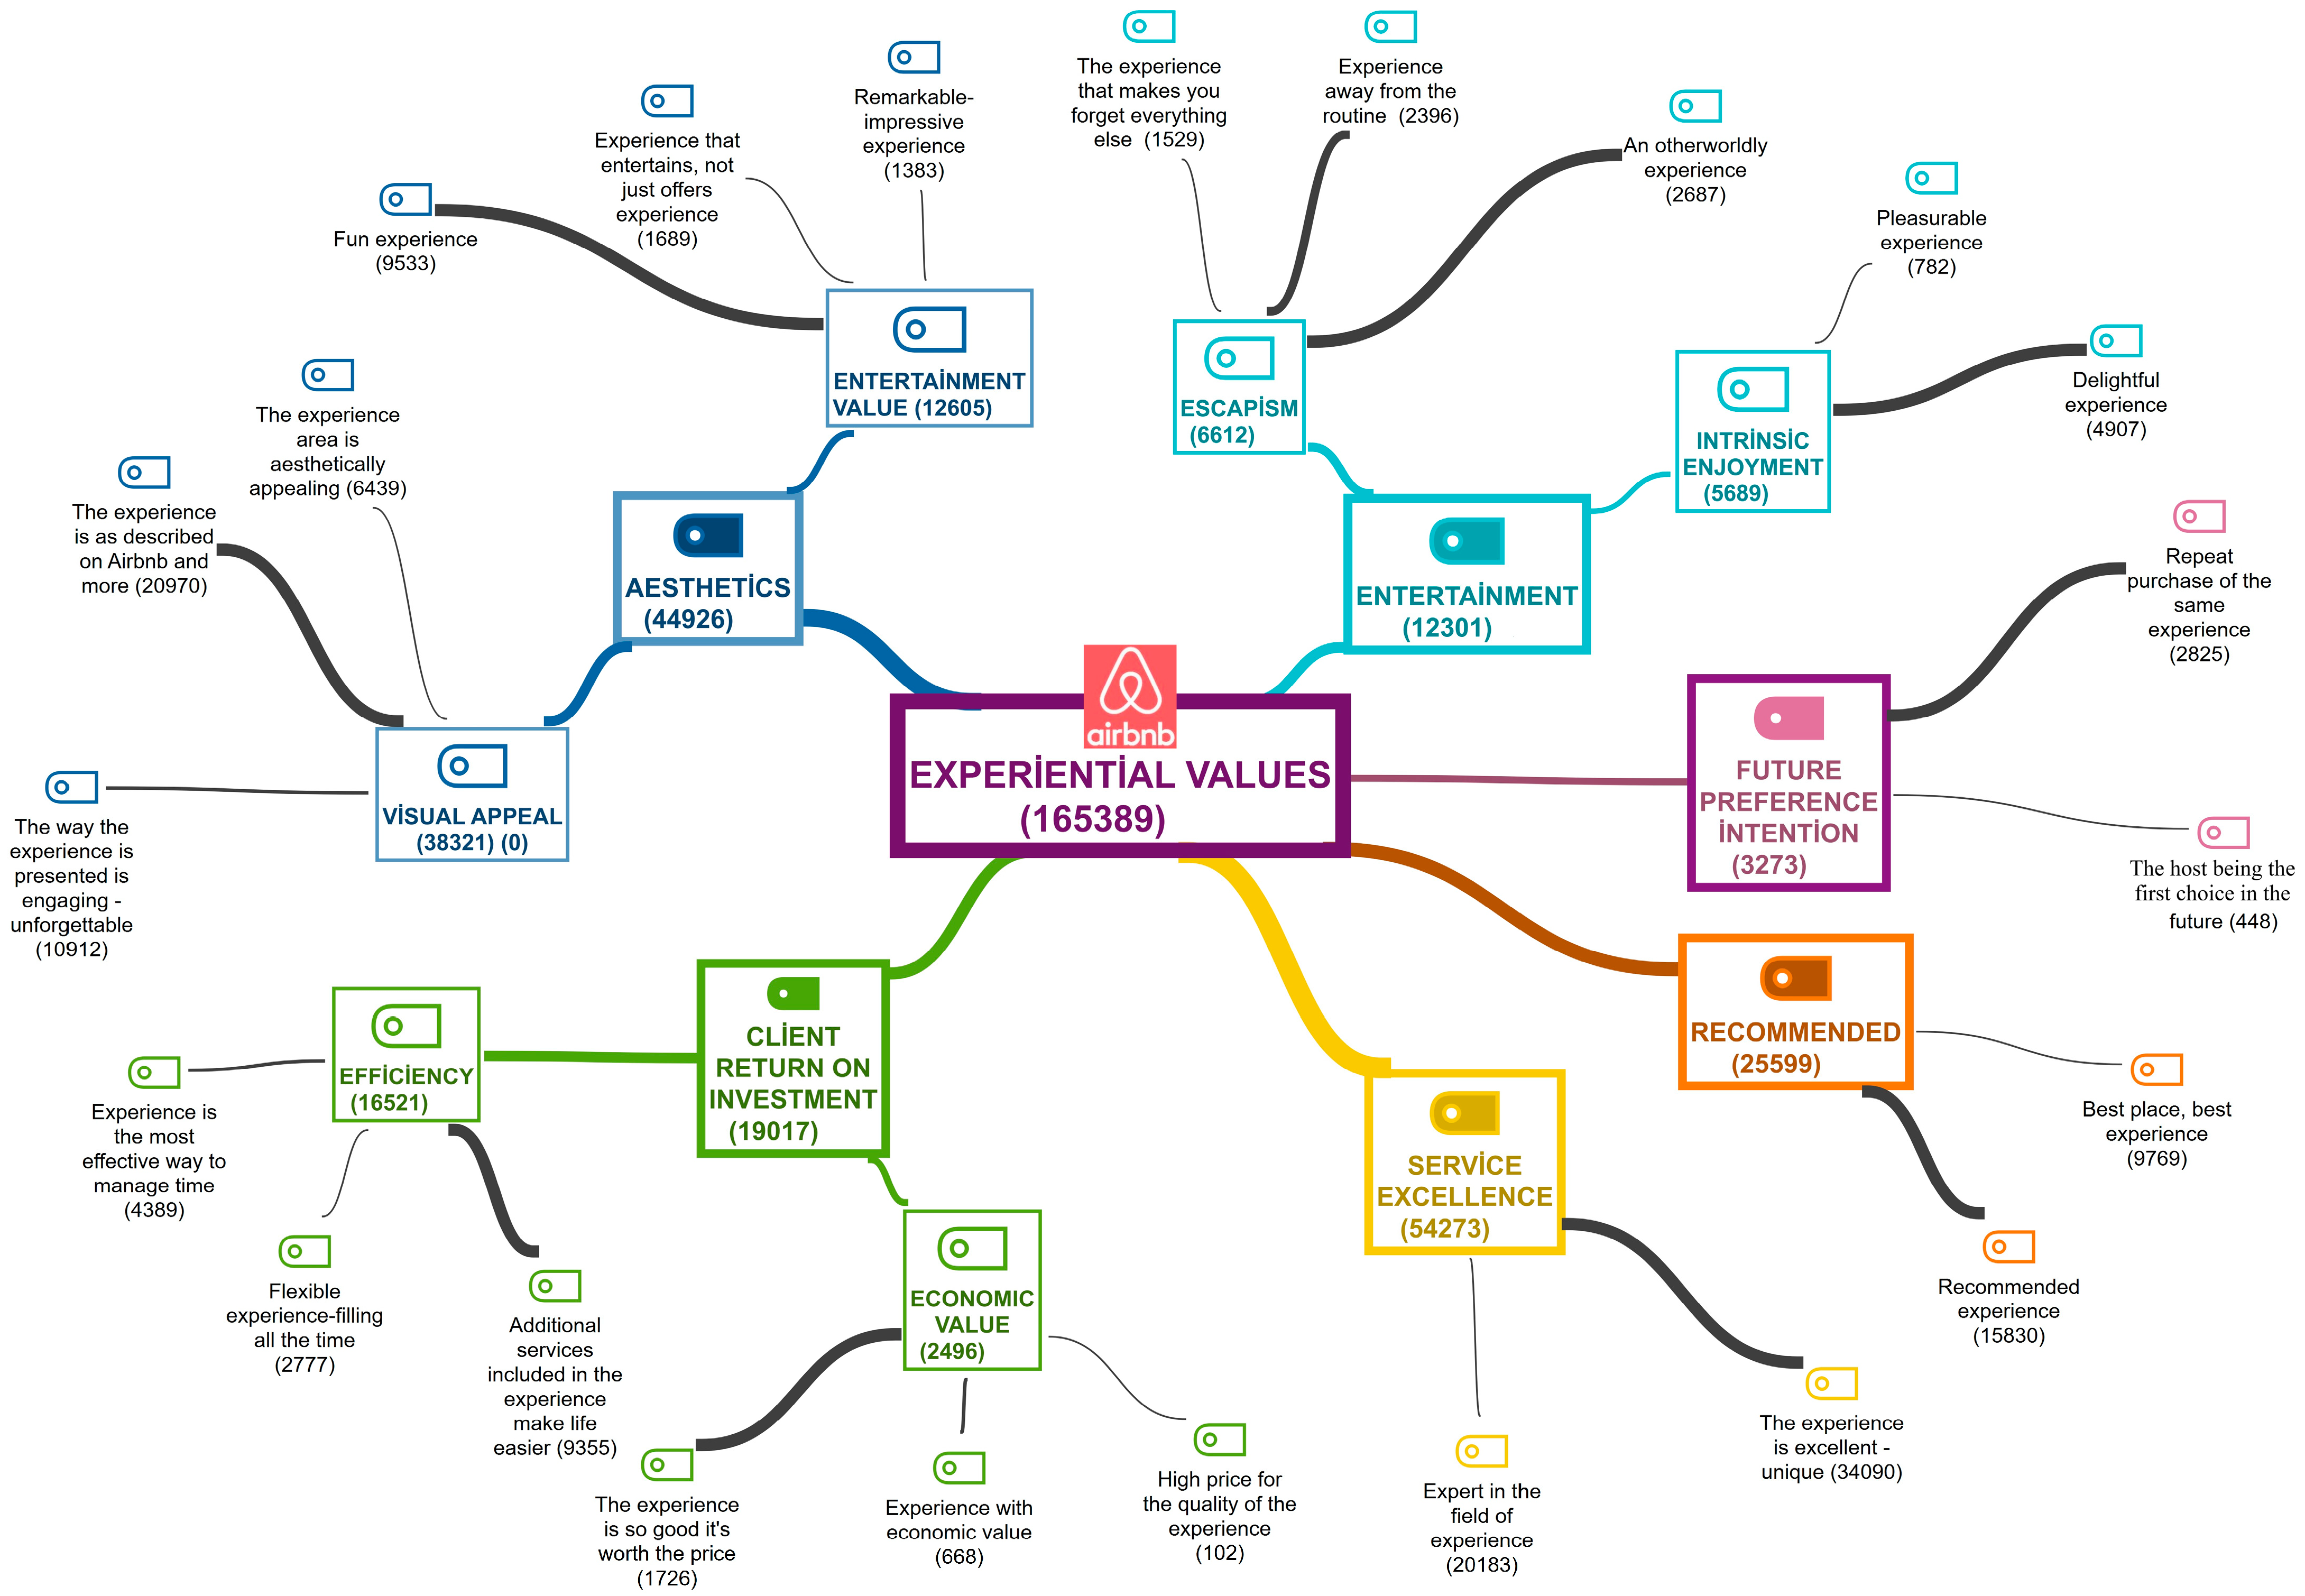
A total of 32,666 online reviews for 588 experiences offered across Türkiye on the Airbnb website were analyzed for this study. Figure 1 presents the code map and number of codes for experiential values.
Figure 1.
Experiential Value Code Map. Source: Information compiled by the authors based on Airbnb review data [2025]. Note: Different colors are used to distinguish the thematic dimensions and sub-dimensions of experiential values.
The code map shows the four dimensions of experiential value (aesthetics, entertainment, service excellence, and client return on investment) along with future-oriented preference and recommendation dimensions. Bringing together elements such as aesthetics, entertainment, service excellence, and client return on investment under the theme of experiential value aims to reveal the emotional and functional dimensions of experiential value at Airbnb. This approach strengthens the theory of experiential value by demonstrating that tourist experiences can be evaluated not only in terms of service quality but also through emotional, symbolic, and spatial meanings.
Within a total of 165,389 codes related to experiential values, “visual appeal” was coded 38,321 times, “entertainment value” 12,605 times, “escapism” 6612 times, and “intrinsic enjoyment” 5689 times in the aesthetic dimension. Under the heading of client return on investment, “efficiency” was coded 16,521 times, while economic value was coded 2496 times. Service excellence was coded 54,273 times, recommendation was coded 25,599 times, and future preference was coded 3273 times.
The statements under the aesthetic dimension and sub-theme of “visual appeal” that achieved the highest coding rates are; “the experience is as described on Airbnb and more” (coding frequency = 20,970); “the way the experience is presented is engaging-unforgettable” (coding frequency = 10,921); and “the experience area is aesthetically appealing” (coding frequency = 6439). Research findings indicate that Airbnb experiences create a favorable aesthetic impression. The aesthetic dimension under the sub-theme of “entertainment value” includes the expressions “fun experience” (coding frequency = 9533), “experience that entertains, not just offers experience” (coding frequency = 1689), and “remarkable-impressive experience” (coding frequency = 1383) which express the level of enjoyment users derive from experiences.
The entertainment dimension’s “escapism” sub-theme expresses users’ desire to get away from their daily lives. Expressions such as “an otherworldly experience” (coding frequency = 2687), “experience away from the routine” (coding frequency = 2396), and “the experience that makes you forget everything else” (coding frequency = 1529) prove this point.
In the “efficiency” sub-theme of client return on investment, the statement “additional services included in the experience make life easier” (coding frequency = 9355), was the most notable among users, and it was determined that additional services offered beyond user expectations increased satisfaction levels.
The statements “experience is the most effective way to manage time” (coding frequency = 4389) and “flexible experience-filling all the time” (coding frequency = 2777) were also frequently mentioned. The statement “the experience is so good it’s worth the price” (coding frequency = 1726) stands out, while “experience with economic value” (coding frequency = 668) and “high price for the quality of the experience” (coding frequency = 102) were coded in a very limited number of cases.
The service excellence dimension has been the most frequently coded expression in the overall experiential value distribution. The statements “the experience is excellent–unique” (coding frequency = 34,090) and “experts in the field of experience” (coding frequency = 20,183) reveal that users value the knowledge and professionalism of hosts as much as they value the excellence and quality of the experience.
In terms of recommendations and future preferences, the statements “recommended experience” (coding frequency = 15,830) and “best place-best experience” (coding frequency = 9769) indicate that Airbnb users tend to share their positive experiences. “Repeat purchase of the same experience” (coding frequency = 2825) and “the host being the first choice in the future” (coding frequency = 448) reflect the desire to purchase experiences from Airbnb again.
Table 3 shows, in a cross-tabulation, the frequency of coding for experiential value dimensions in the categories of guided, gastronomic, cultural, recreational, and sporting experiences offered on Airbnb.
Table 3.
Distribution of Experiential Values Based on the Experiences Offered.
The colors, shown in the cross-tabulation table at the intersection of the variables corresponding to the codes, indicate the frequency of coding. The green intersections indicate that those values are coded most frequently, while the white intersections indicate that they are coded less frequently. Experiential values were most frequently coded in guidance experiences (52.1%) and least frequently in sporting experiences (4.8%). The primary reason for the relatively low frequency of coding related to sports experiences is linked to the limited variety of experiences offered in the sports sector; at the same time, it also stems from the lower number of participants in such activities or the lower number of online reviews compared to guided and cultural experiences. Gastronomic experiences have a coding frequency of 18.5%, while cultural–recreational experiences have a coding frequency of 24.5%.
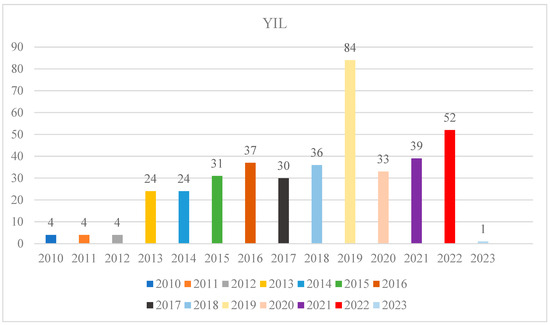
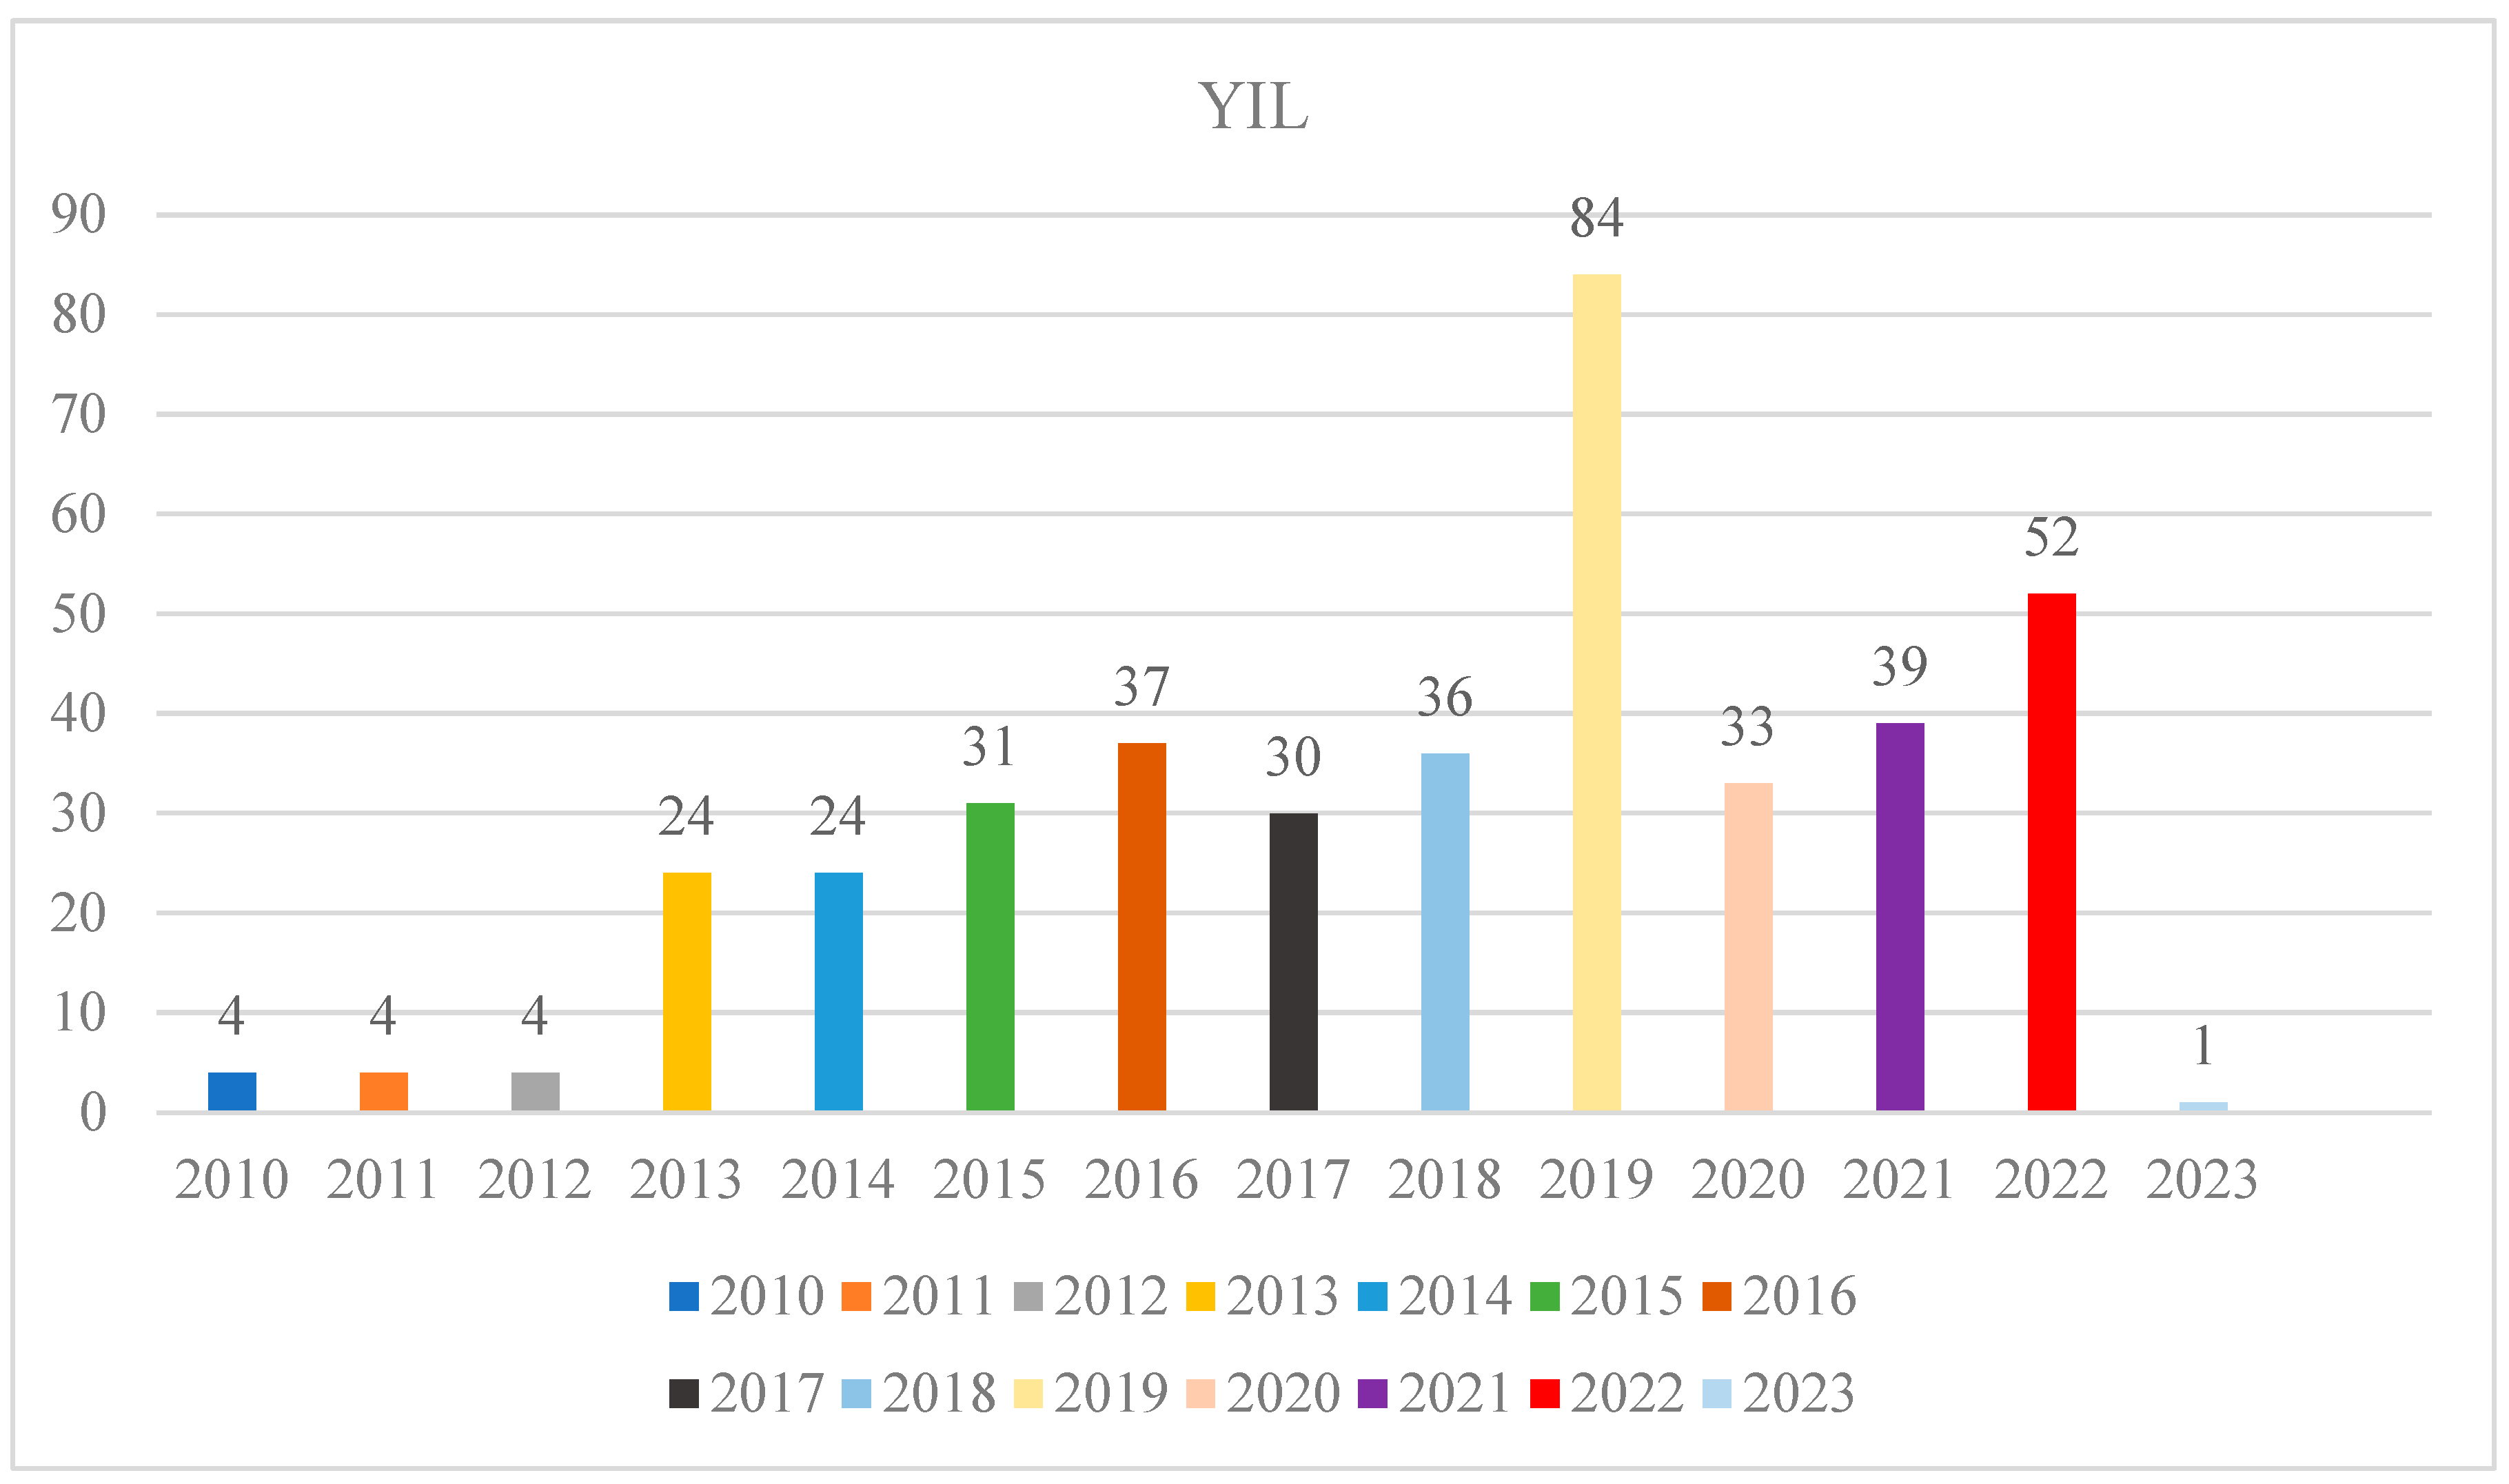
Figure 2 shows the distribution of years in which users offering experiences on the Airbnb website registered.
Figure 2.
Years in Which Individuals Offering Experiences on Airbnb Joined Airbnb as Hosts. Source: Information compiled by the authors based on Airbnb review data [2025].
Figure 2 shows that 84 homeowners have been hosting on Airbnb since 2019, while 52 homeowners have been hosting since 2022. In contrast, it was observed that the number of experiences offered by hosts in 2010, 2011, 2012, and 2023 was relatively lower than in other years. The increase in the number of hosts joining the platform in 2019 may be attributed to their offering more services on the platform, likely in an effort to restore pre-pandemic tourism levels or to specialize over time and offer a wider variety of experiences.
Table 4 shows the frequency of coding for experiential value dimensions, with a cross-tabulation of the distribution of Airbnb users offering experiences according to their year of hosting.
Table 4.
Distribution of Experiential Values Based on Year of Hosting.
In the table, the intersection points with the greenest shades represent the experiential value dimensions that were coded most frequently and are most relevant across years, while the shades ranging from green to white represent the experiential value dimensions that were coded least frequently and are least relevant. Table 4 shows a cross-tabulation revealing a significant relationship between the year of hosting on Airbnb and the coding frequency of experiential value dimensions. In 2019, hosts achieved the highest code rate of 20.9% in terms of aesthetics, entertainment, service excellence, and return on investment, followed by the experiences offered by those who started hosting in 2022 (13.0%) and 2016 (9.2%). However, it was observed that homeowners lagged behind in online ratings in 2011 (1.0%) and 2012 (1.0%).
Differences in the distribution of experiential value dimensions using the Code Matrix by province are shown in Table 5.
Table 5.
Code Matrix Scanner for Experiential Values by Province.
The squares with the largest font size and the reddest color represent the most coded experiential value dimensions, while those with the smallest font sizes and the bluest color represent the least coded experiential value dimensions. The most frequently coded experiential value dimensions in Istanbul, Antalya, and Izmir were in order, “the experience is excellent and unique”, “experts in the field of experience” and “the experience is as described on Airbnb and more”. A similar distribution has emerged in the provinces of Nevsehir, Mugla, and Bursa. In Ankara, unlike other provinces, the code that stood out was “the experience is as described on Airbnb and more”; in Trabzon, it was “experts in the field of experience”; and in Denizli, it was “the experience is excellent-unique”.
When the code matrix map is examined overall, it is observed that the codes “high price for the quality of the experience” in Ankara and Trabzon, “experience away from the routine,” and “remarkable-impressive experience” in Denizli were not evaluated online by any user. This situation reveals that some codes show a similar distribution across provinces, while others have a different distribution.
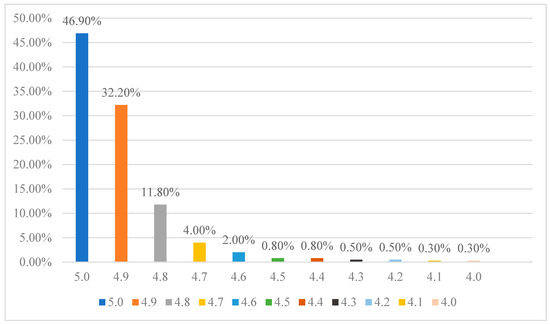
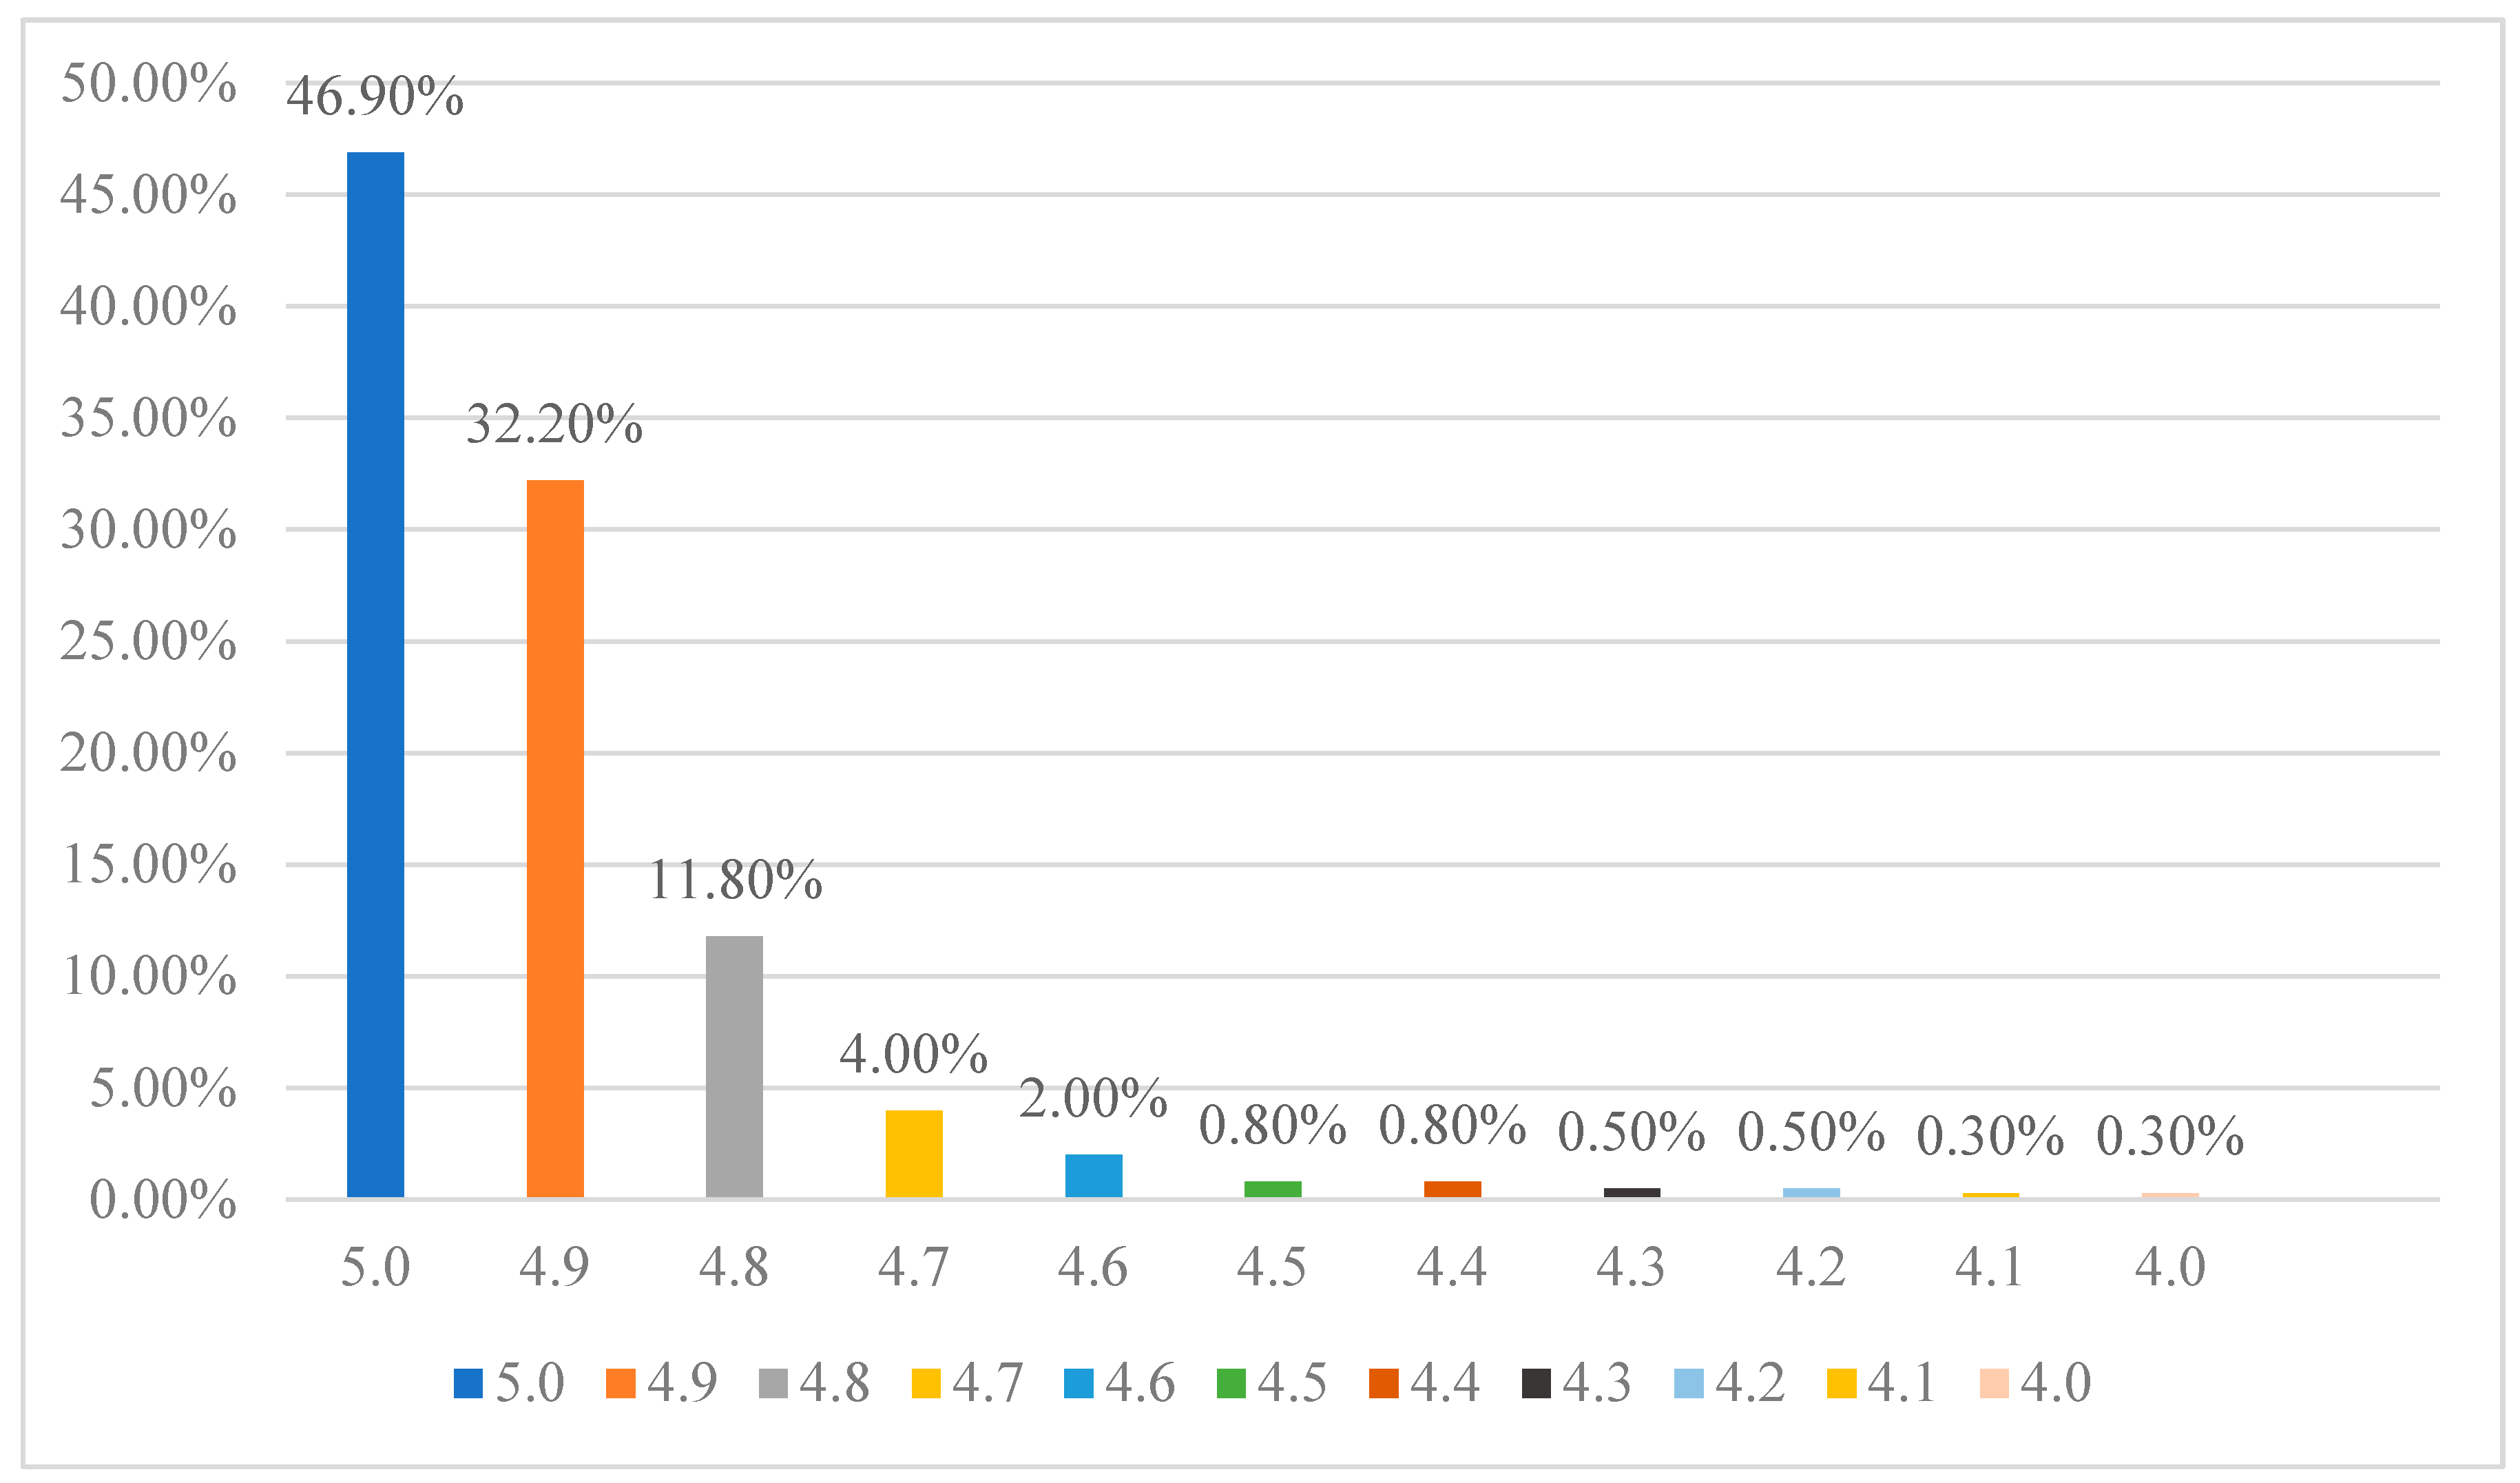
Figure 3 shows the distribution of scores given to hosts by users.
Figure 3.
Airbnb Rating Distribution. Source: Information compiled by the authors based on Airbnb review data [2025].
As shown in Figure 3, 47% of users rated hosts with the highest rating of 5.0, 32% rated them 4.9, and 12% rated them 4.8.
Table 6 presents the score distribution by province, based on the frequency of common coding in the code matrix scanner.
Table 6.
Score Distribution by Province—Code Matrix Scanner.
The colors and font sizes in the code matrix indicate the frequency with which the scores are coded. The largest, red circles represent the most frequently coded scores, while the smallest, blue circles represent scores that are coded relatively less frequently. It has been observed that experiences offered on Airbnb are rated at a high level between 4.8 and 5.0 points, with 5.0 points standing out in particular. While users in Antalya, Izmir, Istanbul, Mugla, and Nevsehir gave the highest ratings to experiences, it was found that in provinces other than Istanbul and Denizli, ratings ranged between 4.4 and 5.0, and that some experiences in Istanbul received a rating of 4.0.
Variable Code Co-Formation Models
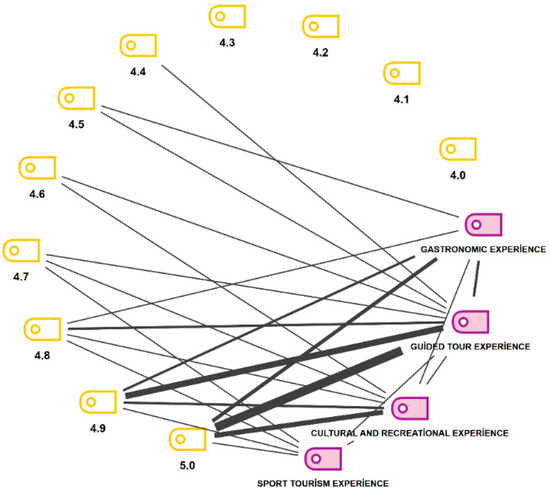
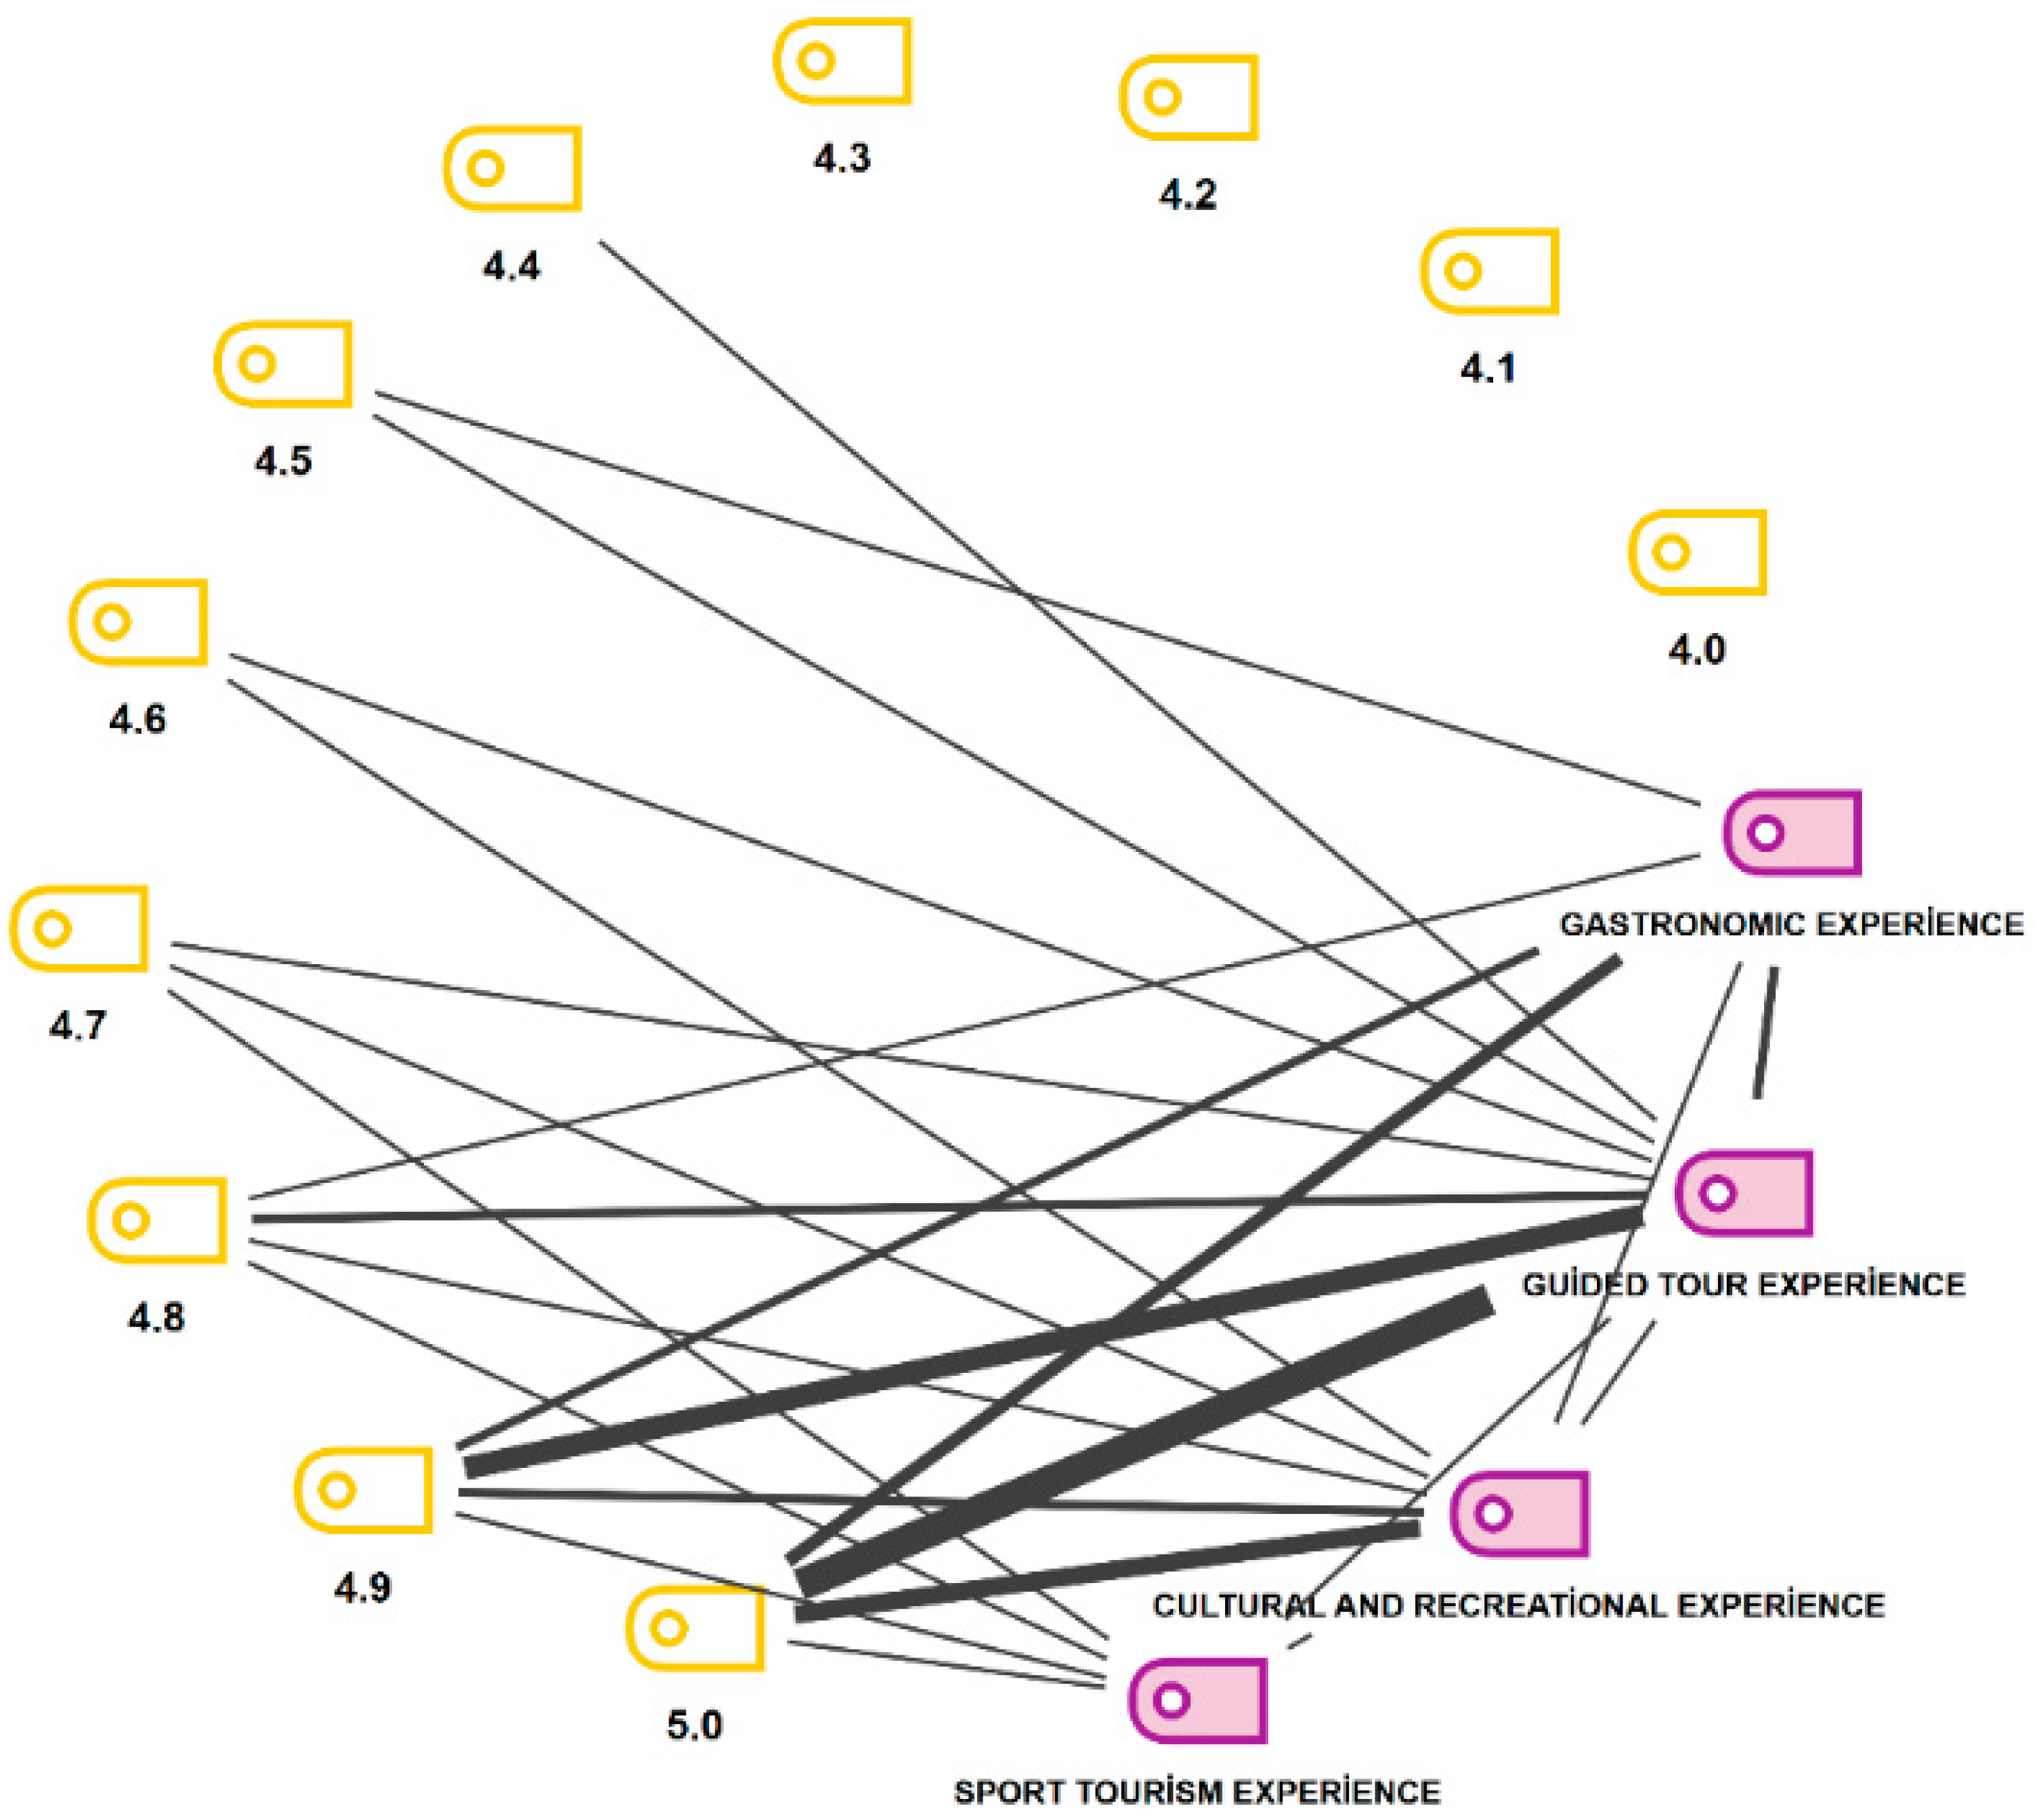
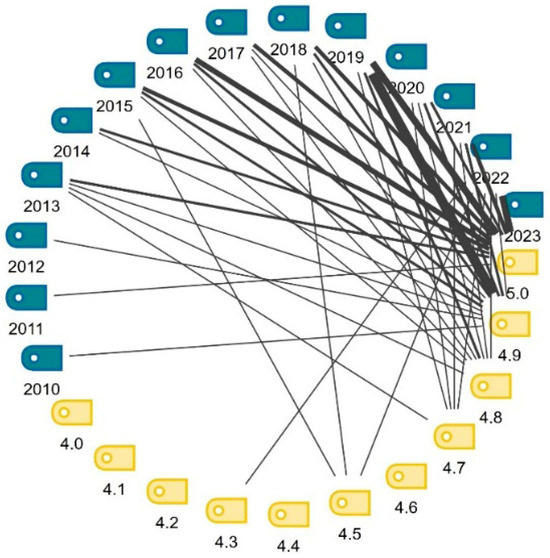
In the model, the connections between variables represent the level of relationship, with thick lines indicating strong relationships and thin lines indicating relatively weaker relationships. The yellow boxes in Figure 4 represent scores, while the purple boxes represent the type of experience.
Figure 4.
Experience Type and Score Code Co-occurrence Models. Source: Information compiled by the authors based on Airbnb review data [2025].
On Airbnb, guided experiences were frequently rated 5.0 and 4.9, the highest scores, while sporting and gastronomic experiences were often rated 5.0, the highest score. Furthermore, it was observed that relatively lower scores, such as 4.4, were again given to guiding experiences (Figure 5).
Figure 5.
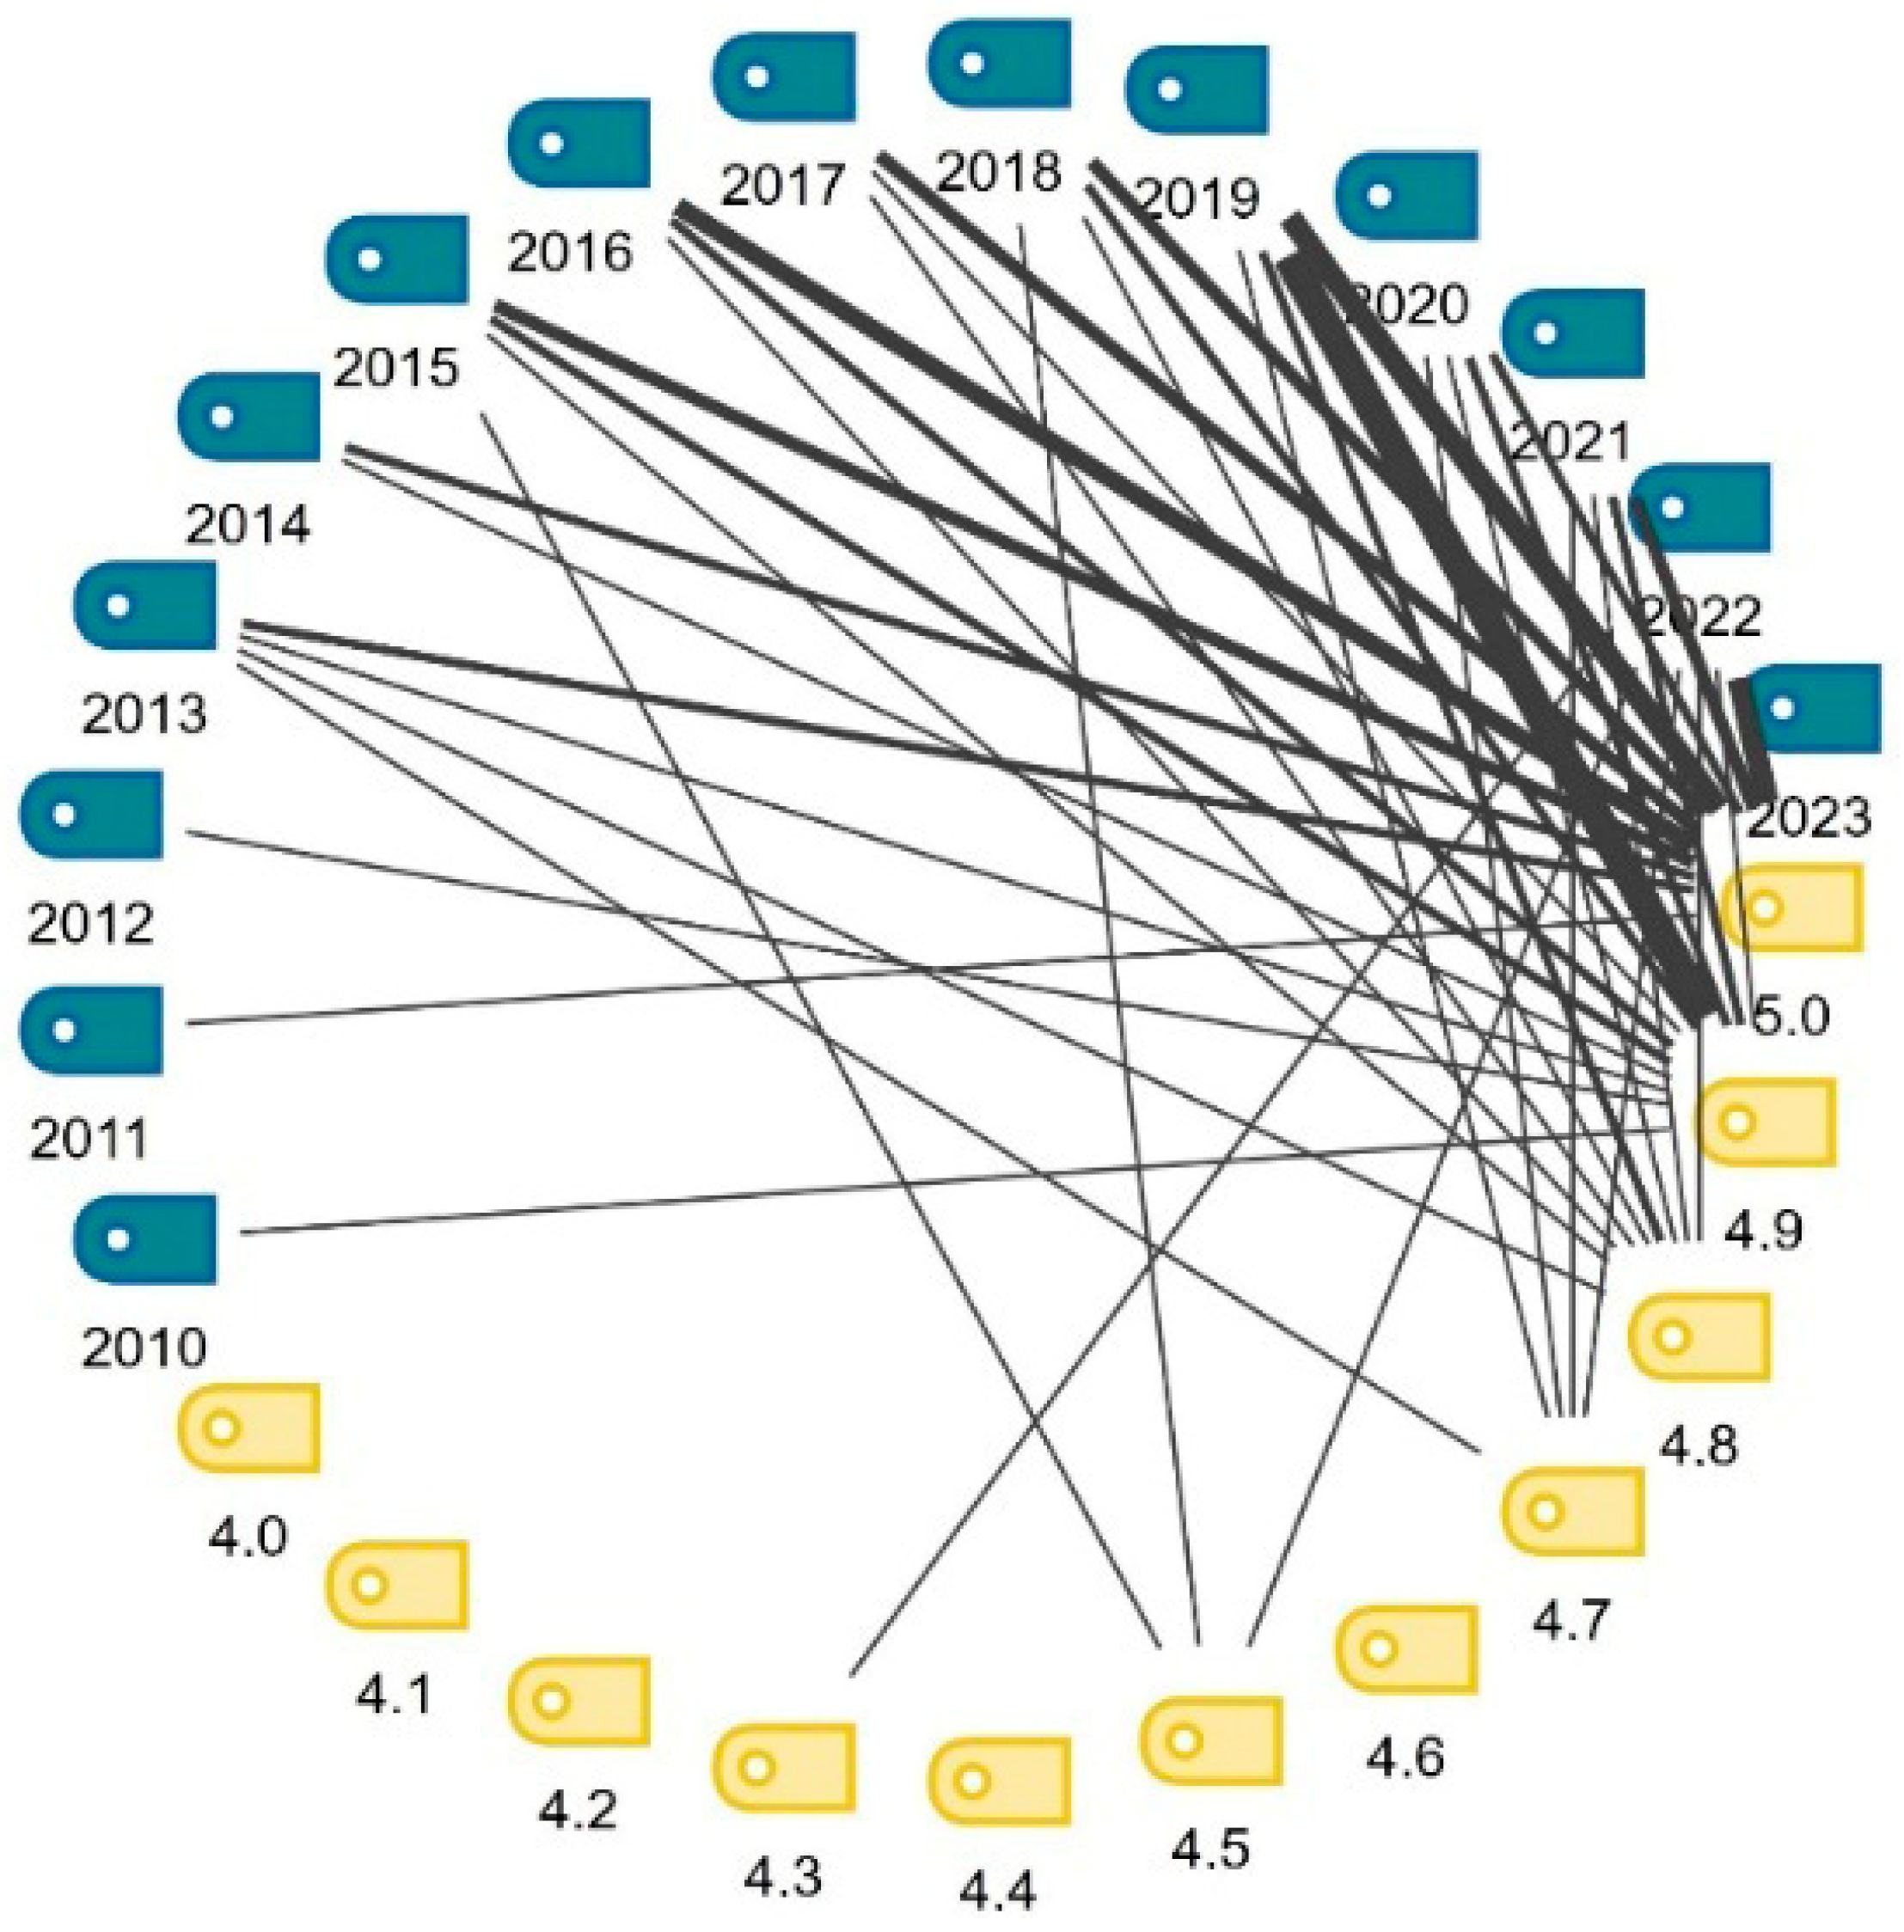
Models of Co-occurrence of Hosting Year and Score Codes. Source: Information compiled by the authors based on Airbnb review data [2025].
Figure 5 shows the relationship between the hosting year and user scores. Green boxes represent the hosting year, while yellow boxes represent the scores. Users who started hosting on Airbnb in 2019 received ratings between 4.9 and 5.0, while those who started hosting in 2022 received a rating of 4.3.
5. Discussion
The findings of the study highlight the socio-economic impacts of sustainable tourism. It has been determined that local hosts are economically supported through local engagement, cultural authenticity, and personalized experiences, and that this contributes to the diversification of tourism revenue in the destinations included in the study. The sharing economy has been linked to the creation of experiential value in terms of cultural tourism and destination sustainability and has helped strengthen community-based tourism activities in the destination in question.
By highlighting the role of e-WOM in supporting local economies and increasing their visibility through Airbnb experiences, this study will contribute to community-based tourism initiatives and the field of sustainable urban tourism. It also shows that on sharing economy platforms, experiential value takes precedence over service performance and is shaped by interactive and emotional dimensions. This finding highlights the emotional dimension of sharing economy experiences and the importance of co-creation, thereby offering a fresh perspective on experiential value theory.
The findings confirm many studies in the literature [55,101], while the limited consideration of price in Airbnb experiences and the decisive impact of cultural-emotional elements in positive evaluations resulting from the co-creation of experiences contribute to new insights in the literature. Additionally, studies by [21,90,102,103] also identify the consistencies observed in the Turkish case and the contextual differences in question, based on their findings regarding e-WOM in the sharing economy, price sensitivity, experiential value, and repurchase intention. In particular, contrary to the general view that dissatisfied users of purchased services engage in more e-WOM Hammarberg et al. [90] this study presents an interesting finding in that the vast majority of users who purchased Airbnb experiences gave positive reviews. This situation may be related not only to the nature of the experiences, but also to the hospitality of Turkish hosts. From this perspective, the study contributes to the international literature in the context of cultural differences.
This study, which analyzed 32,666 comments, demonstrated the applicability of qualitative research in the formation of experiential value through the systematic analysis of comments using large-scale qualitative content analysis with e-WOM and MAXQDA.
It has been shown that factors such as the level of emotional satisfaction and cultural authenticity may play a more decisive role in shaping the perception of experiential value on peer-to-peer tourism platforms. The study offers many practical insights for tourism professionals and station managers. First, on digital sharing-based platforms such as Airbnb, service providers should not limit themselves to operational quality alone but should also focus on elements that highlight local culture, such as storytelling, local culture, aesthetics, local presentation, and emotional interaction. In the branding of cities, e-WOM reviews should be used more strategically to support the promotion of local hosts. Furthermore, steps should be taken to increase user satisfaction by providing training to hosts to enhance experience in design and communication skills. From this perspective, the study highlights the strategic role of experiential value and e-WOM in destination competitiveness and tourist satisfaction and offers important insights for destination managers and digital platform stakeholders.
The study revealed that experiential value on sharing economy platforms is not a process dependent on operational quality; rather, it is shaped by emotional interaction and possesses a unique quality that is deeply intertwined with local culture. Consequently, it has offered a new perspective on the multidimensional nature of tourist experiences on digital platforms and has supported experiential value theory. Additionally, this research has provided insights that could encourage local communities to participate in Airbnb experiences, increase hosts’ visibility, develop supportive training programs for digital interaction skills, and contribute to sustainable urban tourism.
6. Conclusions
In the rapidly changing tourism sector, experience-oriented consumption behavior has begun to come to the fore. The study found that people who purchase services from Airbnb value the content and emotional dimension of the experience over the functionality of the service. Among the key findings, it was determined that experiential value dimensions such as “service excellence”, “aesthetics” and “client return on investment” stand out in Airbnb experiences in Türkiye. Experiences offered in the field of guidance were the most highly rated category, and interaction rates were higher in more personalized experiences where local interaction came to the fore. The findings revealed how experiential value dimensions are reflected and how they vary according to the intensity of interaction, thereby addressing the research objective.
The study contributes to the literature by combining e-WOM and the sharing economy with tourism within a more comprehensive framework based on experiential value theory. While previous studies have mostly focused on quantitative analyses of e-WOM, this research has enabled an in-depth examination of experiential value on online platforms using a large-scale qualitative dataset. The study contributes to the literature by demonstrating that experiential value shapes cultural interaction not only in terms of economic benefits but also in terms of emotional engagement, uniqueness, and the creation of shared experiences.
In conclusion, the study revealed that experiential value in the sharing economy does not only offer economic benefits, but that experiences are produced together with emotional, cultural, and social elements. Future research could examine algorithmic visibility, the formation of experiential value in the sharing economy, and e-WOM dynamics by comparing different digital platforms. In the sharing economy, research can be conducted on the use of AI-powered systems, the competitive advantages that technological advancements could create, and the benefits and challenges for both hosts and users.
6.1. Implications, Limitations and Original Contribution
Implications for Platform-Mediated Leisure and Experience Design
In this study, tourist experiences on Airbnb, one of the peer-to-peer sharing platforms, were examined through e-WOM. The study comprehensively addresses the changing nature of experiential value criteria, offering a unique contribution to the tourism literature. Analyses conducted using extensive user evaluations obtained from different cities in Türkiye that are prominent in tourism reveal how experiential values such as service excellence and aesthetics are shaped according to the destination context.
Using a qualitative approach, the study went beyond mere numerical frequency analyses, highlighting that experiences in the examined online evaluations are an element that emerges when interactions are high and when they are co-created. This perspective offers a new framework for understanding how digital infrastructures enable interaction in the platform economy, particularly in the context of destination-based experiences and services created with cultural content.
In the sharing economy, experiences offered through direct interaction with local residents can highlight the cultural characteristics of cities. Supporting guided activities and encouraging experiences based on cultural authenticity is essential to make destination tourism more sustainable, personal, and inclusive. By highlighting the service quality and aesthetics of experiences offered on platforms such as Airbnb, hosts can increase user satisfaction and repeat visit rates for these experiences, thereby strengthening the competitive advantage of destinations.
Additionally, the online expressions and digital narratives created by tourists regarding their experiences through the sharing economy are forming a new driving force in the branding of the cities where these experiences are offered. E-WOM analyses conducted on a city-by-city basis will enable cities to make better-informed strategic decisions in their strategic tourism planning. For this reason, e-WOM is not just a simple communication tool for identifying experiential value in the sharing economy; it also plays a crucial role as a strategic component in establishing the identity and marketing of tourist destinations.
6.2. Limitations and Future Research
The categories and codes created defined the scope of the research. Since the study focuses only on Airbnb experiences in Türkiye, the generalizability of the findings is limited. Despite these limitations, it is anticipated that this study will shed light on future research aimed at determining experiential value.
The most significant limitation of the study is that it attempts to determine experiential value dimensions based solely on publicly available online reviews of Airbnb experiences across Türkiye. While the user reviews examined are overwhelmingly positive, they reflect the negative aspects of experiential values only to a limited extent. Because qualitative content analysis involves the coders’ interpretation process, the researchers’ biases may influence the interpretations despite the reliability procedures employed in the study.
Since the results of qualitative content analysis depend on the researchers’ ability to interpret the data, different researchers may draw different conclusions from similar data.
Future research should focus on comparing sharing economy-based experiences offered in different countries, analyzing negative user reviews thematically, and conducting more comprehensive research on the transformation of experiential value over time. Conducting similar analyses for platforms other than Airbnb and similar platforms could provide a comprehensive perspective on the multidimensional nature of experiential value in tourism.
Another limitation is that the study focuses solely on experiences available on the Airbnb platform and reflects the specified date range; consequently, the fact that findings may vary over time due to evolving tourist expectations on other platforms could limit the generalizability of the study. The predominance of positive reviews may also create a bias toward positive experiences. Additionally, language differences in the reviews may have influenced the coding and interpretation process related to translation.
6.3. Originality/Value
The study ranks among the most comprehensive research examining experiences offered on Airbnb, one of the leading platforms in Türkiye’s sharing economy, through qualitative content analysis within the scope of e-WOM. The study, which presents original findings at the intersection of the sharing economy and experiential value, adds valuable insights to the tourism literature. It also provides actionable insights for policymakers, developers working on sharing economy platforms, and tourism practitioners. Furthermore, it offers a framework to support managerial strategic decisions in the digitalizing tourism sector.
Author Contributions
I.M.: Data collection, analysis, and interpretation during the study design phase; writing the article draft; ensuring scientific integrity; final approval; and ethical responsibility for all aspects of the study. C.C.O.: Implementation of the study design; consultation; data analysis and interpretation; ensuring scientific integrity; final approval; and responsibility for all aspects of the study. All authors have read and agreed to the published version of the manuscript.
Funding
No funding was received from any institution or organization for this research.
Institutional Review Board Statement
Not applicable.
Informed Consent Statement
Not applicable.
Data Availability Statement
The dataset used in this study was collected from publicly available electronic word-of-mouth (e-WOM) reviews on the Airbnb platform. Processed and coded research data supporting the study’s findings are available from the corresponding authors upon academic request.
Acknowledgments
This article was derived from the master’s thesis titled “Analysis of Touristik Experiential Values in Electronic Word of Mouth: The Case of Sharing Economy” prepared by the authors. The study does not require ethics committee approval as it only involves publicly shared e-WOM reviews. The necessary permissions for the scale used in the study were obtained by contacting via email.
Conflicts of Interest
The authors declare no conflict of interest.
References
- Solano-Sánchez, M.Á.; Menor-Campos, A.; Arteaga-Sánchez, R.; López-Guzmán, T. Free walking tour tourist profile determination. Motivations, preferences and experience assessment. Tour. Recreat. Res. 2025, 51, 619–632. [Google Scholar] [CrossRef] [Scilit]
- Wang, R.; Hao, J.X. Duality of Tourists’ Value Co-Creation Behaviors in the Sharing Economy: Longitudinal Insight from Airbnb via Social Media Analytics. J. Travel Res. 2025, 65, 833–848. [Google Scholar] [CrossRef] [Scilit]
- Wang, J.; Ge, Q.; Jiang, M.; Wang, S. How destination social responsibility shapes residents’ value co-creation: The role of empowerment and trait cynicism. Tour. Manag. Perspect. 2026, 62, 101474. [Google Scholar] [CrossRef] [Scilit]
- Purnami, N.M.; Setyawan, A. Gastronomic experiences in tourism: A systematic literature review and future research directions. Int. J. Econ. Lit. 2024, 2, 3742–3757. [Google Scholar]
- Srinivasan, S.; Sherkar, A.; Jayamani, J.; Indora, A.; Mukherjee, R. Tourism Innovation and the Role of Technology in Enhancing Visitor Experiences. Educ. Adm. Theory Pract. 2024, 30, 1506–1513. [Google Scholar] [CrossRef] [Scilit]
- Baral, A.; Pandey, A.; Ariyaputhiri, S. Experiential Marketing in the Experience Economy: Insights from Kumarakom, Kerala. 2025. Available online: https://ssrn.com/abstract=5536318 (accessed on 24 January 2026).
- Bu, Y.; Parkinson, J.; Thaichon, P. Digital content marketing as a catalyst for e-WOM in food tourism. Australas. Mark. J. 2021, 29, 142–154. [Google Scholar] [CrossRef] [Scilit]
- Arıca, R.; Polat, I.; Cobanoglu, C.; Corbacı, A.; Chen, P.J.; Hsu, M.J. Value co-destruction and negative e-WOM behavior: The mediating role of tourist citizenship. Tour. Rev. 2022, 77, 1116–1134. [Google Scholar] [CrossRef] [Scilit]
- Syamsoeyadi, H.; Tjokrosaputro, M. The Role of e-WOM towards Value Co-Creation on Sharing Economy Platform in Indonesia. In Advances in Economics, Business and Management Research; Atlantis Press: Dordrecht, The Netherlands, 2022; Volume 216, pp. 499–504. [Google Scholar]
- Ye, Q.; Law, R.; Gu, B.; Chen, W. The influence of user-generated content on traveler behavior: An empirical investigation on the effects of e-word-of-mouth to hotel online bookings. Comput. Hum. Behav. 2011, 27, 634–639. [Google Scholar] [CrossRef] [Scilit]
- Chakraborty, S.; Chakravorty, T.; Bhatt, V. IoT and AI driven sustainable practices in airlines as enabler of passenger confidence, satisfaction and positive WOM: AI and IoT driven sustainable practice in airline. In Proceedings of the International Conference on Artificial Intelligence and Smart Systems, ICAIS 2021, Pichanur, India, 25–27 March 2021; Institute of Electrical and Electronics Engineers Inc.: Piscataway, NJ, USA, 2021; pp. 1421–1425. [Google Scholar] [CrossRef] [Scilit]
- Phillips, W.J.; Wolfe, K.; Hodur, N.; Leistritz, F.L. Tourist Word of Mouth and Revisit Intentions to Rural Tourism Destinations: A Case of North Dakota, USA. Int. J. Tour. Res. 2013, 15, 93–104. [Google Scholar] [CrossRef] [Scilit]
- Rahimi, S.; Khatooni, M. Saturation in qualitative research: An evolutionary concept analysis. Int. J. Nurs. Stud. Adv. 2024, 6, 100174. [Google Scholar] [CrossRef] [Scilit]
- Creswell, J.W. Research Design: Qualitative, Quantitative, and Mixed Methods Approach; Sage Publications Ltd.: London, UK; Oxford University Press: Oxford, UK, 2003. [Google Scholar]
- Akarsu, T.N.; Foroudi, P.; Melewar, T.C. What makes Airbnb likeable? Exploring the nexus between service attractiveness, country image, perceived authenticity and experience from a social exchange theory perspective within an emerging economy context. Int. J. Hosp. Manag. 2020, 91, 102635. [Google Scholar] [CrossRef] [Scilit]
- Uçar, Ö.; Tozoğlu, B. Analyzing Airbnb Online Customer Reviews: The Case of Antalya. Turk Tour. Res. J. 2022, 6, 713–727. [Google Scholar] [CrossRef] [Scilit]
- Demirdelen Alrawadieh, D.; Cifci, İ. What Are Tour Guides Most Praised for? A Sharing Economy Perspective. In Advances in Global Services and Retail Management; USF M3 Publishing: Sarasota, FL, USA, 2021. [Google Scholar]
- Nabillah, R.; Kusumawardhani, A. The Influence of Reputation, Perceived Value, and E-Wom Toward Purchase Decision Through Trust of Airbnb. Dıponegoro J. Manag. 2023, 12, 2337–3792. [Google Scholar]
- Hall, C.M.; Prayag, G.; Safonov, A.; Coles, T.; Gössling, S.; Koupaei, S.N. Airbnb and the sharing economy. Curr. Issues Tour. 2022, 25, 3057–3067. [Google Scholar] [CrossRef] [Scilit]
- Guttentag, D. Airbnb: Disruptive innovation and the rise of an informal tourism accommodation sector. Curr. Issues Tour. 2015, 18, 1192–1217. [Google Scholar] [CrossRef] [Scilit]
- Martin, C.J. The sharing economy: A pathway to sustainability or a nightmarish form of neoliberal capitalism? Ecol. Econ. 2016, 121, 149–159. [Google Scholar] [CrossRef] [Scilit]
- Sun, Y.; Shao, Y.; Chan, E.H.W. Co-visitation network in tourism-driven peri-urban area based on social media analytics: A case study in Shenzhen, China. Landsc. Urban Plan. 2020, 204, 103934. [Google Scholar] [CrossRef] [Scilit]
- Shang, K.; Fan, D.X.F.; Buhalis, D. Tour guides’ self-efficacy and resilience capability building through sharing economy platforms. Int. J. Contemp. Hosp. Manag. 2023, 35, 562–1583. [Google Scholar] [CrossRef] [Scilit]
- Stavrianea, A.; Kamenidou, I. Complying with digital transformation in online booking through experiential values of generation Z. Eur. J. Tour. Res. 2022, 30, 3003. [Google Scholar] [CrossRef] [Scilit]
- Nieves-Pavón, S.; López-Mosquera, N.; Jiménez-Naranjo, H. The role emotions play in loyalty and WOM intention in a Smart Tourism Destination Management. Cities 2024, 145, 104681. [Google Scholar] [CrossRef] [Scilit]
- Ketter, E. Eating with EatWith: Analyzing tourism-sharing economy consumers. Curr. Issues Tour. 2019, 22, 1062–1075. [Google Scholar] [CrossRef] [Scilit]
- Liu, Y.; Whitman, M.J. Word of mouth for movies: Its dynamics and impact on box office revenue. J. Mark. 2006, 70, 74–89. [Google Scholar] [CrossRef] [Scilit]
- Sun, T.; Youn, S.; Wu, G.; Kuntaraporn, M. Online word-of-mouth (or mouse): An exploration of its antecedents and consequences. J. Comput. Mediat. Commun. 2006, 11, 1104–1127. [Google Scholar] [CrossRef] [Scilit]
- Melián-González, S.; Bulchand-Gidumal, J.; López-Valcárcel, B.G. Online Customer Reviews of Hotels: As Participation Increases, Better Evaluation Is Obtained. Cornell Hosp. Q. 2013, 54, 274–283. [Google Scholar] [CrossRef] [Scilit]
- Litvin, S.W.; Goldsmith, R.E.; Pan, B. Electronic word-of-mouth in hospitality and tourism management. Tour. Manag. 2008, 29, 458–468. [Google Scholar] [CrossRef] [Scilit]
- Sotiriadis, M.; Nduna, L.T. Digital Platforms for Collaborative Gastronomy; Routledge: Abingdon, UK, 2019. [Google Scholar]
- Trusov, M.; Bucklin, R.E.; Pauwels, K.H. Effects of Word-of-Mouth Versus Traditional Marketing: Findings from an Internet Social Networking Site. J. Mark. 2008, 73, 90–102. [Google Scholar] [CrossRef] [Scilit]
- Velázquez, B.M.; Blasco, M.F.; Saura, I.G. La adoption de la TIC en hoteles y el boca-oreja electrónico. Acad. Rev. Latinoam. De Adm. 2015, 28, 227–250. [Google Scholar] [CrossRef] [Scilit]
- Sparks, B.A.; Browning, V. The impact of online reviews on hotel booking intentions and perception of trust. Tour. Manag. 2011, 32, 1310–1323. [Google Scholar] [CrossRef] [Scilit]
- López, M.; Sicilia, M. Determinants of E-WOM influence: The role of consumers’ internet experience. J. Theor. Appl. Electron. Commer. Res. 2014, 9, 28–43. [Google Scholar] [CrossRef] [Scilit]
- Jalilvand, M.R.; Ebrahimi, A.; Samiei, N. Electronic Word of Mouth Effects on Tourists’ Attitudes Toward Islamic Destinations and Travel Intention: An Empirical Study in Iran. Procedia Soc. Behav. Sci. 2013, 81, 484–489. [Google Scholar] [CrossRef] [Scilit]
- Vermeulen, I.E.; Seegers, D. Tried and tested: The impact of online hotel reviews on consumer consideration. Tour. Manag. 2009, 30, 123–127. [Google Scholar] [CrossRef] [Scilit]
- Cheng, M.; Jin, X. What do Airbnb users care about? An analysis of online review comments. Int. J. Hosp. Manag. 2019, 76, 58–70. [Google Scholar] [CrossRef] [Scilit]
- Sugathan, P.; Ranjan, K.R. Co-creating the tourism experience. J. Bus. Res. 2019, 100, 207–217. [Google Scholar] [CrossRef] [Scilit]
- Gosal, J.; Andajani, E.; Rahayu, S. The Effect of e-WOM on Travel Intention, Travel Decision, City Image, and Attitude to Visit a Tourism City. In Advances in Economics, Business and Management Research; Atlantis Press: Dordrecht, The Netherlands, 2020; Volume 115, pp. 261–265. [Google Scholar]
- Crick, A.P. Internal marketing of attitudes in Caribbean tourism. Int. J. Contemp. Hosp. Manag. 2003, 15, 161–166. [Google Scholar] [CrossRef] [Scilit]
- Bardhi, F.; Eckhardt, G.M. Access-Based Consumption: The Case of Car Sharing. J. Consum. Res. 2012, 39, 881–898. [Google Scholar] [CrossRef] [Scilit] [PubMed]
- Adamiak, C. Current state and development of Airbnb accommodation offer in 167 countries. Curr. Issues Tour. 2022, 25, 3131–3149. [Google Scholar] [CrossRef] [Scilit]
- Hamari, J.; Sjöklint, M.; Ukkonen, A. The sharing economy: Why people participate in collaborative consumption. J. Assoc. Inf. Sci. Technol. 2016, 67, 2047–2059. [Google Scholar] [CrossRef] [Scilit]
- Atsız, O. The family experiences in the daily local-guided tours: Evidence from the sharing economy platform (Withlocals). J. Vacat. Mark. 2022, 28, 387–405. [Google Scholar] [CrossRef] [Scilit]
- Fan, D.X.; Hsu, C.H.; Lin, B. Tourists’ experiential value co-creation through online social contacts: Customer-dominant logic perspective. J. Bus. Res. 2020, 108, 163–173. [Google Scholar] [CrossRef] [Scilit]
- Holbrook, M.B. (Ed.) Introduction to consumer value. In Consumer Value: A Framework for Analysis and Research; Routledge Interpretive Marketing Research Series; Routledge: London, UK; New York, NY, USA, 1999. [Google Scholar]
- Schmitt, B. Experiential Marketing. J. Mark. Manag. 1999, 15, 53–67. [Google Scholar] [CrossRef] [Scilit]
- Pine, B.J.; Gilmore, J.H. The Experience Economy: Work Is Theatre and Every Business a Stage; Harvard Business School Press: Boston, MA, USA, 1999. [Google Scholar]
- Mathwick, C.; Malhotra, N.; Rigdon, E. Experiential value: Conceptualization, measurement and application in the catalog and Internet shopping environment. J. Retail. 2001, 77, 39–56. [Google Scholar] [CrossRef] [Scilit]
- Santos, G.; Mota, V.F.S.; Benevenuto, F.; Silva, T.H. Neutrality may matter sentiment analysis in reviews of Airbnb, Booking, and Couchsurfing in Brazil and USA. Soc. Netw. Anal. Min. 2020, 10, 45. [Google Scholar] [CrossRef] [Scilit]
- Do, T.T.M.D.; Pereira, L.N. Understanding Vietnamese consumers’ perception and word-of-mouth intentions towards Airbnb. J. Hosp. Tour. Technol. 2023, 14, 83–101. [Google Scholar] [CrossRef] [Scilit]
- Airbnb. Airbnb Türkiye. Available online: https://www.airbnb.com.tr/ (accessed on 8 October 2025).
- Cenni, I.; Vásquez, C. Reflection: Airbnb’s food-related ‘online experiences’: A recipe for connection and escape. Food Foodways 2020, 29, 97–107. [Google Scholar] [CrossRef] [Scilit]
- Johnson, A.-G.; Neuhofer, B. Airbnb—An exploration of value co-creation experiences in Jamaica. Int. J. Contemp. Hosp. Manag. 2017, 29, 2361–2376. [Google Scholar] [CrossRef] [Scilit]
- Ye, S.; Ying, T.; Zhou, L.; Wang, T. Enhancing customer trust in peer-to-peer accommodation: A ‘soft’ strategy via social presence. Int. J. Hosp. Manag. 2019, 79, 1–10. [Google Scholar] [CrossRef] [Scilit]
- Palgan, Y.V.; Zvolska, L.; Mont, O. Sustainability framings of accommodation sharing. Environ. Innov. Soc. Transit. 2017, 23, 70–83. [Google Scholar] [CrossRef] [Scilit]
- Yang, F.X. Effects of Restaurant Satisfaction and Knowledge Sharing Motivation on e-WOM Intentions: The Moderating Role of Technology Acceptance Factors. J. Hosp. Tour. Res. 2017, 41, 93–127. [Google Scholar] [CrossRef] [Scilit]
- Kim, K.; Baek, C.; Lee, J.D. Lee Creative destruction of the sharing economy in action: The case of Uber. Transp. Res. Part A Policy Pract. 2018, 110, 118–127. [Google Scholar] [CrossRef] [Scilit]
- Michelini, L.; Principato, L.; Iasevoli, G. Understanding Food Sharing Models to Tackle Sustainability Challenges. Ecol. Econ. 2018, 145, 205–217. [Google Scholar] [CrossRef] [Scilit]
- Geissinger, A.; Laurell, C.; Öberg, C.; Sandström, C. How sustainable is the sharing economy? On the sustainability connotations of sharing economy platforms. J. Clean. Prod. 2019, 206, 419–429. [Google Scholar] [CrossRef] [Scilit]
- Curtis, S.K.; Mont, O. Sharing economy business models for sustainability. J. Clean. Prod. 2020, 266, 121519. [Google Scholar] [CrossRef] [Scilit]
- Lee, Z.W.Y.; Chan, T.K.; Balaji, M.; Chong, A.Y.-L. Why people participate in the sharing economy: An empirical investigation of Uber. Internet Res. 2018, 28, 829–850. [Google Scholar] [CrossRef] [Scilit]
- Li, C.-Y.; Tsai, M.-C. What makes guests trust Airbnb? Consumer trust formation and its impact on continuance intention in the sharing economy. J. Hosp. Tour. Manag. 2022, 50, 44–54. [Google Scholar] [CrossRef] [Scilit]
- Atsız, O.; Cifci, I.; Law, R. Understanding food experience in sharing-economy platforms: Insights from Eatwith and Withlocals. J. Tour. Cult. Change 2021, 20, 131–156. [Google Scholar] [CrossRef] [Scilit]
- Heinrichs, H. Sharing economy: A potential new pathway to sustainability. GAIA Ecol. Perspect. Sci. Soc. 2013, 22, 228–231. [Google Scholar] [CrossRef] [Scilit]
- Öberg, C. Sharing economy models and sustainability: Towards a typology. J. Clean. Prod. 2024, 447, 141636. [Google Scholar] [CrossRef] [Scilit]
- Barnes, S.J.; Mattsson, J.; Sørensen, F.; Friis Jensen, J. The Mediating Effect of Experiential Value on Tourist Outcomes from Encounter-Based Experiences. J. Travel Res. 2020, 59, 367–380. [Google Scholar] [CrossRef] [Scilit]
- Özen, İ.A. A Study to Determine the Effects of the Hot Air Balloon Experience in the Cappadocia Region on Behavioral Intentions. Product. J. 2019, 1, 165–198. Available online: https://izlik.org/JA29JW83RB (accessed on 12 March 2025).
- Amoah, F.; Radder, L.; van Eyk, M. Perceived experience value, satisfaction and behavioral intentions: A guesthouse experience. Afr. J. Econ. Manag. Stud. 2016, 7, 419–433. [Google Scholar] [CrossRef] [Scilit]
- Lin, K.-M. An Examination of the Relationship Between Experiential Marketing Strategy and Guests Leisure Behavior in Taiwan Hot-Spring Hotels. Doctoral Dissertation, United States Sports Academy, Daphne, AL, USA, 2006. [Google Scholar]
- Han, S.; Yoon, J.-H.; Kwon, J. Impact of experiential value of augmented reality: The context of heritage tourism. Sustainability 2021, 13, 4147. [Google Scholar] [CrossRef] [Scilit]
- Celtek, E. An Evaluation of Experiential Marketing Elements from the Perspective of Hotels: An Application in 4- and 5-Star Hotel Establishments in Türkiye; Anadolu University Institute of Social Sciences: Eskisehir, Turkey, 2010. [Google Scholar]
- Celik, A. Experiential Marketing in Tourism: An Application for Tour Operators. Master’s Thesis, Dokuz Eylül University, İzmir, Türkiye, 2013. Available online: https://www.proquest.com/dissertations-theses/turizmde-deneyimsel-pazarlama-tur-operatörlerine/docview/2969147823/se-2 (accessed on 12 March 2025).
- Cavusoglu, S. Determining the Effect of Customer Experience, Experiential Value, and Attitudes Toward Green Behaviors on Repurchase Intent: The Moderating and Mediating Role of Green Image. Doctoral Dissertation, Hasan Kalyoncu University, Gaziantep, Türkiye, 2019. [Google Scholar]
- Chen, Y.-K.; Hsieh, T. A study of the relationship among experiential marketing, experiential value and customer satisfaction. J. Stat. Manag. Syst. 2010, 13, 1283–1303. [Google Scholar] [CrossRef] [Scilit]
- Buzlukcu, C.; Oflaz, M.; Köroglu, A.; Avcıkurt, C. An Examination of the Relationship Between the Perceived Experiential Value, Satisfaction Levels, and Behavioral Intentions of Living Museum Visitors. Eurasian Acad. Sci. J. Soc. Sci. 2017, 109–125. [Google Scholar]
- Ali, F.; Ryu, K.; Hussain, K. Influence of Experiences on Memories, Satisfaction and Behavioral Intentions: A Study of Creative Tourism. J. Travel Tour. Mark. 2016, 33, 85–100. [Google Scholar] [CrossRef] [Scilit]
- Wu, C.H.-J.; Liang, R.-D. Effect of experiential value on customer satisfaction with service encounters in luxury-hotel restaurants. Int. J. Hosp. Manag. 2009, 28, 586–593. [Google Scholar] [CrossRef] [Scilit]
- Zhou, F.; Lai, K.K. Marketing intelligence on customer experiential values: A structural equation model approach. In Proceedings of the 2009 International Conference on Business Intelligence and Financial Engineering, BIFE 2009, Beijing, China, 24–26 July 2009; Institute of Electrical and Electronics Engineers (IEEE): Piscataway, NJ, USA, 2009; pp. 634–638. [Google Scholar] [CrossRef] [Scilit]
- Martín, J.C.; Román, C.; Guzmán, T.L.-G.; Moral-Cuadra, S. A fuzzy segmentation study of gastronomical experience. Int. J. Gastron. Food Sci. 2020, 22, 100248. [Google Scholar] [CrossRef] [Scilit]
- Chang, J.; Morrison, A.M.; Lin, S.H.-H.; Ho, C.-Y. Ho How do food consumption motivations and emotions affect the experiential values and well-being of foodies? Br. Food J. 2021, 123, 627–648. [Google Scholar] [CrossRef] [Scilit]
- Aditya Nugroho, F.; Restu Ariyanto Putri, A. The Overview of Culinary Tourism in Yogyakarta City from the Perspective of Experiential Value. Int. J. Recent Trends Bus. Tour. 2023, 7, 18. [Google Scholar]
- Tsai, C.T.S.; Wang, Y.C. Experiential value in branding food tourism. J. Destin. Mark. Manag. 2017, 6, 56–65. [Google Scholar] [CrossRef] [Scilit]
- Chang, J.; Okumus, B.; Li, Z.-W.; Lin, H.-H. What serves as the best bridge in food consumption: Experiential value or place attachment? Asia Pac. J. Tour. Res. 2021, 26, 1302–1317. [Google Scholar] [CrossRef] [Scilit]
- Chang, A.Y.-P. Effects of tourism image and experiential value on revisit intention in tourism industry. Acta Oecon. 2014, 64, 289–301. [Google Scholar] [CrossRef] [Scilit]
- Chien, M.C. An empirical study on the effect of attractiveness of ecotourism destination on experiential value and revisit intention. Appl. Ecol. Environ. Res. 2017, 15, 43–53. [Google Scholar] [CrossRef] [Scilit]
- Lee, W.; Sung, H.; Suh, E.; Zhao, J. The effects of festival attendees’ experiential values and satisfaction on re-visit intention to the destination: The case of a food and wine festival. Int. J. Contemp. Hosp. Manag. 2017, 29, 1005–1027. [Google Scholar] [CrossRef] [Scilit]
- Gelter, J.; Fuchs, M.; Lexhagen, M. Making sense of smart tourism destinations: A qualitative text analysis from Sweden. J. Destin. Mark. Manag. 2022, 23, 100690. [Google Scholar] [CrossRef] [Scilit]
- Hammarberg, K.; Kirkman, M.; de Lacey, S. Qualitative Research Methods: When to Use Them and How to Judge Them; Oxford University Press: Oxford, UK, 2016. [Google Scholar] [CrossRef] [Scilit]
- Graneheim, U.H.; Lundman, B. Qualitative content analysis in nursing research: Concepts, procedures and measures to achieve trustworthiness. Nurse Educ. Today 2004, 24, 105–112. [Google Scholar] [CrossRef] [Scilit]
- Elo, S.; Kyngäs, H. The qualitative content analysis process. J. Adv. Nurs. 2007, 62, 107–115. [Google Scholar] [CrossRef] [Scilit]
- Whalen, E.A. Understanding a shifting methodology: A content analysis of the use of netnography in hospitality and tourism research. Int. J. Contemp. Hosp. Manag. 2018, 30, 3423–3441. [Google Scholar] [CrossRef] [Scilit]
- Rädiker, S.; Kuckartz, U. Focused Analysis of Qualitative Interviews with MAXQDA; MAXQDA Press: Berlin, Germany, 2019. [Google Scholar]
- Oliveira, M.; Bitencourt, C.C.; dos Santos, A.C.M.Z.; Teixeira, E.K. Thematic Content Analysis: Is There a Difference Between the Support Provided by the MAXQDA and NVivo Software Packages. Rev. Adm. UFSM 2015, 9, 72–82. [Google Scholar] [CrossRef] [Scilit]
- Davies, K. Content Analysis of Research Articles in Information Systems (LIS) Journals. Libr. Inf. Res. 2012, 36, 16–28. [Google Scholar] [CrossRef] [Scilit]
- Almalki, S. Integrating Quantitative and Qualitative Data in Mixed Methods Research—Challenges and Benefits. J. Educ. Learn. 2016, 5, 288. [Google Scholar] [CrossRef] [Scilit]
- Hernández-Méndez, J.; Muñoz-Leiva, F.; Sánchez-Fernández, J. The influence of e-word-of-mouth on travel decision-making: Consumer profiles. Curr. Issues Tour. 2015, 18, 1001–1021. [Google Scholar] [CrossRef] [Scilit]
- Sevilmis, A.; Yıldız, Ö. An Approach for Being Able to Use the Options of Calculating Inter-coder Reliability Manually and Through Software in Qualitative Research of Education and Training in Sports. Int. J. Progress. Educ. 2021, 17, 369–384. [Google Scholar] [CrossRef] [Scilit]
- Chen, H.; Rahman, I. Cultural tourism: An analysis of engagement, cultural contact, memorable tourism experience and destination loyalty. Tour. Manag. Perspect. 2018, 26, 153–163. [Google Scholar] [CrossRef] [Scilit]
- Chevalier, J.A.; Mayzlin, D. The Effect of Word of Mouth on Sales: Online Book Reviews. J. Mark. Res. 2006, 43, 345–354. [Google Scholar] [CrossRef] [Scilit]
- Quan, L.; Han, H.; Ariza-Montes, A.; Ryu, H.B.; Yu, J. Emerging nature café: Boosting customer quality of life, emotional well-being, and positive approach behavior. Acta Psychol. 2025, 254, 104845. [Google Scholar] [CrossRef] [Scilit] [PubMed]
- Liang, L.J.; Choi, H.C.; Joppe, M. Understanding repurchase intention of Airbnb consumers: Perceived authenticity, electronic word-of-mouth, and price sensitivity. J. Travel Tour. Mark. 2018, 35, 73–89. [Google Scholar] [CrossRef] [Scilit]

Disclaimer/Publisher’s Note: The statements, opinions and data contained in all publications are solely those of the individual author(s) and contributor(s) and not of MDPI and/or the editor(s). MDPI and/or the editor(s) disclaim responsibility for any injury to people or property resulting from any ideas, methods, instructions or products referred to in the content. |
© 2026 by the authors. Licensee MDPI, Basel, Switzerland. This article is an open access article distributed under the terms and conditions of the Creative Commons Attribution (CC BY) license.